Proceeding Paper

On the Evolution of Cyclonic and Anticyclonic Tornadoes in a Supercell in Kansas †

1
School of Meteorology, University of Oklahoma, Norman, OK 73072, USA
2
U.S. Air Force, Washington, DC 20330, USA
3
NOAA/OAR/National Severe Storms Laboratory, Norman, OK 73072, USA
*
Author to whom correspondence should be addressed.
Presented at the 17th International Conference on Meteorology, Climatology, and Atmospheric Physics—COMECAP 2025, Nicosia, Cyprus, 29 September–1 October 2025.
Environ. Earth Sci. Proc. 2025, 35(1), 19; https://doi.org/10.3390/eesp2025035019
Published: 11 September 2025

Abstract

The evolution of a tornadic supercell in Kansas on 24 May 2021 is documented from an analysis of data from the ground-based mobile RaXPol (Rapid-scan, X-band, Polarimetric) radar. A cyclonic tornado evolved from a single-vortex into a multi-vortex tornado. The formation and evolution of an anticyclonic tornado, which passed directly over the radar, is also documented, in addition to an anticyclonic, satellite vortex that moved along or just outside the outer edge of the cyclonic tornado. This study is noteworthy because there were both extensive radar and visual observations of the evolution of the tornadoes at close range.

1. Introduction and Observational Approach

Studies of tornado formation and evolution based on data from mobile Doppler radars have been used for decades to increase our understanding of the aforementioned subject [1]. This paper adds to our knowledge, especially owing to the relatively short update times and coincident visual information.
On 24 May 2021 a cyclonic tornado formed in a supercell in and near Selden, KS. The focus of this paper is the (a) documentation of the transition of the tornado from a narrow vortex to a broad, multi-vortex and (b) documentation of strong anticyclonic vortices within this cyclonically rotating supercell. Hypotheses will be presented to explain these observations.
The main tool used in this study is a truck-mounted X-band, polarimetric Doppler radar, RaXPol [2]. The radar can scan as rapidly as 180° s−1 and yet collect enough samples through frequency hopping to yield data. Volumetric updates from 0 to 18° elevation angle were obtained every ~20 s at 2° increments, oversampled every 30 m, with a pulse length of 150 m.

2. Results

2.1. Transition from a Narrow, Single-Vortex to a Broad, Multiple-Vortex Tornado

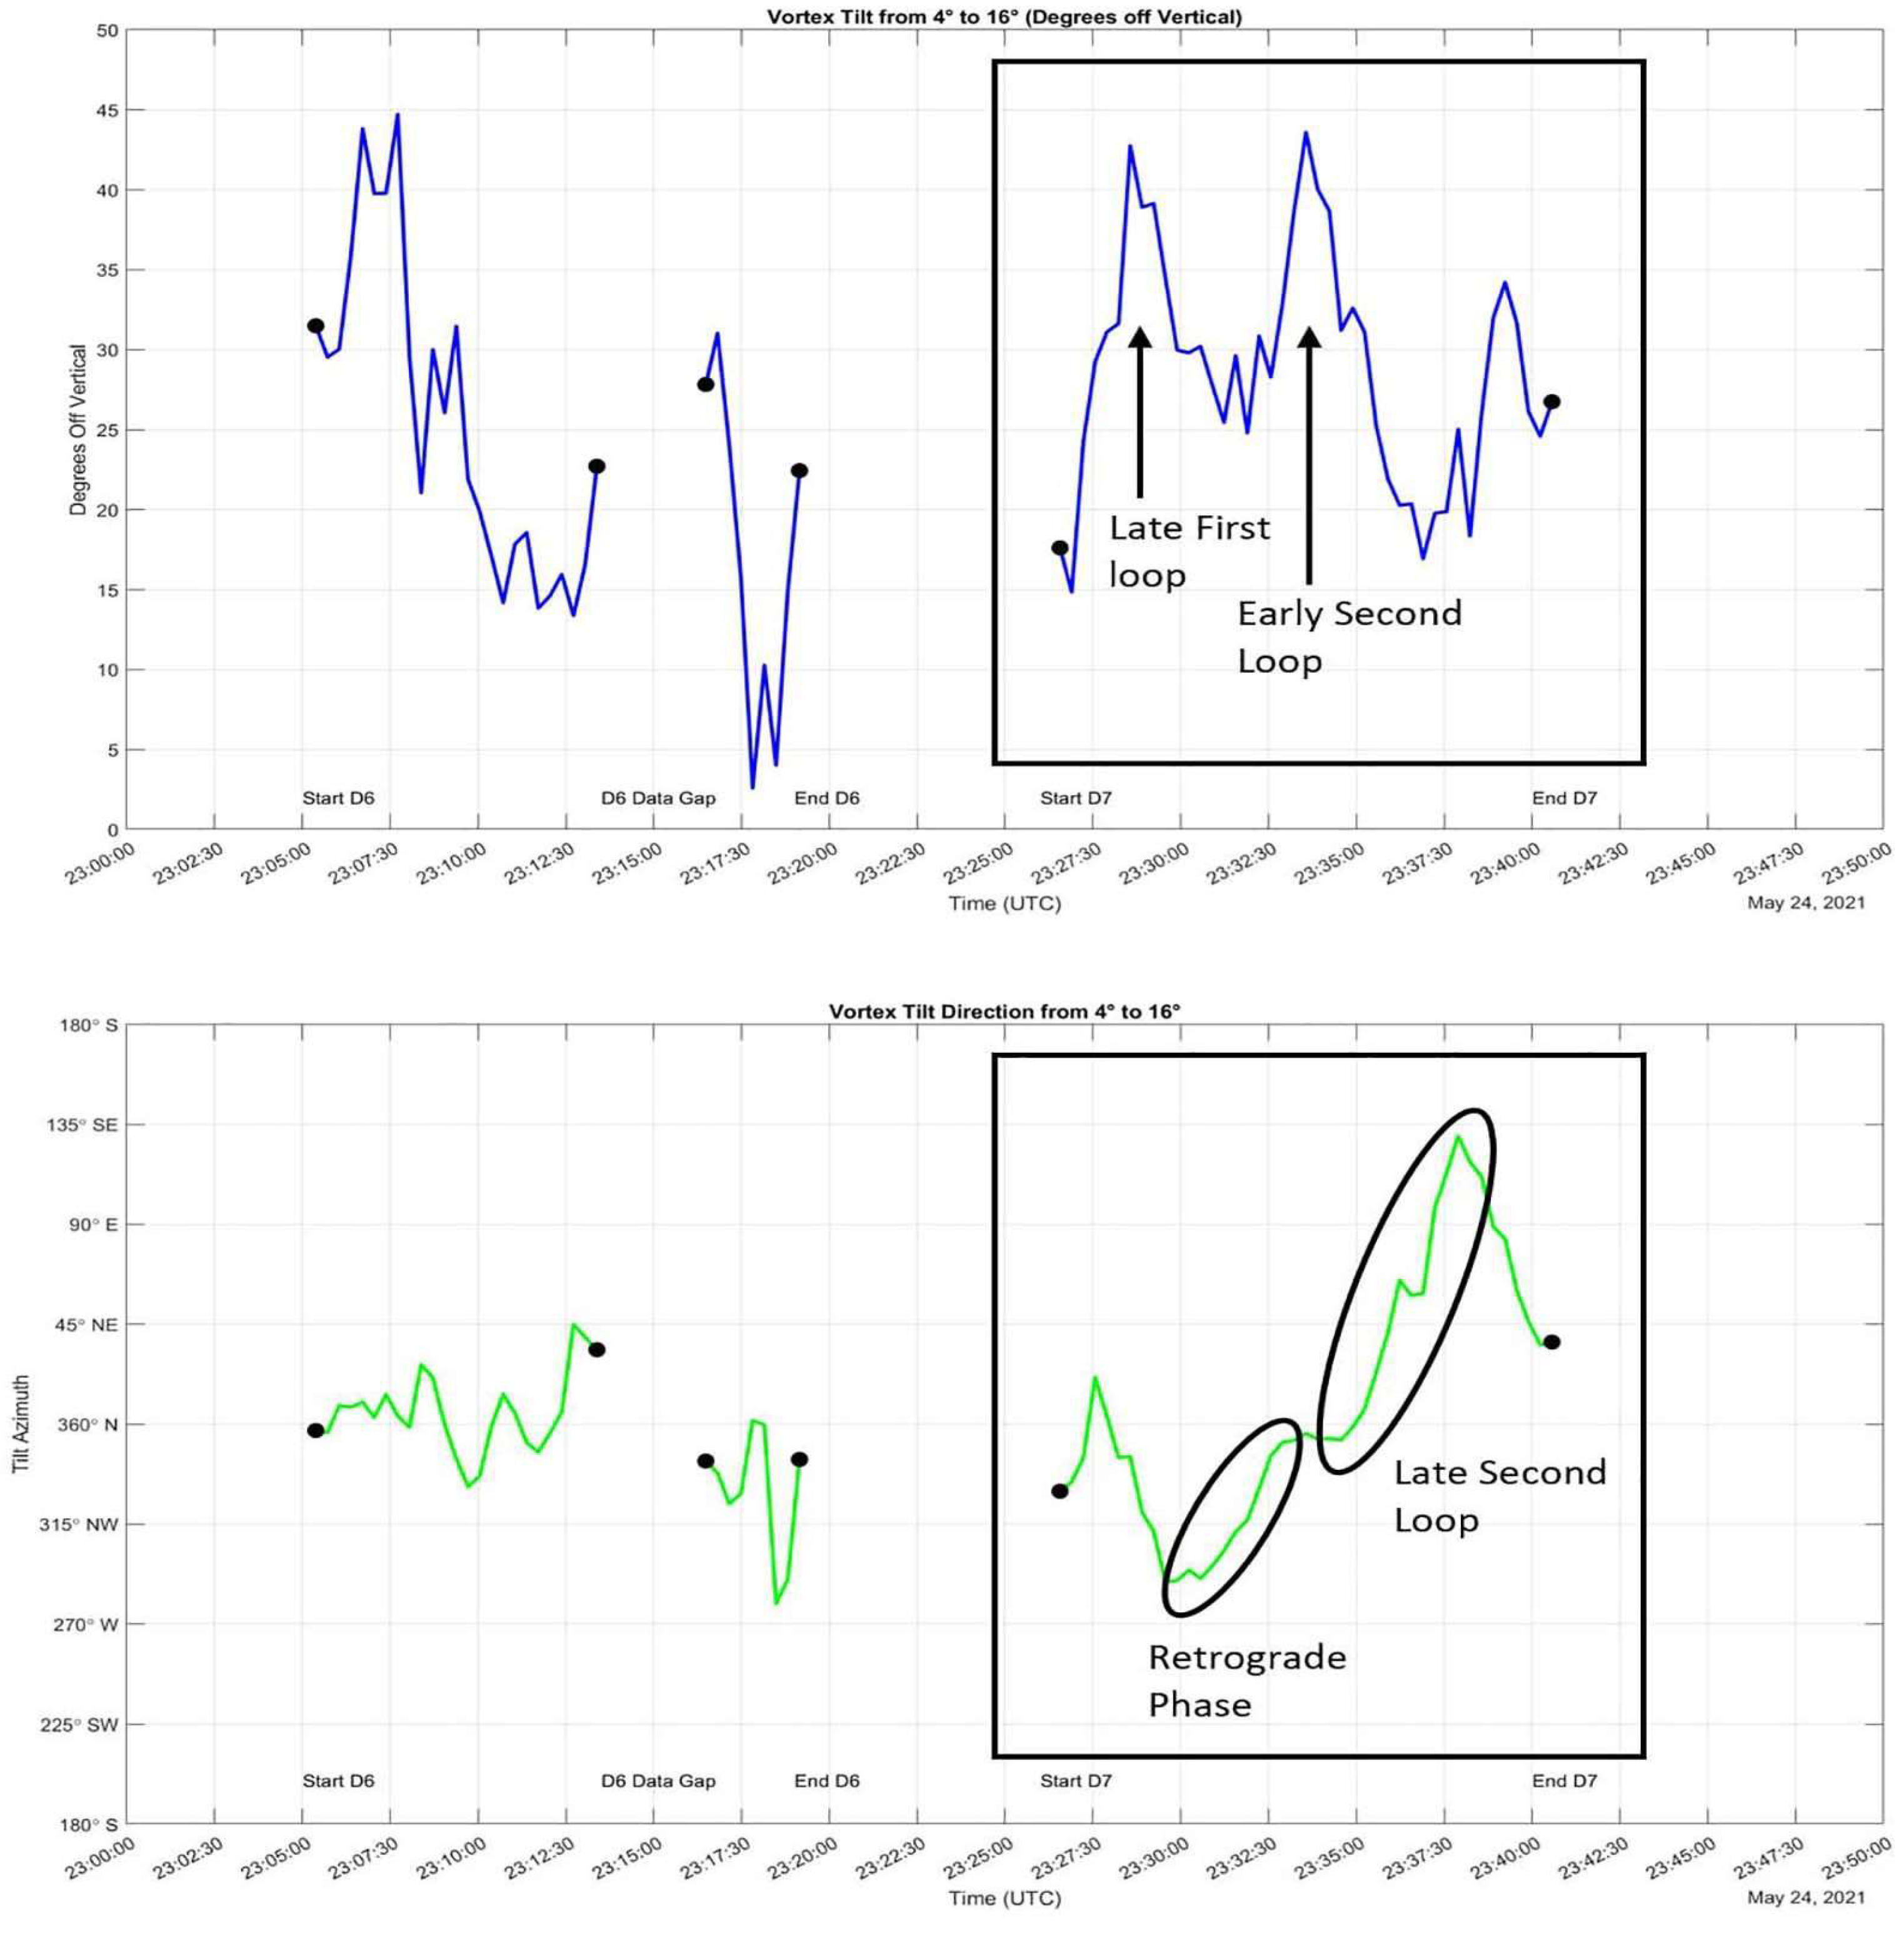
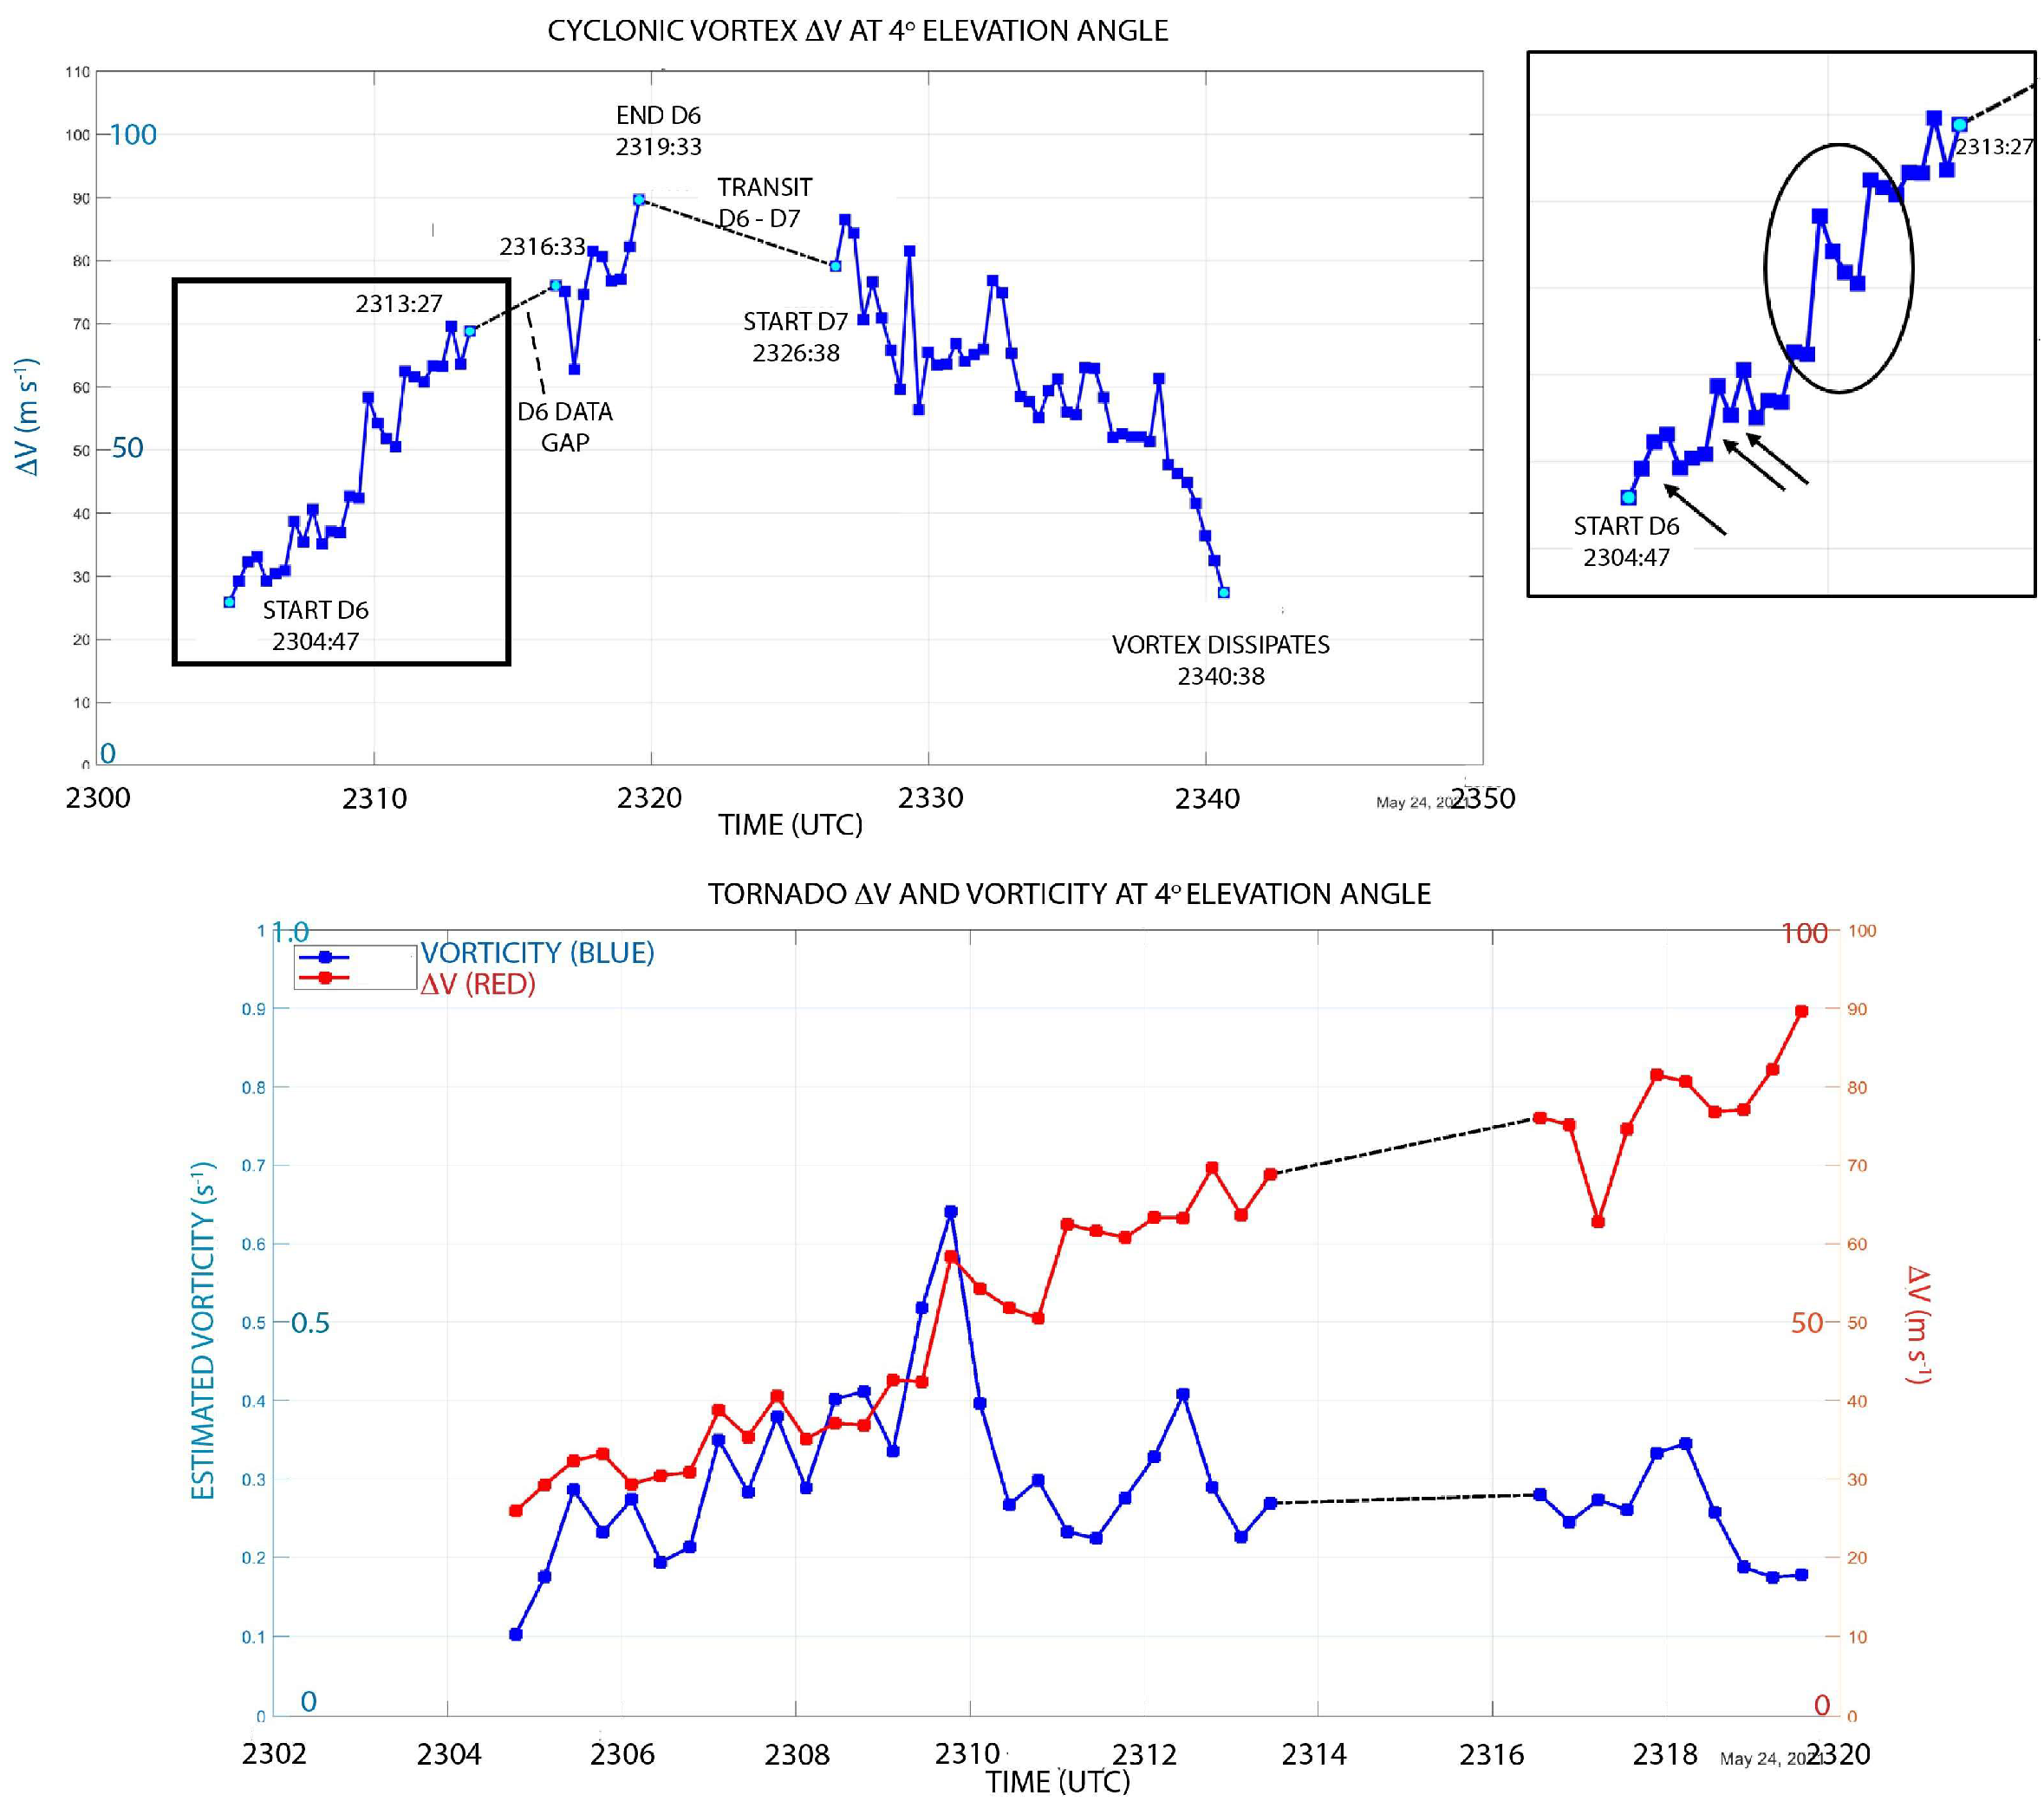
The main cyclonic tornado deviated to the right beginning around 2310:40 UTC (Figure 1). Just prior to this time, the tornadic vortex (shear) signature (TVS) had leaned to the N or N-NE, but its tilt dropped sharply from as much as 45° down to as little as 2.5°, while the direction of its tilt backed to the NW to W (Figure 2). At this time the vertical vorticity of the tornado vortex was at its maximum intensity, while DV continued to increase, but the vorticity suddenly decreased and remained nearly constant (Figure 3), owing to a sudden widening of the vortex (from both visual observations and radar measurements, not shown).
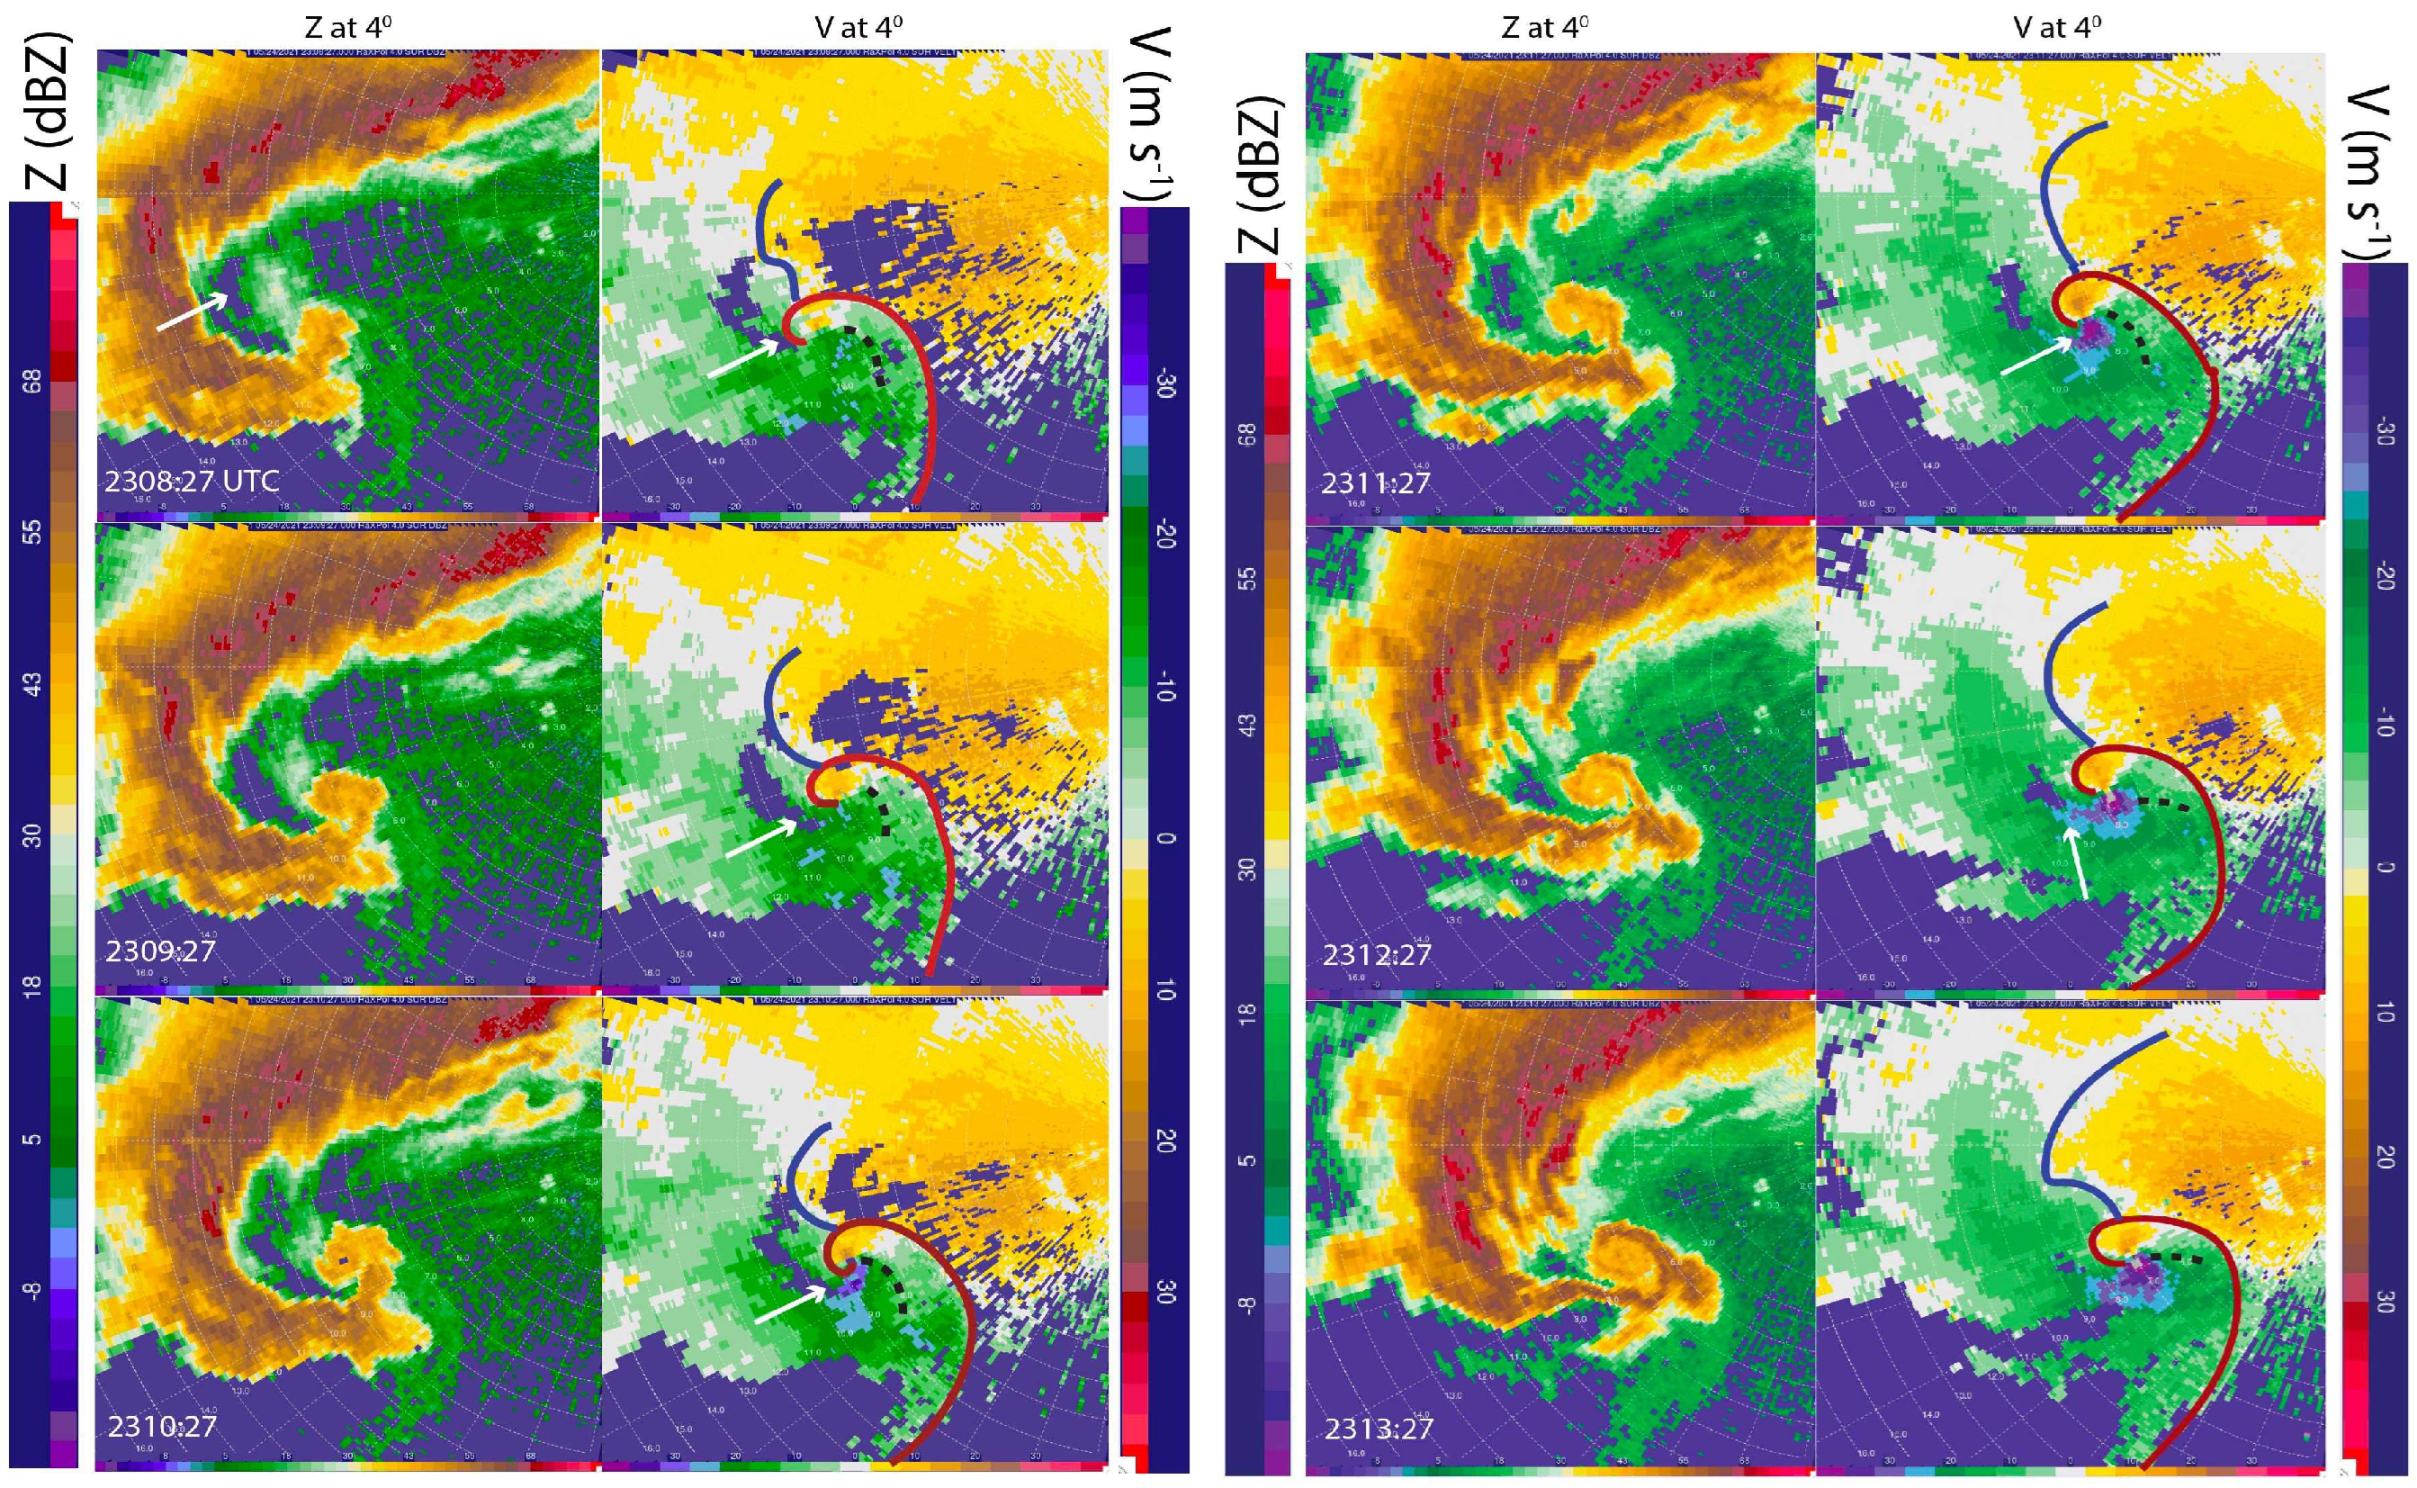
The aforementioned sequence of events is consistent with a transition from a narrow, one-cell vortex to a broad, two-cell vortex, as in laboratory experiments and idealized numerical simulations [3]. During this transition, evidence was seen of a downdraft (clear air–weak reflectivity, and Doppler velocity becoming less negative with increasing distance from the radar, indicative of low-level divergence) sweeping cyclonically around the TVS (Figure 4).
After the transition, evidence of the downdraft decreases, as the radar echo intensity increased and the one-dimensional divergence signature disappeared. There is therefore circumstantial evidence that the strong downdraft was either a trigger of the transition or a consequence of it.

2.2. Anticyclonic Tornadoes/Strong Anticyclonic Vortices

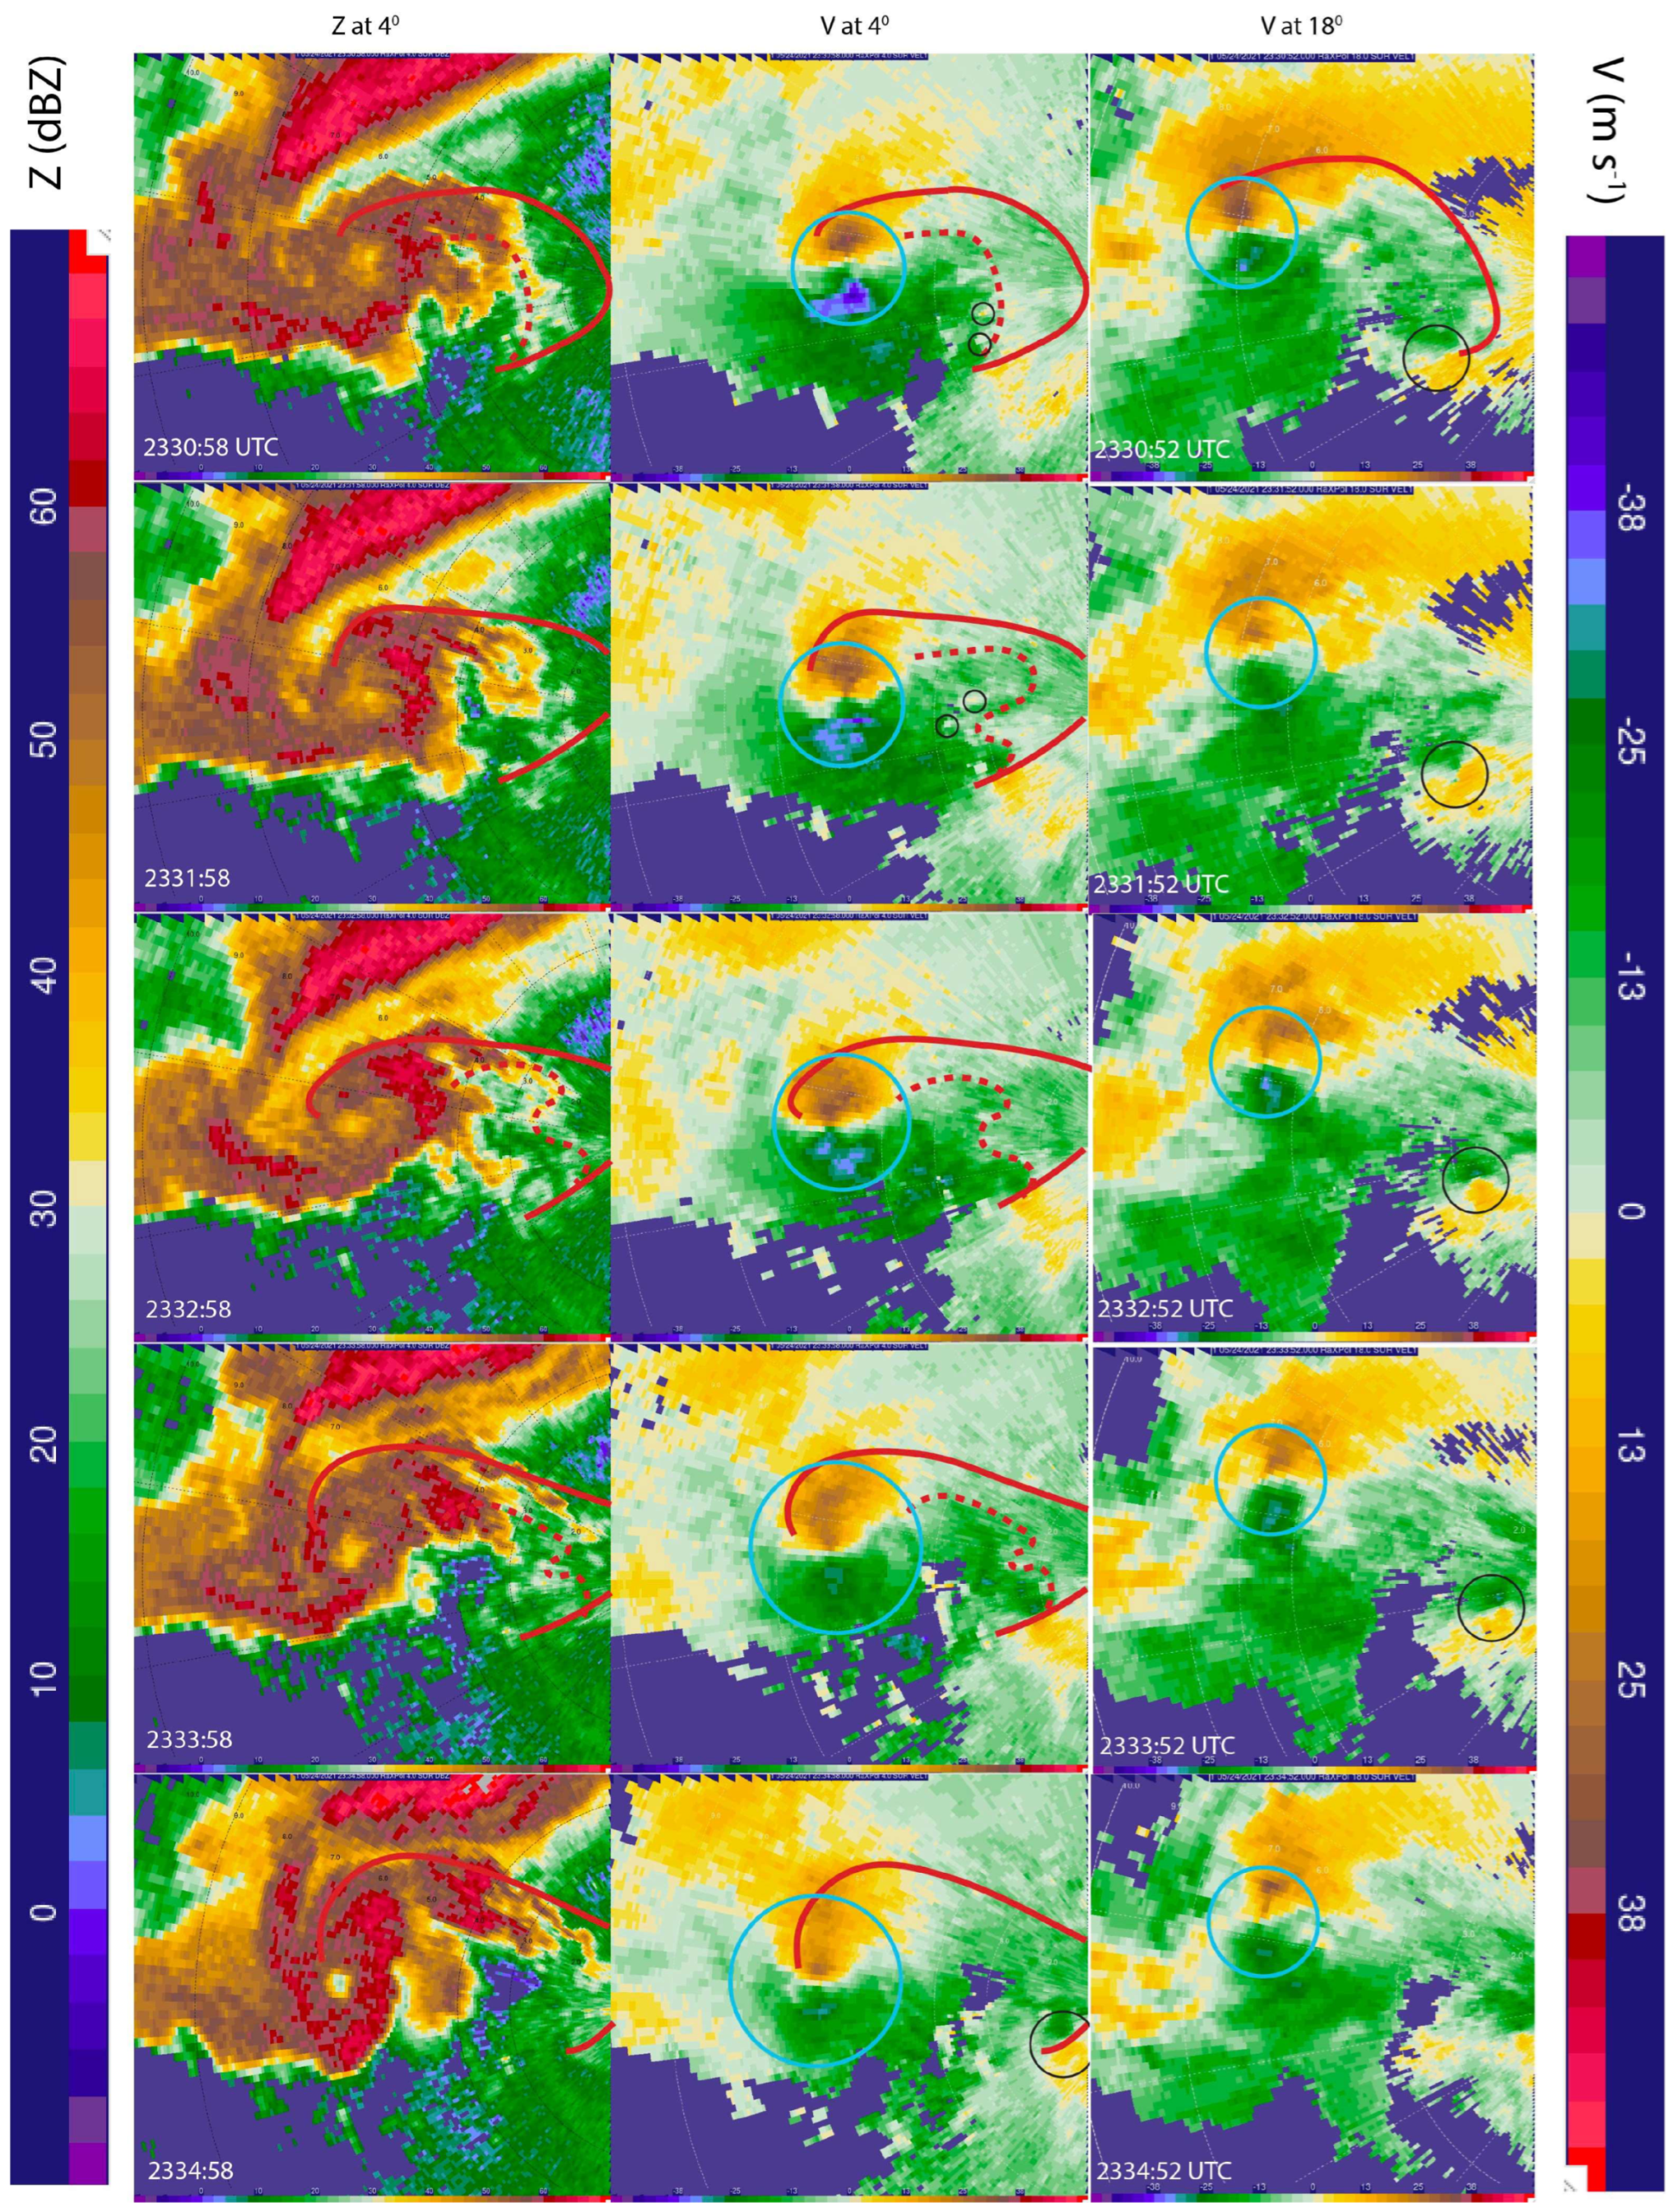
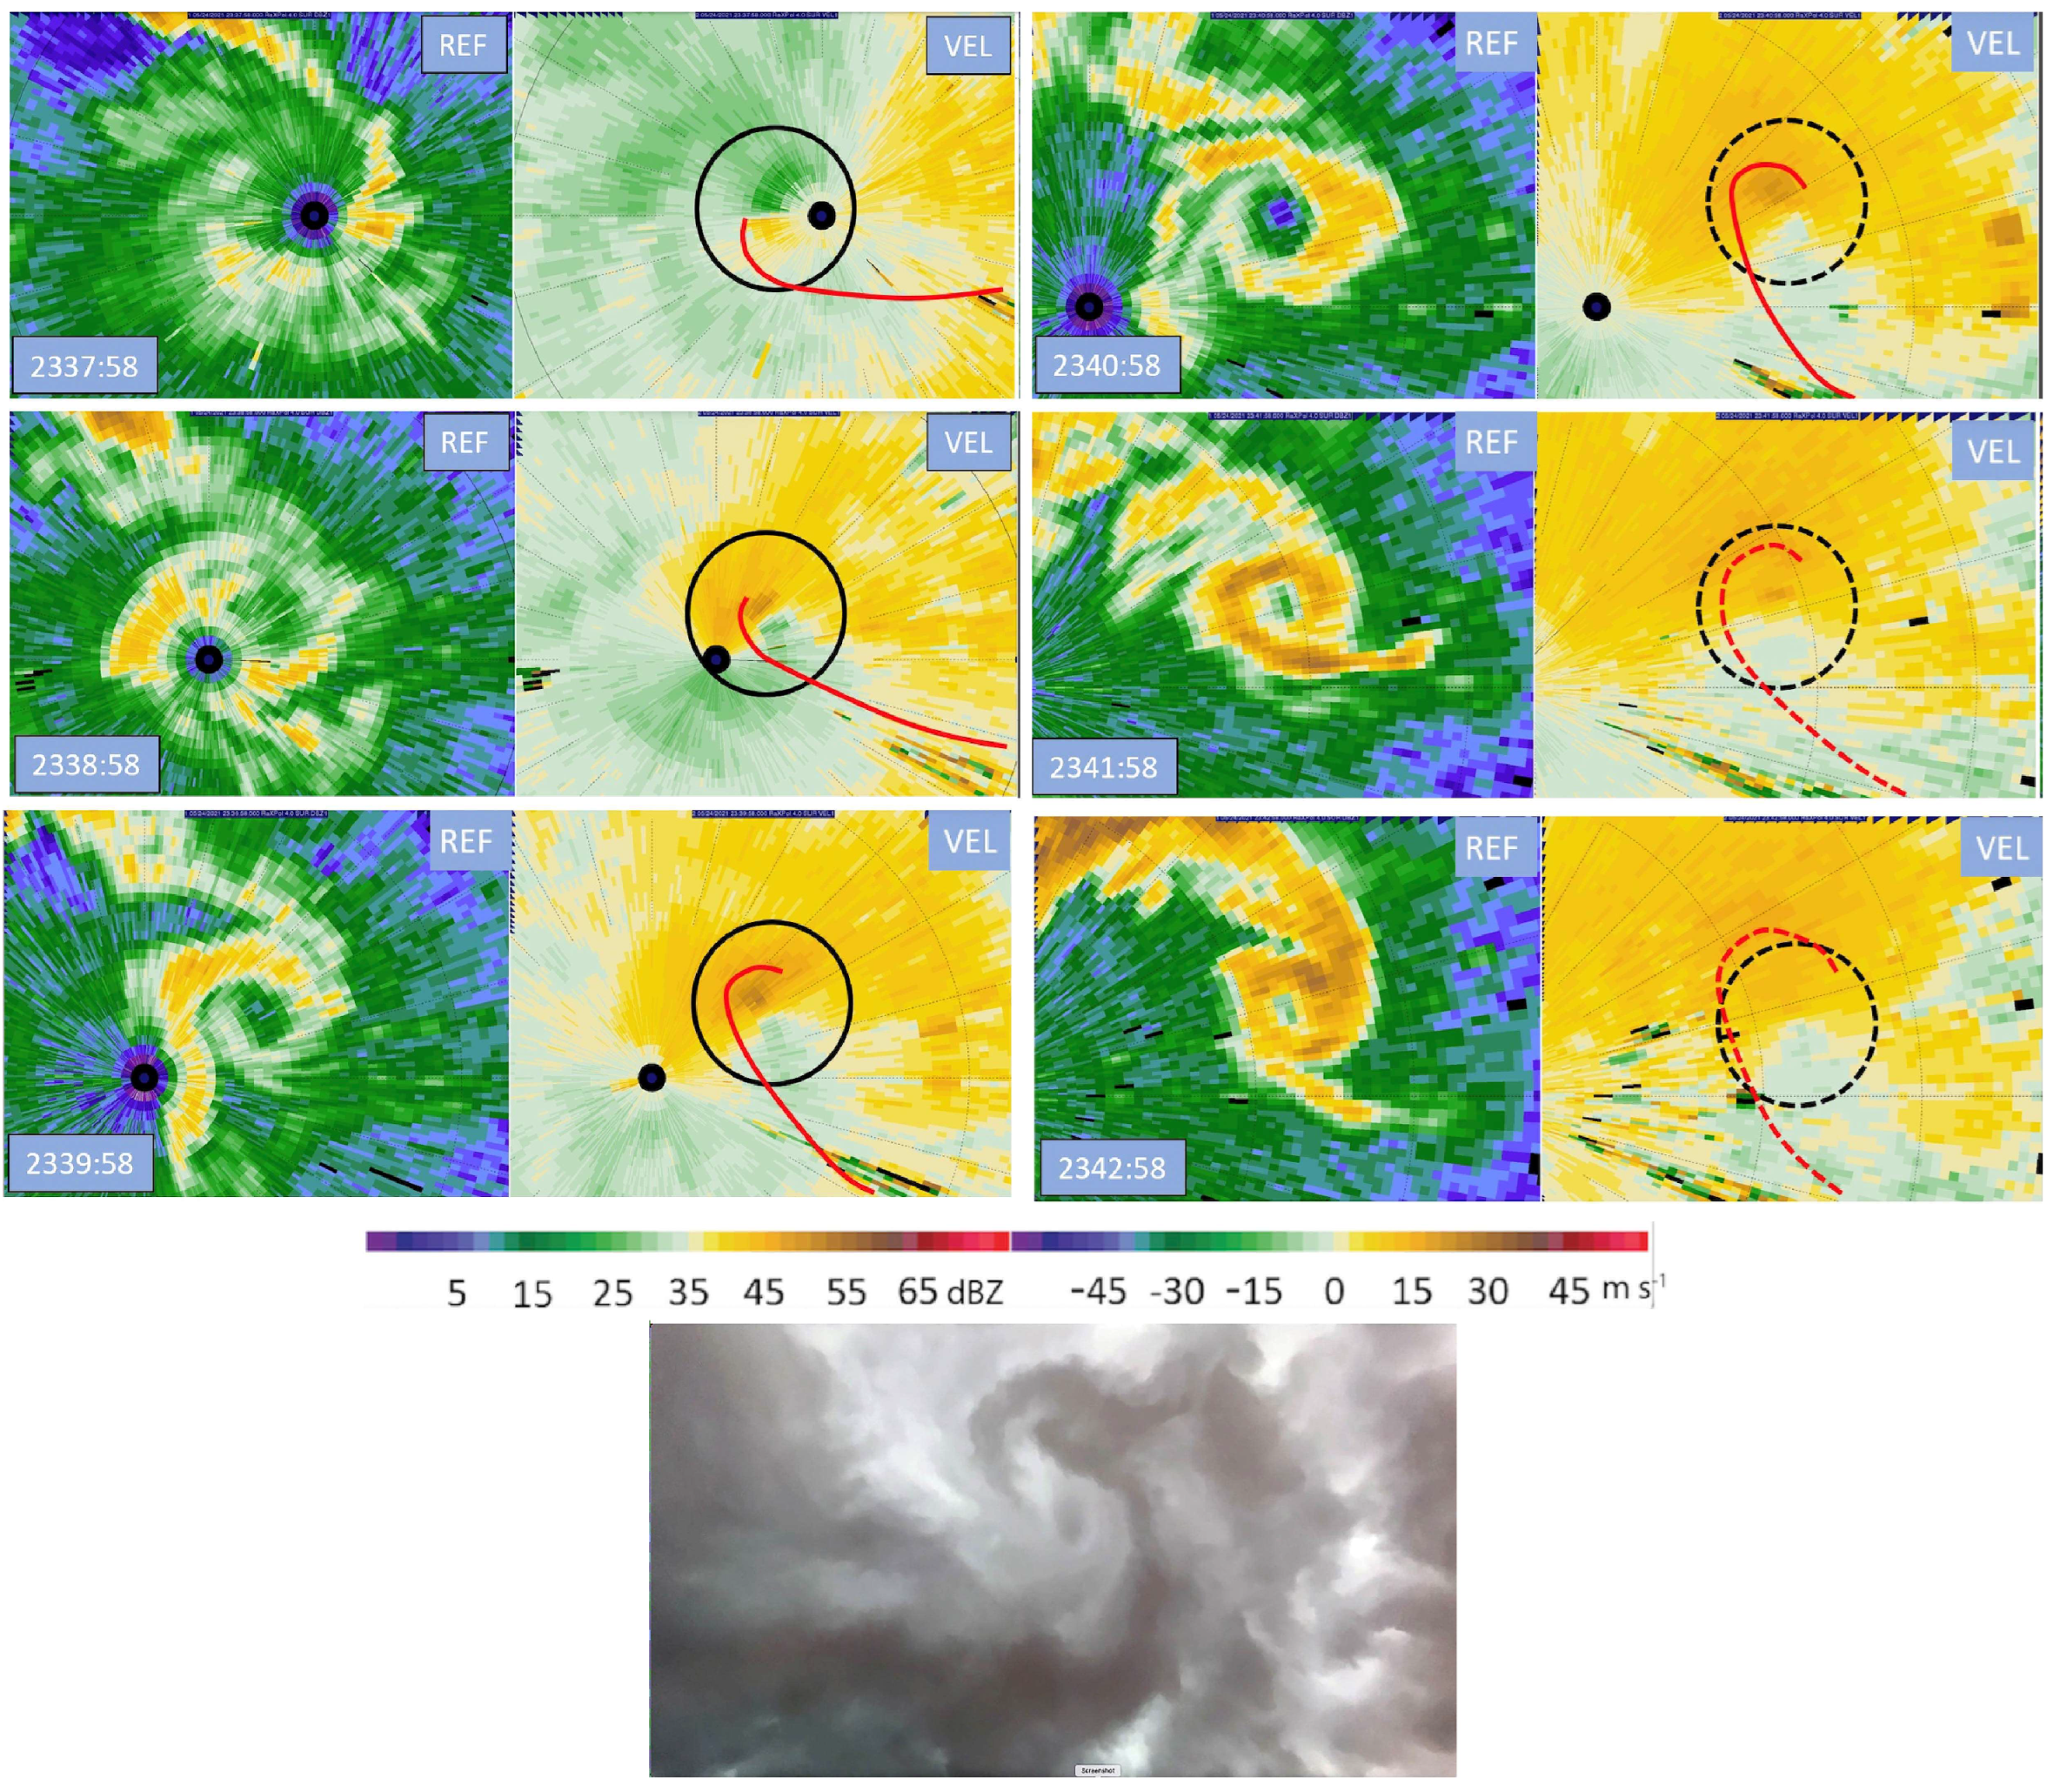
The anticyclonic tornado/strong vortex formed at the tail end of the RFGF when an internal rear-flank surge caught up to it (Figure 5). As it moved over the radar and gradually dissipated, it had a weak-echo hole (WEH) due to centrifuging radially outward of raindrops and debris (Figure 6), as in the cyclonic tornado shown in Figure 5.
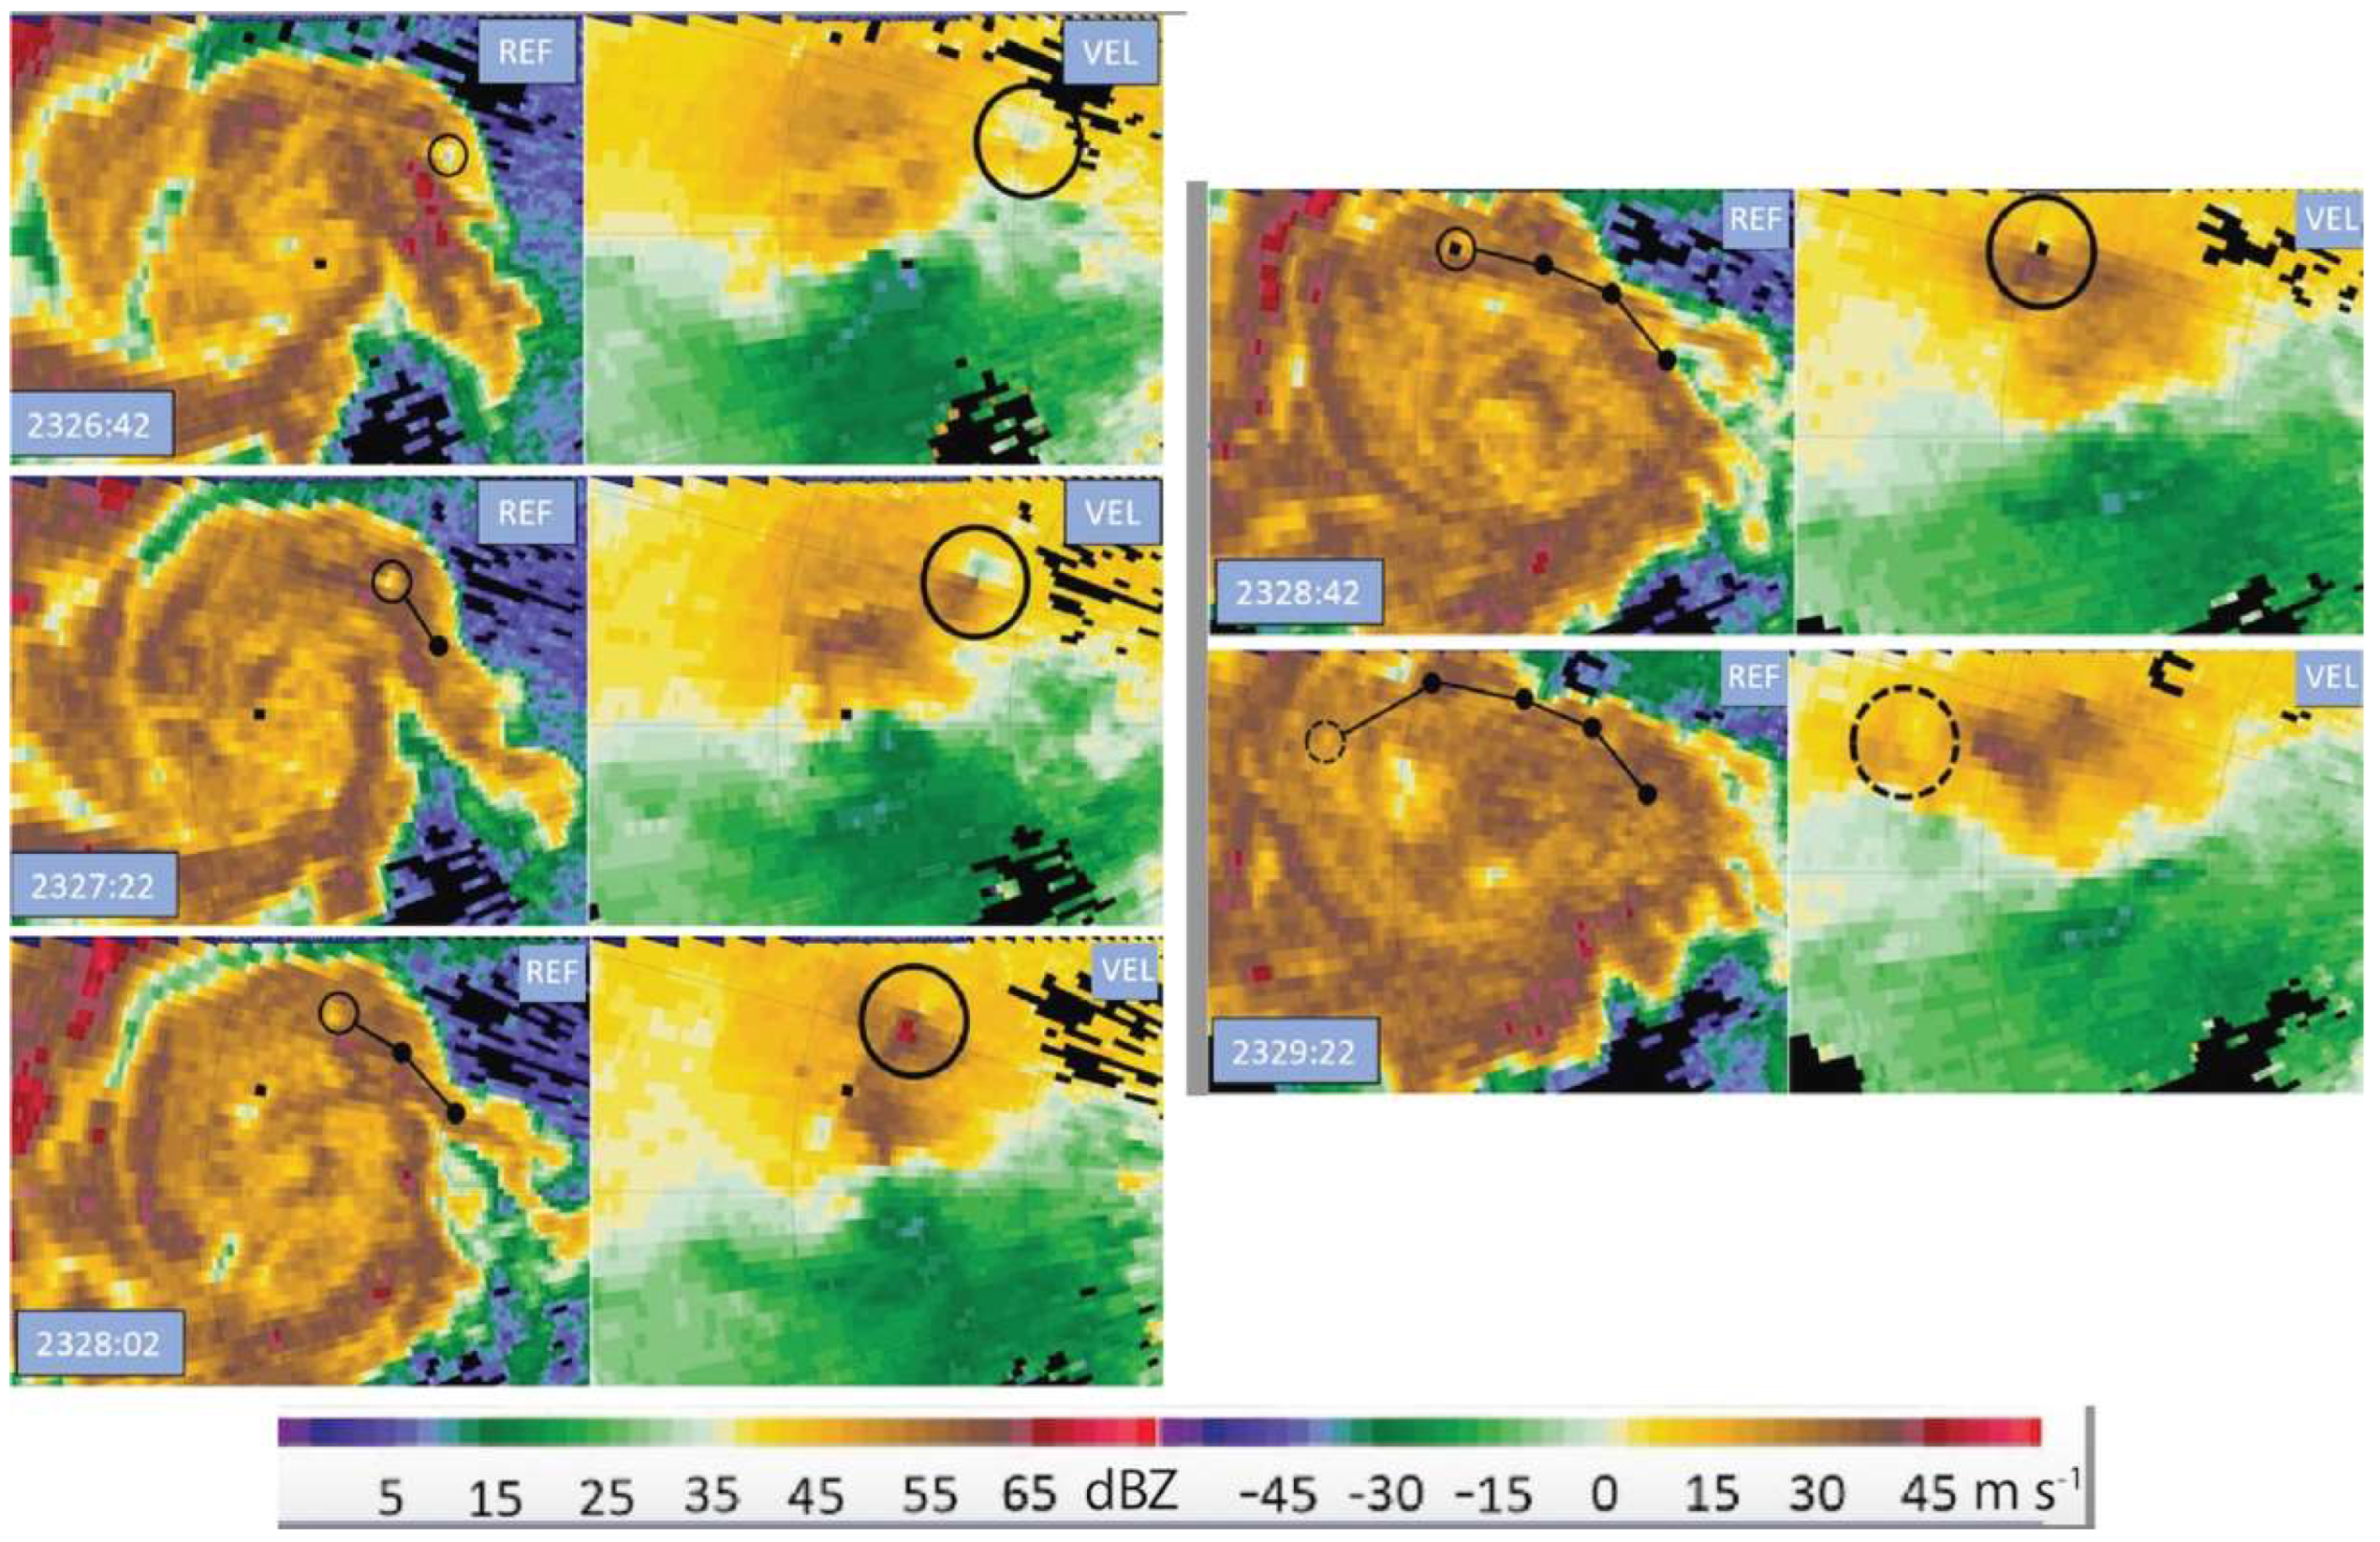
A very unusual (Figure 7) small-scale anticyclonic vortex, as evidenced by a WEH and an anticyclonic shear signature formed along the outer edge of the cyclonic tornado and rotated around it.

3. Conclusions

The single-vortex tornado transitioned into a multiple-vortex tornado when a downdraft developed upstream from the tornado and wrapped around it. The anticyclonic tornado formed when an internal rear-flank surge caught up to the RFGF and it is hypothesized that the collision of the surge with the leading edge of the RFGF produced increased convergence at the end of the RFGF, where anticyclonic vorticity had been produced as a result of tilting of solenoidally produced vorticity at the end of the line. A small anticyclonic vortex formed along the outer edge of the cyclonic tornado and rotated around it. It is speculated that it may have formed due to rollup of an anticyclonic vortex sheet present along the outer edge of the cyclonic tornado.

Author Contributions

Conceptualization, H.B., J.M., J.S. and L.W.; methodology, H.B., J.M., J.S. and L.W.; software, J.M. and J.S.; validation, all. formal analysis, J.M. and H.B.; investigation, J.M., H.B., T.G. and S.E.; resources, H.B.; data curation, J.M., T.G. and H.B.; writing—original draft preparation, H.B.; writing—review and editing, all; visualization, J.M. and H.B.; supervision, H.B.; project administration, H.B.; funding acquisition, H.B. All authors have read and agreed to the published version of the manuscript.

Funding

The research described in this paper was funded by grants AGS-1947146 and AGS2214926.

Institutional Review Board Statement

Not applicable.

Informed Consent Statement

Not applicable.

Data Availability Statement

RaXPol data are available at https://blue.metr.ou.edu/publications/WakimotoEtAl2025/ (accessed on 8 July 2025) and may be viewed at http://radarhub.arrc.ou.edu/archive/raxpol/ (accessed on 8 July 2025).

Acknowledgments

We also thank personnel at the Advanced Radar Research Cener for their support of RaXPol. In particular, Danny Feland, Dale Sexton, Tian-You Yu, Boon-Leng Cheong and David Bodine assisted with scheduling, maintenance and improvements to the radar.

Conflicts of Interest

The authors declare no conflicts of interest.

References

  1. Bluestein, H.B. Observations of tornadoes and their parent supercells using ground-based, mobile Doppler radars. In Remote Sensing of Water-Related Hazards; Zhang, K., Hong, Y., AghaKouchak, A., Eds.; American Geophysical Union/Wiley: New York, NY, USA, 2022; Volume 271, pp. 31–67. [Google Scholar] [CrossRef]
  2. Pazmany, A.; Mead, J.; Bluestein, H.; Snyder, J.; Houser, J. A mobile, rapid-scanning, X-band, polarimetric (RaXPol) Doppler radar system. J. Atmos. Ocean. Technol. 2013, 30, 1398–1413. [Google Scholar] [CrossRef]
  3. Rotunno, R.; Bluestein, H. Recent developments in tornado theory and observations. Rep. Prog. Phys. 2024, 87, 114801. [Google Scholar] [CrossRef] [PubMed]
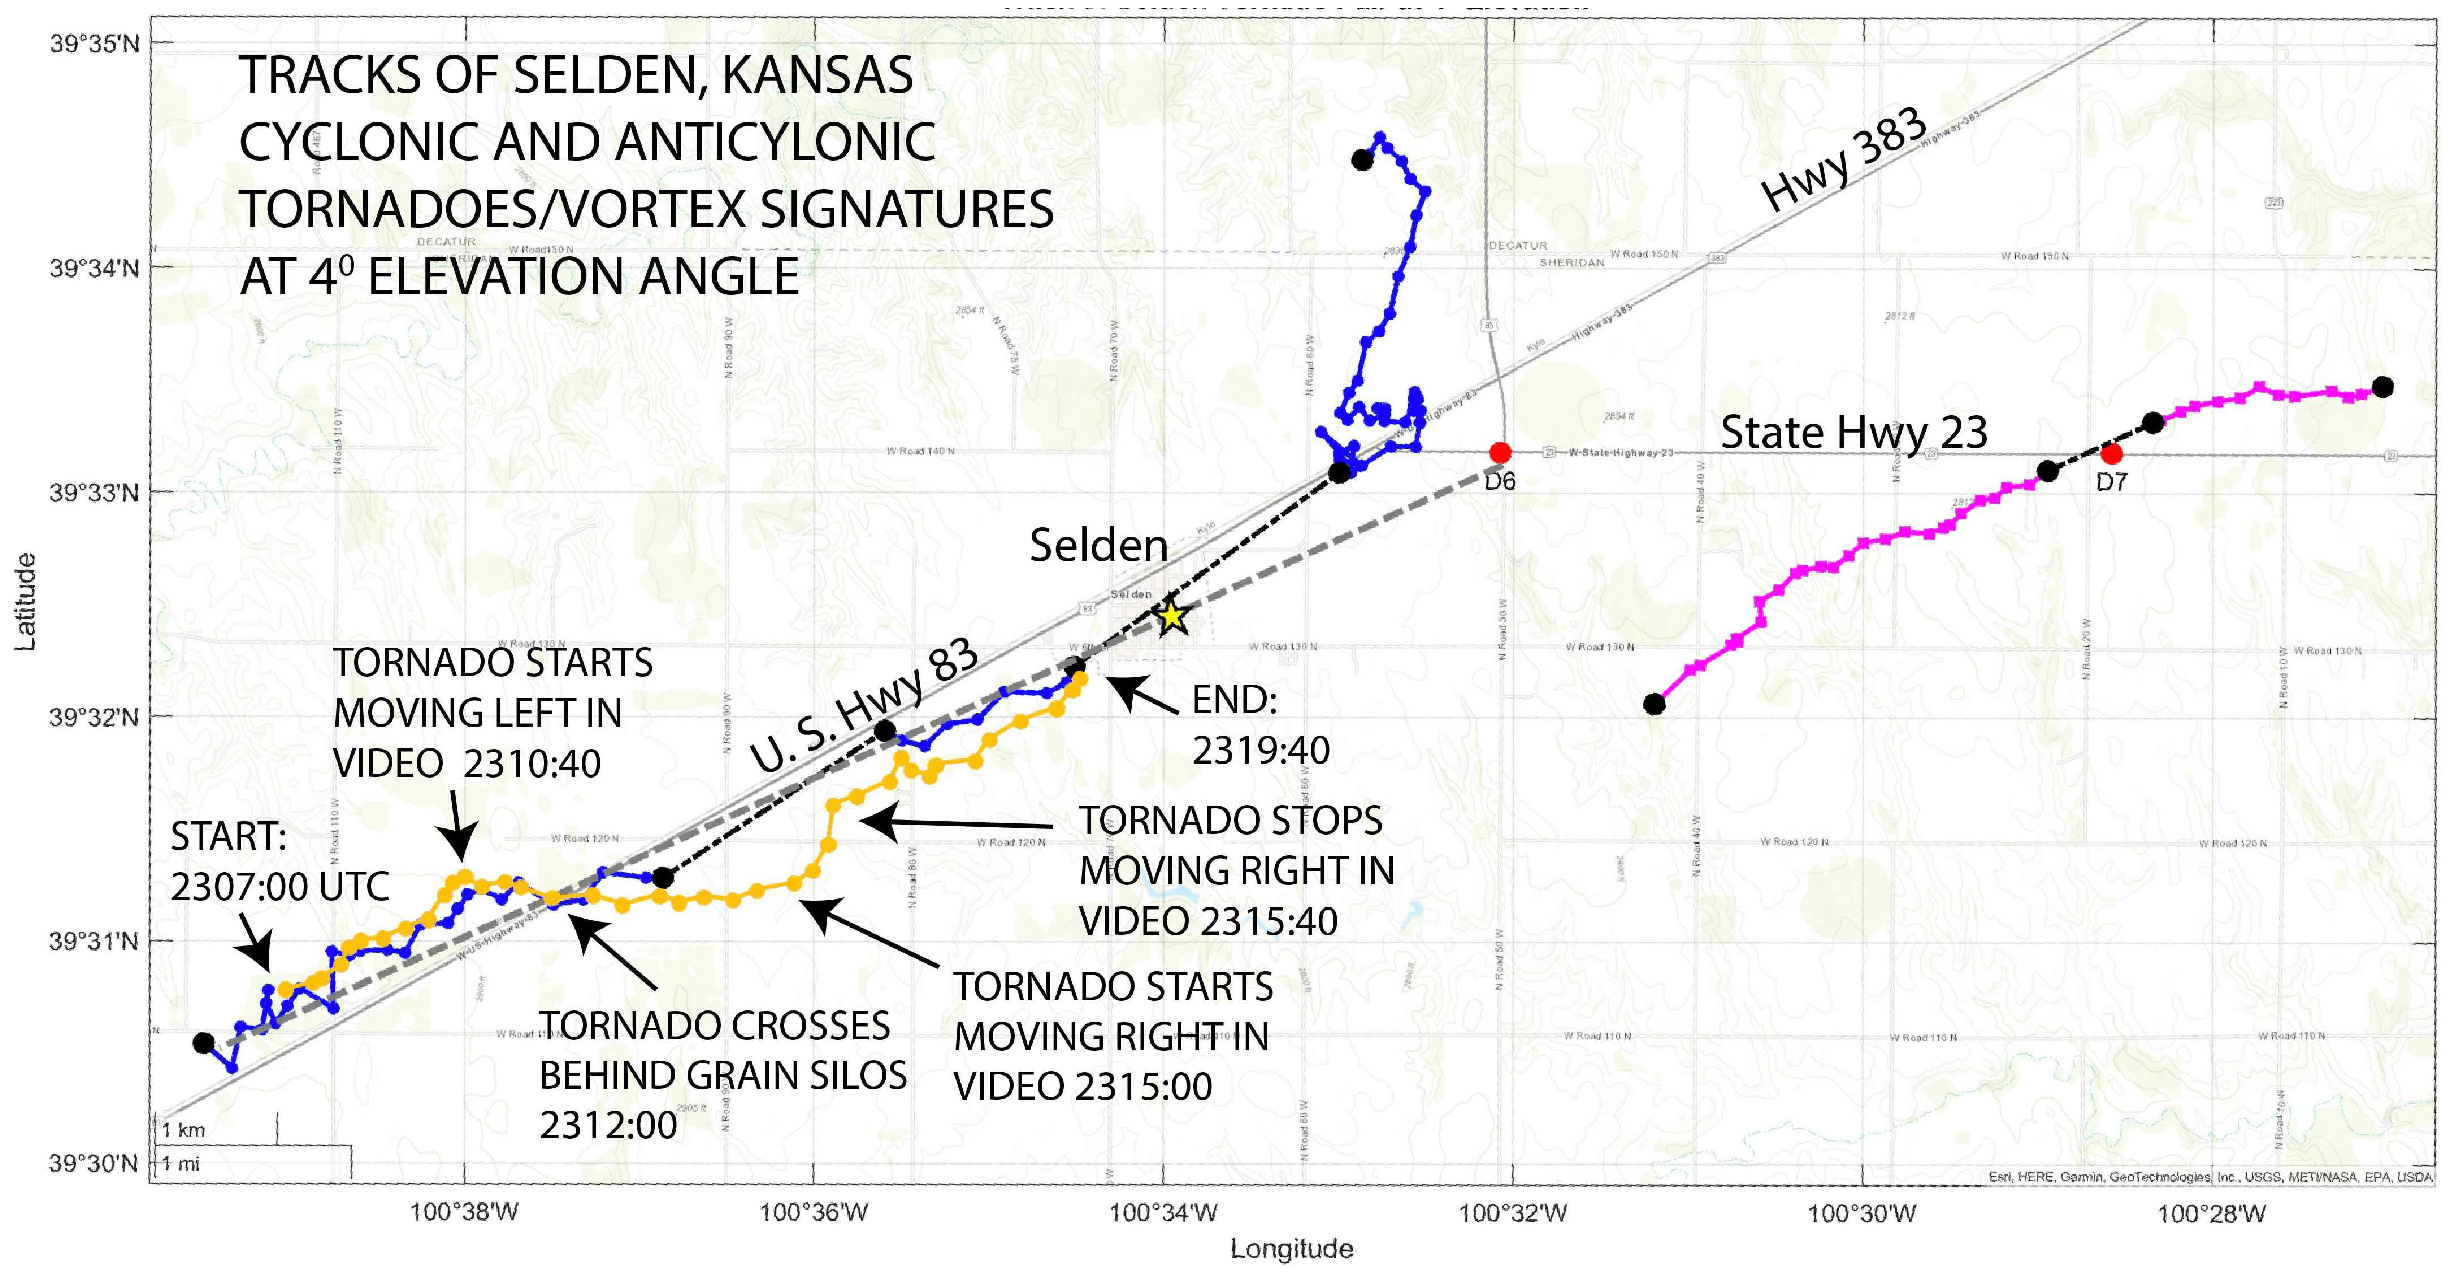
Figure 1. The track of the RaXPol-observed cyclonic TVS (blue) and video-located tornado (yellow); the track of the anticyclonic tornado (purple). The dashed line represents the line of sight of the video through a silo (star) visible in the video (not shown here).
Eesp 35 00019 g001
Figure 2. Tilt of the cyclonic TVS (top panel, blue) and direction of its tilt (bottom panel, green), between 4° and 16° elevation angle, as a function of time.
Eesp 35 00019 g002
Figure 3. The strength of the TVS as represented by ΔV, the difference between the maximum and minimum Doppler velocity, as a function of time (top panel, blue). ΔV (red) and vorticity 2 ΔV/D, where D is the distance between the maximum and minimum Doppler velocities (blue) (bottom panel), as a function of time. Arrows in the upper-right panel refer to instances of internal rear-flank surges. The dotted lines indicate data gaps.
Eesp 35 00019 g003
Figure 4. Evolution of the cyclonic tornado when it transitioned to a multiple-vortex tornado. At 2308:27 UTC, arrow points to clear area. Other arrows point to region of divergence (increase in Vr in radial direction), consistent with sinking motion. The curved red line marks the leading edge of the rear-flank gust front (RFGF) and the blue line marks convergence along the forward flank of the storm.
Eesp 35 00019 g004
Figure 5. Evolution of the radar reflectivity (first column), Doppler velocity at 4° elevation angle (center column) and at 18° elevation (right column) while the anticyclonic tornado formed. Blue circles (TVSs), curved red lines (RFGF) and dashed curved line (internal rear-flank surge). Black circles indicate anticyclonic vortex signatures. Times given in UTC.
Eesp 35 00019 g005
Figure 6. Evolution of the anticyclonic tornado/strong anticyclonic vortex after it passed over RaXPol. Reflectivity (left panel) and Doppler velocity (right panel). Solid (dashed) circle marks the TVS (decaying TVS). Red line marks the convergent boundary between radially outward flow and radially inflow around the anticyclonic TVS (dashed line indicates that boundary is not as distinct as it had been). Times in UTC. Image captured from an upward-looking video of anticyclonically rotating clouds overhead (by S. Emmerson).
Eesp 35 00019 g006
Figure 7. Evolution of a small anticyclonic vortex along the forward flank of the cyclonic tornado. Radar reflectivity (left panels) and Doppler velocity (right panels). Track of vortex shown on left and circle denotes anticyclonic-vortex signature on right. Times given in UTC.
Eesp 35 00019 g007
Disclaimer/Publisher’s Note: The statements, opinions and data contained in all publications are solely those of the individual author(s) and contributor(s) and not of MDPI and/or the editor(s). MDPI and/or the editor(s) disclaim responsibility for any injury to people or property resulting from any ideas, methods, instructions or products referred to in the content.