Abstract
Here, we assess the projected changes in photovoltaic power generation potential (PVpot) in Greece for the 21st century. Our analysis is based on an ensemble of high-resolution Regional Climate Model (RCM) simulations from the EURO-CORDEX initiative following three different Representative Concentration Pathways (RCPs), namely, RCP2.6 (strong mitigation), RCP4.5 (moderate mitigation), and RCP8.5 (no further mitigation). The spatial patterns of the PVpot changes in the near future (2021–2050) and at the end of the century (2071–2100) relative to the 1971–2000 baseline period are presented along with the corresponding statistical robustness. In addition, we analyze time series of the projected PVpot changes. Finally, we isolate the effects of specific climatic variables on the projected PVpot changes and discuss the importance of PV energy production in Greece.
1. Introduction
Photovoltaic (PV) systems are essential in the global transition to clean energy, helping reduce greenhouse gas emissions and limit global warming. They provide a sustainable, decentralized electricity source, improving energy security and reducing dependence on fossil fuel imports. The EU’s “Green Deal” strategy highlights the central role of PVs in reaching climate neutrality by 2050 [1]. Greece, benefiting from some of the highest solar irradiance levels in Europe, has rapidly expanded its solar capacity since 2010. As of 2023, PV systems supplied 18.4% of Greece’s electricity demand, which represents the highest share in the EU [2]. PV deployment can support employment, energy affordability, and energy access, particularly in remote or island regions, while also offering benefits for urban centers across the country [3,4]. PV systems, when integrated with careful planning, regulatory alignment, and fair distribution of benefits, can play an important role in shaping a resilient, low-carbon, and inclusive energy future for Greece and the European Union.
A previous study focusing on Europe using high spatial resolution simulations from five regional climate models (RCMs) of the EURO-CORDEX program has shown that a decrease in energy production potential from PV systems (PVpot) is expected by the end of the 21st century [5]. Generally, a reduction is anticipated in Northern Europe and a slight increase in some areas of Southern Europe, for both the moderate mitigation scenario (RCP4.5) of the Intergovernmental Panel on Climate Change (IPCC) and the extreme climate change scenario (RCP8.5), where emissions continue to rise unchecked. Specifically for Greece, Panagea et al. [6], based on data from five lower-resolution RCMs from the ENSEMBLES program and the older-generation IPCC emission scenario A1B, showed that increases in PVpot of up to 4% are expected.
Recognizing the importance of energy production from PV systems at the energy, political, and economic levels, within the framework of CLIMPACT-II, we assessed the projected changes in PVpot for the mid-century period (2021–2050) and the end-of-century period (2071–2100) relative to a reference period (1971–2000). This study provides an updated estimate of changes in PVpot based on an ensemble of state-of-the-art RCM simulations. First, data from 11 RCMs are utilized, expanding upon earlier studies that relied on only 5 models. Furthermore, we analyze three IPCC emission scenarios (RCP2.6, RCP4.5, RCP8.5), compared to the one or two scenarios typically examined in previous research. Finally, to ensure the robustness of our findings, the statistical significance of projected changes is assessed while accounting for inter-model variability.
2. Data and Methods
For this research, high-resolution surface downwelling shortwave solar radiation (RSDS; in W m−2), near surface temperature (TAS; in °C) and wind speed (WS; in m s−1) data from EURO-CORDEX were used for both the historical period (1971–2005) and the future period (2006–2100), obtained from 11 sets of RCM simulations (different RCMs driven by different global climate models) under 3 different IPCC emission scenarios (RCP2.6, RCP4.5, RCP8.5). Details on the data used can be found in Georgoulias et al. [7]. PVpot is a dimensionless magnitude characterizing the performance of the PV cells with respect to their nominal power capacity. It can be expressed as follows:
PVpot = PR × RSDS/RSDSSTC
STC refers to standard test conditions (RSDSSTC = 1000 W m−2) under which the nominal capacity of a PV system is determined. PR, the so-called “performance ratio”, expresses the changes in PV cell efficiency induced by RSDS, TAS, and WS.
where Tcell expresses the PV cell temperature, TSTC = 25 °C and γ = −0.005 °C−1, considering the typical response of monocrystalline silicon solar panels. Tcell is calculated from RSDS, TAS, and WS:
where c1 = 4.3, c2 = 0.943, c3 = 0.028, and c4 = −1.528. As the cell temperature rises, the voltage output in PV systems decreases significantly. High temperatures increase Tcell and, therefore, negatively affect PVpot, while high wind speeds decrease Tcell, thereby increasing PVpot. Following Jerez et al. [5] and other studies, PVpot is calculated from the following formula, which is produced by grouping Equations (1)–(3):
where a1 = 1.1035 × 10⁻³, a2 = −1.4 × 10⁻⁷, a3 = −4.715 × 10⁻⁶, and a4 = 7.64 × 10⁻⁶.
PR = 1 + γ × (Tcell − TSTC)
Tcell = c1 + c2 × TAS + c3 × RSDS + c4 × WS
PVpot = a1 × RSDS + a2 × RSDS2 + a3 × RSDS × TAS + a4 × RSDS × WS
The PVpot calculations are implemented for each set separately, and then we merge the time series to obtain the ensemble. The projected changes in the future periods 2021–2050 and 2071–2100 relative to the near-past period 1971–2000 are examined along with the statistical robustness. Following recent climatic studies focusing on Greece [7,8,9], a future change is considered robust if at least 7 out of the 11 simulations have the same sign with the ensemble change and at the same time are statistically significant at the 95% confidence level according to the non-parametric Mann–Whitney test.
Additionally, the effect of the projected changes in RSDS, TAS, and WS on the PVpot change (ΔPVpot) is calculated using the following formula, which is derived from Equation (4):
ΔPVpot = ΔRSDS × (a1 + a2 × ΔRSDS + 2 × a2 × RSDS + a3 × TAS +a4 × WS)
+ a3 × RSDS × ΔTAS
+ a4 × RSDS × ΔWS
+ a3 × ΔRSDS × ΔTAS
+ a4 × ΔRSDS × ΔWS
+ a3 × RSDS × ΔTAS
+ a4 × RSDS × ΔWS
+ a3 × ΔRSDS × ΔTAS
+ a4 × ΔRSDS × ΔWS
By assuming ΔRSDS = ΔWS = 0 in Equation (5), the future change in PVpot due to a change in TAS (ΔPVpotTAS) can be obtained (line 2 in Equation (5)). Similarly, when assuming ΔRSDS = ΔTAS = 0, ΔPVpotWS is calculated from line 3 in Equation (5). Based on the same logic, ΔPVpotRSDS is calculated from line 1. It is highlighted here that it is impossible to fully isolate the contribution of each single field due to the cross-products in the last two terms of Equation (5). However, as discussed in Scheele and Fiedler [10], those two terms are small compared to the others (particularly compared to ΔPVpotRSDS and ΔPVpotTAS).
3. Results
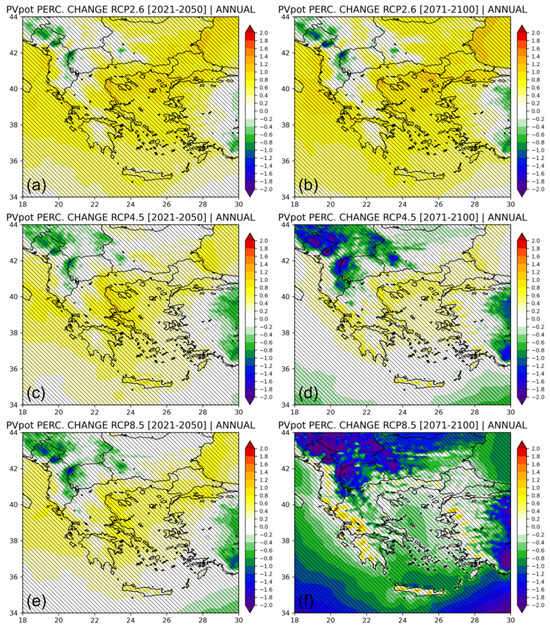
Figure 1 illustrates the projected changes in PVpot for the near-future and end-of-century periods relative to the reference period, under the three RCP scenarios considered for the broader region surrounding Greece. It is important to note that across Greece, PVpot changes are not statistically robust under any of the three scenarios. This is in line with previous results from Jerez et al. [5] using an ensemble of fewer RCMs (5). Specifically, for the RCP2.6 (optimistic) and RCP4.5 (moderate) scenarios, a statistically insignificant increase of less than 1% is projected for both future periods compared to the reference period. Under the RCP8.5 scenario, the near-future changes resemble those of RCP4.5, while by the end of the century, a statistically insignificant decrease in PVpot is projected in certain regions (e.g., Attica, Thessaly, Macedonia, Aegean), locally exceeding −1%. In contrast, other regions (e.g., Western Greece, Crete, Rhodope) exhibit localized increases exceeding 1%. This dipole was also shown in Panagea et al. [6]. A notable finding is the statistically robust decrease in PVpot projected for areas north of Greece and in Turkey under both RCP4.5 and RCP8.5 by the end of the century. An examination of PVpot time series at both national and administrative regional scales for the period 1971–2100 reveals significant variability among different simulation sets, with some showing increasing and others decreasing trends over time. This divergence leads to only marginal, statistically non-robust changes in the ensemble mean PVpot.

Figure 1.
Percent difference in the PVpot fields from the EURO-CORDEX ensemble between the near-future (2021–2050) and the reference period (1971–2000) for southeastern Europe for RCP2.6 (a). (b) the same as (a) but for the difference between the end-of-the-century (2071–2100) and the reference period. (c,d) the same as (a,b), respectively, but for RCP4.5. (e,f) the same as (a,b), respectively, but for RCP8.5. Hatching indicates areas where the differences are not statistically robust.
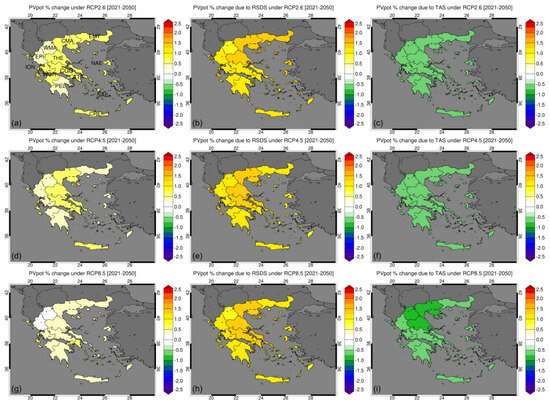
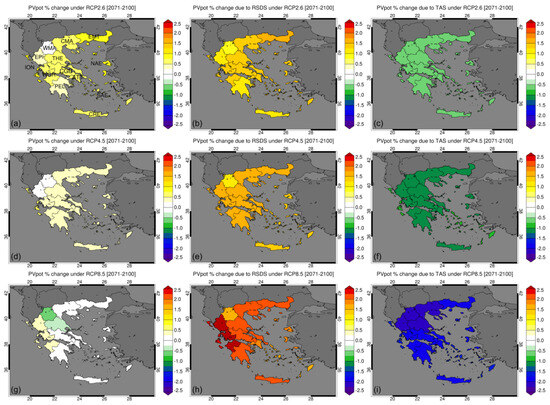
Figure 2 and Figure 3 present the projected changes in PVpot at the administrative region level, along with the corresponding contributions from changes in RSDS (ΔPVpotRSDS) and TAS (ΔPVpotTAS) for the near-future and end-of-century periods, respectively. Changes in PVpot due to wind speed (WS) are not shown, as they are negligible. PVpot is projected to increase due to the increase in RSDS in Greece, both in the near future and at the end of the century (ΔPVpotRSDS is positive). Under RCP2.6, RCP4.5, and RCP8.5, PVpot is projected to increase on average by 1.2% due to RSDS in the near future and by 1.3, 1.5, and 2.1%, respectively, at the end of the century relative to the reference period. However, this increase is partially offset by a reduction in PVpot resulting from higher air temperatures. The average ΔPVpotTAS for Greece is −0.6% under RCP2.6 and RCP4.5, and −0.7% under RCP8.5 for the near-future period. For the end of the century, the corresponding ΔPVpotTAS values are −0.6%, −1.1%, and −2.0%, respectively.

Figure 2.
Left column: projected changes in PVpot (in %) for Greece for the near-future period (2021–2050) relative to the reference period (1971–2000) under RCP2.6 (a), RCP4.5 (d), and RCP8.5 (g). Middle column (b,e,h): The same as the left column but for changes in PVpot due to RSDS (ΔPVpotRSDS). Right column (c,f,i): The same as the other two columns but for changes induced by TAS (ΔPVpotTAS).

Figure 3.
The same as Figure 2 but for the end-of-the-century period (2071–2100) (a–i).
4. Conclusions
Future projected changes in photovoltaic potential (PVpot) over Greece, based on an ensemble of high-resolution RCM simulations from EURO-CORDEX, are generally marginal and statistically non-robust under any of the three RCP scenarios examined. Increases in surface solar radiation tend to enhance PVpot, particularly under RCP8.5 by the end of the century. However, this positive effect is partially offset by rising air temperatures, which reduce PV efficiency. Wind speed has a negligible impact on long-term PVpot projections. Overall, the ensemble suggests limited changes in PV performance over Greece through 2100, although substantial variability exists among individual RCM simulations.
Author Contributions
Conceptualization, A.K.G.; methodology, A.K.G., D.A., and P.Z.; software, A.K.G. and D.A.; validation, A.K.G.; formal analysis, A.K.G.; investigation, A.K.G., D.A., A.K., and P.Z.; data curation, A.K.G.; writing—original draft preparation, A.K.G.; writing—review and editing, A.K.G., D.A., A.K., D.M., and P.Z.; visualization, A.K.G. and D.A.; project administration, D.M. and P.Z. All authors have read and agreed to the published version of the manuscript.
Funding
This research was funded by the project “Support for Enhancing the Operation of the National Network for Climate Change (CLIMPACT)”, National Development Program, General Secretariat of Research and Innovation, Greece (2023ΝA11900001—Ν. 5201588).
Data Availability Statement
Data available via https://esgf-data.dkrz.de/search/cordex-dkrz/ (accessed on 8 September 2025).
Acknowledgments
We acknowledge the World Climate Research Program’s Working Group on Regional Climate, and the Working Group on Coupled Modelling, the former coordinating body of CORDEX and the responsible panel for CMIP5. We also thank the climate modelling groups for producing and making their model output available. Finally, we acknowledge the Earth System Grid Federation infrastructure an international effort led by the U.S. Department of Energy’s Program for Climate Model Diagnosis and Intercomparison, the European Network for Earth System Modelling and other partners in the Global Organization for Earth System Science Portals (GO-ESSP).
Conflicts of Interest
The authors declare no conflict of interest.
References
- European Commission. The European Green Deal (COM(2019) 640 Final); European Comission: Brussels, Belgium, 2019. [Google Scholar]
- ADMIE. Annual Report on the Greek Electricity Market; Independent Power Transmission Operator: Athens, Greece, 2024. [Google Scholar]
- Kitsopoulou, A.; Pallantzas, D.; Bellos, E.; Tzivanidis, C. Mapping the Potential of Zero-Energy Building in Greece Using Roof Photovoltaics. Designs 2024, 8, 68. [Google Scholar] [CrossRef]
- Vigkos, S.; Kosmopoulos, P.G. Photovoltaics Energy Potential in the Largest Greek Cities: Atmospheric and Urban Fabric Effects, Climatic Trends Influences and Socio-Economic Benefits. Energies 2024, 17, 3821. [Google Scholar] [CrossRef]
- Jerez, S.; Tobin, I.; Vautard, R.; Montávez, J.P.; López-Romero, J.M.; Thais, F.; Bartok, B.; Christensen, O.B.; Colette, A.; Déqué, M.; et al. The Impact of Climate Change on Photovoltaic Power Generation in Europe. Nat. Commun. 2015, 6, 10014. [Google Scholar] [CrossRef] [PubMed]
- Panagea, I.S.; Tsanis, I.K.; Koutroulis, A.G.; Grillakis, M.G. Climate Change Impact on Photovoltaic Energy Output: The Case of Greece. Adv. Meteorol. 2014, 2014, 1–11. [Google Scholar] [CrossRef]
- Georgoulias, A.K.; Akritidis, D.; Kalisoras, A.; Kapsomenakis, J.; Melas, D.; Zerefos, C.S.; Zanis, P. Climate Change Projections for Greece in the 21st Century from High-Resolution EURO-CORDEX RCM Simulations. Atmos. Res. 2022, 271, 106049. [Google Scholar] [CrossRef]
- Zanis, P.; Georgoulias, A.K.; Velikou, K.; Akritidis, D.; Kalisoras, A.; Melas, D. Future Projections of Precipitation Extremes for Greece Based on an Ensemble of High-Resolution Regional Climate Model Simulations. Atmosphere 2024, 15, 601. [Google Scholar] [CrossRef]
- Mavromatis, T.; Georgoulias, A.K.; Akritidis, D.; Melas, D.; Zanis, P. Spatiotemporal Evolution of Seasonal Crop-Specific Climatic Indices under Climate Change in Greece Based on EURO-CORDEX RCM Simulations. Sustainability 2022, 14, 17048. [Google Scholar] [CrossRef]
- Constantin Scheele, R.; Fiedler, S. What Drives Historical and Future Changes in Photovoltaic Power Production from the Perspective of Global Warming? Environ. Res. Lett. 2024, 19, 014030. [Google Scholar] [CrossRef]
Disclaimer/Publisher’s Note: The statements, opinions and data contained in all publications are solely those of the individual author(s) and contributor(s) and not of MDPI and/or the editor(s). MDPI and/or the editor(s) disclaim responsibility for any injury to people or property resulting from any ideas, methods, instructions or products referred to in the content. |
© 2025 by the authors. Licensee MDPI, Basel, Switzerland. This article is an open access article distributed under the terms and conditions of the Creative Commons Attribution (CC BY) license (https://creativecommons.org/licenses/by/4.0/).