Proceeding Paper

Comparison of Methane Concentrations Between CMIP6 Earth System Model Simulations and CAMS Reanalysis Fields †

by
Sofia Eirini Paschou
*,
Alkiviadis Kalisoras
and
Prodromos Zanis
Department of Meteorology and Climatology, Aristotle University of Thessaloniki, 54124 Thessaloniki, Greece
*
Author to whom correspondence should be addressed.
Presented at the 17th International Conference on Meteorology, Climatology, and Atmospheric Physics—COMECAP 2025, Nicosia, Cyprus, 29 September–1 October 2025.
Environ. Earth Sci. Proc. 2025, 35(1), 15; https://doi.org/10.3390/eesp2025035015
Published: 10 September 2025

Abstract

Methane is a short-lived climate forcer (SLCF) that has a pivotal influence on the Earth’s climate. This work focuses on mean methane concentrations and their year-to-year variability for the period 2003–2014 between four CMIP6 (Coupled Model Intercomparison Project Phase 6) Earth System Model simulations and CAMS (Copernicus Atmosphere Monitoring Service) reanalysis fields. The selected CMIP6 models are CNRM-ESM2-1, GFDL-ESM4.1, UKESM1, and EC-Earth3-AerChem, while monthly averaged fields from the CAMS global greenhouse gas reanalysis (EGG4) were employed. It is shown that the EC-Earth3-AerChem model closely aligns with CAMS methane concentration pattern, whereas other models display notable differences.

1. Introduction

Methane (CH4) is a crucial atmospheric constituent due to its role as a potent greenhouse gas and a major air pollutant. Methane is released from various anthropogenic and natural sources, while over the past two centuries, atmospheric methane concentrations have more than doubled, primarily due to human activities [1]. Methane sinks are detected in the troposphere [2], the stratosphere [3,4] as well as in soils [5,6] and the marine boundary layer [7,8]. A Coupled Model Intercomparison Project Phase 6 (CMIP6) recent analysis reveals that atmospheric chemistry models still exhibit significant structural uncertainties, probably due to inherent biases in precursors of hydroxyl (OH) [9], which oxidates methane. Due to uncertainties in the global methane budget, as well as methane’s crucial role in the climate system and its emissions’ high magnitude, this study examines how accurate theCMIP6 Earth System Model (ESM) simulations for methane concentrations are compared to Copernicus Atmosphere Monitoring Service (CAMS) reanalysis data.

2. Methods

This analysis is based on model simulations conducted by the CNRM-ESM2-1 [10], GFDL-ESM4.1 [11], UKESM1 [12], and EC-Earth3-AerChem [13] ESMs as part of the Aerosol and Chemistry Model Intercomparison Project (AerChemMIP) [9]. AerChemMIP is a collaborative initiative within CMIP6 that evaluates climate forcings and feedback associated with gases such as methane. In each model, global mean methane concentrations were prescribed as a surface boundary condition which was allowed to advect and react with the chemistry in the historical runs [14]. The four models utilized in this research refer to the historical period 2003–2014 and are based on the histSST experiment of AerChemMIP, which uses historical prescribed sea surface temperatures (SSTs) and historical forcings. Additionally, the ESMs constrain CH4 from the Meinshausen et al. [15] dataset about historical greenhouse gas concentrations for climate models for CMIP6 experiments.
The CNRM-ESM2.1 model steers methane’s chemical evolution below 560 hPa toward the historical dataset, while higher pressures are relaxed towards the annual varying mean surface concentrations [10]. The GFDL-ESM4.1 model [11] prescribes greenhouse gases from the historical dataset and the global mixing ratios of methane are specified at the surface as lower boundary conditions [11]. In the UKESM1 model, methane surface cycle is forced via CH4 surface mole fractions derived from the historical dataset, while above the surface, methane concentrations are treated as interactive chemical gases [16]. The EC-Earth3-AerChem model [13] constrains methane concentrations from the historical dataset, nudging both tropospheric and stratospheric concentrations, with the lower troposphere’s concentrations nudged toward the dataset’s zonal means. The current analysis concerns annual mean methane concentrations for the period 2003–2014 and year-to-year evolution of methane concentrations for the four models and CAMS global greenhouse gas reanalysis (EGG4) monthly averaged fields. To assess models’ performance, methane concentration differences were calculated as (CMIP6 model) – (CAMS). Positive values indicate that the model overestimates methane concentrations relative to CAMS, while negative values reflect an underestimation.

3. Results

According to Figure 1 the highest mean methane concentrations for the study period in the troposphere, based on CAMS data (first row), are observed in the Northern Hemisphere, whereas lower concentrations are found in the Southern Hemisphere. In the Northern Hemisphere, between 30° N and 90° N, methane concentrations reach 1900–1950 ppbv at lower altitudes (near 1000 hPa), while elsewhere in the troposphere, they range from 1800 ppbv to roughly 1900 ppbv. In contrast, in the Southern Hemisphere, the mean methane concentrations in the troposphere generally vary between 1700 ppbv and 1800 ppbv, with the highest values occurring between 35° S and the Equator. Overall, tropospheric methane concentrations gradually decline, approaching 1600 ppbv in the upper troposphere (~100 hPa).
As shown in the middle column of Figure 1, the pattern of methane concentrations in the troposphere in the CNRM-ESM2.1 and GFDL-ESM4.1 models share several similarities. In the CNRM-ESM2.1 model, the concentrations range from 1800 ppbv to 1850 ppbv between 30° S and 30° N near the surface (~900 hPa). At higher latitudes, these values extend up to around 600 hPa. In the rest of the troposphere, concentrations range from 1750 ppbv to 1800 ppbv, while above 250 hPa, they drop below 1600 ppbv. In the GFDL-ESM4.1 model, a similar pattern is observed. However, the layer of 1800–1850 ppbv is more confined vertically and appears closer to the surface up to approximately 800 hPa, compared to the CNRM-ESM2.1 model. In the UKESM1 model, the mean methane concentrations in the troposphere generally range from 1750 ppbv to 1800 ppbv. However, certain regions exhibit lower values. In the Southern Hemisphere, near the surface (up to approximately 800 hPa), concentrations decline to between 1650 ppbv and 1750 ppbv. Furthermore, from 65° S and towards higher latitudes, the mean methane concentrations drop further, falling below 1600 ppbv. In the Northern Hemisphere, areas of reduced concentrations extend over a greater vertical range, reaching up to approximately 500 hPa. Between 20° N and 80° N, methane levels decrease to around 1600 ppbv. In the EC-Earth3-AerChem model, methane concentrations range from 1750 ppbv to 1900 ppbv in the Northern Hemisphere, with the highest values occurring at higher latitudes (especially north of 30° N). Concentrations decline with altitude, reaching below 1600 ppbv in the upper troposphere. In the Southern Hemisphere, methane concentrations in the troposphere range between 1700 and 1800 ppbv, with values falling below 1600 ppbv at higher latitudes around 200 hPa.
As seen in the right column of Figure 1, the pattern of differences in mean methane concentrations in the troposphere in the CNRM-ESM2.1 and GFDL-ESM4.1 models is similar. Both appear to underestimate methane concentrations in the Northern Hemisphere and overestimate them in the Southern Hemisphere. The negative bias is more pronounced near the surface (up to 800 hPa) from 30° N and northwards, ranging from approximately 80 ppbv to 100 ppbv. Between the Equator and 30° N, the negative bias is smaller, ranging from 0 ppbv to 60 ppbv. In high latitudes of the Northern Hemisphere, the bias decreases with increasing altitude but increases again above 300 hPa. In the Southern Hemisphere CNRM-ESM2.1 and GFDL-ESM4.1 models overestimate methane concentrations by about 60 ppbv, with the bias increasing toward the pole. In the high latitudes of the Southern Hemisphere, beginning at around 250 hPa, a shift to negative bias is observed, reaching up to 180 ppbv. The UKESM1 model shows a comparable bias pattern to CNRM-ESM2.1 and GFDL-ESM4.1 models. However, in the Southern Hemisphere, from 65° S to Antarctica and up to 500 hPa, a negative bias exceeding 200 ppbv is evident. Furthermore, from 30° S to the North Pole, near the surface and in some cases up to 500 hPa, similarly strong negative biases over 200 ppbv also exist. The differences in the mean methane concentrations between EC-Earth3-AerChem and CAMS reveal a global signal of the model’s underestimation in the troposphere. Specifically, from 10° S to 65° N, near the surface and up to 800 hPa, EC-Earth3-AerChem underestimates methane concentrations by as much as 60 ppbv. Elsewhere in the troposphere, the negative bias is around 20 ppbv, while around 250 hPa, it increases and exceeds 200 ppbv. Additionally, a distinct layer between 500 hPa and 250 hPa in the Northern Hemisphere shows a slight overestimation, with concentrations up to 29 ppbv higher than CAMS.
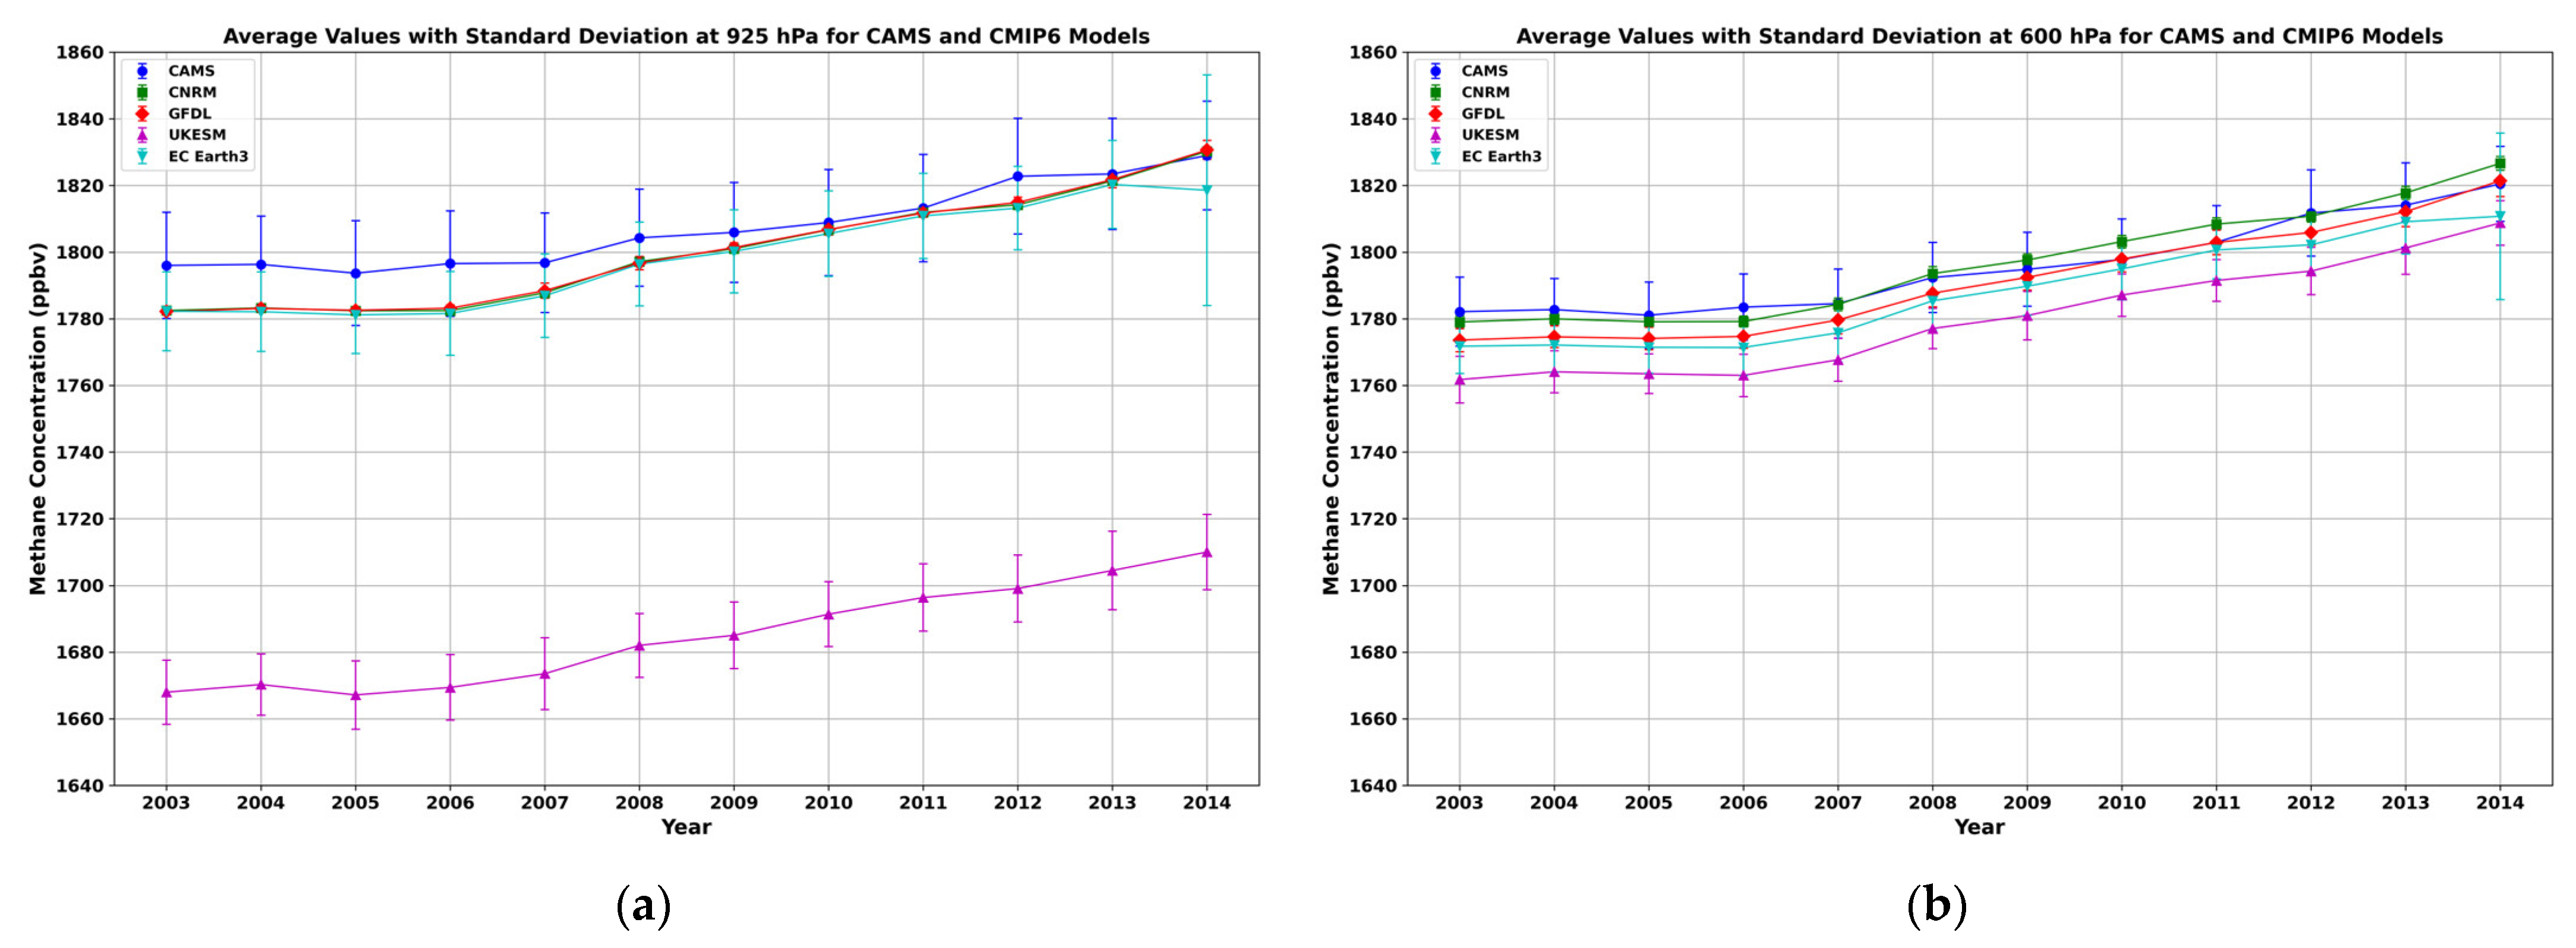
As shown in Figure 2a,b, a strong alignment of the EC-Earth3-AerChem, CNRM-ESM2-1, and GFDL-ESM4.1 models with CAMS is identified for the time evolution of annual global mean methane concentrations over the period 2003–2014 across two isobaric levels in the troposphere. More specifically, methane concentrations remain relatively stable during the first four to five years and then an increasing trend is observed. In addition, the standard deviation of CNRM-ESM2-1 and GFDL-ESM4.1 is small, while EC-Earth3-AerChem’s resembles that of CAMS. On the other hand, the UKESM1 model captures the year-to-year evolution but consistently underestimates methane concentrations relative to CAMS in the lower troposphere. This feature is more pronounced near the surface at 925 hPa (Figure 2a) and persists up to approximately 600 hPa (Figure 2b). At higher altitudes in the troposphere, UKESM1 continues to underestimate methane concentrations but the values are closer to the other models’ estimations.

4. Conclusions

The main purpose of this study is to assess CMIP6 Earth System Model simulations of methane concentrations in comparison with the CAMS reanalysis dataset during the period 2003–2014. In CAMS and EC-Earth3-AerChem, mean methane concentrations are higher in the Northern Hemisphere than in the Southern and decrease with altitude above 250 hPa. This results in a slight global underestimation, reaching as much as 20 ppbv up to 250 hPa, with slightly stronger bias near the surface in the Northern Hemisphere. Regarding the UKESM1, GFDL-ESM4.1, and CNRM-ESM2-1 models, they show steady methane concentrations globally, which decrease with altitude. Their bias relative to CAMS indicates a trend of underestimation in the Northern Hemisphere and overestimation in the Southern Hemisphere. Therefore, the mismatch of the North Hemisphere–South Hemisphere latitudinal gradient of CMIP6 models (except EC-Earth3-AerChem) versus CAMS reanalysis data is possibly attributed to the way the lower boundary conditions are specified in the models. Specifically, all ESMs (except EC-Earth3-AerChem) do not capture the North Hemisphere–South Hemisphere latitudinal gradient of CAMS reanalysis, because surface methane at all grid cells is nudged to a global mean value even though CH4 is allowed to advect and react with OH [14]. In contrast, the EC-Earth3-AerChem model nudges methane toward zonal mean values rather than global mean, so it appears to better capture the North Hemisphere–South Hemisphere latitudinal gradient.

Author Contributions

Conceptualization, P.Z.; methodology, P.Z. and S.E.P.; software and analysis, S.E.P. and A.K.; writing—original draft preparation, S.E.P.; writing—review and editing, P.Z. and A.K.; visualization, S.E.P.; supervision, P.Z. All authors have read and agreed to the published version of the manuscript.

Funding

This research received no external funding.

Institutional Review Board Statement

Not applicable.

Informed Consent Statement

Not applicable.

Data Availability Statement

All model data used in this study are freely available from the CMIP6 repository on the Earth System Grid Federation nodes which was last accessed on 5 March 2025 (https://esgf-node.llnl.gov/search/cmip6/). The reanalysis data are freely available from the Climate System and was last accessed on 17 March 2025 (https://esgf-metagrid.cloud.dkrz.de/search).

Acknowledgments

The authors acknowledge the World Climate Research Program, which promoted and coordinated CMIP6 through its Working Group on Coupled Modeling. The authors thank the climate modelling groups for producing and making available the GFDL-ESM4.1, UKESM1, CNRM-ESM2-1, and EC-Earth3-AerChem model outputs, the Earth System Grid Federation (ESGF) for archiving the data and providing access, and the multiple funding agencies who support CMIP6 and ESGF.

Conflicts of Interest

The authors declare no conflicts of interest.

References

  1. Importance of Methane|US EPA. Available online: https://www.epa.gov/gmi/importance-methane (accessed on 25 May 2025).
  2. Ehhalt, D.H. The atmospheric cycle of methane. Tellus 1974, 26, 58–70. [Google Scholar] [CrossRef]
  3. Brasseur, G.P.; Solomon, S. Aeronomy of the Middle Atmosphere; Springer: Dordrecht, The Netherlands, 2005; Volume 32. [Google Scholar] [CrossRef]
  4. le Texier, H.; Solomon, S.; Garcia, R.R. The role of molecular hydrogen and methane oxidation in the water vapour budget of the stratosphere. Q. J. R. Meteorol. Soc. 1988, 114, 281–295. [Google Scholar] [CrossRef]
  5. Curry, C.L. Modeling the soil consumption of atmospheric methane at the global scale. Glob. Biogeochem. Cycles 2007, 21. [Google Scholar] [CrossRef]
  6. Dutaur, L.; Verchot, L.V. A global inventory of the soil CH4 sink. Glob. Biogeochem. Cycles 2007, 21, 4013. [Google Scholar] [CrossRef]
  7. Allan, W.; Struthers, H.; Lowe, D.C. Methane carbon isotope effects caused by atomic chlorine in the marine boundary layer: Global model results compared with Southern Hemisphere measurements. J. Geophys. Res. Atmos. 2007, 112, 4306. [Google Scholar] [CrossRef]
  8. Thornton, J.A.; Kercher, J.P.; Riedel, T.P.; Wagner, N.L.; Cozic, J.; Holloway, J.S.; Dubé, W.P.; Wolfe, G.M.; Quinn, P.K.; Middlebrook, A.M.; et al. A large atomic chlorine source inferred from mid-continental reactive nitrogen chemistry. Nature 2010, 464, 271–274. [Google Scholar] [CrossRef] [PubMed]
  9. Collins, J.W.; Lamarque, J.-F.; Schulz, M.; Boucher, O.; Eyring, V.; Hegglin, M.I.; Maycock, A.; Myhre, G.; Prather, M.; Shindell, D.; et al. AerChemMIP: Quantifying the effects of chemistry and aerosols in CMIP6. Geosci. Model Dev. 2017, 10, 585–607. [Google Scholar] [CrossRef]
  10. Séférian, R.; Nabat, P.; Michou, M.; Saint-Martin, D.; Voldoire, A.; Colin, J.; Decharme, B.; Delire, C.; Berthet, S.; Chevallier, M.; et al. Evaluation of CNRM Earth System Model, CNRM-ESM2-1: Role of Earth System Processes in Present-Day and Future Climate. J. Adv. Model. Earth Syst. 2019, 11, 4182–4227. [Google Scholar] [CrossRef]
  11. Horowitz, L.W.; Naik, V.; Paulot, F.; Ginoux, P.A.; Dunne, J.P.; Mao, J.; Schnell, J.; Chen, X.; He, J.; John, J.G.; et al. The GFDL Global Atmospheric Chemistry-Climate Model AM4.1: Model Description and Simulation Characteristics. J. Adv. Model. Earth Syst. 2020, 12, e2019MS002032. [Google Scholar] [CrossRef]
  12. Sellar, A.A.; Jones, C.G.; Mulcahy, J.P.; Tang, Y.; Yool, A.; Wiltshire, A.; O’COnnor, F.M.; Stringer, M.; Hill, R.; Palmieri, J.; et al. UKESM1: Description and Evaluation of the U.K. Earth System Model. J. Adv. Model. Earth Syst. 2019, 11, 4513–4558. [Google Scholar] [CrossRef]
  13. Van Noije, T.; Bergman, T.; Le Sager, P.; O'DOnnell, D.; Makkonen, R.; Gonçalves-Ageitos, M.; Döscher, R.; Fladrich, U.; von Hardenberg, J.; Keskinen, J.-P.; et al. EC-Earth3-AerChem: A global climate model with interactive aerosols and atmospheric chemistry participating in CMIP6. Geosci. Model Dev. 2021, 14, 5637–5668. [Google Scholar] [CrossRef]
  14. Griffiths, P.T.; Murray, L.T.; Zeng, G.; Shin, Y.M.; Abraham, N.L.; Archibald, A.T.; Deushi, M.; Emmons, L.K.; Galbally, I.E.; Hassler, B.; et al. Tropospheric ozone in CMIP6 simulations. Atmos. Chem. Phys. 2021, 21, 4187–4218. [Google Scholar] [CrossRef]
  15. Meinshausen, M.; Vogel, E.; Nauels, A.; Lorbacher, K.; Meinshausen, N.; Etheridge, D.M.; Fraser, P.J.; Montzka, S.A.; Rayner, P.J.; Trudinger, C.M.; et al. Historical greenhouse gas concentrations for climate modelling (CMIP6). Geosci. Model Dev. 2017, 10, 2057–2116. [Google Scholar] [CrossRef]
  16. Folberth, G.A.; Staniaszek, Z.; Archibald, A.T.; Gedney, N.; Griffiths, P.T.; Jones, C.D.; O’cOnnor, F.M.; Parker, R.J.; Sellar, A.A.; Wiltshire, A. Description and Evaluation of an Emission-Driven and Fully Coupled Methane Cycle in UKESM1. J. Adv. Model. Earth Syst. 2022, 14, e2021MS002982. [Google Scholar] [CrossRef]
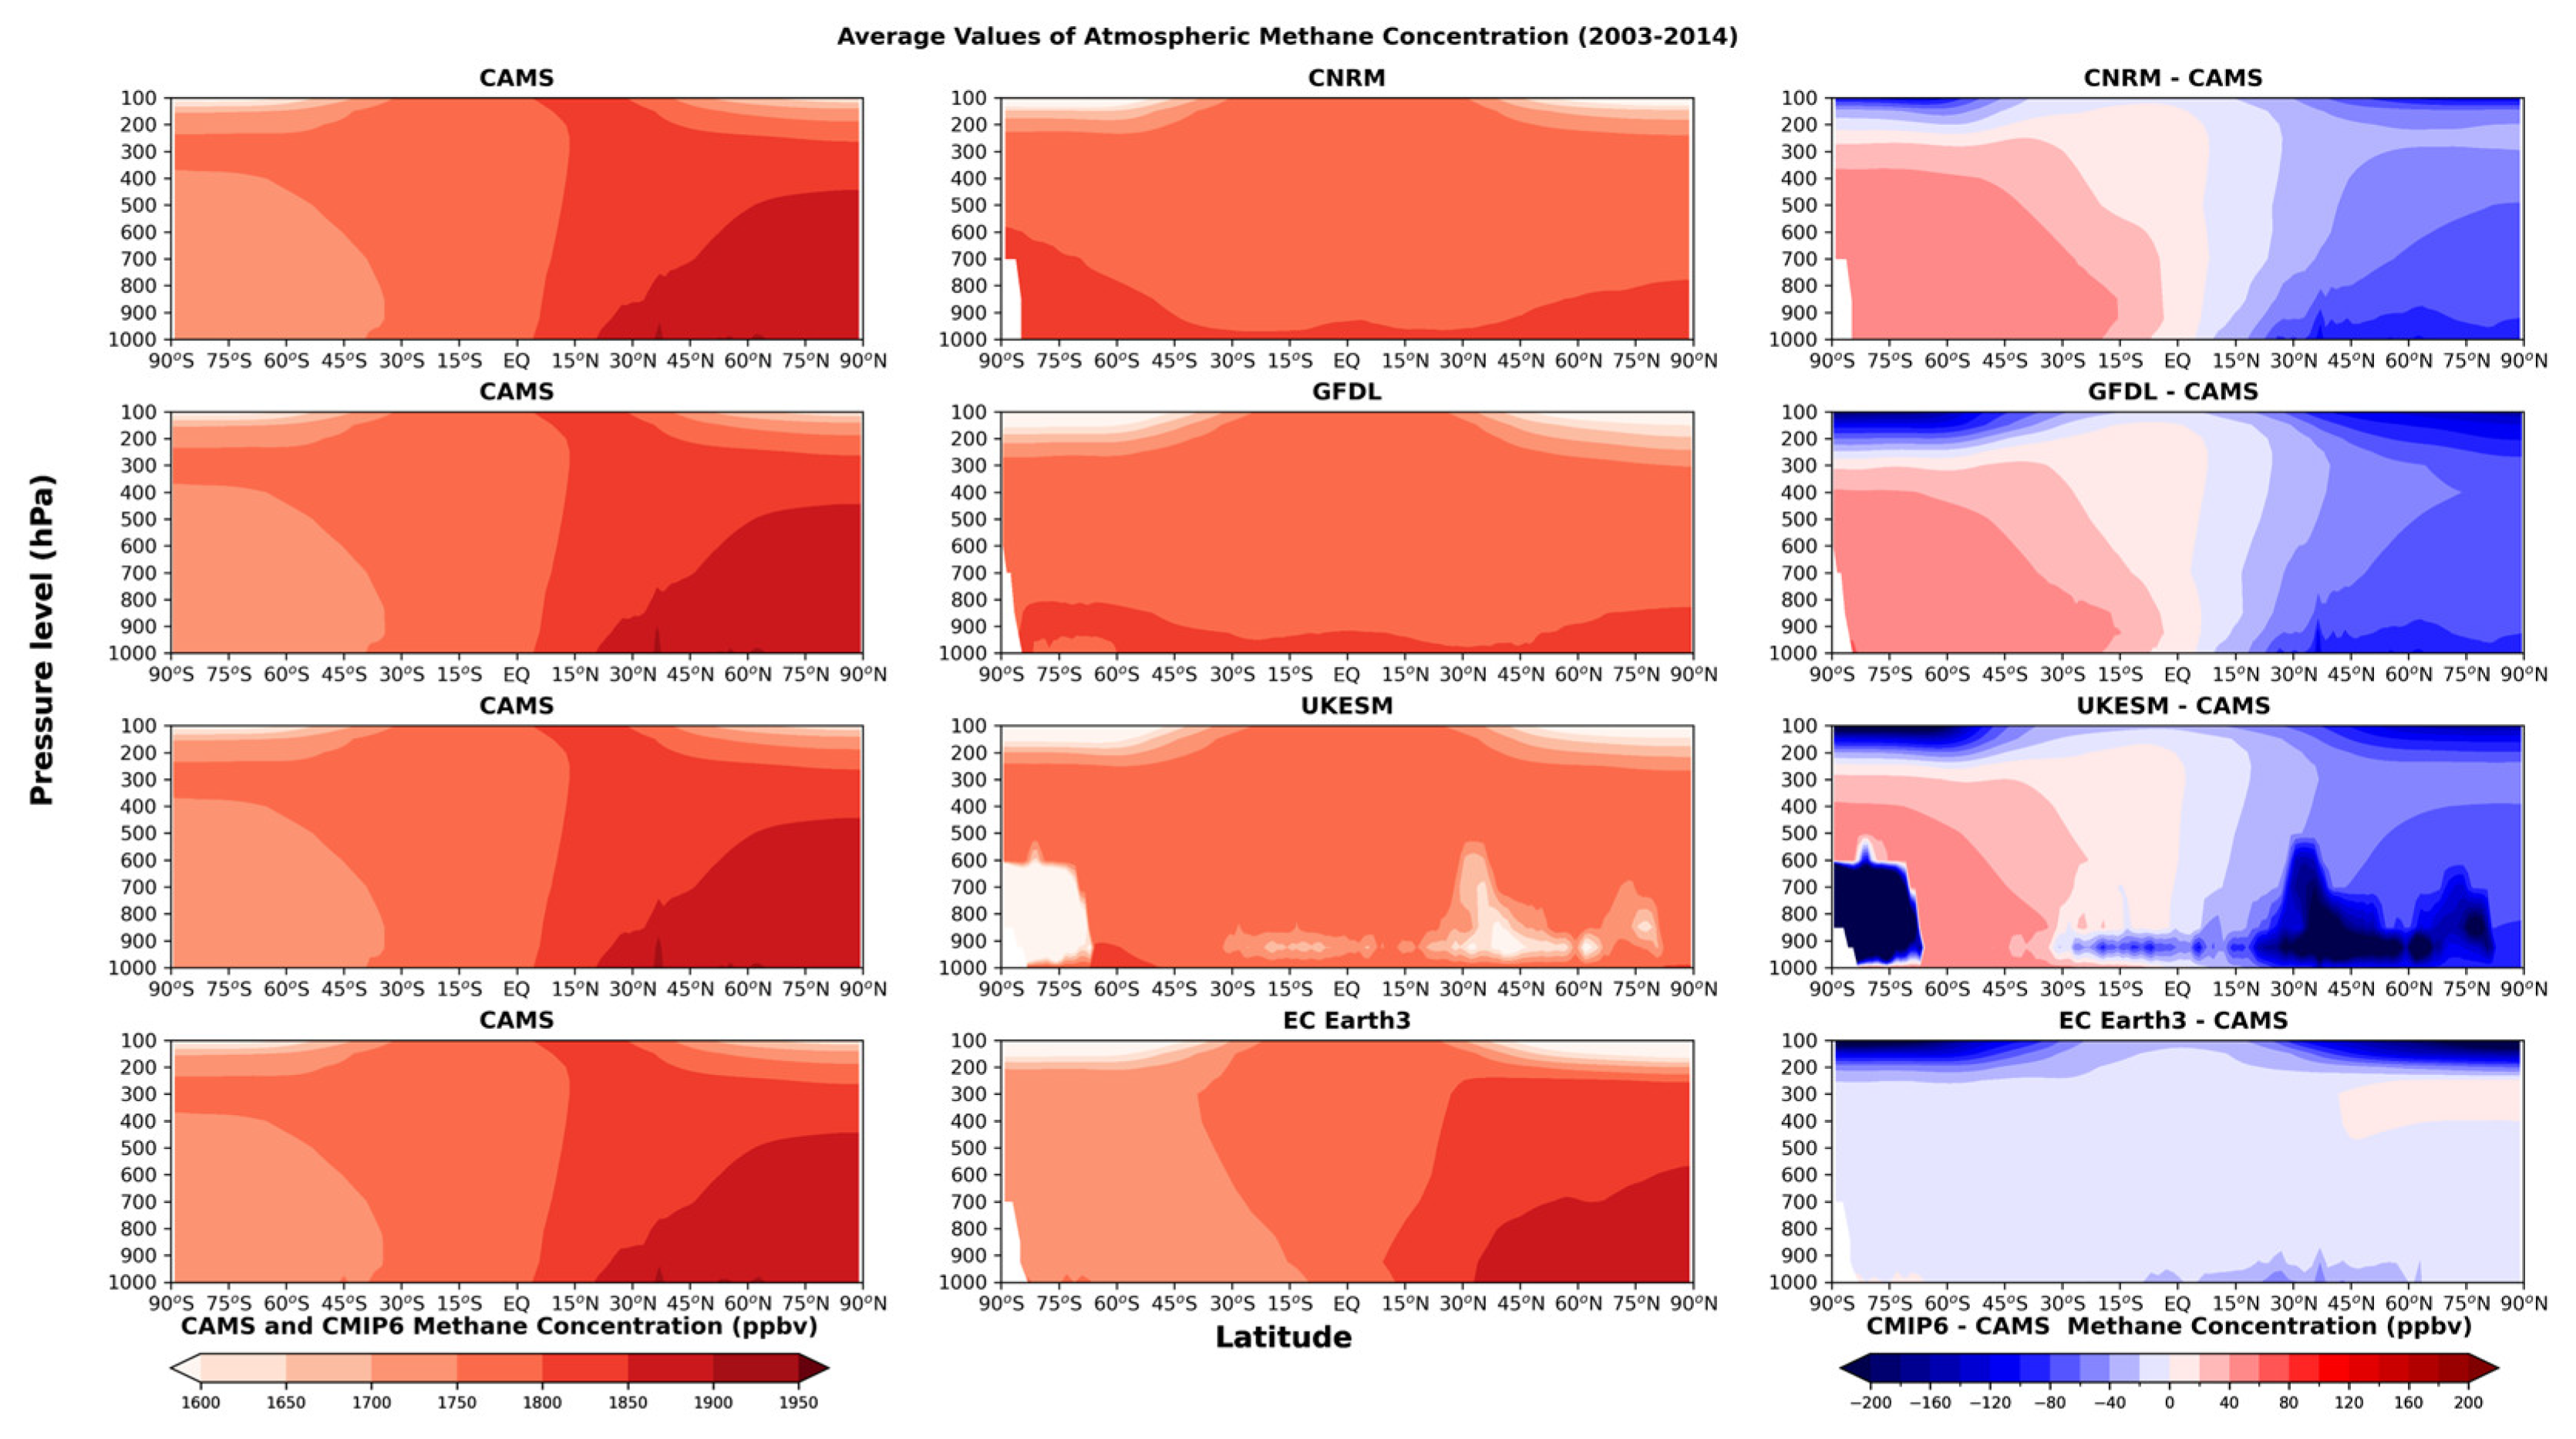
Figure 1. Zonally averaged latitude–pressure cross sections of methane concentrations in the CAMS dataset (left column), in CMIP6 models (middle column), and their differences (right column) for the period 2003–2014.
Eesp 35 00015 g001
Figure 2. Time series of annual global mean methane concentrations with standard deviation bars for CAMS dataset and each CMIP6 model at the isobaric level of (a) 925 hPa and (b) 600 hPa.
Eesp 35 00015 g002
Disclaimer/Publisher’s Note: The statements, opinions and data contained in all publications are solely those of the individual author(s) and contributor(s) and not of MDPI and/or the editor(s). MDPI and/or the editor(s) disclaim responsibility for any injury to people or property resulting from any ideas, methods, instructions or products referred to in the content.