1. Introduction
Cyprus is recognised as part of the southeastern Mediterranean climate change hotspot. Several studies, examining different models under climate change scenarios, have highlighted that Cyprus is projected to experience extreme hot weather, mainly in summer, and a pronounced drier climate regime, especially during the wet period [
1,
2,
3].
The present study focuses on the Troodos Mountains, as this region belongs to one of the demonstration pilot areas involved in the Regions4Climate (R4C) European project (
https://regions4climate.eu/, accessed on 20 March 2025). Cyprus embraces efforts to diversify its tourism sector by promoting the region of Troodos as a major attraction and must-visit destination. Whilst considering the impacts of future climate change and the need for socially inclusive development, it is imperative that tourism in rural areas be promoted in a way that protects both the natural environment that attracts tourists and rural communities.
Within this context, the major objective of the present work is to investigate the projected changes in risk climate indicators associated with socio-economic activities. This is achieved by using CORDEX climate datasets and focusing on two different climate scenarios, RCP4.5 and RCP8.5, until 2065. This preliminary work is part of efforts to develop a sustainable tourism model in the Troodos Mountains region.
2. Materials and Methods
2.1. Study Area
The Troodos mountains (
Figure 1) are located in the centre of Cyprus and cover an area of 1476.8 km
2. Mount Olympus, the highest peak of the Troodos Mountains, has an elevation of 1952 m above mean sea level. The primary activities in the Troodos region are handicrafts, which boost tourism, and agriculture, which includes vineyards and other crops associated with traditional products.
2.2. Model Data and Methodology
For the climate risk assessment, climate datasets of daily minimum and maximum temperatures, precipitation rate, wind speed mean and gusts, snow depth, and relative humidity were retrieved from the RCA4 regional climate model, developed by the Swedish Meteorological and Hydrological Institute (SMHI) [
4], driven by the coupled Max Planck Institute Earth System Model (MPI-ESM-LR) [
5], at a spatial resolution of 0.11° × 0.11° (about 12 km). The climate datasets were available from the EURO-CORDEX project, for the historical period of 1976–2005 and two future periods, the near future (2006–2035), and the intermediate future (2036–2065), under two emission scenarios, RCP4.5 and RCP8.5 [
6,
7].
The following indicators, which are summarised in
Table 1, were determined following careful consideration of the hazards that the demonstration area has encountered over the years. These indicators identify specific climate hazards that can affect different sectors, such as drought, heatwaves, forest fires, etc.
These indicators included climate means and specific climate change indices by the ETCCDI (
https://etccdi.pacificclimate.org/index.shtml, accessed on 22 June 2024), namely, the Canadian Fire Weather Index (FWI), developed by [
8], estimated for fire weather risk assessment based on EFFIS classification, the Humidex, and Effective Temperature [
9] for thermal human discomfort due to high temperatures, and drought characteristics based on the 6-, 12-month scale Standardised Precipitation Evapotranspiration Index (SPEI, [
10]) for meteorological and agricultural drought. Finally, the energy demand of the buildings was assessed through HDD and CDD, where base temperature (Tbase) was selected according to the Cyprus Energy Regulation Authority (CERA).
Post-processing, calculation of the hazard indicators, and spatial representation of the results were performed using the R programming language.
3. Results and Discussion
Due to space constraints, a subset of the calculated indices is presented and analysed in this section.
In
Figure 2, the number of frost days for the historical period (
Figure 2A) is presented, compared to the near future period (2006–2035) and the intermediate future (2036–2065) under RCP4.5 (
Figure 2B,C), and RCP8.5 (
Figure 2D,E). As expected, the number of days with the minimum temperature below 0 °C decreases significantly in the future in the mountainous region of Troodos. The projected changes indicate that the highest decrease in the number of frost days is detected in the Troodos Mountains under both future periods and scenarios, with the highest values found in the intermediate future in both scenarios of the region of interest.
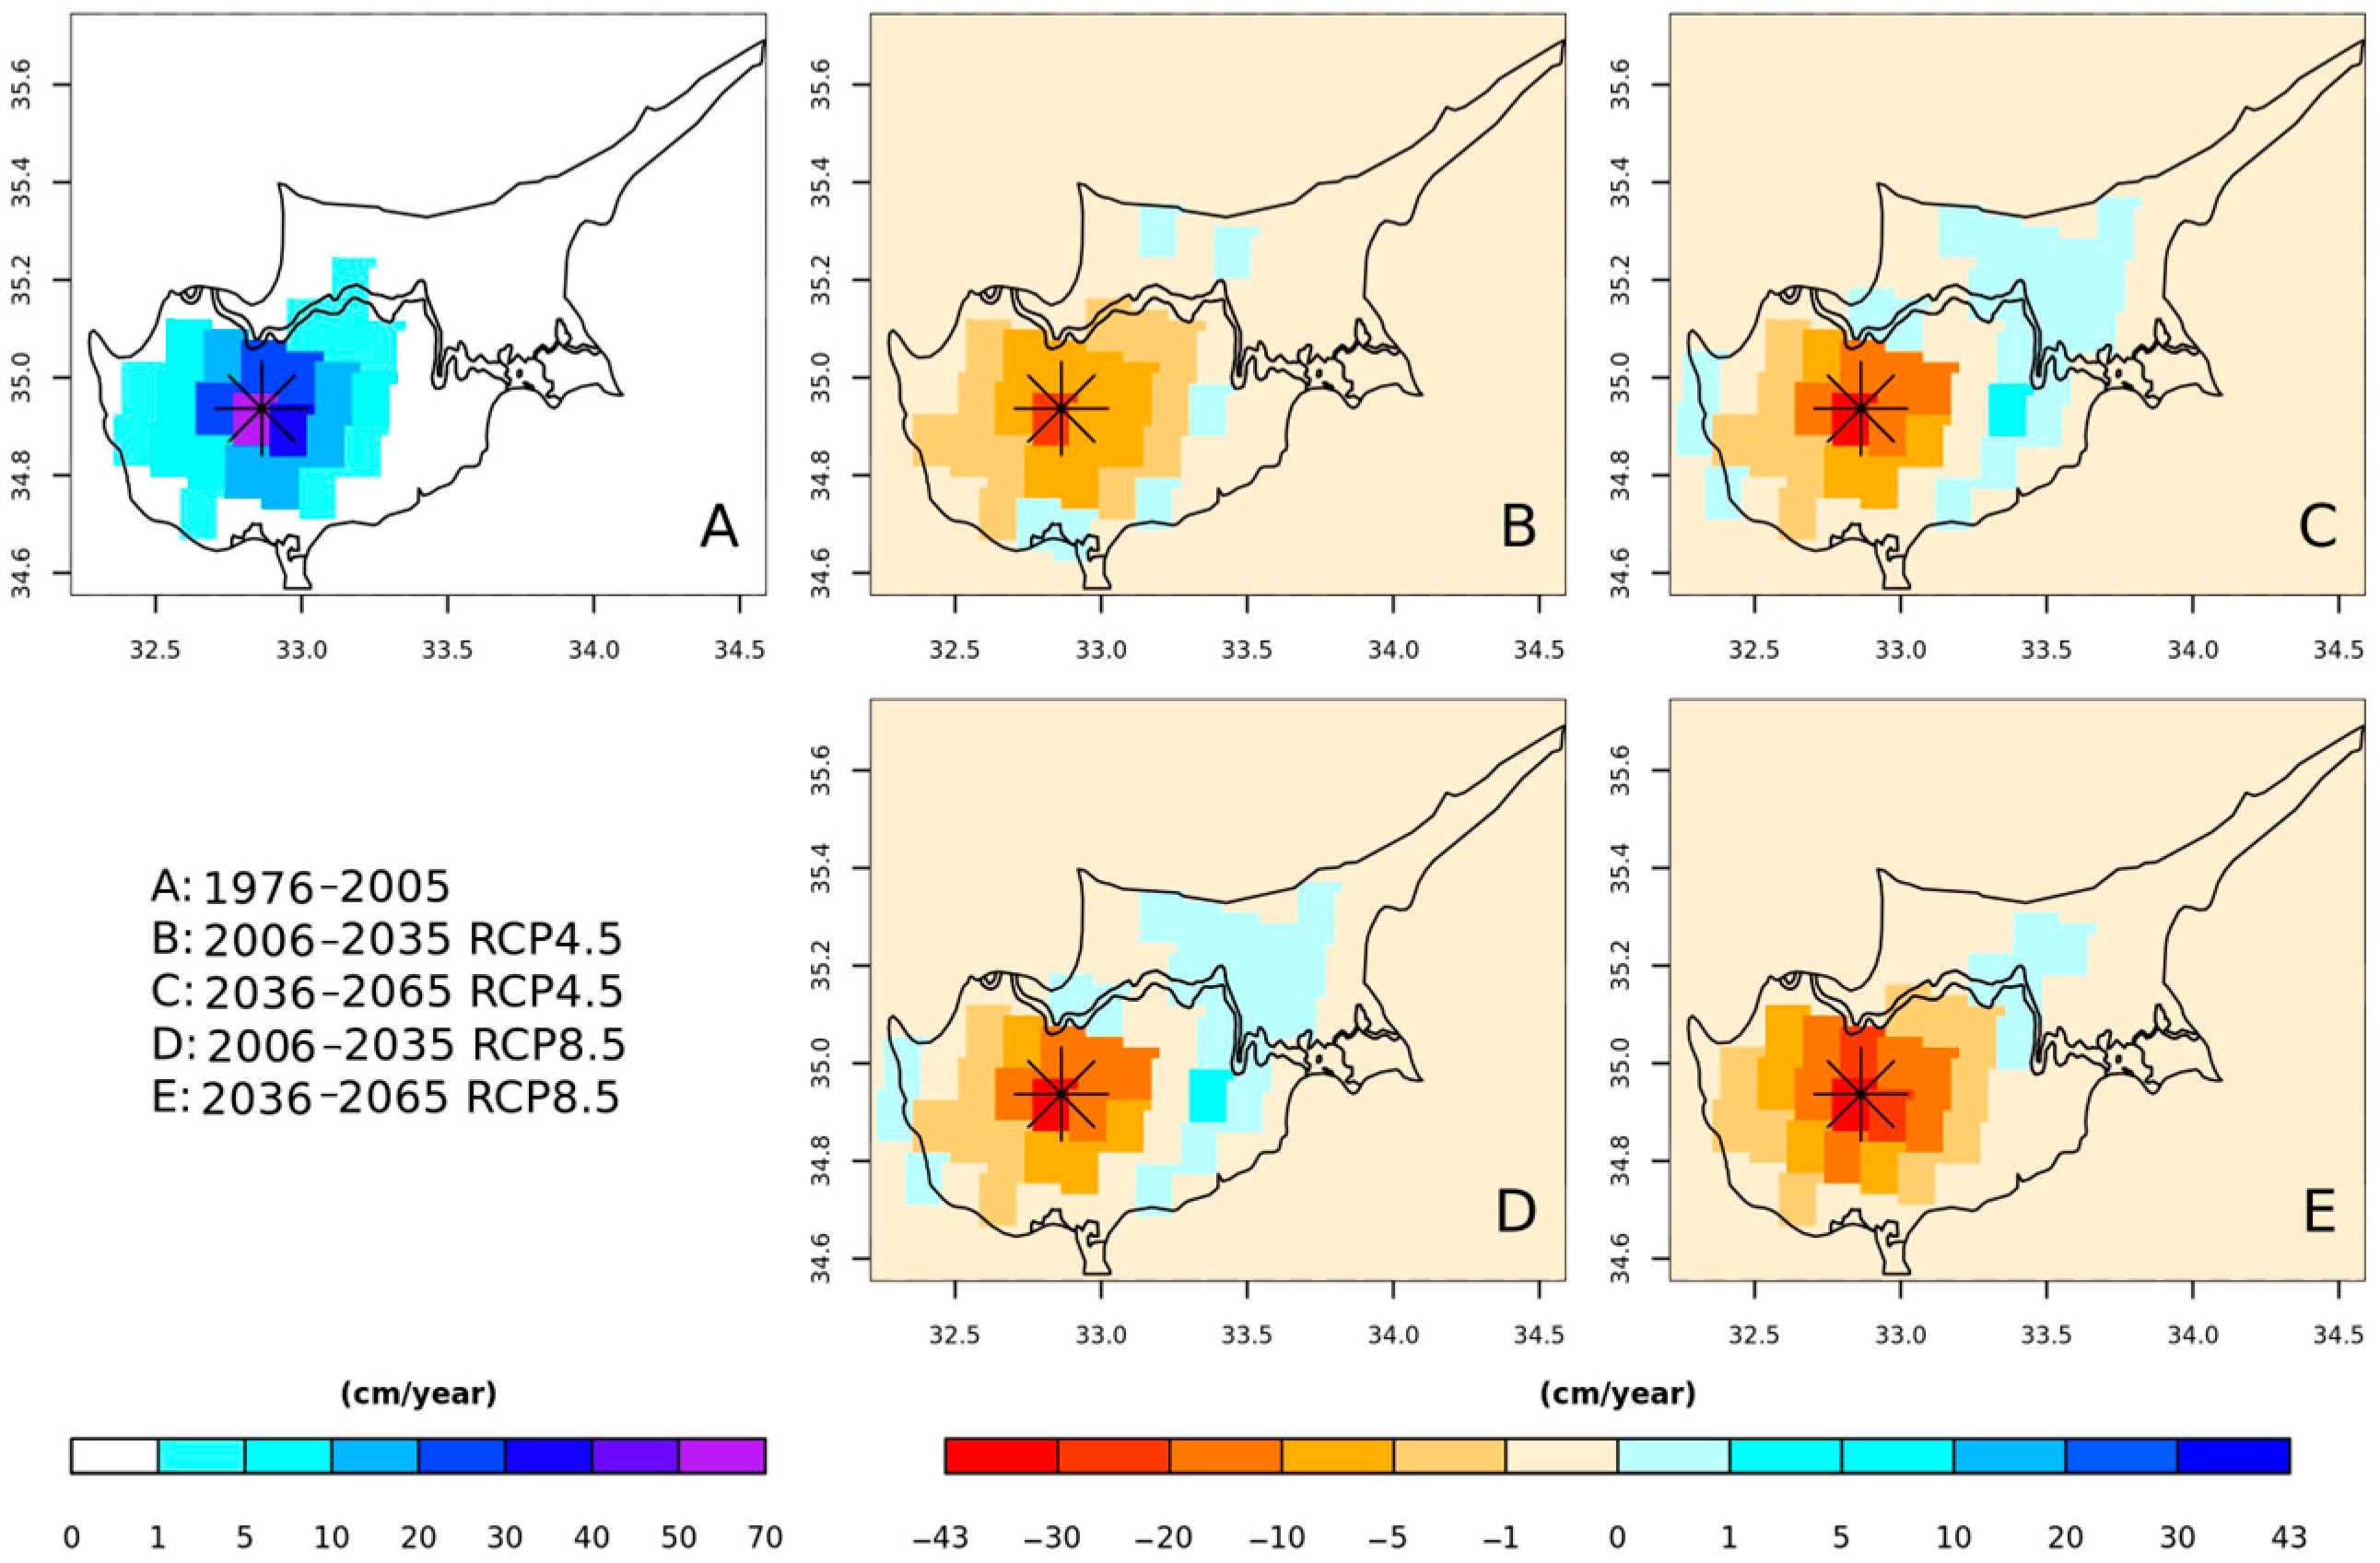
Figure 3 shows the mean sum of the annual snow depth for the historical period as well as the changes that are projected in the two future periods. During the historical period, the high elevation areas of the Troodos Mountains had the highest amounts of snow. Future projections showed a significant reduction in snow depth in the region of the Troodos Mountains, and particularly at the top of the mountain (up to 45 cm/yr) under all scenarios and periods. A greater decrease was also found to cover a larger area in the intermediate future under both scenarios.
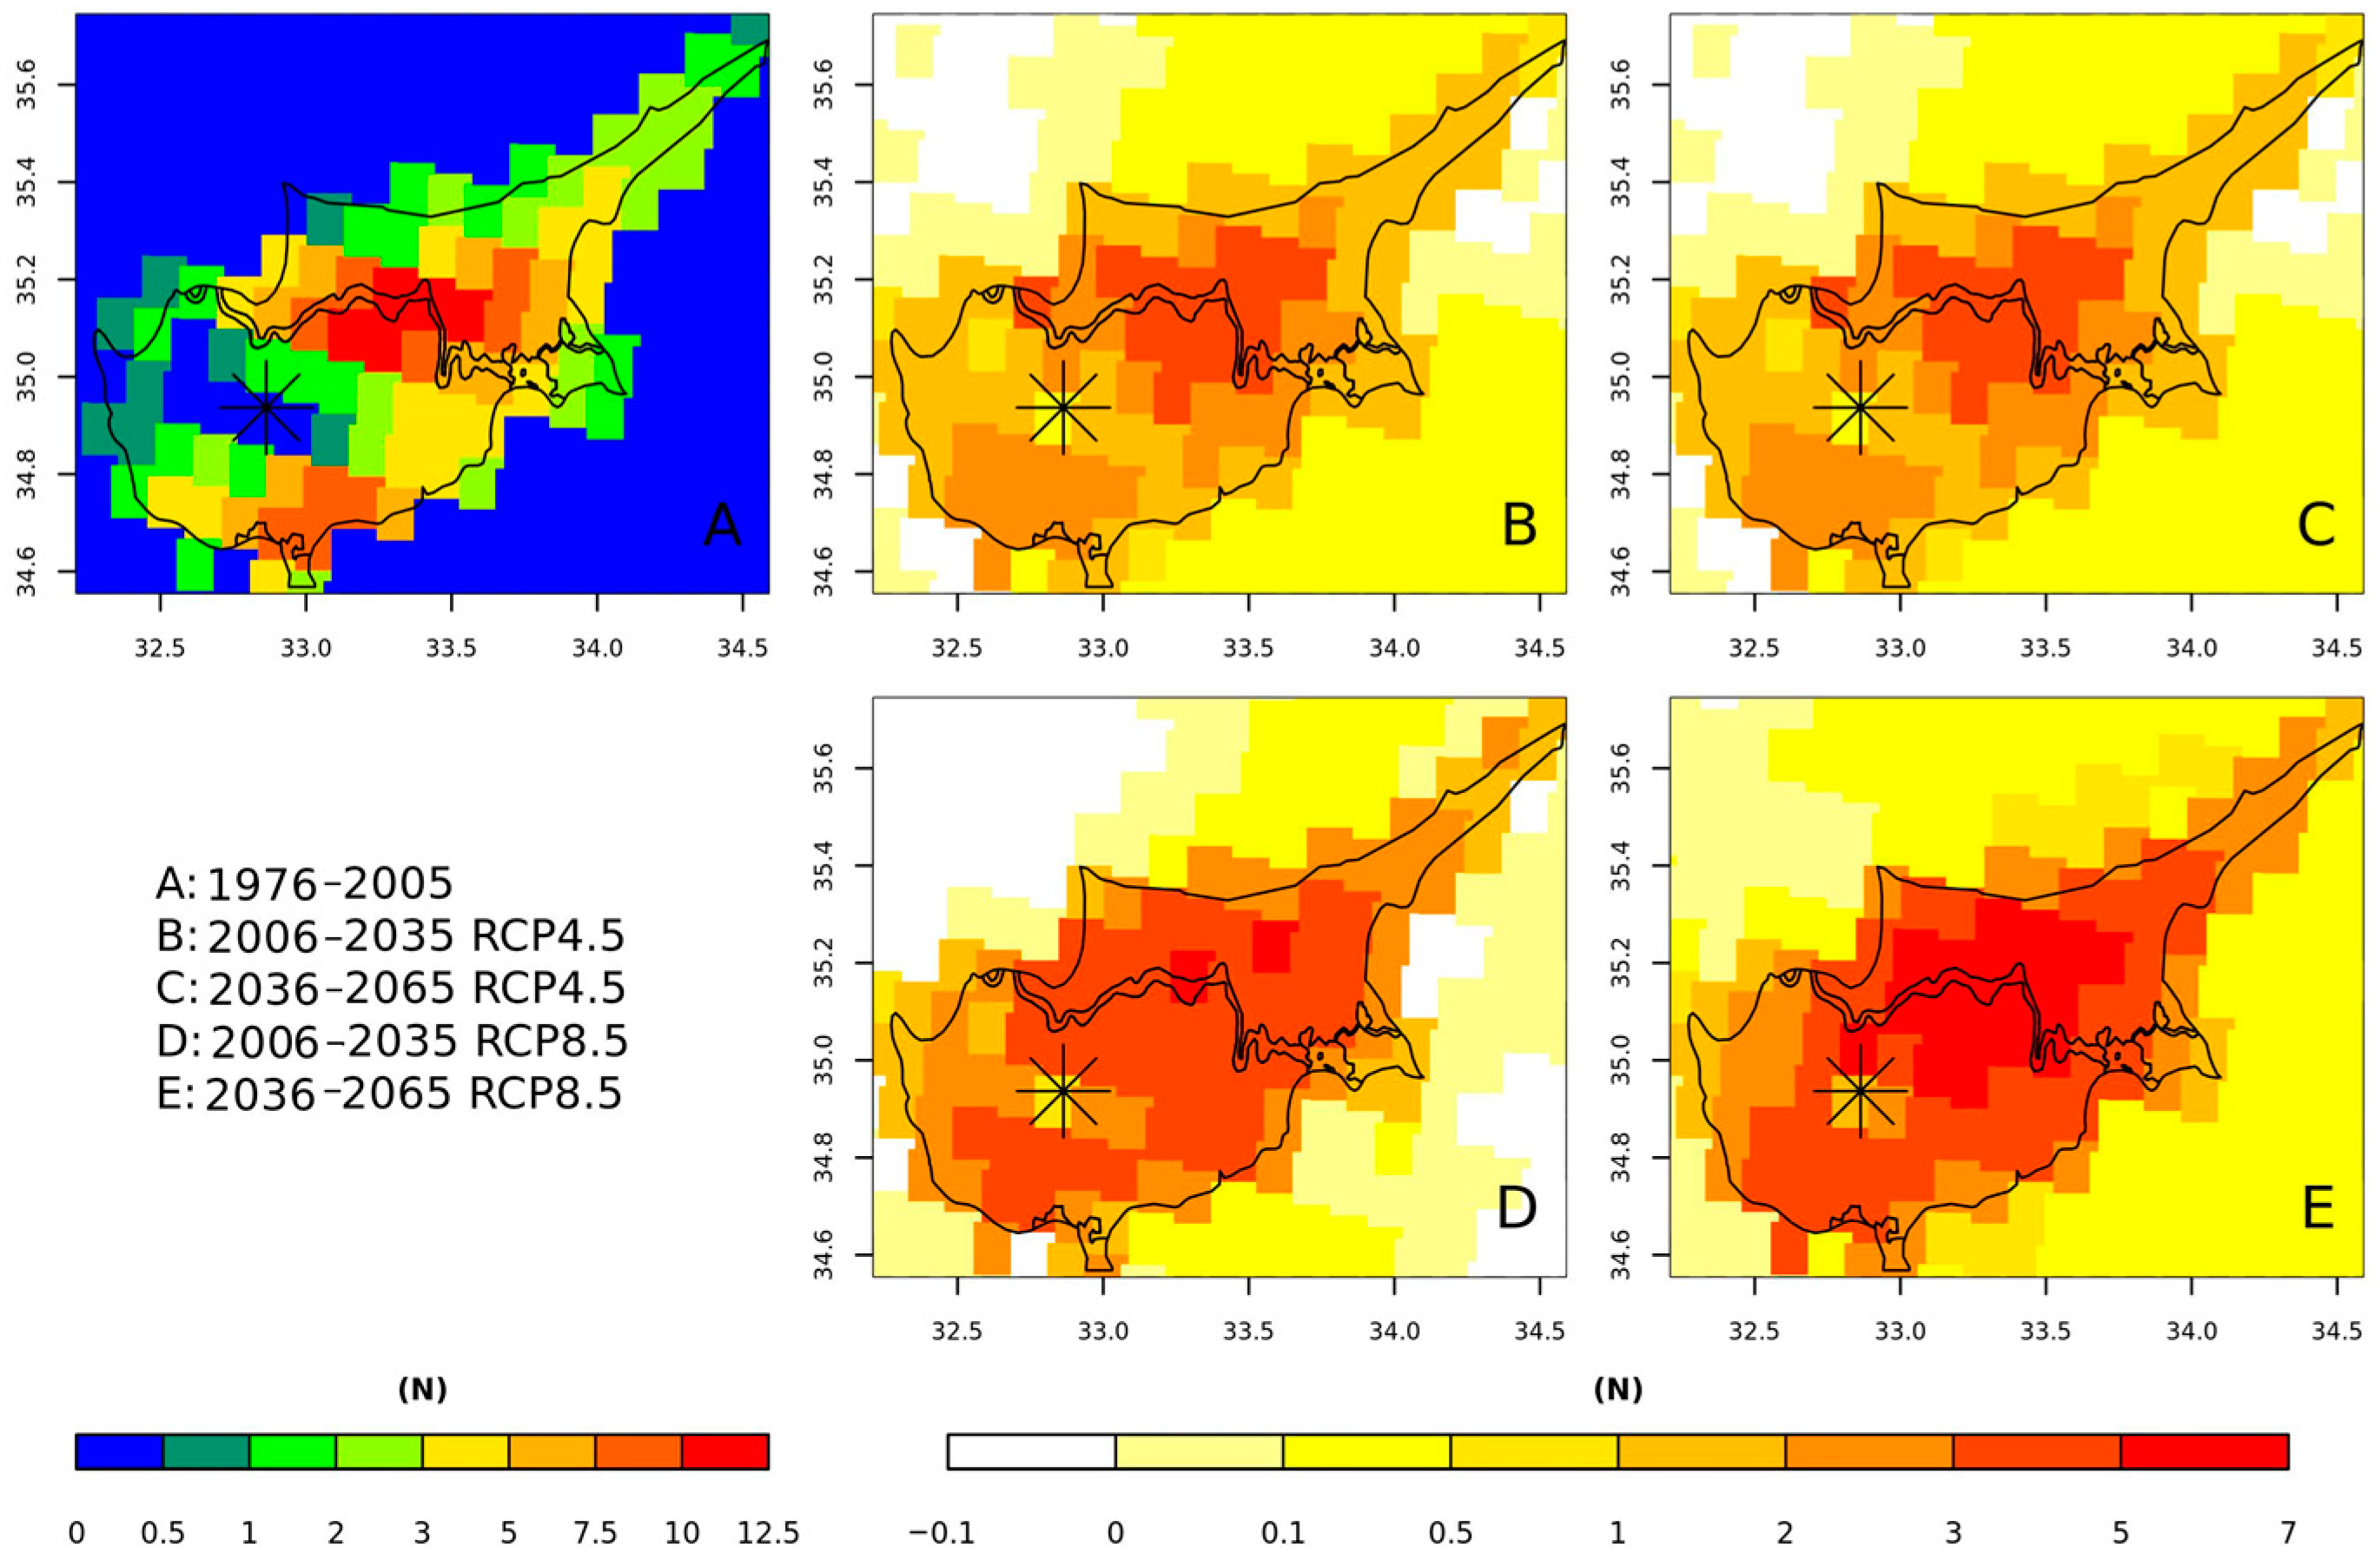
Figure 4 illustrates the evaluation of the fire weather risk assessment using the mean annual number of days with extreme fire danger over the historical period and the absolute future changes under RCP4.5 and RCP8.5. An increase in extreme fire danger days was observed for the two periods and under both scenarios, with the greatest increase observed under RCP8.5.
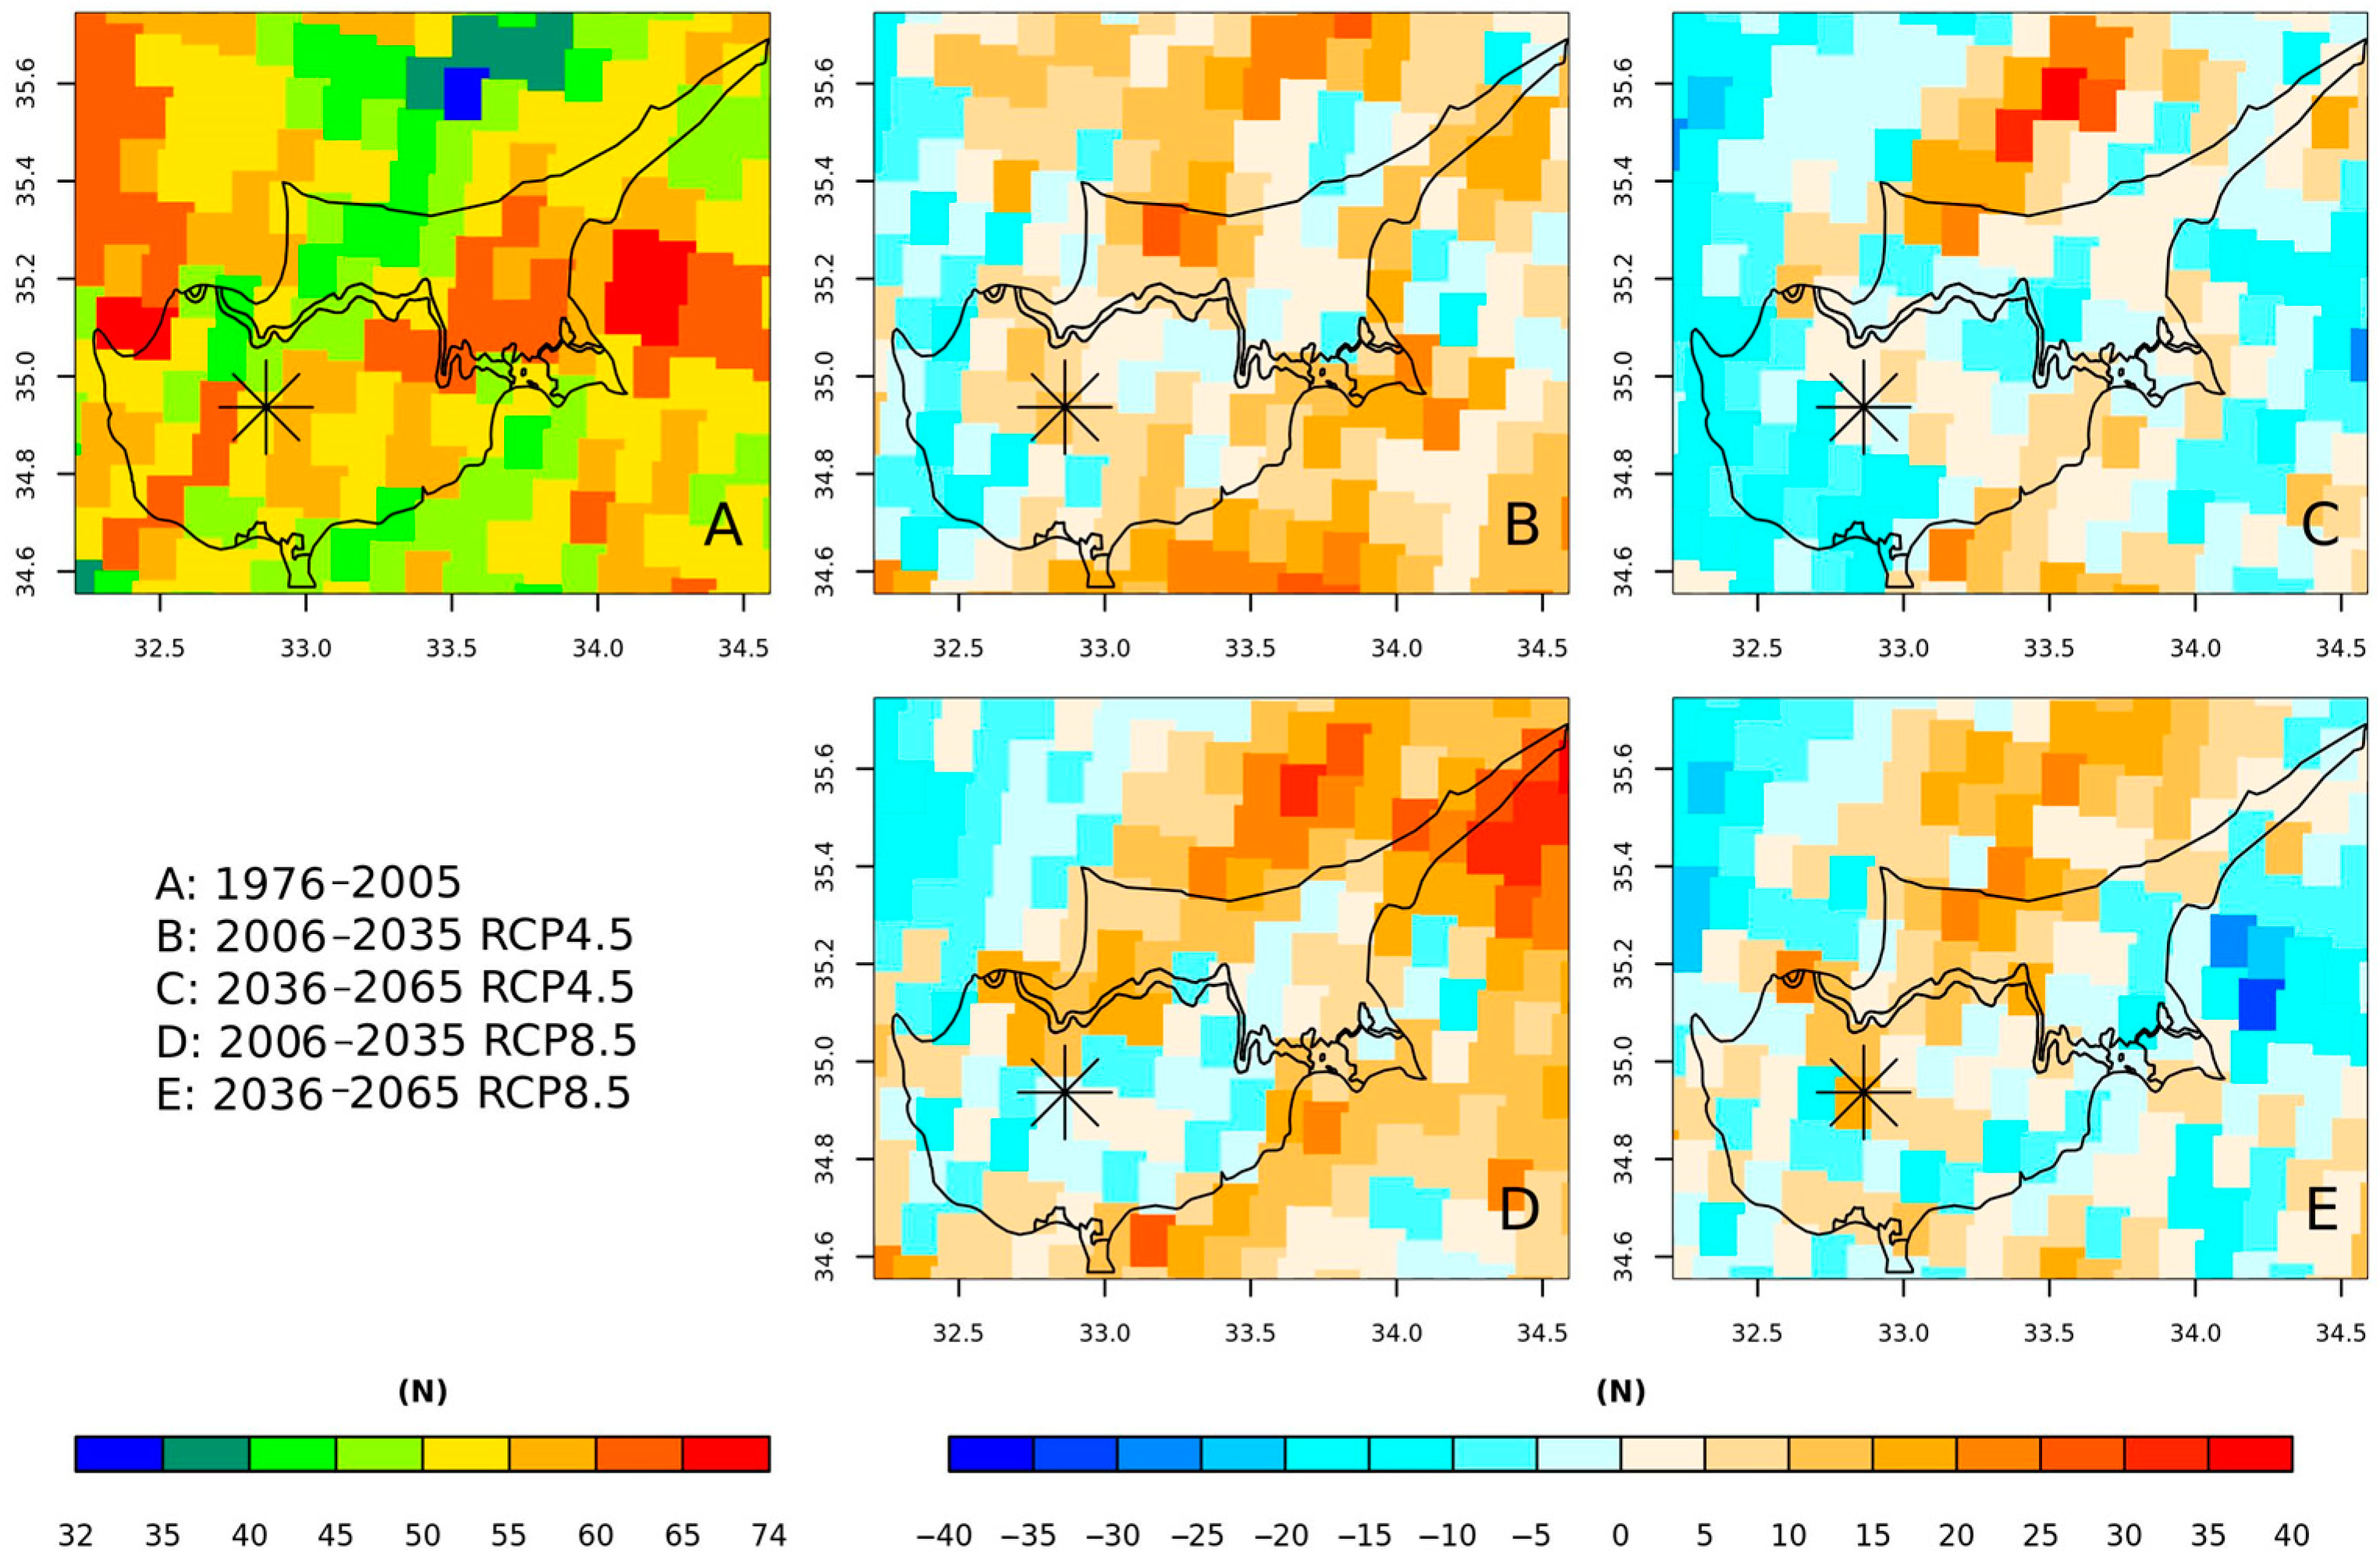
Regarding drought risk assessment, the severity and duration of drought were estimated based on the 12-month scale SPEI, which can evaluate the impact of droughts on agriculture, water resources, and ecosystems. The results in
Figure 5 and
Figure S1 (of the
Supplementary Materials) demonstrate that under RCP4.5, only some areas of the southeast in the future are projected to experience longer and more severe drought conditions, while other areas of the northern and central parts of the Troodos Mountains are estimated to face longer and more severe drought conditions, in both future periods and scenarios. The most severe and prolonged drought (up to 20 months) was detected in the highest elevation parts of the Troodos Mountains under RCP4.5 in the near future and under RCP8.5 in the intermediate future.
The presented study provides an overview of the climate risk assessment of the Troodos Mountains region and highlights some of the main findings based on specific climate indicators associated with the impact on different socio-economic, ecosystem, and agricultural sectors. Overall, the spatial representation of the analysed indicators shows that the Troodos region will be seriously affected by climate change in the coming years. In particular, the future changes in the indicators highlight the reduction in the number of frost days, followed by the reduction in snow depth, which affects both human and natural systems in mountainous regions. The increasing fire weather risk, compounded by increasing drought conditions, could have significant impacts, including water resource management challenges and potential damage to ecosystems, which should be considered as a matter of urgency in the development of a sustainable tourism model.
Supplementary Materials
The following supporting information can be downloaded at
https://www.mdpi.com/article/10.3390/eesp2025035014/s1. Figure S1: Drought severity (score) for the (A) historical period (1976–2005) and future changes in the near future period (2006–2035) under (B) RCP4.5 and (D) RCP8.5 and the intermediate future (2036–2065) under (C) RCP4.5 and (E) RCP8.5.
Author Contributions
Conceptualisation, A.S. and L.M.S.; methodology, A.S. and L.M.S.; software, I.M. and N.P.; validation, A.S., I.M., and N.P.; formal analysis, I.M.; data curation, I.M. and N.P.; writing—original draft preparation, N.P.; writing—review and editing, D.V.; visualisation, I.M.; supervision, A.S. and D.V.; project administration, A.S. All authors have read and agreed to the published version of the manuscript.
Funding
This research was partially funded by the Regions4Climate (R4C) project, Grant Agreement 101093873 (HORIZON-MISS-2021-CLIMA-02).
Institutional Review Board Statement
Not applicable.
Informed Consent Statement
Not applicable.
Data Availability Statement
Conflicts of Interest
Louisa M. Shakou was employed by Cyprus Energy Agency and declare that the research was conducted in the absence of any commercial or financial relationships that could be construed as a potential conflict of interest.
References
- Zittis, G.; Hadjinicolaou, P.; Klangidou, M.; Proestos, Y.; Lelieveld, J. A Multi-Model, Multi-Scenario, and Multi-Domain Analysis of Regional Climate Projections for the Mediterranean. Reg. Environ. Change 2019, 19, 2621–2635. [Google Scholar] [CrossRef]
- Lazoglou, G.; Hadjinicolaou, P.; Sofokleous, I.; Bruggeman, A.; Zittis, G. Climate Change and Extremes in the Mediterranean Island of Cyprus: From Historical Trends to Future Projections. Environ. Res. Commun. 2024, 6, 95020. [Google Scholar] [CrossRef]
- Zittis, G.; Almazroui, M.; Alpert, P.; Ciais, P.; Cramer, W.; Dahdal, Y.; Fnais, M.; Francis, D.; Hadjinicolaou, P.; Howari, F.; et al. Climate Change and Weather Extremes in the Eastern Mediterranean and Middle East. Rev. Geophys. 2022, 60, e2021RG000762. [Google Scholar] [CrossRef]
- Strandberg, G.; Kjellström, E.; Poska, A.; Wagner, S.; Gaillard, M.-J.; Trondman, A.-K.; Mauri, A.; Davis, B.A.S.; Kaplan, J.O.; Birks, H.J.B.; et al. Regional Climate Model Simulations for Europe at 6 and 0.2 k BP: Sensitivity to Changes in Anthropogenic Deforestation. Clim. Past. 2014, 10, 661–680. [Google Scholar] [CrossRef]
- Giorgetta, M.A.; Jungclaus, J.; Reick, C.H.; Legutke, S.; Bader, J.; Böttinger, M.; Brovkin, V.; Crueger, T.; Esch, M.; Fieg, K.; et al. Climate and Carbon Cycle Changes from 1850 to 2100 in MPI-ESM Simulations for the Coupled Model Intercomparison Project Phase 5. J. Adv. Model. Earth Syst. 2013, 5, 572–597. [Google Scholar] [CrossRef]
- Riahi, K.; Rao, S.; Krey, V.; Cho, C.; Chirkov, V.; Fischer, G.; Kindermann, G.; Nakicenovic, N.; Rafaj, P. RCP 8.5-A Scenario of Comparatively High Greenhouse Gas Emissions. Clim. Change 2011, 109, 33–57. [Google Scholar] [CrossRef]
- van Vuuren, D.P.; Edmonds, J.; Kainuma, M.; Riahi, K.; Thomson, A.; Hibbard, K.; Hurtt, G.C.; Kram, T.; Krey, V.; Lamarque, J.-F.; et al. The Representative Concentration Pathways: An Overview. Clim. Change 2011, 109, 5. [Google Scholar] [CrossRef]
- Van Wagner, C.E.; Pickett, T.L. Equations and FORTRAN Program for the Canadian Forest Fire Weather Index System. Available online: https://ostrnrcan-dostrncan.canada.ca/entities/publication/29706108-2891-4e5d-a59a-a77c96bc507c (accessed on 22 June 2024).
- Blazejczyk, K.; Epstein, Y.; Jendritzky, G.; Staiger, H.; Tinz, B. Comparison of UTCI to Selected Thermal Indices. Int. J. Biometeorol. 2012, 56, 515–535. [Google Scholar] [CrossRef] [PubMed]
- Vicente-Serrano, S.M.; Beguería, S.; López-Moreno, J.I. A Multiscalar Drought Index Sensitive to Global Warming: The Standardized Precipitation Evapotranspiration Index. J. Clim. 2010, 23, 1696–1718. [Google Scholar] [CrossRef]
| Disclaimer/Publisher’s Note: The statements, opinions and data contained in all publications are solely those of the individual author(s) and contributor(s) and not of MDPI and/or the editor(s). MDPI and/or the editor(s) disclaim responsibility for any injury to people or property resulting from any ideas, methods, instructions or products referred to in the content. |
© 2025 by the authors. Licensee MDPI, Basel, Switzerland. This article is an open access article distributed under the terms and conditions of the Creative Commons Attribution (CC BY) license (https://creativecommons.org/licenses/by/4.0/).


