Abstract
Wildfires are a complex and underexplored aspect of the Earth system, significantly affecting climate, as they emit greenhouse gases and aerosols that alter the Earth’s radiative balance. This study utilizes the EC-Earth3 Earth System Model to investigate how interannual variability in biomass burning emissions influences variability in total aerosol optical depth (AOD), as well as carbon monoxide (CO) and ozone (O3) tropospheric columns. We demonstrate that fluctuations in biomass burning emissions impact AOD, CO, and O3 variability at regional and global scales, emphasizing the need for improved understanding of wildfires and their climate effects.
1. Introduction
Wildfires are one of the most poorly understood components of the Earth’s system. In addition to their dramatic socioeconomic impacts, wildfires release greenhouse gases and aerosols that disrupt Earth’s radiative balance. The extreme forest fire incidents in Canada during 2023 released 640 Tg of carbon in the form of CO and carbon dioxide (CO2), which is comparable to the annual fossil fuel emissions of a large industrialized nation [1]. Wildfires are also a source of ozone (O3), contributing 170 Tg of O3 per year, which is 3.5% of the annual tropospheric O3 production [2].
This work investigates the effect of the interannual variability of biomass burning (BB) emissions on short-lived constituents of the troposphere, namely aerosols, O3, and CO. For that, we conducted idealized Earth System Model (ESM) simulations prescribing BB emissions lacking interannual variability. Emission data were derived from the Global Fire Emissions Database version 4 with small fires (GFED4s) [3]. Simulations were carried out for the years 1997 to 2006, a time frame that encompasses significant global wildfire incidents like the 1997 Indonesia forest fires, the 1998 wildfires in Florida and Eastern Russia, and the 2000 wildfires in the Western United States. This period also coincides with intense El Niño–Southern Oscillation (ENSO) events and marks the beginning of the era in which satellite-based emission datasets are utilized for the Coupled Model Intercomparison Project [4].
While previous studies have examined the impacts of BB variability on aerosols and tropospheric trace gases [5,6], uncertainties persist regarding these effects. Climate models provide diverging results, underestimating aerosol optical properties [7]. Emission inventories driving climate models comprise uncertainties, including those related to burned area, fuel load, emission factors, and the translation of fire radiative power to biomass combustion rates [8]. We aim to enhance the understanding of the complex fire-climate interactions by utilizing the EC-Earth3 ESM [9] and GFED4s, a satellite-based emissions database.
2. Methods
2.1. Model Description
Atmosphere-only runs were conducted using the EC-Earth3-AerChem configuration of EC-Earth3 [9], for which the Integrated Forecasting System (IFS) general circulation model drives the chemistry and aerosol Tracer Model, version 5 (TM5), with resolution 3° longitude × 2° latitude and 34 hybrid vertical layers extending up to 0.1 hPa. BB emissions are derived from the GFED4s database, which utilizes satellite measurements of fire and vegetation to provide globally gridded monthly emissions from 1997 to 2015 at a spatial resolution of 0.25° × 0.25° [4]. Model output is provided at a monthly cadence.
2.2. Experimental Setup
We conducted simulations for the years 1997 to 2006 using three BB emissions scenarios. The first simulation, referred to as the base scenario, incorporated interannually varying BB emissions from the GFED4s emissions inventory. The second simulation (mean) utilized BB emissions with seasonal variation but without interannual variation. The seasonal cycle consisted of the monthly means for each individual BB species calculated over the simulation period. Consequently, the annual mean fluxes for all individual BB species, computed for the years 1997 to 2006, were identical for both the base and mean scenarios. The third simulation (zero) involved nullifying all BB emissions. Figure 1 displays the BC emission flux for the base and mean scenarios. All scenarios were initialized from initial conditions obtained from a prior experiment that started in 1992. The O3 tropospheric column is readily available as a model output, while CO was calculated using the airmass and tropopause pressure output variables.
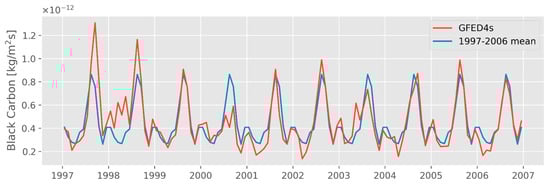
Figure 1.
Global, area-weighted BC emission flux for the base (GFED4s) and mean (GFED4s 1997–2006 mean) scenarios. Monthly values are shown.
3. Results
3.1. Temporal Effects on the Global Scale
In this section, we explore how interannual variability in BB emissions influences the seasonal patterns of AOD, tropospheric O3, and CO on a global scale. Climate models demonstrate a systematic negative bias against satellite AOD observations; however, they can effectively capture spatiotemporal variations in AOD. The Aerosol Comparison between Observations and Models (AeroCom) assessment [7] revealed strong correlations between modeled and observed AOD, with EC-Earth3/TM5 ranking among the best models with a normalized mean bias of −7% compared to the FMI-Merged multi-satellite AOD product [10] and −6% compared to AERONET measurements. For both AOD datasets, EC-Earth/TM5 achieved a Pearson’s coefficient of 0.83, as reported in Table 4 of [7]. Evaluation of AeroCom Phase-III models specifically over fire-affected regions revealed that while state-of-the-art models exhibit a wide spectrum of bias in BB AOD, these models, including TM5, remain trustworthy for representing aerosol variability over time and space [8].
Figure 2 presents boxplots illustrating the extent of the effects of the base, mean, and zero BB emissions scenarios on the seasonal variation of these quantities. As sea spray and mineral dust can primarily contribute to the overall AOD [11], BC AOD is examined independently. Eliminating BB emissions reduces AOD values and the abundances of O3 and CO. Additionally, the peaks in AOD and BC AOD from July to October are absent, and a shift in the seasonality of O3 and CO occurs. The mean scenario reproduces the July to October AOD peak; however, it indicates an AOD maximum that occurs later within the year. This is attributed to a lack of variability in BB emissions from sub-Saharan wildfires in the mean scenario.
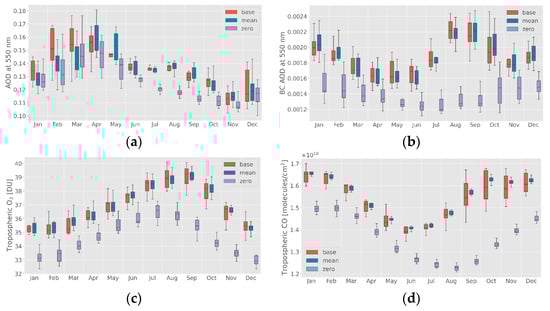
Figure 2.
Boxplots of area-weighted global spatial means for the base, mean and zero BB emissions scenario: (a) Total AOD at 550 nm; (b) BC AOD at 550 nm; (c) tropospheric O3; (d) tropospheric CO. The box plot whiskers extend to the lowest (highest) data point still within 1.5 interquartile ranges of the lower (upper) quartile. Outliers are not shown.
TM5 accurately represents the spatial and seasonal variations of background surface O3 and tropospheric O3 profiles within 10 ppbv [12]. However, it tends to underestimate O3 in the free troposphere when compared to in situ measurements in the tropics [12]. In Figure 2c, the mean BB emissions cycle produces abundances with a similar trend to the base scenario; however, the interquartile ranges are larger for most of the months compared to the mean scenario. With respect to CO, TM5 is well-regarded for effectively modeling its global seasonal cycle [12]. Despite this capability, it is known that CO concentrations are underestimated by 20 ppbv in boreal spring and 10 ppbv in boreal summer. These inaccuracies are primarily attributed to missing chemical processes, underestimated emissions from higher hydrocarbons, and uncertainties in the seasonal variation in CO emissions [12]. In Figure 2d, the monthly variability of CO is particularly pronounced during boreal autumn, when BB emissions exhibit greater variability (Figure 1).
3.2. Temporal Effects on the Regional Scale
Short lifetimes of aerosols imply that regional effects of wildfire emissions can be much larger than global. To evaluate the regional effects of BB interannual variability, we utilize coefficient of variation (CV) maps, which represent the ratio of the standard deviation to the mean per model grid cell. In Figure 3, CV maps for September–October are shown.
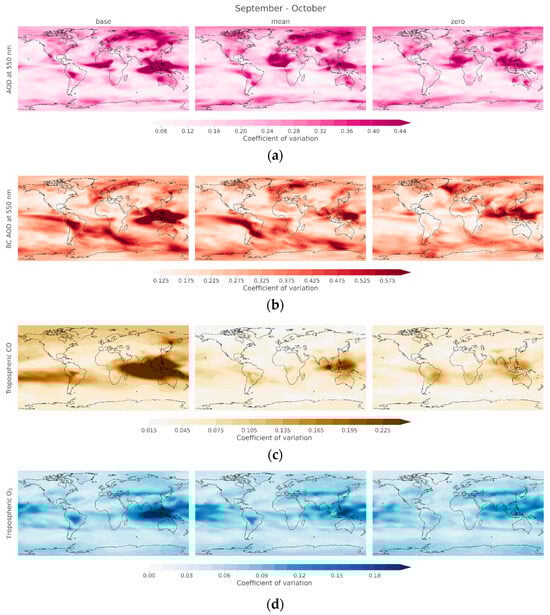
Figure 3.
September–October coefficient of variation maps for the base, mean, and zero BB emissions scenarios: (a) Total AOD at 550 nm; (b) BC AOD at 550 nm. Tropospheric columns: (c) CO; (d) O3. Note that higher coefficient of variation values may arise from lower mean values, as in the case of tropospheric CO in northern latitudes, for the zero scenario.
This choice was established by inspecting monthly CV maps for O3 and considering (a) the BC AOD peak observed in Figure 2b, and (b) the months where the interquartile range differences between the base and mean scenarios CO and O3 are more pronounced (Figure 2c,d).
By eliminating BB emissions, total AOD variability is minimized over South America and is reduced in Siberia, Greenland, Alaska, and Canada, while the advection of smoke from Amazonia, Central, and South Africa is absent. The comparison of total AOD variability between the base and mean scenarios is more complex due to the dominant effects of dust, sea spray, and pollution transport. Focusing solely on BB AOD reveals a clearer pattern of increased variability, particularly over Indonesia, the Indian Ocean, the Southern Atlantic Ocean, and the Southern Ocean.
Notable variability in CO is observed over the Indian Ocean, Southeast Asia, northern Australia, and both the North and Equatorial Pacific Ocean. Boreal regions also demonstrate increased CO variability, with peaks over Amazonia and Eastern China. The higher coefficient of variation observed in higher latitudes for the zero scenario (Figure 3c) results from lower mean CO values in these areas. Simpler chemistry and longer atmospheric lifetime enable CO to vary in regions far beyond BB emission sources. Variability in O3 is less pronounced as it is driven by meteorology [6] since O3 has a shorter lifetime and a complex chemistry. Nevertheless, variability in O3 is also increased over Indonesia and the Indian Ocean.
4. Conclusions
This study highlights the significant increase in variability of aerosols, tropospheric CO, and O3 in the Indonesia/Indian Ocean region due to interannually varying BB emissions. Additionally, we observed increased variability in tropospheric CO over the ENSO region. Given that 1997 and 1998 were exceptional years for wildfire emissions, we plan to extend our simulation period in future research to cover the entire GFED4s era (1997–2016). This extension will facilitate a more comprehensive statistical assessment of the impacts of biomass burning interannual variability.
Author Contributions
Conceptualization, A.V.; methodology, A.V. and M.P.P.; software, M.P.P. and E.B.; validation, M.P.P. and E.B.; formal analysis, M.P.P.; investigation, M.P.P.; resources, K.S., R.-N.M. and I.A.R.; data curation, M.P.P., E.B. and R.-N.M.; writing—original draft preparation, M.P.P.; writing—review and editing, A.V. and M.P.P.; visualization, M.P.P.; supervision, A.V.; project administration, K.S.; funding acquisition, A.V. All authors have read and agreed to the published version of the manuscript.
Funding
This work was supported by the Hellenic Foundation for Research and Innovation (grant No. 3453), through the AXA Research Fund (project “AXA Chair in Wildfires and Climate”, CPO00163217), and from the Horizon Europe programme under Grant Agreement No 101137680 via project CERTAINTY (Cloud-aERosol inTeractions & their impActs IN The earth sYstem).
Institutional Review Board Statement
Not applicable.
Informed Consent Statement
Not applicable.
Data Availability Statement
The raw data supporting the conclusions of this article will be made available by the authors on request.
Acknowledgments
This work was supported by computational time granted from the National Infrastructures for Research and Technology S.A. (GRNET S.A.) in the National HPC facility—ARIS—under project ID FirePC.
Conflicts of Interest
The authors declare no conflicts of interest.
References
- Byrne, B.; Liu, J.; Bowman, K.W.; Pascolini-Campbell, M.; Chatterjee, A.; Pandey, S.; Miyazaki, K.; van der Werf, G.R.; Wunch, D.; Wennberg, P.O.; et al. Carbon Emissions from the 2023 Canadian Wildfires. Nat. 2024, 633, 835–839. [Google Scholar] [CrossRef] [PubMed]
- Jaffe, D.A.; Wigder, N.L. Ozone Production from Wildfires: A Critical Review. Atmos. Environ. 2012, 51, 1–10. [Google Scholar] [CrossRef]
- van der Werf, G.R.; Randerson, J.T.; Giglio, L.; van Leeuwen, T.T.; Chen, Y.; Rogers, B.M.; Mu, M.; van Marle, M.J.E.; Morton, D.C.; Collatz, G.J.; et al. Global Fire Emissions Estimates during 1997–2016. Earth Syst. Sci. Data 2017, 9, 697–720. [Google Scholar] [CrossRef]
- van Marle, M.J.E.; Kloster, S.; Magi, B.I.; Marlon, J.R.; Daniau, A.-L.; Field, R.D.; Arneth, A.; Forrest, M.; Hantson, S.; Kehrwald, N.M.; et al. Historic Global Biomass Burning Emissions for CMIP6 (BB4CMIP) Based on Merging Satellite Observations with Proxies and Fire Models (1750–2015). Geosci. Model Dev. 2017, 10, 3329–3357. [Google Scholar] [CrossRef]
- Voulgarakis, A.; Marlier, M.E.; Faluvegi, G.; Shindell, D.T.; Tsigaridis, K.; Mangeon, S. Interannual Variability of Tropospheric Trace Gases and Aerosols: The Role of Biomass Burning Emissions. J. Geophys. Res. Atmos. 2015, 120, 7157–7173. [Google Scholar] [CrossRef]
- Voulgarakis, A.; Savage, N.H.; Wild, O.; Braesicke, P.; Young, P.J.; Carver, G.D.; Pyle, J.A. Interannual Variability of Tropospheric Composition: The Influence of Changes in Emissions, Meteorology and Clouds. Atmos. Chem. Phys. 2010, 10, 2491–2506. [Google Scholar] [CrossRef]
- Gliß, J.; Mortier, A.; Schulz, M.; Andrews, E.; Balkanski, Y.; Bauer, S.E.; Benedictow, A.M.K.; Bian, H.; Checa-Garcia, R.; Chin, M.; et al. AeroCom Phase III Multi-Model Evaluation of the Aerosol Life Cycle and Optical Properties Using Ground- and Space-Based Remote Sensing as Well as Surface in Situ Observations. Atmos. Chem. Phys. 2021, 21, 87–128. [Google Scholar] [CrossRef]
- Zhong, Q.; Schutgens, N.; van der Werf, G.; van Noije, T.; Tsigaridis, K.; Bauer, S.E.; Mielonen, T.; Kirkevåg, A.; Seland, Ø.; Kokkola, H.; et al. Satellite-Based Evaluation of AeroCom Model Bias in Biomass Burning Regions. Atmos. Chem. Phys. 2022, 22, 11009–11032. [Google Scholar] [CrossRef]
- van Noije, T.; Bergman, T.; Le Sager, P.; O’Donnell, D.; Makkonen, R.; Gonçalves-Ageitos, M.; Döscher, R.; Fladrich, U.; Von Hardenberg, J.; Keskinen, J.-P.; et al. EC-Earth3-AerChem: A Global Climate Model with Interactive Aerosols and Atmospheric Chemistry Participating in CMIP6. Geosci. Model Dev. 2021, 14, 5637–5668. [Google Scholar] [CrossRef]
- Sogacheva, L.; Popp, T.; Sayer, A.M.; Dubovik, O.; Garay, M.J.; Heckel, A.; Hsu, N.C.; Jethva, H.; Kahn, R.A.; Kolmonen, P.; et al. Merging Regional and Global Aerosol Optical Depth Records from Major Available Satellite Products. Atmos. Chem. Phys. 2020, 20, 2031–2056. [Google Scholar] [CrossRef]
- Tsikerdekis, A.; Hasekamp, O.P.; Schutgens, N.A.J.; Zhong, Q. Assimilation of POLDER Observations to Estimate Aerosol Emissions. Atmos. Chem. Phys. 2023, 23, 9495–9524. [Google Scholar] [CrossRef]
- Huijnen, V.; Williams, J.; van Weele, M.; van Noije, T.; Krol, M.; Dentener, F.; Segers, A.; Houweling, S.; Peters, W.; de Laat, J.; et al. The Global Chemistry Transport Model TM5: Description and Evaluation of the Tropospheric Chemistry Version 3.0. Geosci. Model Dev. 2010, 3, 445–473. [Google Scholar] [CrossRef]
Disclaimer/Publisher’s Note: The statements, opinions and data contained in all publications are solely those of the individual author(s) and contributor(s) and not of MDPI and/or the editor(s). MDPI and/or the editor(s) disclaim responsibility for any injury to people or property resulting from any ideas, methods, instructions or products referred to in the content. |
© 2025 by the authors. Licensee MDPI, Basel, Switzerland. This article is an open access article distributed under the terms and conditions of the Creative Commons Attribution (CC BY) license (https://creativecommons.org/licenses/by/4.0/).