1. Introduction
Climate change is intensifying the frequency and severity of extreme weather events globally, with heatwaves posing one of the most urgent public health threats [
1]. Defined as prolonged periods of abnormally high temperatures, heatwaves significantly increase mortality, especially among the elderly, children, and those with health conditions [
2,
3]. Southern Europe, including Greece, is particularly vulnerable due to its climate and aging population. Greece has faced several deadly heatwaves, and with future warming expected, assessing the health burden of heatwaves is a priority [
4].
Despite growing recognition of the link between heat and mortality, existing approaches to assess future risks are often limited to statistical extrapolation based on historical trends, without incorporating future climate dynamics or complex interactions between meteorological variables and population characteristics [
5]. Moreover, many conventional models fail to capture the non-linear, lagged, and cumulative effects of heat exposure on human mortality [
6]. Addressing this gap requires integrating high-resolution climate projections with advanced machine learning techniques capable of modeling intricate patterns in large, multidimensional datasets.
This study develops a predictive framework for heatwave-related mortality in Greece using historical data and downscaled climate projections under RCP4.5 and RCP8.5. Using eXtreme Gradient Boosting (XGBoost), optimized via Bayesian tuning, the model incorporates lagged temperature and humidity, rolling heat indicators, and age-based interaction terms. Results compare mortality under moderate and high-emissions scenarios, offering insight to guide public health strategies
2. Materials and Methods
2.1. Study Desigh Overview
This study presents a machine learning-based approach to predict weekly heatwave related mortality in Greece from 2025 to 2050 under two climate change scenarios: RCP4.5 and RCP8.5. An explainable, data-driven predictive framework was developed using eXtreme Gradient Boosting (XGBoost), trained on historical mortality and climate data. The model integrates observed mortality data (2015–2024), historical weather records, and future climate projections to estimate total and age-specific mortality. Emphasis was placed on feature engineering to capture temporal dynamics and physiological vulnerability to extreme heat across age groups.
2.2. Mortality and Climate Data
Mortality data (2015–2024) were obtained from the Hellenic Statistical Authority (
https://www.statistics.gr/en/home, accessed on 4 April 2025), aggregated weekly and stratified by age and sex. Historical weather variables, including weekly maximum temperature (Tmax) and relative humidity (RHmax), were sourced from ERA5 reanalysis [
7]. Future climate data (2025–2050) were derived from bias-corrected CORDEX regional models under RCP4.5 and RCP8.5, downscaled to weekly resolution to align with mortality data [
8].
2.3. Heatwave Definition and Feature Engineering
A heatwave was defined using a percentile-based threshold approach, where a week was considered a heatwave if its average Tmax exceeded the 75th percentile of historical values for the same calendar period. From this binary indicator, we derived a range of features to capture heatwave intensity, persistence, and temporal lags:
Lagged features: One to three-week lags of heatwave duration and Tmax/RHmax to account for delayed physiological effects;
Rolling averages: Three- and five-week rolling means for heatwave duration and meteorological variables to reflect cumulative exposure;
Interaction terms: Multiplicative interactions between heatwave duration and age-specific population metrics (e.g., population aged 65+) to capture vulnerability;
Seasonal modulation: Interaction between heatwave indicators and calendar month to reflect seasonal variation in susceptibility.
2.4. Model Development and Hyperparameter Tuning
In this study, the XGBoost algorithm was employed, a gradient-boosted decision tree ensemble method known for its robustness and performance with structured data [
9]. To optimize model performance, Bayesian Optimization was used to efficiently search for a multidimensional hyperparameter space, including the number of estimators, learning rate, maximum tree depth, subsampling ratio, and column sampling ratio. The objective was to minimize the Mean Absolute Error (MAE) while maximizing the coefficient of determination (R
2) on a hold-out validation set. The dataset was divided into a training subset (2015–2024) and a projection subset (2025–2050), with the training data further split into 80% for model fitting and 20% for validation. Separate models were trained for total mortality and for each age group to capture age-specific sensitivities to heatwave conditions. Model performance was evaluated using MAE to quantify average prediction error, Root Mean Squared Error (RMSE) to penalize large deviations, and R
2 to assess the proportion of explained variance. Following final training, models were applied to future climate projections under RCP4.5 and RCP8.5 scenarios for the period 2025–2050, with results disaggregated by week and age group to enable detailed trend analysis and scenario-based comparison.
3. Results and Discussion
The model achieved robust performance across all mortality targets, with R
2 scores of 0.58 for total mortality and up to 0.62 for specific age groups such as the elderly (85+), demonstrating reliable predictive power. The Mean Absolute Error (MAE) ranged from 140.23 to 278.54, depending on the scenario and age group. Analysis of the importance of the analysis revealed that lagged heatwave effects—particularly two-week lags—along with cumulative heatwave duration and relative humidity (RHmax), were the strongest predictors of mortality. These findings align with epidemiological evidence suggest that both the duration and delayed effects of extreme heat significantly contribute to excess mortality, especially among vulnerable populations [
10]. Importantly, although the ‘Year’ variable initially appeared among the most influential features, it was excluded from final models to avoid embedding time-trend leakage into future projections. This adjustment ensured that mortality forecasts were driven primarily by climatic and physiological predictors rather than implicitly captured trends.
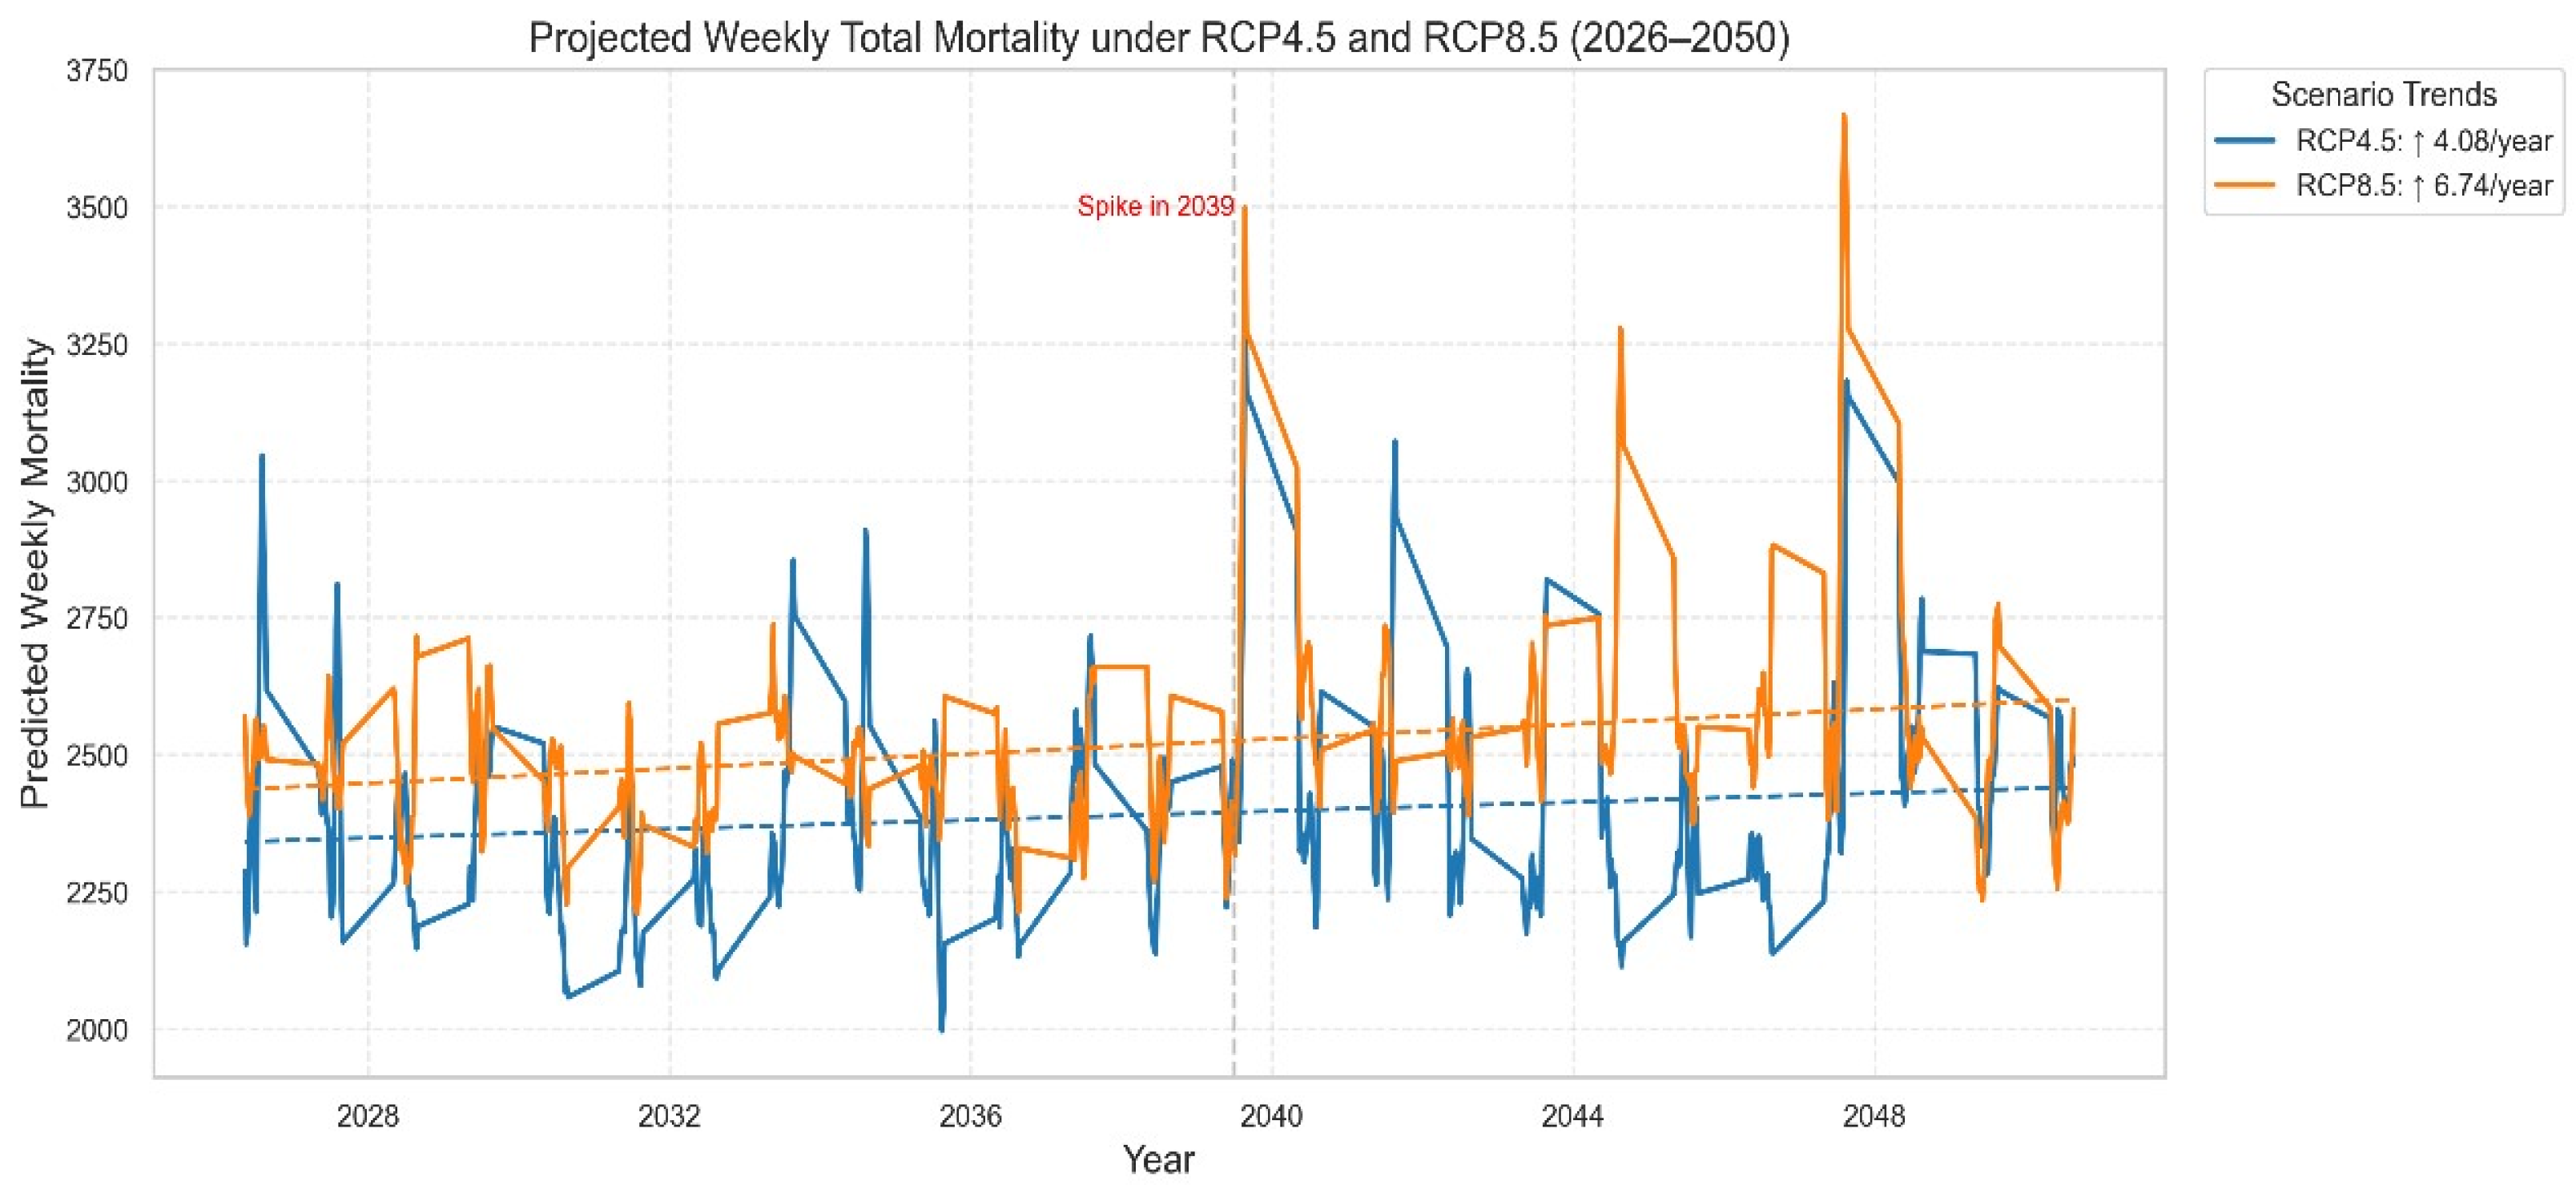
Figure 1 presents weekly total mortality projections for both RCP4.5 and RCP8.5 scenarios. A clear upward trend is observed in both pathways, with RCP8.5 exhibiting a more pronounced increase. A notable spike in predicted mortality occurs around 2039 under both scenarios, coinciding with projected increases in Tmax and RHmax. Linear trend analysis confirms a steeper yearly increase in mortality under RCP8.5 compared to RCP4.5, highlighting the escalating health burden of climate inaction.
Age-specific trends are further visualized in
Figure 2, which focuses on RCP4.5. The 85+ age group consistently exhibits the highest mortality rates, with an accelerating upward trend. Although younger age groups such as 0–14 and 15–64 show relatively stable projections, slight increases are detected, suggesting that no group is entirely immune to future heatwave risks. Importantly, trend slopes remain positive across all age groups, emphasizing the universal impact of sustained heat exposure.
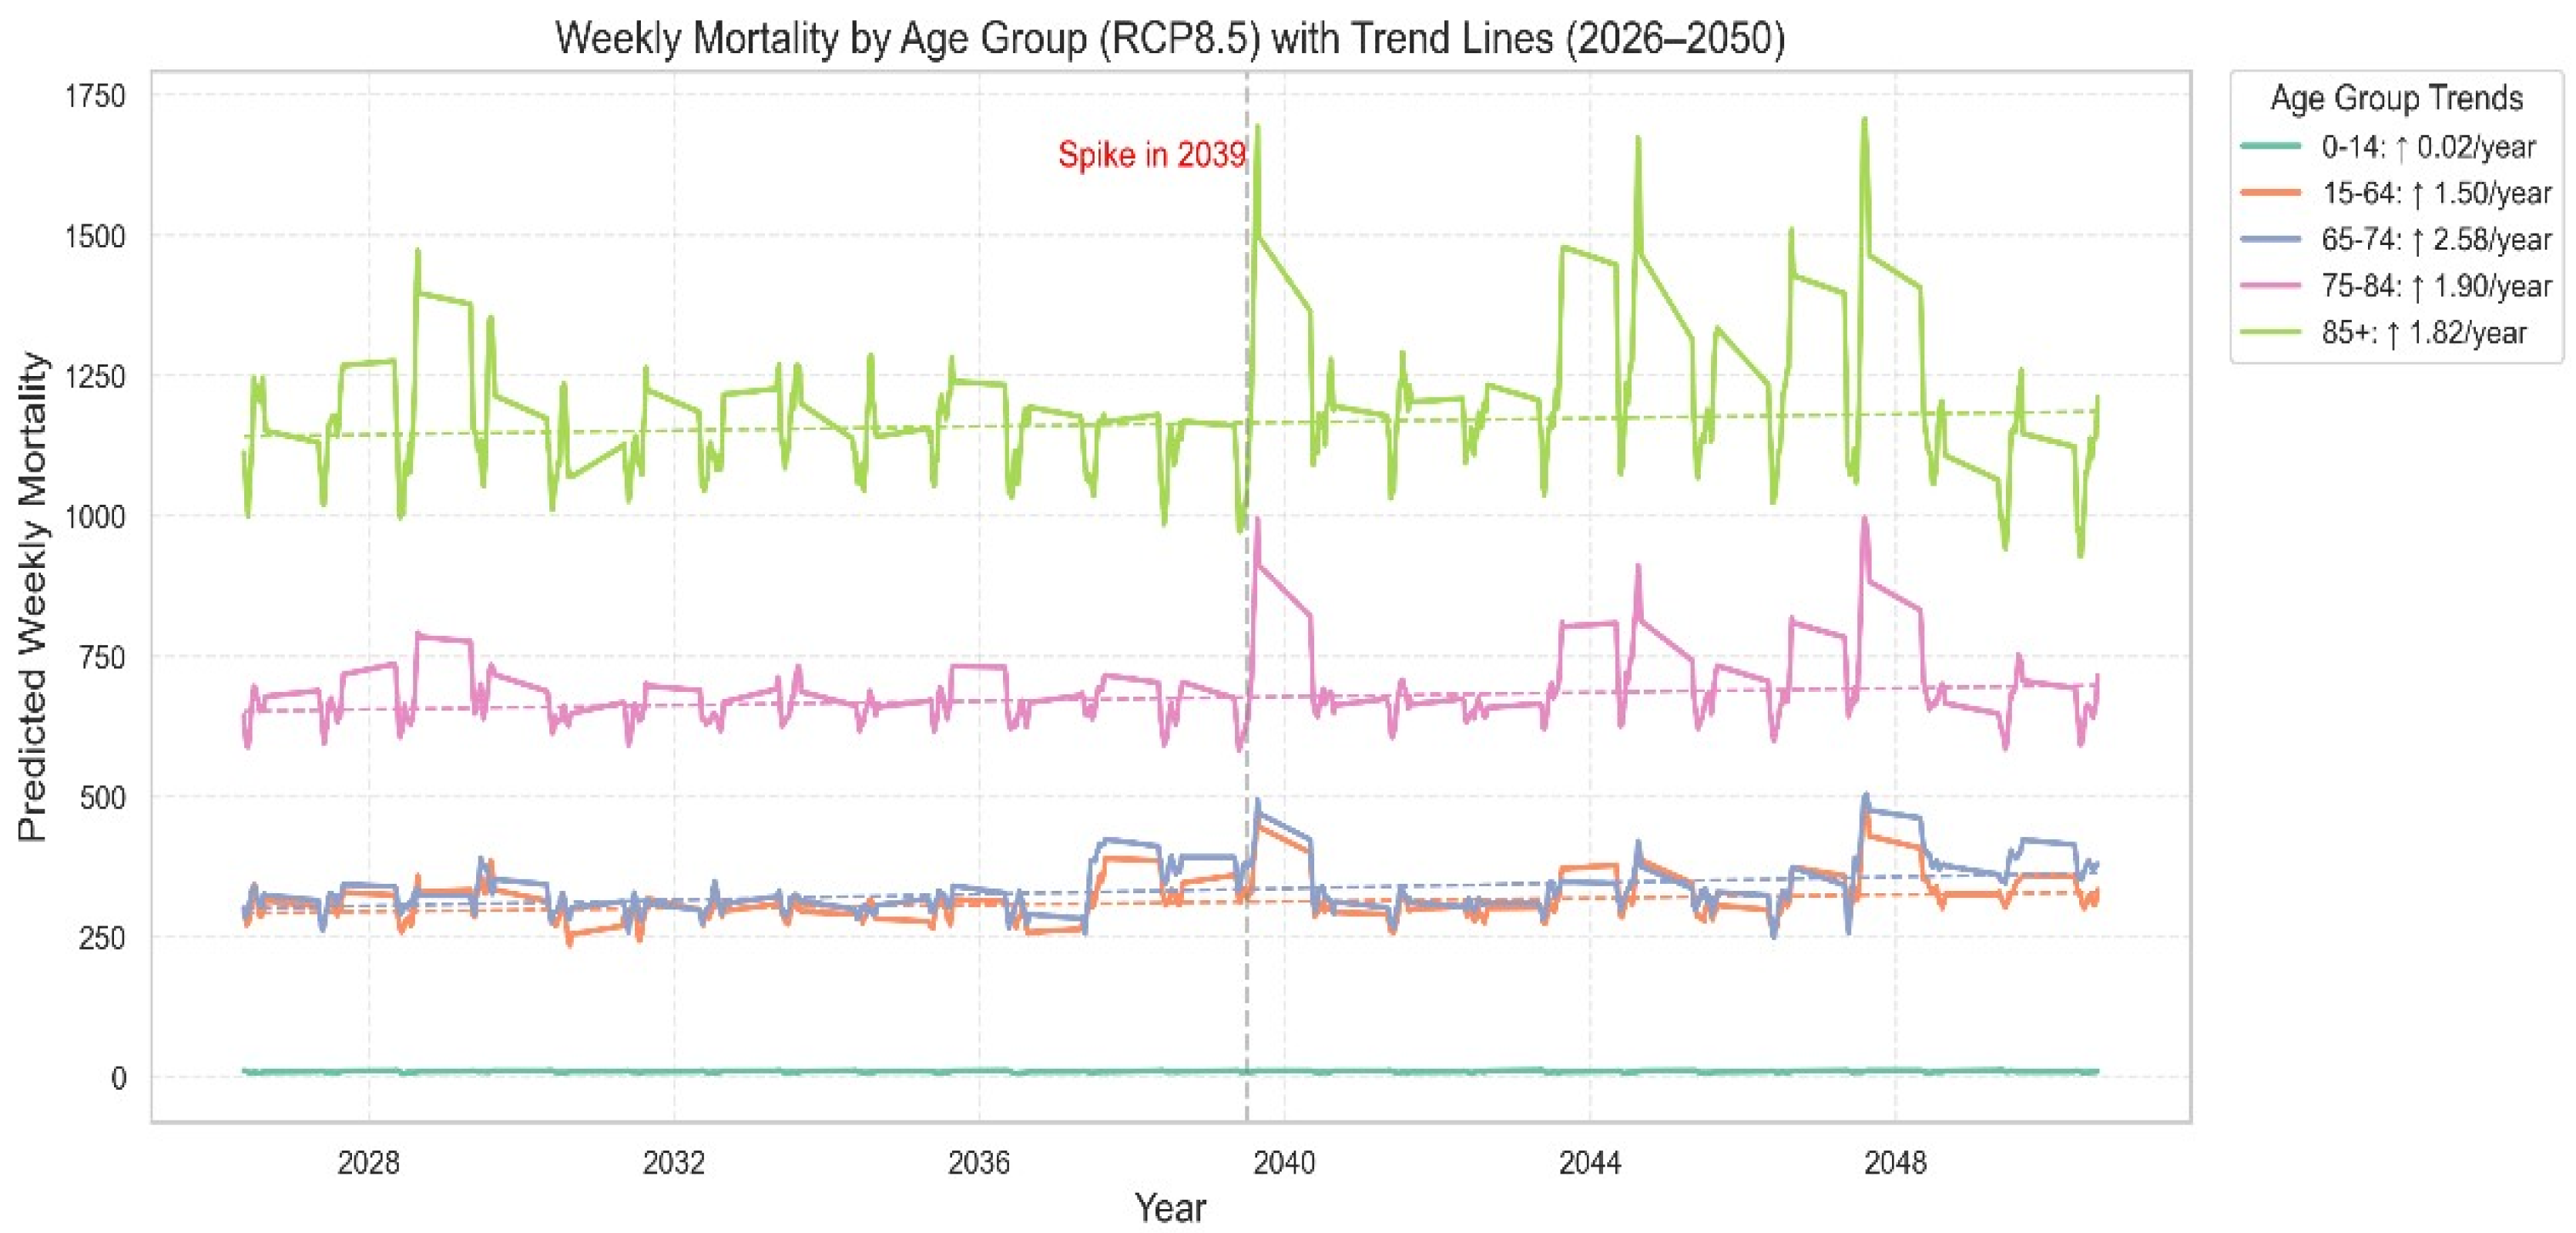
In addition to the RCP4.5 projections, weekly mortality estimates by age group were also generated for the RCP8.5 scenario (
Figure 3). The results show a consistent upward trend across all age categories, with the most significant increase observed in the 85+ population. Compared to RCP4.5, the RCP8.5 trajectory displays a steeper incline in mortality starting around 2039, reflecting the intensified heatwave conditions and their disproportionate impact on older individuals.
Table 1 summarizes the model performance metrics and top-ranked predictive features for selected mortality targets. The combination of lag features, rolling averages, and climate-health interaction terms proved essential in capturing the complex temporal dynamics of heat-related mortality.
Overall, the results reinforce the disproportionate vulnerability of elderly populations and underscore the necessity of age-targeted adaptation strategies. Moreover, the sharp projected increase in mortality post-2040 under both scenarios underlines the urgency of emissions mitigation and climate-resilient healthcare planning.
4. Conclusions
This study introduced a machine learning framework using XGBoost to predict weekly heatwave-related mortality in Greece under two climate scenarios (RCP4.5 and RCP8.5) from 2025 to 2050. The model, integrating historical mortality data with downscaled climate projections, demonstrated reliable predictive accuracy—particularly for older populations. Results indicate a consistent rise in heatwave-related mortality across all age groups, with the most pronounced increases projected after 2039 under the RCP4.5 and RCP8.5 scenario. Elderly individuals, especially those aged 85+, are disproportionately affected, emphasizing the need for targeted adaptation strategies. Key predictors included lagged heatwave exposure and relative humidity, underscoring the cumulative effects of extreme heat. Excluding the ‘Year’ variable ensured model interpretability and avoided temporal leakage. These findings highlight the urgent need for climate-resilient public health planning. Priorities should include early warning systems, age-specific interventions, and urban heat mitigation. Future work should expand the framework to incorporate socio-economic factors and validate predictions using real-time surveillance data.
Author Contributions
Conceptualization, I.P. and P.K.; methodology, I.P.; software, I.P.; formal analysis, I.P.; investigation, I.P.; resources, I.P.; data curation, I.P.; writing—original draft preparation, I.P.; writing—review and editing, P.K.; visualization, I.P.; supervision, P.K. All authors have read and agreed to the published version of the manuscript.
Funding
This work was supported by the project “Support for upgrading the operation of the National Network for Climate Change (CLIMPACT II)” (Project Code 75539; reference 2023NA11900001 – N. 5201588), funded by the Public Investment Program of Greece, General Secretary of Research and Technology/Ministry of Development and Investments.
Institutional Review Board Statement
Not applicable.
Informed Consent Statement
Not applicable.
Data Availability Statement
The authors do not have permission to share the data.
Conflicts of Interest
The authors declare no conflicts of interest.
References
- Liu, J.; Qi, J.; Yin, P.; Liu, W.; He, C.; Gao, Y.; Zhou, L.; Zhu, Y.; Kan, H.; Chen, R.; et al. Rising cause-specific mortality risk and burden of compound heatwaves amid climate change. Nat. Clim. Change 2024, 14, 1201–1209. [Google Scholar] [CrossRef]
- Xu, Z.; Sheffield, P.E.; Su, H.; Wang, X.; Bi, Y.; Tong, S. The impact of heat waves on children’s health: A systematic review. Int. J. Biometeorol. 2014, 58, 239–247. [Google Scholar] [CrossRef] [PubMed]
- Xi, D.; Liu, L.; Zhang, M.; Huang, C.; Burkart, K.G.; Ebi, K.; Zeng, Y.; Ji, J.S. Risk factors associated with heatwave mortality in Chinese adults over 65 years. Nat. Med. 2024, 30, 1489–1498. [Google Scholar] [CrossRef] [PubMed]
- Paravantis, J.; Santamouris, M.; Cartalis, C.; Efthymiou, C.; Kontoulis, N. Mortality Associated with High Ambient Temperatures, Heatwaves, and the Urban Heat Island in Athens, Greece. Sustainability 2017, 9, 606. [Google Scholar] [CrossRef]
- Kinney, P.L.; O’Neill, M.S.; Bell, M.L.; Schwartz, J. Approaches for estimating effects of climate change on heat-related deaths: Challenges and opportunities. Environ. Sci. Policy 2008, 11, 87–96. [Google Scholar] [CrossRef]
- Huang, C.; Barnett, A.G.; Wang, X.; Vaneckova, P.; FitzGerald, G.; Tong, S. Projecting future heat-related mortality under climate change scenarios: A systematic review. Environ. Health Perspect. 2011, 119, 1681–1690. [Google Scholar] [CrossRef] [PubMed]
- Hersbach, H.; Bell, B.; Berrisford, P.; Hirahara, S.; Horányi, A.; Muñoz-Sabater, J.; Nicolas, J.; Peubey, C.; Radu, R.; Schepers, D.; et al. The ERA5 global reanalysis. Q. J. R. Meteorol. Soc. 2020, 146, 1999–2049. [Google Scholar] [CrossRef]
- Jacob, D.; Teichmann, C.; Sobolowski, S.; Katragkou, E.; Anders, I.; Belda, M.; Benestad, R.; Boberg, F.; Buonomo, E.; Cardoso, R.M.; et al. Regional climate downscaling over Europe: Perspectives from the EURO-CORDEX community. Reg. Environ. Change 2020, 20, 51. [Google Scholar] [CrossRef]
- Mitchell, R.; Frank, E. Accelerating the XGBoost algorithm using GPU computing. PeerJ Comput. Sci. 2017, 3, e127. [Google Scholar] [CrossRef]
- Yang, J.; Zhou, M.; Ren, Z.; Li, M.; Wang, B.; Liu, D.L.; Ou, C.-Q.; Yin, P.; Sun, J.; Tong, S.; et al. Projecting heat-related excess mortality under climate change scenarios in China. Nat. Commun. 2012, 12, 1039. [Google Scholar] [CrossRef] [PubMed]
| Disclaimer/Publisher’s Note: The statements, opinions and data contained in all publications are solely those of the individual author(s) and contributor(s) and not of MDPI and/or the editor(s). MDPI and/or the editor(s) disclaim responsibility for any injury to people or property resulting from any ideas, methods, instructions or products referred to in the content. |
© 2025 by the authors. Licensee MDPI, Basel, Switzerland. This article is an open access article distributed under the terms and conditions of the Creative Commons Attribution (CC BY) license (https://creativecommons.org/licenses/by/4.0/).


