Abstract
This study presents the development, construction, and implementation of a portable meteorological station. An ESP8266 microcontroller was used as the control system. Temperature, humidity, and atmospheric pressure were measured. The UV index, thermal sensation, dew point, altitude above sea level, and air density were measured indirectly. An interface was created to retrieve the data in real time via the internet. The information can also be stored on a micro-SD memory device. The first results were collected over a period of 29 days. The data is sampled every 10 s. The data was compared with that of a commercial meteorological station and yielded similar results. The design of the meteorological station will be further improved by adding new measurement variables and installing a few portable stations in different regions of the state.
1. Introduction
Climate change has significantly impacted various regions in Mexico, particularly in semi-arid areas such as Zacatecas. The region’s increasing variability in weather patterns demands accurate and accessible meteorological monitoring. This study aims to present the architecture and implementation of a low-cost, portable meteorological station prototype designed for real-time data acquisition and transmission, integrating IoT technology to facilitate monitoring in remote and rural locations, whose aim is to determine the climatic conditions of certain regions and create the best infrastructure for alternative energy sources [1,2].
2. Materials and Methods
The study was carried out over a 29-day period between October 21 and November 18, at the Unidad Académica de Ciencias y Tecnologías de la Luz y la Materia LUMAT research unit in Zacatecas, Mexico. The prototype includes microcontroller (μC ESP8266), BME280, and GUVA-S12SD sensors, and a microSD card for data storage. Figure 1 shows a block diagram of the development system.
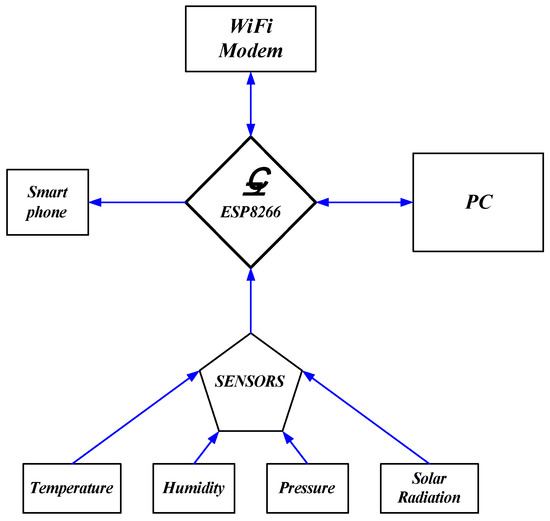
Figure 1.
Block diagram system.
Figure 1 describes the μC ESP8266 as the control center and from where it was programmed through a computer and the Arduino family IDE interface. The microcontroller receives the electrical signals obtained by the temperature, humidity, pressure, and solar radiation sensors. The obtained data were processed and stored in real time, through a locally hosted HTML web interface, and can also be viewed through a Wi-Fi interface to a smartphone [3,4,5,6].
Figure 2 shows the interconnection between the μC ESP8266 and the atmospheric pressure (to the μC port D1–D2) and UV radiation (to the analog port A0) sensors.
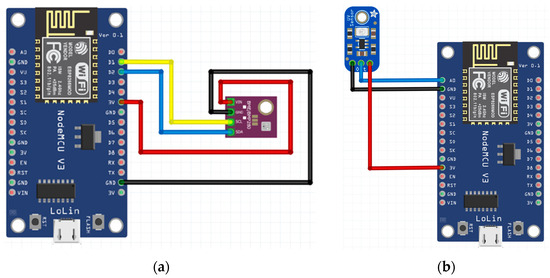
Figure 2.
Setup and connecting sensors to the μC ESP8266. (a) Atmospheric pressure, BME280; (b) UV solar detection, GUVA-S12SD.
Figure 3 shows the interconnection between the μC ESP8266 and the Micro SD card adapter (port D5–D8).
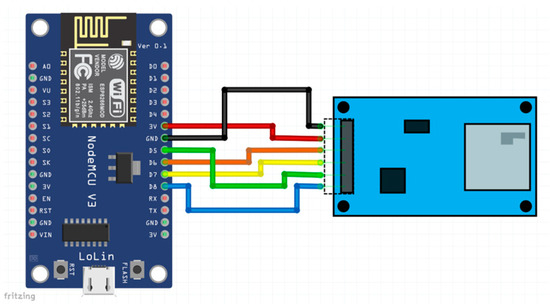
Figure 3.
Setup between the Micro SD card adapter and connection to μC ESP8266.
3. Results
The prototype successfully recorded data continuously for 696 h—see Figure 4. Data showed consistent patterns when compared to the INIFAP weather station located 13.1 km away. Differences in measurements, particularly humidity, were attributed to the different geographic and environmental conditions. UV index values from the GUVA-S12SD sensor were converted from voltage readings and compared with INIFAP’s solar radiation data. The results indicate that, despite technical limitations, the prototype offers reliable data, validating its design and implementation for rural meteorological applications.
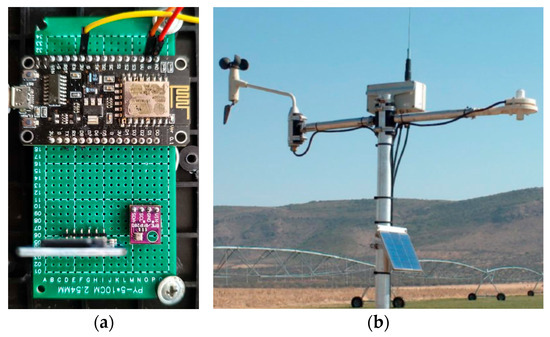
Figure 4.
Prototype’s structure. It consists of the (a) μC ESP8266 connected to the BME280 module, the GUVA-S12SD module, and Micro SD Adapter. (b) Meteorological station in INIFAP.
The developed prototype recorded, analyzed, and averaged the data described in the diagram in Figure 1 and as shown in Table 1.

Table 1.
Averages of the data obtained using a prototype station.
Next we present the results obtained using the prototype and data from the INIFAP weather station in Variable vs. Date graphs, over a 29-day period from October 21 to November 18.
Figure 5 presents the recorded results for the temperature variable from both system. The temperature dispersion is shown, given the location and distance between the two meteorological stations.
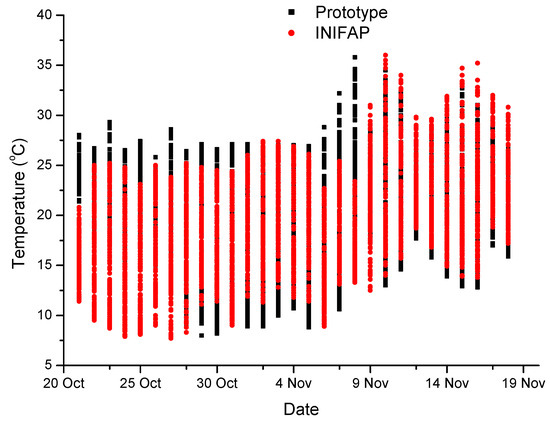
Figure 5.
Comparison of temperature data obtained using the prototype station and reference data from INIFAP.
Similarly, Figure 6 presents the recorded result for the humidity variable, which shows a significant difference between the two systems. It is important to note that the altitude and topography of the stations locations are highly significant and relevant.
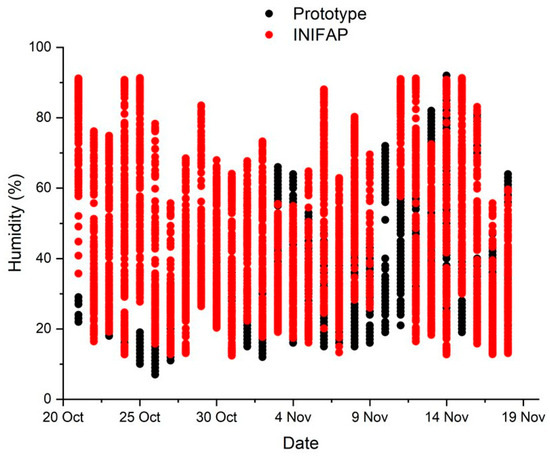
Figure 6.
Comparison of humidity data obtained using the prototype station and reference data from INIFAP.
Figure 7, Figure 8, Figure 9 and Figure 10 corresponds to the indirect variables, calculated using the values recorded by the prototype system. These values were determined through the internal programming of the μC ESP8266.
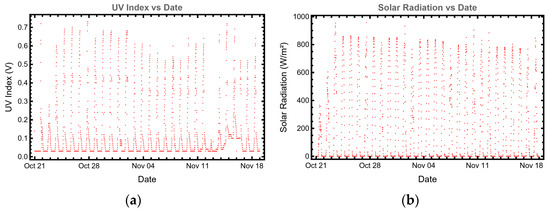
Figure 7.
Comparison of (a) UV index data obtained using a prototype station and (b) solar radiation data from INIFAP.
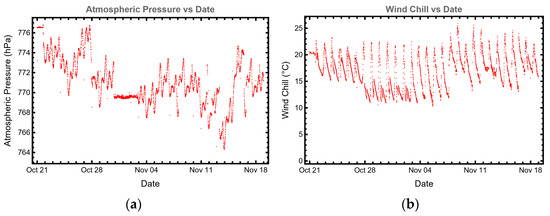
Figure 8.
Atmospheric pressure (a) and wind chill (b) data from prototype station.
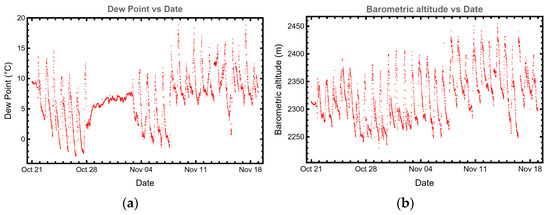
Figure 9.
(a) Dew point and (b) altitude data from prototype station.
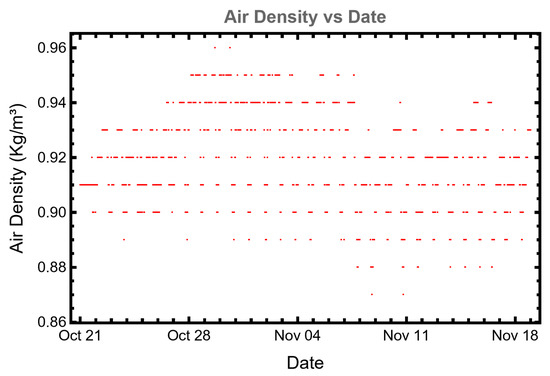
Figure 10.
Air density.
4. Conclusions
The initial results from the meteorological station are promising. However, some aspects still need to be considered, for example, the measurement by placing the prototype and an established commercial station side by side to allow more accurate comparisons. These preliminary results did not allow for such a physical comparison of the positions. This shows the large dispersion of temperature and humidity results, which also illustrates the small microclimates between the cities of Zacatecas and Guadalupe, which differ in their meteorological variables due to their topography. The flexibility and modularity of the prototype allow for future improvements, such as the integration of solar energy and additional sensors. The implementation of this low-cost portable meteorological station demonstrates that the use of microcontroller-based IoT systems for environmental monitoring is feasible. The total cost of this prototype is no more than 150 dollars. This system is a useful tool for researchers, farmers, and communities in semi-arid regions.
Author Contributions
The authors contributed significantly to the research. Conceptualization, and methodology, D.A.J.-R. and R.A.R.-V.; implementation, D.A.J.-R. Supervision, C.I.C.-P. and R.A.R.-V.; writing—original draft, D.A.J.-R.; writing—review and editing, R.A.R.-V. All authors have read and agreed to the published version of the manuscript.
Funding
This research received no external funding.
Institutional Review Board Statement
Not applicable.
Informed Consent Statement
Not applicable.
Data Availability Statement
The data used to support the findings of this study can be made available by the corresponding author upon request.
Acknowledgments
R.A.R.-V. acknowledges the support provided by IxM-SECIHTI.
Conflicts of Interest
The authors declare no conflicts of interest.
References
- Ahrens, C.D.; Henson, R. Meteorology Today: An Introduction to Weather, Climate, and the Environment, 13th ed.; Cengage Learning: Boston, MA, USA, 2021. [Google Scholar]
- Wolfson, R. Energy, Environment, and Climate, 4th ed.; W.W. Norton & Company: New York, NY, USA, 2023. [Google Scholar]
- Cooper, W.D.; Helfrick, A.D. Electronic Instrumentation and Measurement Techniques, 3rd ed.; Prentice-Hall: Englewood, NJ, USA, 1985. [Google Scholar]
- Monk, S. Programming Arduino Next Steps: Going Furthers with Sketches, 2nd ed.; Mc Graw Hill: New York, NY, USA, 2018. [Google Scholar]
- Correa Alegria, F.A. Sensors and Actuators; World Scientific Publishing Company: Danvers, MA, USA, 2021. [Google Scholar]
- Bishop, R.H. Mechatronic Systems, Sensors, and Actuators: Fundamentals and Modelling, 2nd ed.; CRC Press: Boca Raton, FL, USA, 2007. [Google Scholar]
Disclaimer/Publisher’s Note: The statements, opinions and data contained in all publications are solely those of the individual author(s) and contributor(s) and not of MDPI and/or the editor(s). MDPI and/or the editor(s) disclaim responsibility for any injury to people or property resulting from any ideas, methods, instructions or products referred to in the content. |
© 2025 by the authors. Licensee MDPI, Basel, Switzerland. This article is an open access article distributed under the terms and conditions of the Creative Commons Attribution (CC BY) license (https://creativecommons.org/licenses/by/4.0/).