Article

Adversarial Attack Resilient ML-Assisted Golden Free Approach for Hardware Trojan Detection

1
Department of Computer Science and Engineering, Wright State University, Dayton, OH 45435, USA
2
Department of Engineering Technology, Middle Tennessee State University, Murfreesboro, TN 37132, USA
*
Authors to whom correspondence should be addressed.
Microelectronics 2026, 2(1), 2; https://doi.org/10.3390/microelectronics2010002
Submission received: 30 December 2025 / Revised: 22 January 2026 / Accepted: 27 January 2026 / Published: 29 January 2026

Abstract

The growing dependence on third-party foundries for integrated circuit (IC) fabrication has created major security concerns because of hardware Trojan (HT) insertion risks. Traditional detection methods, including side-channel analysis and golden reference models, face limitations such as sensitivity to noise, high cost, and impracticality for large-scale deployment. This work introduces a machine learning framework for HT detection that eliminates the need for golden references. The framework automatically extracts statistical features from chip data, groups chips into clusters, and uses an internal filtering process to identify the most reliable patterns. These patterns are then used to guide a learning model that can accurately separate Trojan-infected chips from clean ones. Experimental evaluation demonstrates that the proposed method achieves high detection accuracy with zero false negatives, while remaining resilient against adversarial perturbations. These findings indicate that cluster-filtered pseudo-labeling provides a practical and scalable solution for enhancing hardware security in modern IC supply chains.

1. Introduction

The globalization of integrated circuit (IC) supply chains has intensified concerns regarding hardware Trojan (HT) insertion during third-party fabrication. Unlike software vulnerabilities, HTs exploit the physical nature of hardware, making them difficult to detect and capable of undermining the security of critical systems. Traditional detection methods rely heavily on side-channel analysis (SCA) or comparison against a trusted “golden” reference design. However, these approaches suffer from major drawbacks: SCA signals are inherently noisy and environment-dependent [1], and golden reference models are costly and often impractical to maintain in untrusted fabrication settings [2]. These limitations necessitate the development of golden-free, data-driven solutions for HT detection.
While “golden-free” detection is not a novel concept in itself, the prior literature has largely relied on purely unsupervised anomaly detection, such as One-Class Support Vector Machines (OC-SVM) [3] or reconstruction-based Autoencoders [4]. These methods operate on the assumption that deviations from a learned “normal” distribution are automatically indicative of Trojans. However, in the context of side-channel analysis, this assumption is fundamentally fragile; process variation (PV), environmental drift, and measurement noise induce natural deviations that often mask or mimic the Trojan footprint. Consequently, purely unsupervised detectors frequently suffer from unstable decision boundaries, either overfitting to noise or failing to distinguish benign PV from malicious perturbations.
Compounding this challenge is the rise in adversarial attacks, which capitalize on vulnerabilities in machine learning models by incorporating designed perturbations to outsmart detection mechanisms [5]. For instance, malicious entities might employ substitute models to investigate how a target clustering model organizes data, allowing them to shift Trojan-infected chips toward the statistical center of the benign distribution. This underscores the importance of enhancing detection systems not just against process variation, but against active evasion tactics.
To address this limitation, we propose a hybrid unsupervised–supervised framework. The theoretical motivation for this shift lies in the fundamental distinction between density estimation and discriminative learning. From a statistical learning perspective, unsupervised clustering attempts to model the complex joint distribution P ( x ) of the chip data, a task that is notoriously difficult in high-dimensional spaces affected by PV [6]. In contrast, classification targets the posterior P ( y | x ) , focusing solely on the decision boundary required to separate classes.
By utilizing high-confidence cluster assignments as proxies for ground truth, our framework leverages the principle of Self-Training or Deep Clustering [7,8]. This allows the model to shift from merely identifying outliers to learning a separating hyperplane that maximizes the margin between “Trojan-free” and “Trojan-infected” regions. This transition is critical for adversarial robustness: while an attacker can easily manipulate samples to slide within a vague density threshold, it is significantly harder to cross a maximized margin defined by a discriminative classifier. Therefore, the proposed framework is not merely a heuristic, but a principled application of discriminative learning to convert unreliable anomaly scores into robust Trojan detectors.
To implement this framework, our approach begins with per-chip normalization of Ring Oscillator (RO) frequencies, followed by the extraction of statistical descriptors and correlation-based features. Dimensionality reduction is applied, and chips are clustered using k-means. Instead of treating all clusters as equally reliable, we introduce a clusterwise filtering strategy that selects only high-confidence chips (based on silhouette score and bootstrap stability) as trusted pseudo-labeled seeds. These seeds are then used to train an AdaBoost classifier, which generalizes the labels to the full dataset. Finally, adversarial training is incorporated to strengthen the resilience of the model against worst-case perturbations.

1.1. Key Contributions

The main contributions of this paper are as follows:
  • We propose a novel hybrid framework that integrates unsupervised clustering with supervised learning, enabling golden-free HT detection.
  • The proposed method demonstrates resilience to adversarial attacks, ensuring robustness against sophisticated manipulation techniques aimed at evading detection.
  • We introduce a clusterwise filtering mechanism that quantifies cluster quality using silhouette scores and stability analysis, ensuring reliable pseudo-label generation.
  • We demonstrate that the AdaBoost classifier trained on pseudo-labeled seeds achieves 99.05% accuracy and a 0% false negative rate, while remaining resilient under adversarial attacks.
  • We provide a practical and scalable methodology for IC security, bridging the gap between noise-prone unsupervised detection and label-dependent supervised methods.

1.2. Organization of the Paper

The paper follows a structured format that presents the proposed methodology alongside its evaluation process. The paper begins with Section 2, which establishes background information about HTs through a threat model and an analysis of the existing literature. Section 3 explains how unsupervised machine learning techniques form the basis of an AI-assisted framework to detect HTs. The experimental setup is described in Section 4 through explanations of a ring oscillator configuration, Field-Programmable Gate Array (FPGA) implementation and data collection and preprocessing procedures. Section 5 presents a proposed adversarial attack method that targets clustering-based detection models for compromise. The paper introduces defensive methods in Section 6 to improve model resistance against adversarial perturbations. The experimental results are presented in Section 7 to show the detection framework’s performance before and after implementing the defense mechanism. The paper concludes in Section 8 by summarizing essential findings while proposing future research directions.

2. Background

2.1. Hardware Trojan

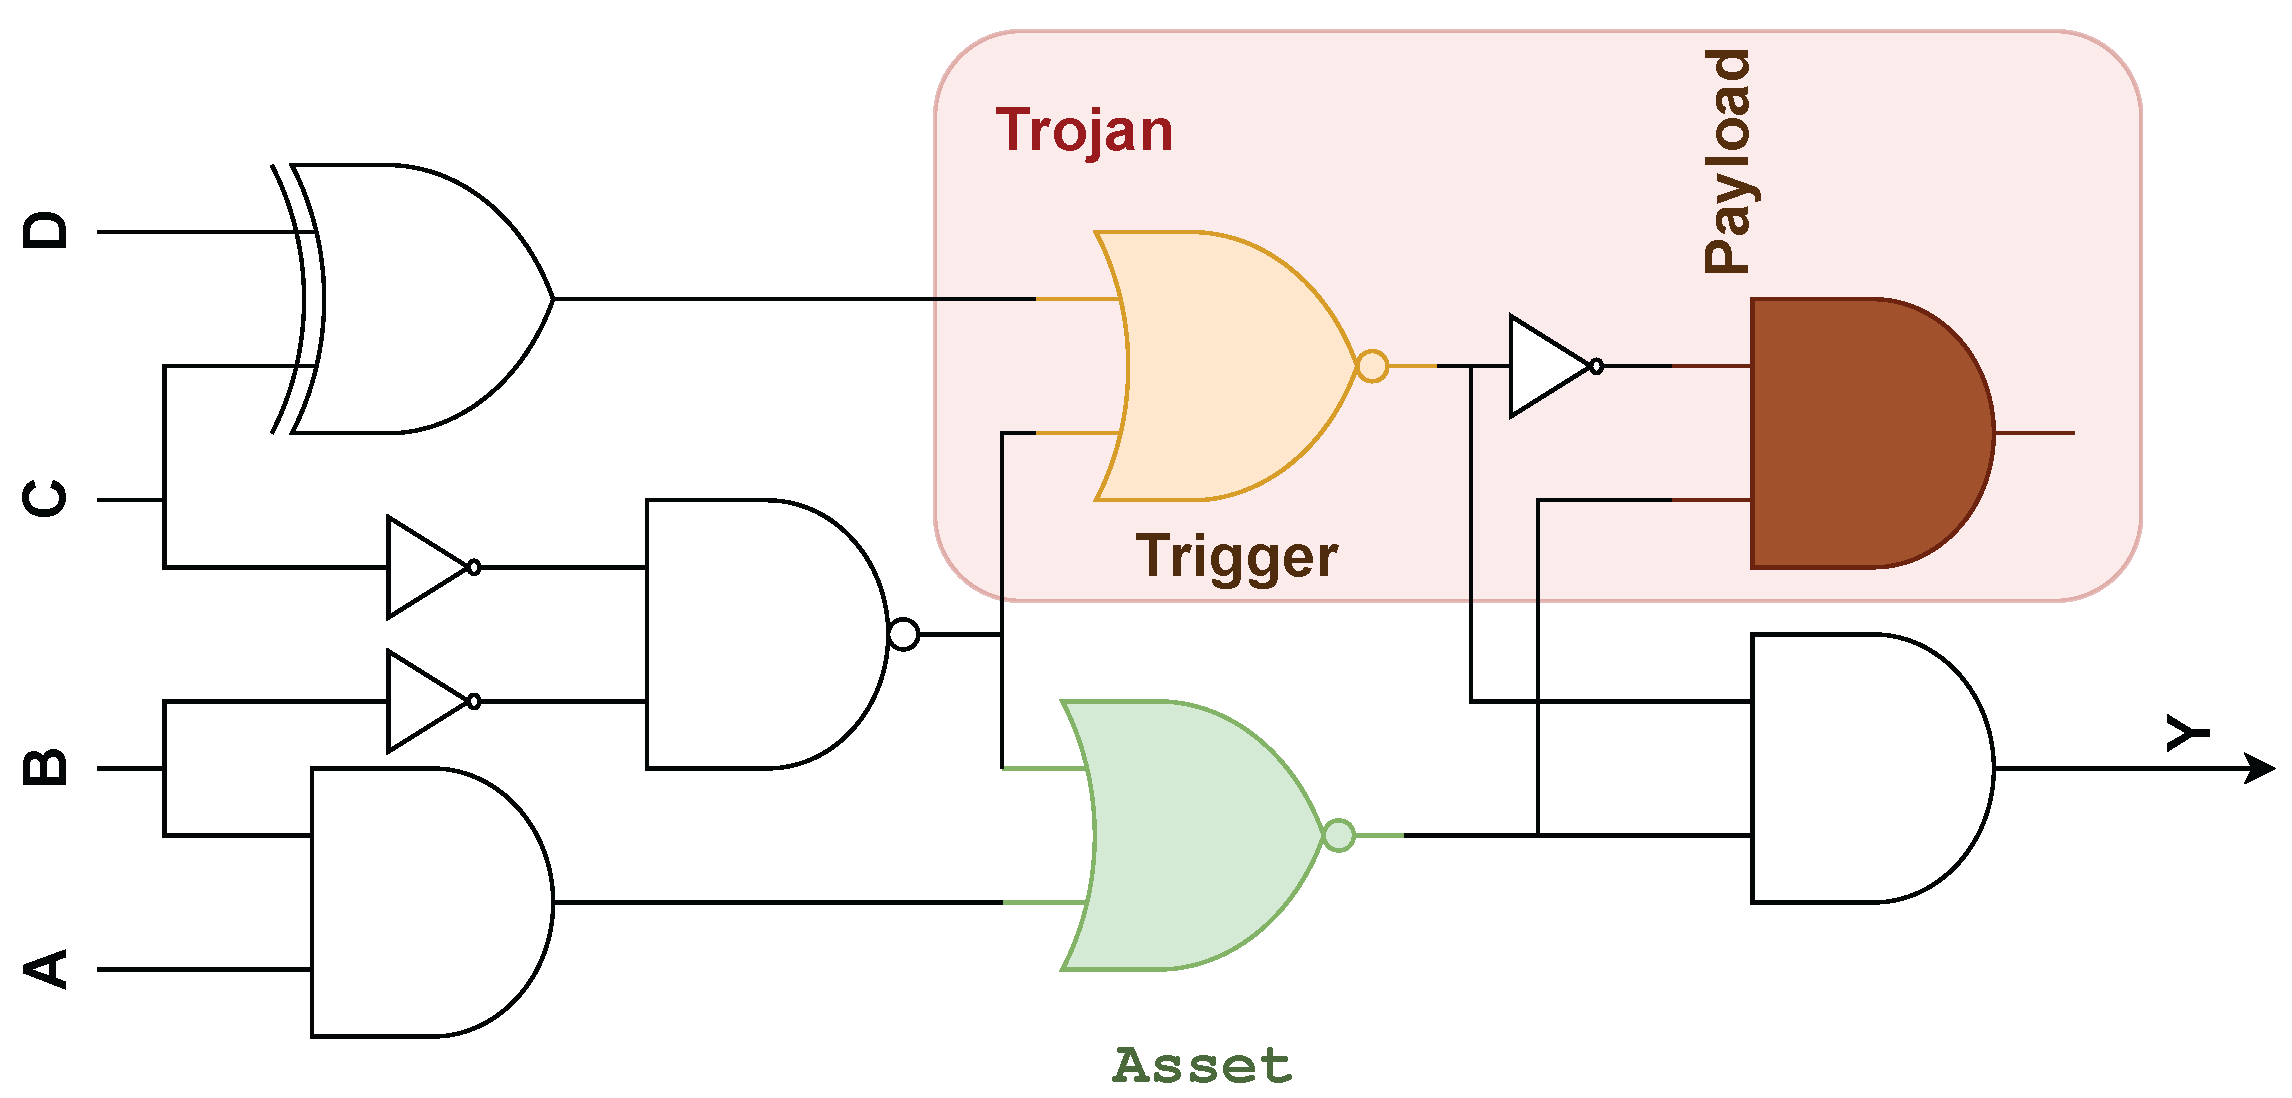
Modern semiconductor design and manufacturing face an urgent threat from hardware Trojans in their complex systems [9]. The stealthy adversaries have the dangerous capability to secretly modify integrated circuits, which could produce disastrous results. The hidden nature of HTs makes them unique because they can bypass standard verification and testing procedures. An HT basic model consists of two essential parts that include triggers and payloads [10]. The trigger functions as a covert trigger that enables the Trojan to activate through internal circuit states or external inputs. Following activation, the payload plays a crucial role in modifying the circuit operations to fulfill the Trojan’s predetermined goals. The two-level HT structure is presented in Figure 1. The various activation methods, physical characteristics and payload attributes of these Trojans require a comprehensive methodology to classify and detect them.

2.2. Threat Model

The foundry’s trustworthiness stands as questionable throughout this research. An adversary could exploit unsecured access to IC mask layout files to perform unauthorized modifications. The research focuses on a specific subset of HTs that result from adding or removing logic components. The research focuses on digital HTs exclusively since it omits the evaluation of doping-level Trojans and analog circuit-based exploits and non-digital forms of compromise [11]. The defined threat model helps us create detection techniques that precisely identify digital HTs that could be illicitly inserted during manufacturing.
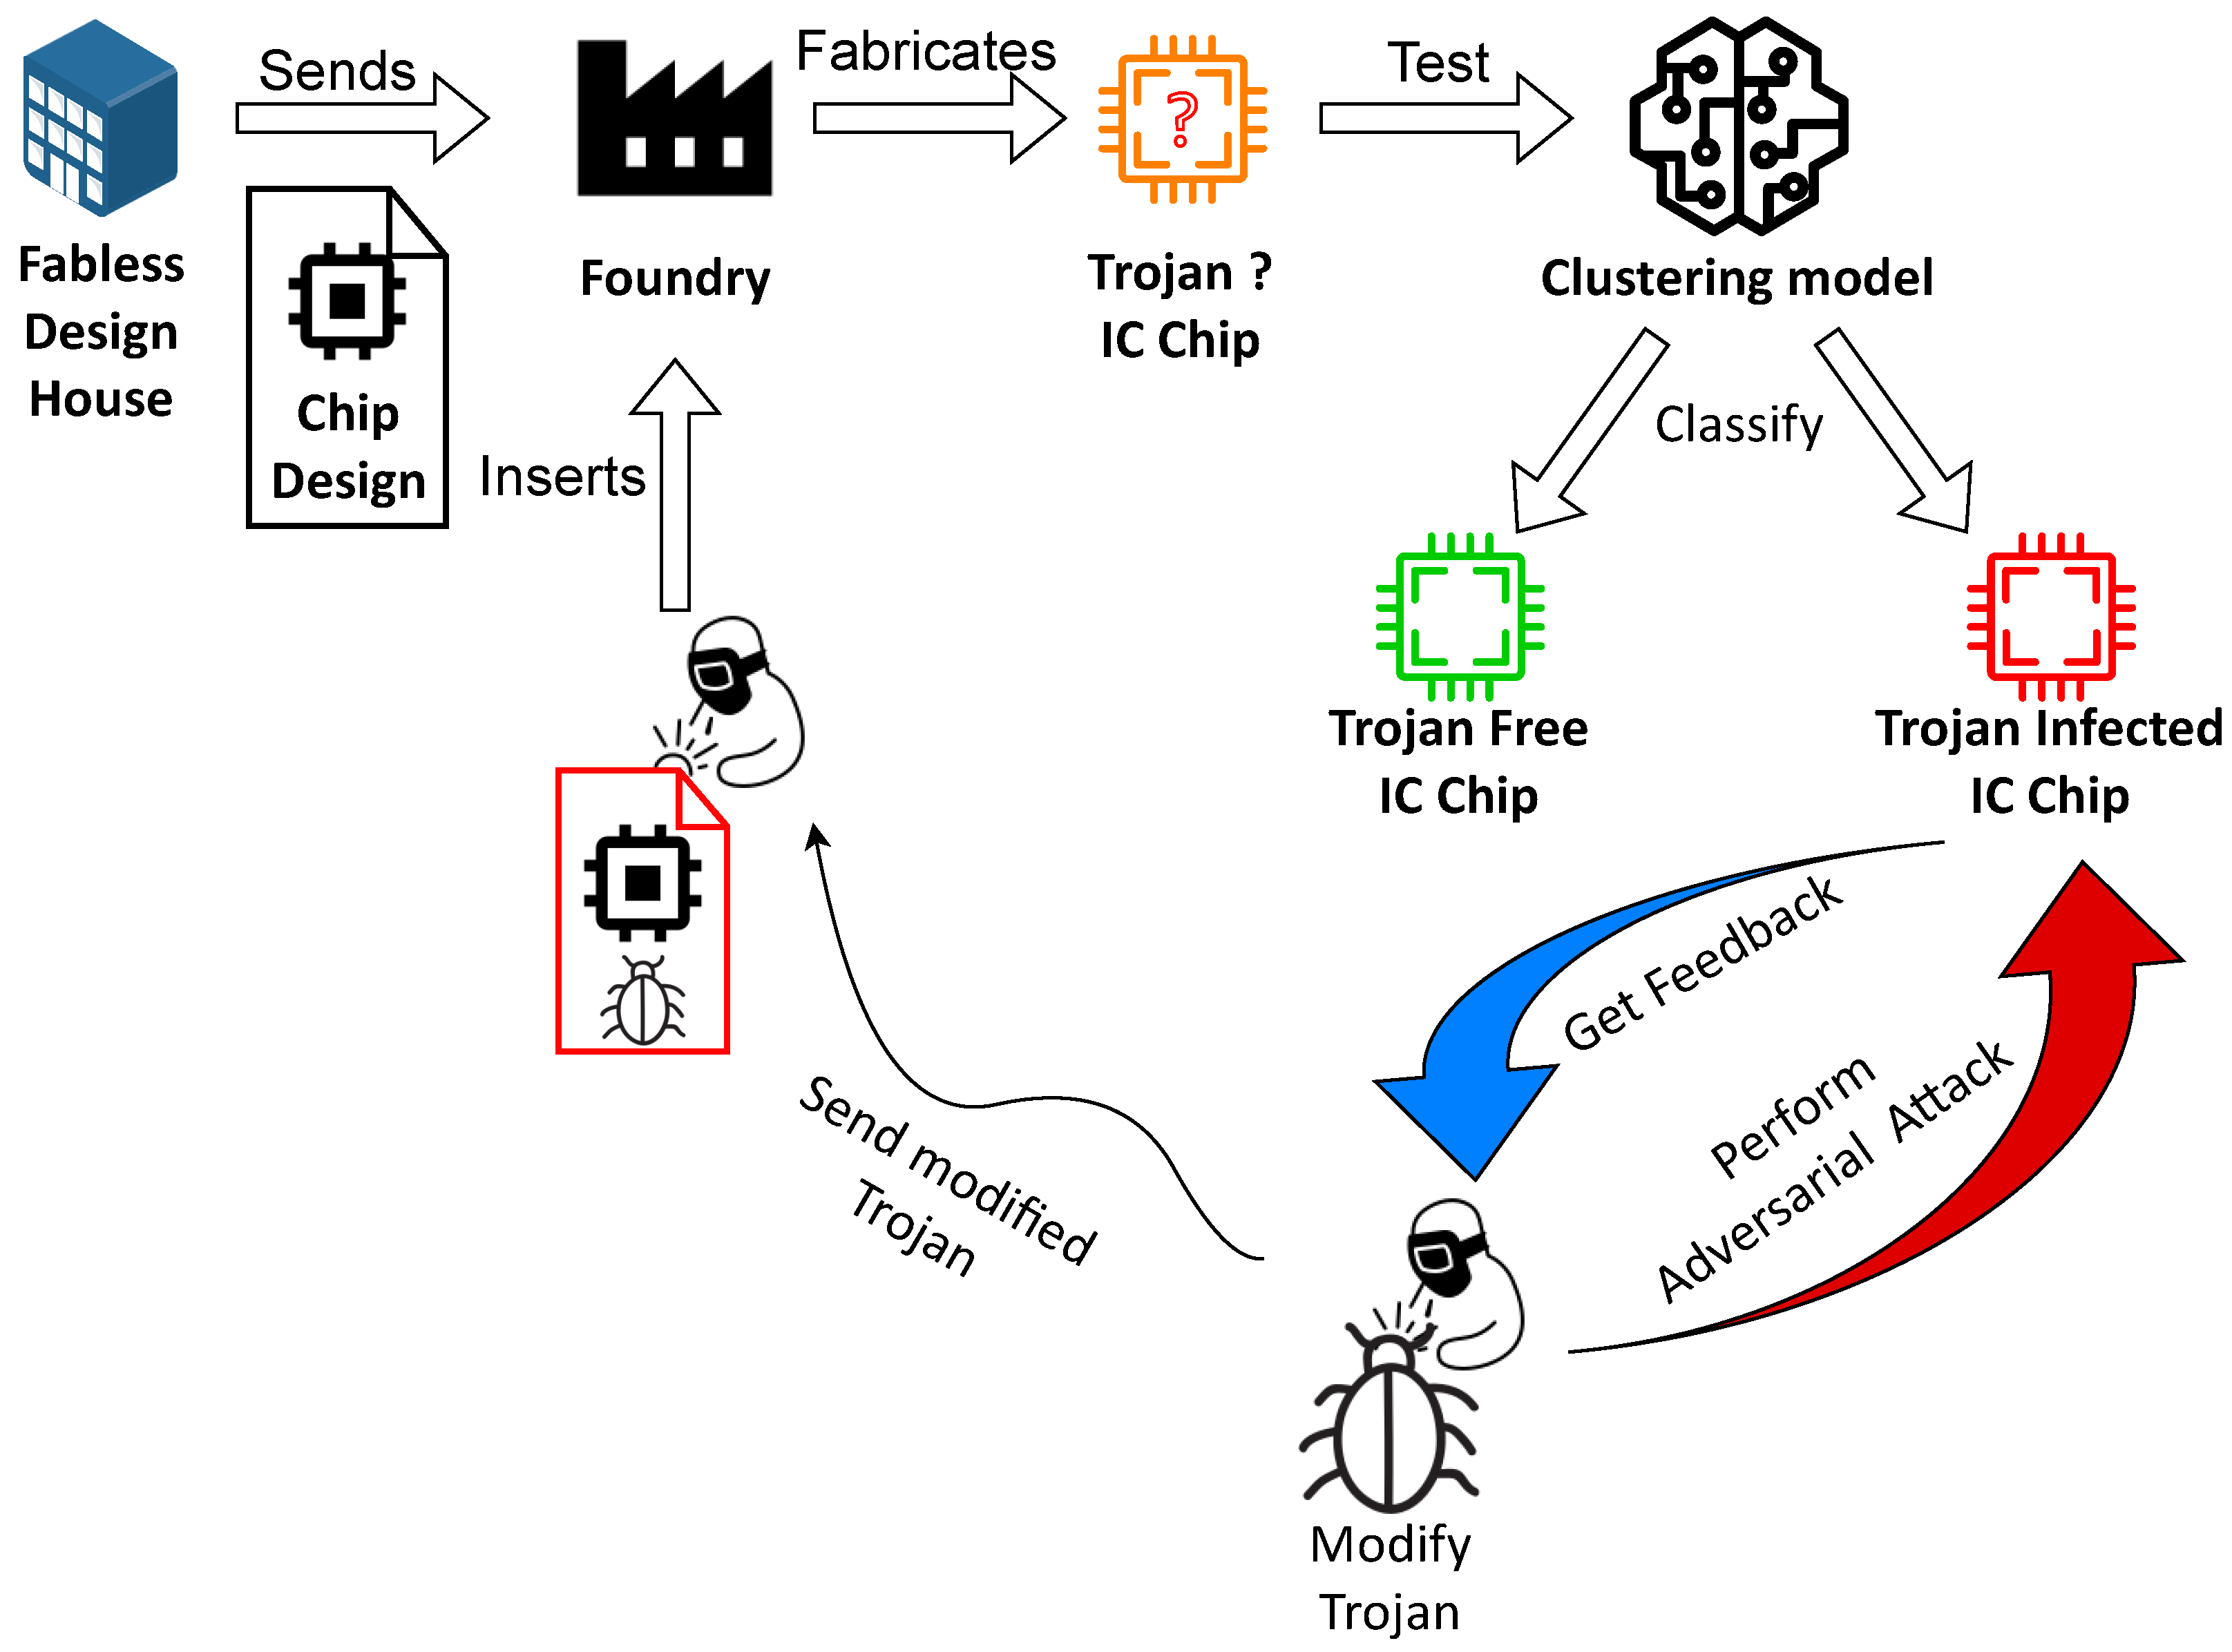
The fabless semiconductor company sends its IC design to a third-party foundry for fabrication as depicted in Figure 2. An HT gets secretly embedded into the IC design before fabrication within this threat model. A machine learning-based detection method processes side-channel data collected from manufactured products to detect potential Trojans.
Unlike prior works that assume the adversary has “white-box” access to the victim’s trained model, we adopt a more realistic assumption where the adversary operates without knowledge of the specific internal parameters of the customer’s detection system. However, the adversary is aware that unsupervised clustering is a standard technique for golden-free detection. Consequently, the adversary constructs a local surrogate model based on similar public datasets or simulations to approximate the defender’s decision boundaries. By launching an attack against this surrogate, the adversary generates perturbations that leverage the property of adversarial transferability, the tendency of adversarial examples effective against one model to also deceive other models with different parameters but similar architectures. The Trojan is thus designed to emit these transferable side-channel patterns, enabling it to evade the unseen target detector during deployment.

2.3. Sources of Variability

A critical challenge in golden-free Trojan detection is distinguishing between malicious modifications and benign variations. In this work, we formally distinguish three fundamentally different sources of variability in side-channel data:
  • Process Variation (PV): This arises from manufacturing tolerances (e.g., dopant fluctuation, lithographic deviations) that cause each chip to have a unique, static baseline frequency profile. PV is structured and permanent for a given die but varies significantly across the population.
  • Measurement and Environmental Noise: This includes thermal drift, voltage fluctuations, and instrumentation errors. Unlike PV, this source is stochastic, time-varying, and often manifests as random or slow-varying distortions in the signal.
  • Adversarial Perturbations: This refers to intentional modifications by an attacker (as defined in the Threat Model) aimed at masking the Trojan’s signature. These perturbations are targeted, non-random, and designed specifically to shift the data distribution across the decision boundary.
These sources of variability possess distinct statistical structures. PV is structured but chip-specific; environmental noise is stochastic; and adversarial perturbations are targeted and distribution-shifting. Traditional anomaly detection often conflates these sources into a single “noise” term, leading to unstable clustering. Our framework addresses them hierarchically: per-chip normalization (Section 6.1) mitigates PV and drift, while clusterwise pseudo-labeling and adversarial training (Section 6.5, Section 6.6, Section 6.7 and Section 6.8) specifically target the model uncertainty introduced by adversarial perturbations.

2.4. Related Work

2.4.1. Machine Learning Models Defending Hardware Trojan Attacks

The detection of Hardware Trojans represents an essential security requirement because these threats endanger electronic systems. The detection of these Trojans relies on SCA, which analyzes power, electromagnetic, magnetic and frequency signals.
The increasing popularity of SCA for HT detection has led researchers to investigate machine learning methods that improve detection capabilities. The authors in [13] developed a hybrid clustering algorithm that uses K-means and hierarchical clustering to detect HTs through SCA. The proposed model reached an area under the curve (AUC) value of 0.99, which surpassed many alternative models. This detection method stands out because it operates independently from golden data acquisition, which becomes difficult when dealing with untrusted foundries.
The authors of [14] developed a real-time machine learning system to detect HTs in Network-on-Chip (NoC) based many-core architectures during the design phase. The proposed methodology showed high accuracy in detecting expected HT attacks while maintaining low power and area overhead.
The authors in [15] developed an HT classification system that detects Trojans at the gate level. The authors used support vector machines (SVMs) and neural networks (NNs) as their machine learning models. The proposed model extracted five features, which it converted into a five-dimensional vector to detect HT nets.
Recent advancements have shifted towards representing circuit netlists as graphs to capture the structural semantics of Trojans. Graph Neural Networks (GNNs) have emerged as a powerful tool for this purpose. For instance, Li et al. [16] proposed a gate-level detection framework using GNNs to model the connectivity between logic gates, achieving high accuracy in identifying trigger logic without golden references.
Similarly, Xiao et al. [17] introduced HTs-GCN, which employs graph convolutional networks with attention-based feature fusion and specific sampling techniques to address class imbalance. This approach enhances the distinguishability of Trojan nodes, achieving superior recall and generalizability across various benchmarks, including Trust-Hub and TRIT-TC.
Parallel to GNNs, Self-Supervised Learning (SSL) has been adopted to overcome the scarcity of labeled Trojan data. Jiang and Ding [18] developed a contrastive learning framework that leverages power consumption data to learn robust feature representations in an unsupervised manner, demonstrating superior generalization against unknown Trojan variants. These methods highlight a growing trend towards automated feature extraction; however, they often require computationally expensive graph construction or training phases. In contrast, our proposed work focuses on a lightweight, tabular feature-based approach that remains robust to adversarial perturbations while maintaining low computational overhead.
The detection of HTs in electronic systems requires ongoing research into effective machine learning models because these threats continue to endanger system security. These models improve electronic system security while enhancing the trustworthiness and reliability of hardware components.

2.4.2. Adversarial Attacks

The deployment of ML models for HT detection continues to grow. Attackers can use adversarial machine learning (AML) techniques to create HTs that evade detection systems. The literature lacks research about adversarial attacks that target side-channel data analysis for HT detection at the fabrication stage. This is a relatively new field. The section examines existing research about adversarial attacks that aim to evade HTs.
Attacks Against Supervised Machine Learning
Supervised machine learning models face major threats from adversarial attacks, which affect healthcare, cybersecurity and image recognition systems. The attacks modify either the input data or training procedures to force models into producing wrong predictions or decisions.
The healthcare sector faces adversarial attack motivations from different stakeholders, including insurance companies and malicious actors who target deep neural network models used for diagnosis and treatment recommendations, according to [19]. The research demonstrates why it is crucial to fix these weaknesses to protect AI-based healthcare systems from being compromised.
Brendel et al. [20] introduced the “Boundary Attack,” a powerful decision-based strategy designed for hard-label black-box settings where neither gradients nor confidence scores are available. Unlike optimization-based attacks that start from the source image, this algorithm initializes with an arbitrary adversarial example and iteratively minimizes the Euclidean distance to the target input by performing a random walk along the decision boundary. This approach demonstrated that even commercial models obfuscating their output probabilities remain vulnerable to geometric evasion attacks, proving that restricting API feedback is an insufficient defense mechanism.
The research by [21] examines actual poisoning and evasion attacks which target supervised learning models, including Random Forest Classifiers, K-Nearest Neighbors and Multi-layer Perceptrons. Security solutions that use these models perform malware detection, spam filtering and network intrusion detection. The authors analyze potential damage to cyber detectors and introduce both current and new defensive methods with a focus on intrusion detection systems.
While initially studied in the image domain, these adversarial vulnerabilities have recently been demonstrated in the hardware security domain. Nozawa et al. [22] and Pan et al. [23] showed that gate-level netlists and side-channel signatures can be mathematically perturbed to generate adversarial examples, effectively fooling ML-based Trojan detectors. Furthermore, Hasegawa et al. [24] introduced “R-HTDetector,” demonstrating that adversarial training—a technique originally designed for computer vision—is essential for hardening HT detection models against these perturbations. These works confirm that the threat of adversarial evasion is not limited to software AI but is a direct threat to golden-free hardware assurance.
Attacks Against Unsupervised Machine Learning
While the literature on adversarial attacks against machine learning is growing, research specifically targeting unsupervised models remains limited. The literature shows that clustering algorithms face significant vulnerabilities to adversarial threats according to recent research findings. The degradation of clustering performance can be achieved through poisoning attacks, which involve adding malicious samples to training data according to [25,26]. Black-box attacks, which lack internal model knowledge, can still produce substantial misclustering effects according to [27].
The optimization of attacks to compromise clustering algorithm fairness represents a particularly difficult challenge. The problem of optimizing attacks to compromise clustering algorithms has been proven to be NP-hard according to [28], which creates a major challenge for researchers. The authors of [29] present a black-box attack strategy against K-means clustering when applied to the MNIST image dataset. The attack method of perturbing a single sample near the decision boundary produces multiple unperturbed samples to be misclustered, which the authors call “spill-over adversarial samples.”
Despite these initial efforts, the literature on adversarial attacks against unsupervised learning models remains scarce. Research on clustering techniques and image datasets makes up the majority of existing studies. The literature lacks substantial research about adversarial attacks that target discrete data-driven unsupervised models. The manipulation of discrete data requires more precise handling than image data because human observers tend to miss small changes in images. The development of successful and unobtrusive attacks for these models continues to be an unresolved problem. The expanding use of unsupervised learning demands robust defense systems to protect against adversarial threats. The reliable deployment of these models depends on protecting their integrity and fairness. The research aims to fill the existing knowledge gap by developing new adversarial attack methods that target discrete data-driven unsupervised learning models.    

3. AI Assisted HT Detection

The section describes how unsupervised clustering techniques reduce false positive rates and detect Trojans within integrated circuits. The research applies hybrid machine learning to develop exact methods for Trojan identification and Trojan-free chip verification. Each chip undergoes a test setup in data collection, which includes infected and non-infected sample chips. The collected data are clustered unsupervisedly to group them according to the infection. After collecting the samples, the detection process follows the steps illustrated in Figure 3. The data preprocessing and sequential data transformation into recognizable forms are part of these steps. Sequence amplitudes found in sequential data enable data recognition through their amplitude values, which select relevant features. The clustering technique generates Trojan-free and infected clusters from the chips. AI model fine-tuning is applied to get exactly the clustering.
The unsupervised model detects Trojan-infected clusters and Trojan-free clusters within the chips. The clustering method assigns clusters to the chips, which enables the chips to be grouped into two distinct categories. The proposed localization model analyzes sequential chip data following this step. The localization algorithm arranges the ROs in each chip to reveal where the Trojan was inserted. These lists of information further speed up reverse engineering in the targeted chip area. The complete assessment procedures enable researchers to distinguish between chips with inserted Trojans and those without them.
The evaluation process of this research benefits from the above strategy, which helps achieve the accuracy of golden-free Trojan detection. The evaluation metrics consist of precision value and the AUC value as well as accuracy, F1-score, recall, precision, False Negative Rate (FNR) and False Positive Rate (FPR).

4. Experimental Setup

4.1. Ring Oscillator

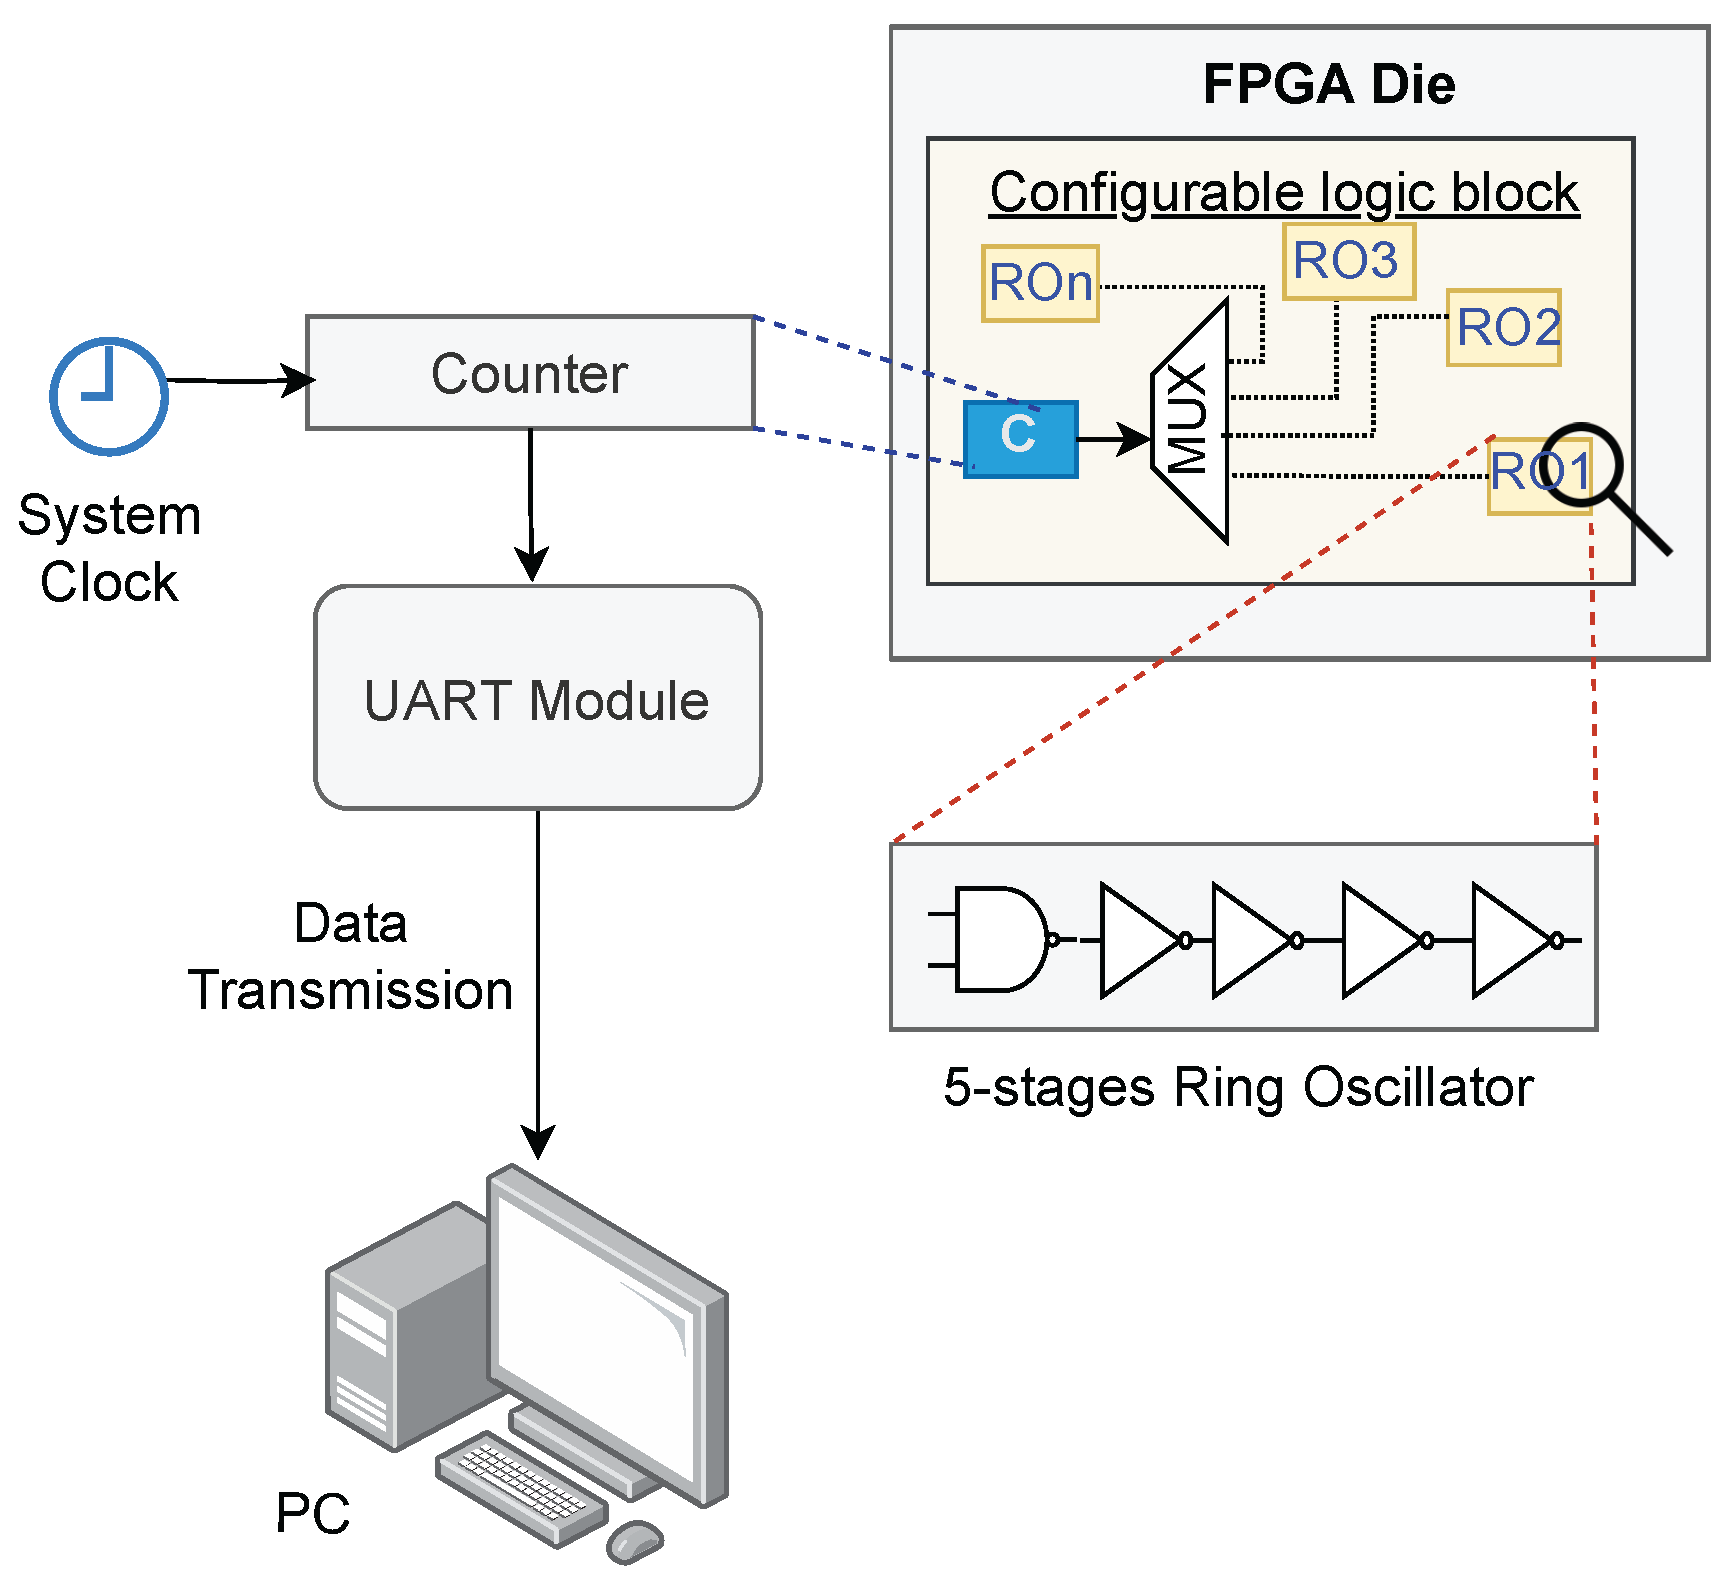
Generally, a ring oscillator comprises a closed loop of an odd number of inverting stages (N). In this investigation, we utilize a 5-stage Ring Oscillator ( N = 5 ) consisting of one NAND gate and four inverters, as illustrated in Figure 4.
The NAND gate serves as the control stage. If the loop consisted entirely of standard inverters, the circuit would oscillate continuously upon device power-up, preventing controlled data acquisition. By using a NAND gate, we introduce an Enable signal input. When the Enable signal is high, the NAND gate acts as an inverter, completing the loop and initiating oscillation; when low, the loop is broken, and the RO enters a static state. This gating mechanism is essential for synchronizing the oscillation with the system counter and minimizing power consumption during idle periods.
The data acquisition process, illustrated in Figure 4, follows a sequential pipeline to capture the side-channel signatures. As shown in the figure, the collection workflow consists of the following steps:
  • Oscillation (Sensing): When enabled, the Ring Oscillator (RO) generates a high-frequency clock signal. This frequency is physically dependent on the local process parameters and the instantaneous voltage drop ( V D D V m a l i _ d r o p ) at that specific location on the die.
  • Selection: A Multiplexer (MUX) selects the output from one of the distributed ROs to be measured, allowing the system to scan different regions of the FPGA sequentially.
  • Quantization: An 8-bit counter captures the RO oscillations over a fixed time window defined by the system clock. This converts the analog frequency behavior into a discrete digital count (the “signature”).
  • Transmission: The Universal Asynchronous Receiver-Transmitter (UART) module serializes the counter output and transmits the data to the host PC for post-processing and clustering analysis.
The circuits are designed to configure the RO blocks in different locations of the FPGA die. Virtually, they can cover every power rail on the chip with their placements. A voltage drop on the rail occurs if adversaries introduce an HT, even if the payload remains dormant. This is due to two primary factors:
  • Trigger Overhead: The Trojan’s trigger mechanism must continuously monitor system signals to detect the activation code. This constant switching activity consumes dynamic power, creating a localized voltage drop.
  • Leakage and Loading: The physical insertion of additional gates (both trigger and payload) increases the local leakage current ( I l e a k ) and parasitic capacitance.
These factors contribute to a specific extra voltage drop ( V m a l i _ d r o p ) and increased delay, which increases the propagation delay. Based on the standard Alpha-Power Law model for CMOS delay [30], the oscillation frequency can be expressed as described in Equation (1):
f = μ g × ( V D D V t h r e s h o l d V m a l i _ d r o p ) α 2 N × k
where:
  • f is the oscillation frequency of the Ring Oscillator.
  • μ g is the gate carrier mobility.
  • V D D is the supply voltage.
  • V t h r e s h o l d is the transistor threshold voltage.
  • V m a l i _ d r o p is the additional voltage drop caused by the Trojan payload.
  • α is the velocity saturation index (typically between 1 and 2).
  • N is the number of inverter stages in the ring.
  • k is the total capacitance and delay constant of the inverter stages.
Equation (1) demonstrates that the frequency of the ROs is inversely proportional to the capacitive loading and delay factors ( N , k ) and directly reduced by the voltage drop ( V m a l i _ d r o p ) induced by the Trojan insertion.

Trojan Design

Adding Trojan circuits to the hardware can help release confidential information generated by the Test Chip. These Trojans are created and hidden within the chip in groups of 8, 16, or 32 bits. Their physical presence and activity introduce local voltage drops, which alter the oscillation frequencies of the nearby ROs as described by Equation (1).

4.2. FPGA Setup

These MicroBlaze CPUs will be implemented on three Basys 3 FPGAs with HTs and ROs. The following section details the FPGA specifications used in this study. The Basys 3 FPGA development boards have Xilinx Artix-7 (XC7A35T-1CPG236C) FPGA chips with USB-JTAG protocol, designed for different forms of communication or interfacing. To implant the RO in the Xilinx XDC (Xilinx Design Constraints) macro characteristic, the particular placement and routineing Macro Feature has been used for placing the RO at a fixed location and ensuring uniform routing.

Dataset Generation: Trojan-Free vs. Trojan-Infected Scenarios

To construct a robust dataset for training and evaluation, we collected RO frequency signatures under two distinct operating conditions. First, we established a “Trojan-Free” baseline by measuring the RO frequencies while the Trojan circuits were inactive (dormant). Second, we activated the Trojan payloads (8-bit, 16-bit, and 32-bit variants) to generate the “Trojan-Infected” data classes.
Crucially, to ensure experimental validity, strictly identical placement and routing constraints were applied to both configurations using Xilinx Vivado. The physical setup, including the FPGA board orientation and Plexiglass thermal shielding, was maintained constant throughout the data acquisition process to minimize environmental noise. This methodology ensures that statistically significant deviations in the RO frequencies can be attributed to the Trojan’s power consumption rather than process variation or ambient thermal fluctuations.

4.3. Data Collection and Preparation

The data preparation procedure in this paper is very crucial for the correct clustering results during unsupervised learning phase. Each data sample collected from the IC is fully representative, containing feature vectors for both “golden” (Trojan-free) scenarios and Trojan-infected scenarios (labeled solely for ground-truth evaluation). The collected data is summarized in Table 1.
It is important to clarify the granularity of the learning task. While the physical dataset comprises 18 FPGA chips (9 Trojan-free and 9 Trojan-infected), the fundamental unit of analysis in our framework is not the chip, but the individual RO. Each chip contains 32 independent ROs distributed across the fabric, and each RO generates a unique 1001 instances considered as a temporal frequency trace. Consequently, the effective dataset size for the machine learning model is  18   chips   ×   32   ROs   =   576   independent   instances .
Furthermore, to prevent the model from merely “fingerprinting” specific chips (i.e., memorizing the absolute process corner of a specific die), we apply two critical preprocessing steps:
  • RO-Level Feature Extraction: Instead of feeding raw time-series data (which would lead to high dimensionality and overfitting), we extract statistical descriptors from the 1001-point traces. These features capture the dynamic behavior and stability of the signal rather than its absolute frequency.
  • Per-Chip Normalization: The Algorithm 1 is implemented that normalizes RO frequencies against the chip’s own median baseline. This removes the global process variation bias (the unique “fingerprint” of the chip) and isolates the relative anomalies caused by local Trojan activity.
Algorithm 1 Normalization Algorithm for Data Preparation
Require:  chipData : Frequencies data matrix ( m × n )
Ensure:  normalizedData : Normalized frequencies data matrix
  1:
Initialize normalizedData as an ( m × n ) matrix
  2:
x global average of all frequency instances in chipData
  3:
for  i = 1 to m do
  4:
      a v g R o w average of row i in chipData
  5:
     for  j = 1 to n do
  6:
          normalizedData [ i ] [ j ] ( chipData [ i ] [ j ] / a v g R o w ) × x
  7:
     end for
  8:
end for
  9:
return  normalizedData
Therefore, the learning objective is to identify the statistical signature of Trojan-induced loading on a specific RO, a pattern that generalizes across different chips, rather than memorizing the identity of the 18 physical devices.
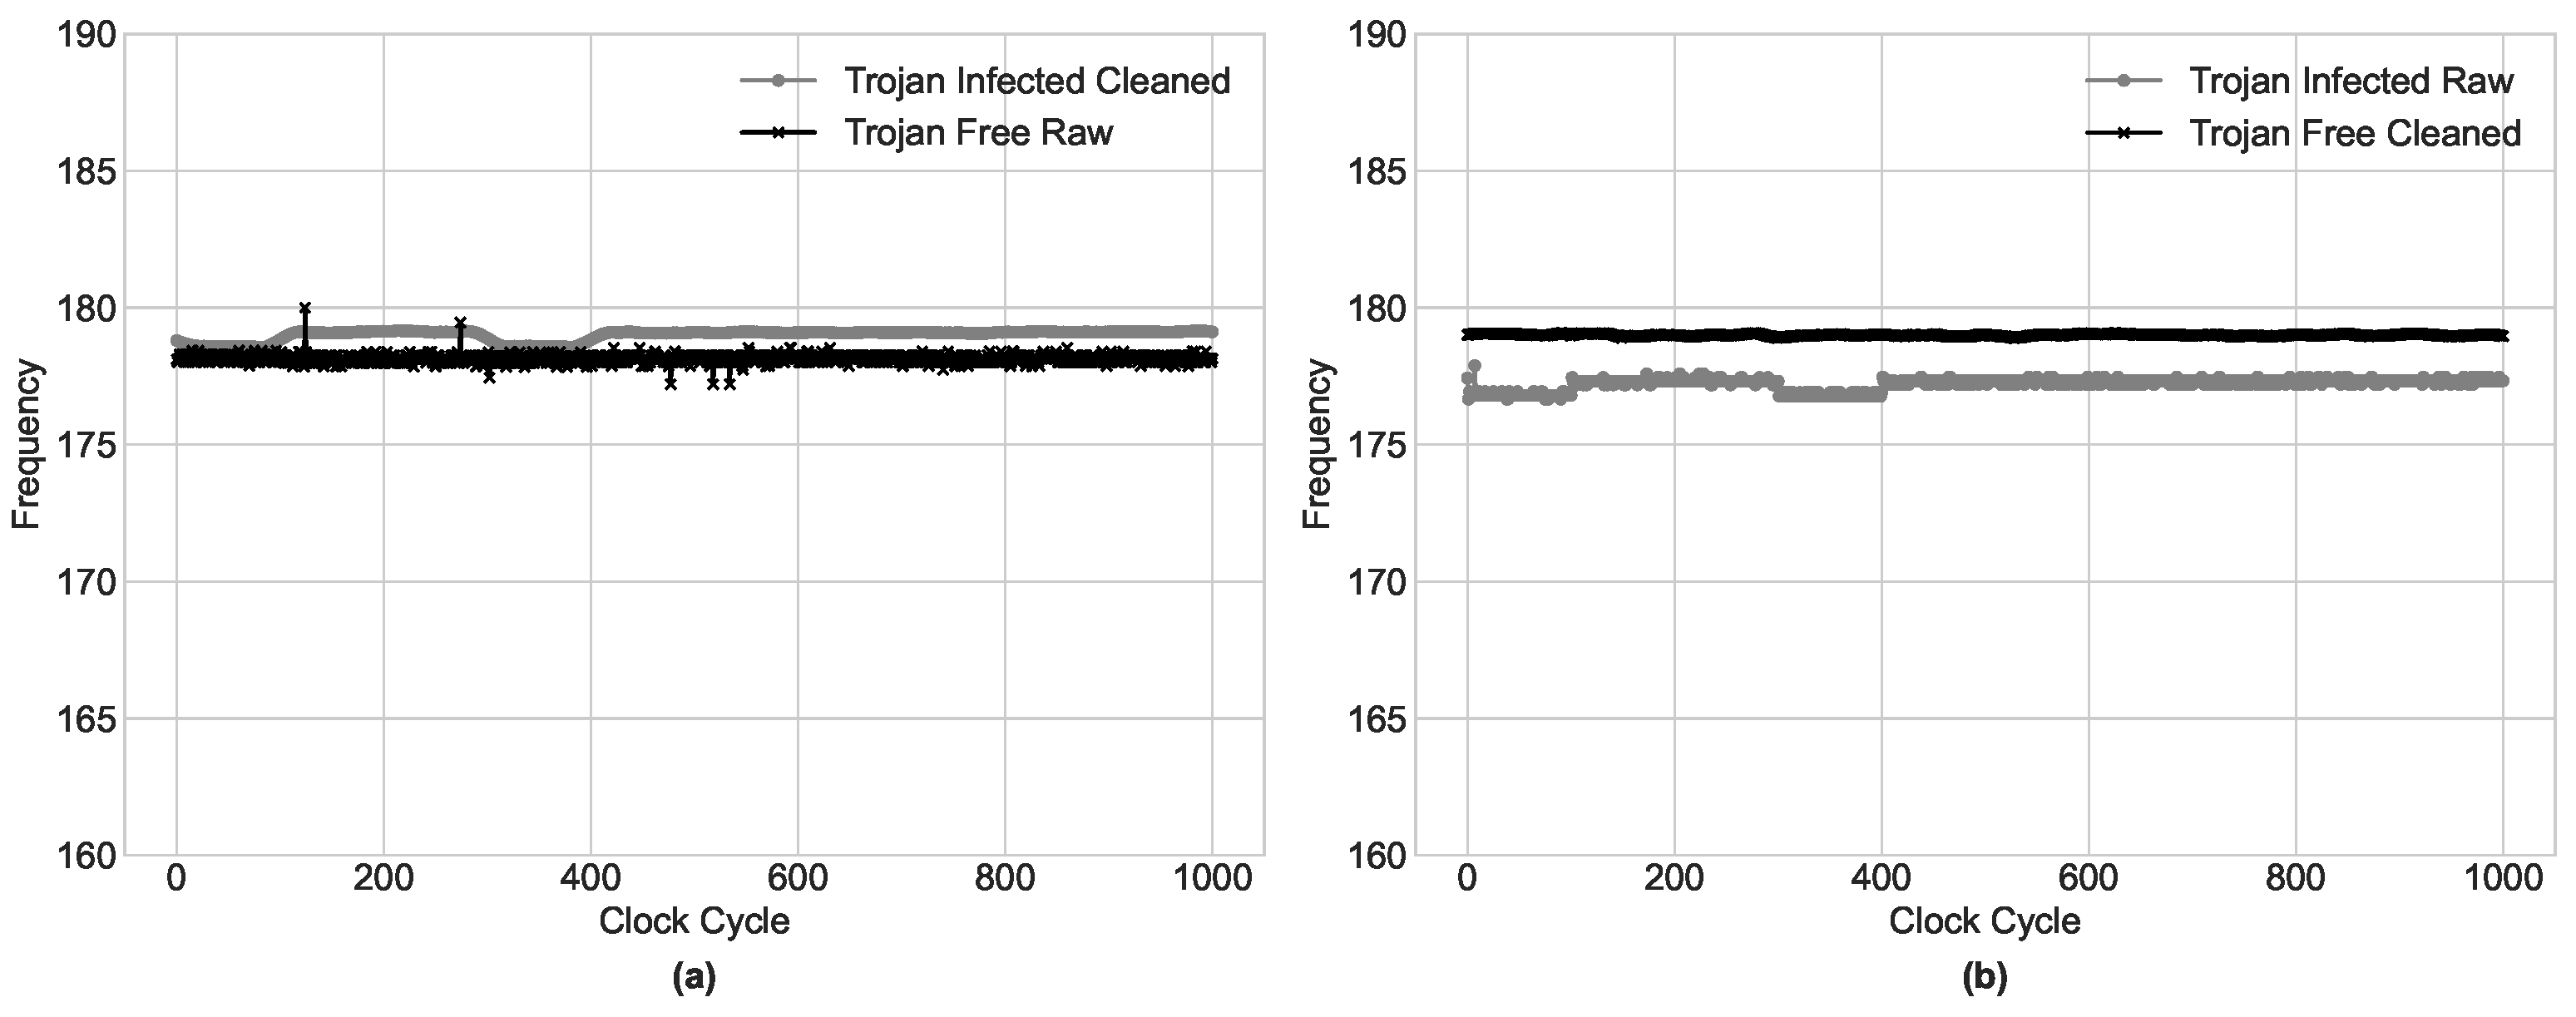
Noise is an element that can bring in undesired fluctuation in a dataset, mainly by the means of random changes or mistakes in measurement. Here, a moving average filter was applied to increase the signal-to-noise ratio. The filter smoothes the values within a specified window, effectively reducing high-frequency fluctuations. The difference between original data and cleaned data is shown in Figure 5. The magnitude of the window will be determined with respect to the properties of the displayed dataset based on the required level of noise reduction. After cleaning the data, it is normalised because the effect of the Trojan on each chip differs. Due to the different physical characteristics of the chips, Trojan-affected SCA data of chip A can look similar to Trojan-unaffected data of chip B. To avoid this situation, Algorithm 1 is employed.

4.4. Feature Extractions

This section provides a robust paradigm for extracting valuable information both in locating Trojan-free and Trojan-inserted chips. It will subject re-processed visual data sequences to image-based methods as well as analyze the extraction process of different statistical features from the data and will develop a totally different approach. The implementation set-up in the experimentation and detailed implementations considering the set of statistical features in the next sections are explained below.
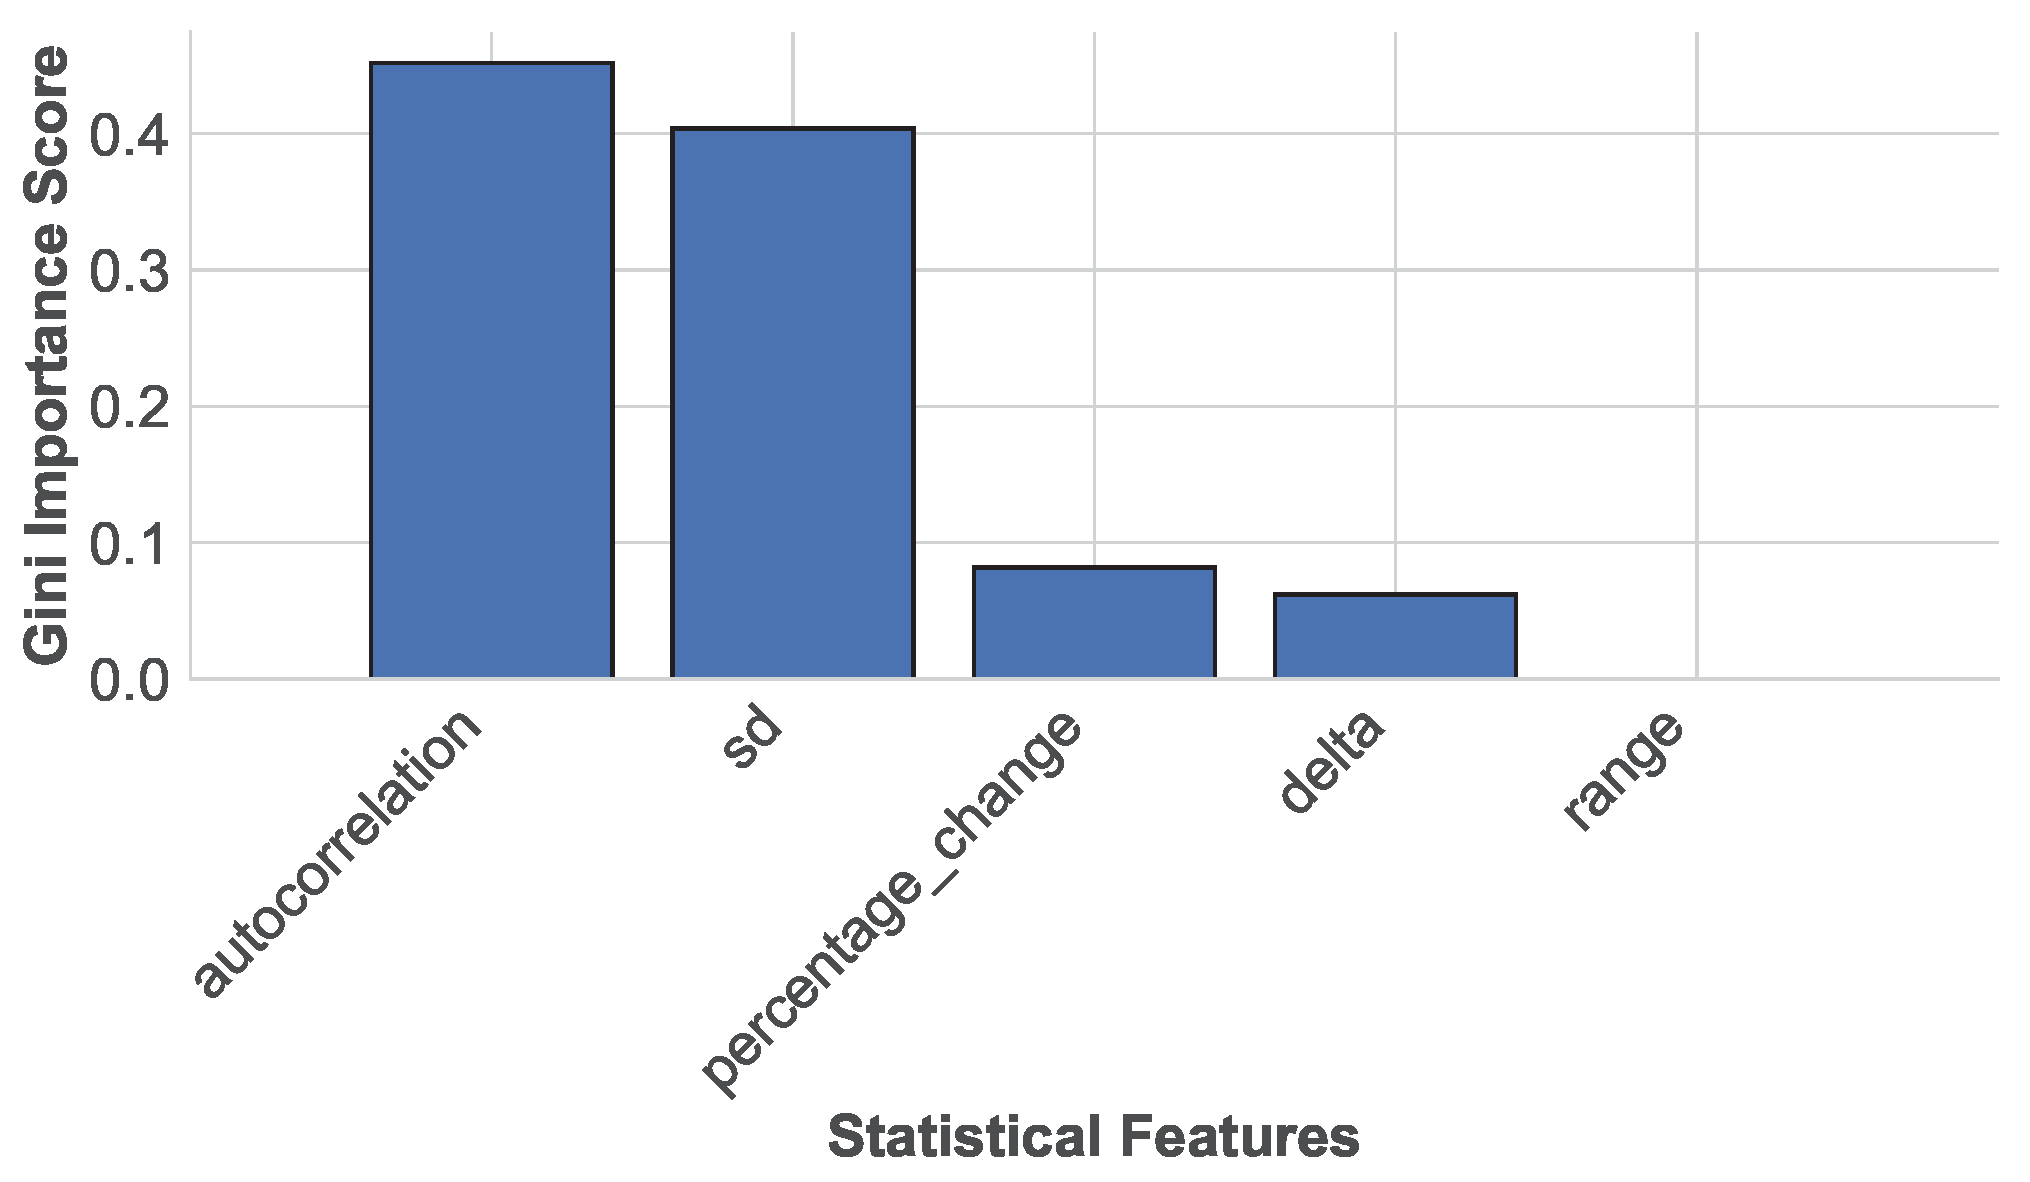
To verify the discriminatory power of our selected statistical descriptors, we conducted a comprehensive feature importance analysis using the Gini importance metric derived from the trained AdaBoost classifier (Figure 6). The high importance scores of higher-order moments empirically validate their discriminatory power in distinguishing Trojan activity from process variation. The analysis reveals that autocorrelation is the most significant predictor of Trojan activity, followed by standard deviation. From a physical perspective, these results are consistent with HT behavior. Autocorrelation captures the temporal signatures of the ring oscillator, which are disrupted by the intermittent switching activity of the Trojan trigger, while Delta effectively flags sudden localized frequency drops caused by the capacitive loading of the Trojan payload. In contrast, Standard Deviation reflects the increased jitter and instability introduced by the malicious logic. This confirms that our feature set is not merely capturing random noise, but is effectively isolating distinct physical perturbations introduced by the Trojan.

4.4.1. Standard Deviation

This is measured by standard deviation σ ; it quantifies the amount by which each datum in the sequence varies from or differs from the mean. Mathematically, this is shown as:
σ = i = 1 n ( x i x ¯ ) 2 n
where x i represents each value in the dataset, x ¯ denotes the mean of the dataset, and n is the total number of values.

4.4.2. Range

The range of a dataset measures the spread between the maximum and minimum RO frequency value for each RO of every chip and is calculated as:
Range = x max x min

4.4.3. Delta

Delta represents the difference between consecutive values in a dataset, calculated as:
Δ = x i + 1 x i

4.4.4. Percentage Change

Percentage change measures the relative change between two consecutive values of RO frequency in each instance, computed as:
Percentage Change = x i + 1 x i x i × 100

4.4.5. Autocorrelation

Autocorrelation measures the correlation between a signal and a delayed version of itself at different time lags. It can be calculated using the formula:
R k = t = k + 1 n ( x t x ¯ ) ( x t k x ¯ ) t = 1 n ( x t x ¯ ) 2
where R k represents the autocorrelation at lag k, x t is the value at time t, x ¯ is the mean of the dataset, and n is the total number of values.
These statistically based features provide valuable insights into the characteristics and behavior of the data, contributing to the Trojan detection process.

4.5. Analysis Method

The K-Means clustering algorithm is utilized as the primary analysis method to differentiate Trojan-infected chips from clean ones using the extracted statistical features. K-Means is a centroid-based unsupervised learning algorithm that partitions a dataset into K distinct, non-overlapping clusters [31]. Each data point is assigned to the cluster with the nearest mean, known as the centroid, which serves as the representative of that cluster.
The algorithm operates by initially selecting K centroids at random. Each data point is then associated with the nearest centroid based on a distance metric, typically Euclidean distance. Subsequently, the centroids are recalculated as the mean of all data points assigned to the corresponding cluster. These steps are repeated iteratively until convergence is achieved, which occurs when the centroids stabilize or a maximum number of iterations is reached.
The objective function of K-Means is to minimize the within-cluster sum of squares (WCSS), defined as:
min C k = 1 K x i C k x i μ k 2
where C k denotes the set of data points in cluster k, μ k is the centroid of cluster k, and x i represents a data point in the feature space.
In the context of HT detection, each data point corresponds to a chip instance characterized by statistical features such as standard deviation, range, delta, percentage change, and autocorrelation of RO frequencies. The clustering process aims to separate these instances into groups that reflect Trojan-free and Trojan-infected behavior, without relying on labeled data.
The centroid-based nature of K-Means presents both strengths and weaknesses. While it offers computational efficiency and interpretability, it is inherently sensitive to small perturbations in the feature space. This characteristic can be exploited by adversaries, who may subtly modify the input data to shift Trojan-infected samples closer to centroids representing Trojan-free clusters. As a result, these manipulated samples may be misclassified, thereby evading detection.

5. Proposed Adversarial Attack on Clustering

Adversarial attacks remain a persistent concern despite the application of various defense techniques. In simpler terms, even small alterations in test samples, which are imperceptible to humans, can still confuse machine learning models and result in misclassifications. Despite the distinctive models and experimental setups proposed in our research, they have revealed vulnerabilities that are susceptible to exploitation.
In HT security, we suggest the usage of frequency side-channel analysis while coming up with defenses against HT attacks. However, adversaries can easily make use of easily vulnerable points through the cloning of a legitimate chip and the embedding of a malicious circuit in the respective cloned chip, differing just a little in frequency from the authentic circuit. This causes confusion in the ML detection models, and so the classification of the circuit is identified as Trojan-free.
Adversarial data attacks on clustering models aim at the clustering models’ misclassification of manipulated data points into another cluster. The following algorithm presents a process of perturbing the source and destination of data points from a good cluster, A, into another good cluster, B, and consequently causes them to be misclustered with the highest perturbation, under a perturbation threshold parameter Θ and step size t.

Physical Realizability of Adversarial Perturbations

A critical consideration in hardware security is the mapping between mathematical feature perturbations and physical reality. While Algorithm 2 operates in the feature space (modifying x to x ), these mathematical shifts correspond to tangible modifications in the Trojan’s design implemented during the pre-silicon layout phase.
Algorithm 2 Adversarial Attack Algorithm
Require: Sorted pairs array D, maximum perturbation Θ , step size t
Ensure: Subset of perturbed data points successfully misclustered X
  1:
for all pair d D do
  2:
    Let a be the original sample and x be the adversarial sample (initially x a )
  3:
    Perturb the features of x in the direction of point b in the pair
  4:
    for all feature x i of the adversarial sample do
  5:
        Compute sign sign   ( b i x i )
  6:
         x i x i + t × sign
  7:
        Compute magnitude:  δ | | x a | | 2  {Euclidean distance}
  8:
        if  δ > Θ  then
  9:
           continue to next pair d
10:
        end if
11:
        if  x is clustered into target cluster B then
12:
           Add x to set X
13:
           break
14:
        else
15:
           Continue perturbation loop
16:
        end if
17:
    end for
18:
end for
where:
  • Source Cluster (A) contains the data points intended for misclassification.
  • Target Cluster (B) is the desired misclassification cluster.
  • Sorted Pairs array (D) is an array of k (a, b) point pairs with the smallest Euclidean distance in ascending order, where a A and b B .
  • Maximum perturbation ( Θ ) represents the threshold for permissible perturbations.
  • Step size (t) indicates the magnitude of each perturbation step.
  • k denotes the number of closest points to Target Cluster B to be perturbed.
  • X a and X b are subsets of the dataset clustered in Source Cluster (A) and Target Cluster (B), respectively.
  • x a X a represents a data point in Source Cluster (A), and x b X b represents a data point in Target Cluster (B).
  • X is the subset of perturbed data points successfully misclustered, where x X and x A x B .
We map our specific feature set to physical hardware parameters as follows:
  • Modulating ‘Delta’ and ‘Range’ (Magnitude Features): The ‘Delta’ feature captures the maximum localized frequency drop, while ‘Range’ captures the global spread. In a physical setting, these are directly proportional to the Capacitive Load of the Trojan payload. During the mask design stage, an attacker physically “perturbs” these values by adding or removing gates in the Trojan design. A larger Trojan payload induces a steeper frequency drop (increasing ‘Delta’), effectively sliding the feature vector along the magnitude axis.
  • Modulating ‘Autocorrelation’ (Temporal Feature): This feature quantifies the temporal dependency and stability of the ring oscillator signal. Physically, this is controlled by the Trojan Triggering Activity. By adjusting the trigger logic definition in the netlist to switch less frequently or in specific burst patterns, an attacker can mathematically shift the autocorrelation value to mimic benign process noise.
It is important to note that these perturbations are not applied to fabricated chips. Instead, the adversary utilizes a surrogate model (as defined in Section 2.2) to iteratively optimize the Trojan’s design parameters before fabrication. The optimized feature vector x guides the foundry to manufacture a chip that inherently possesses the statistical properties required to evade detection.

6. Proposed Defensive Method

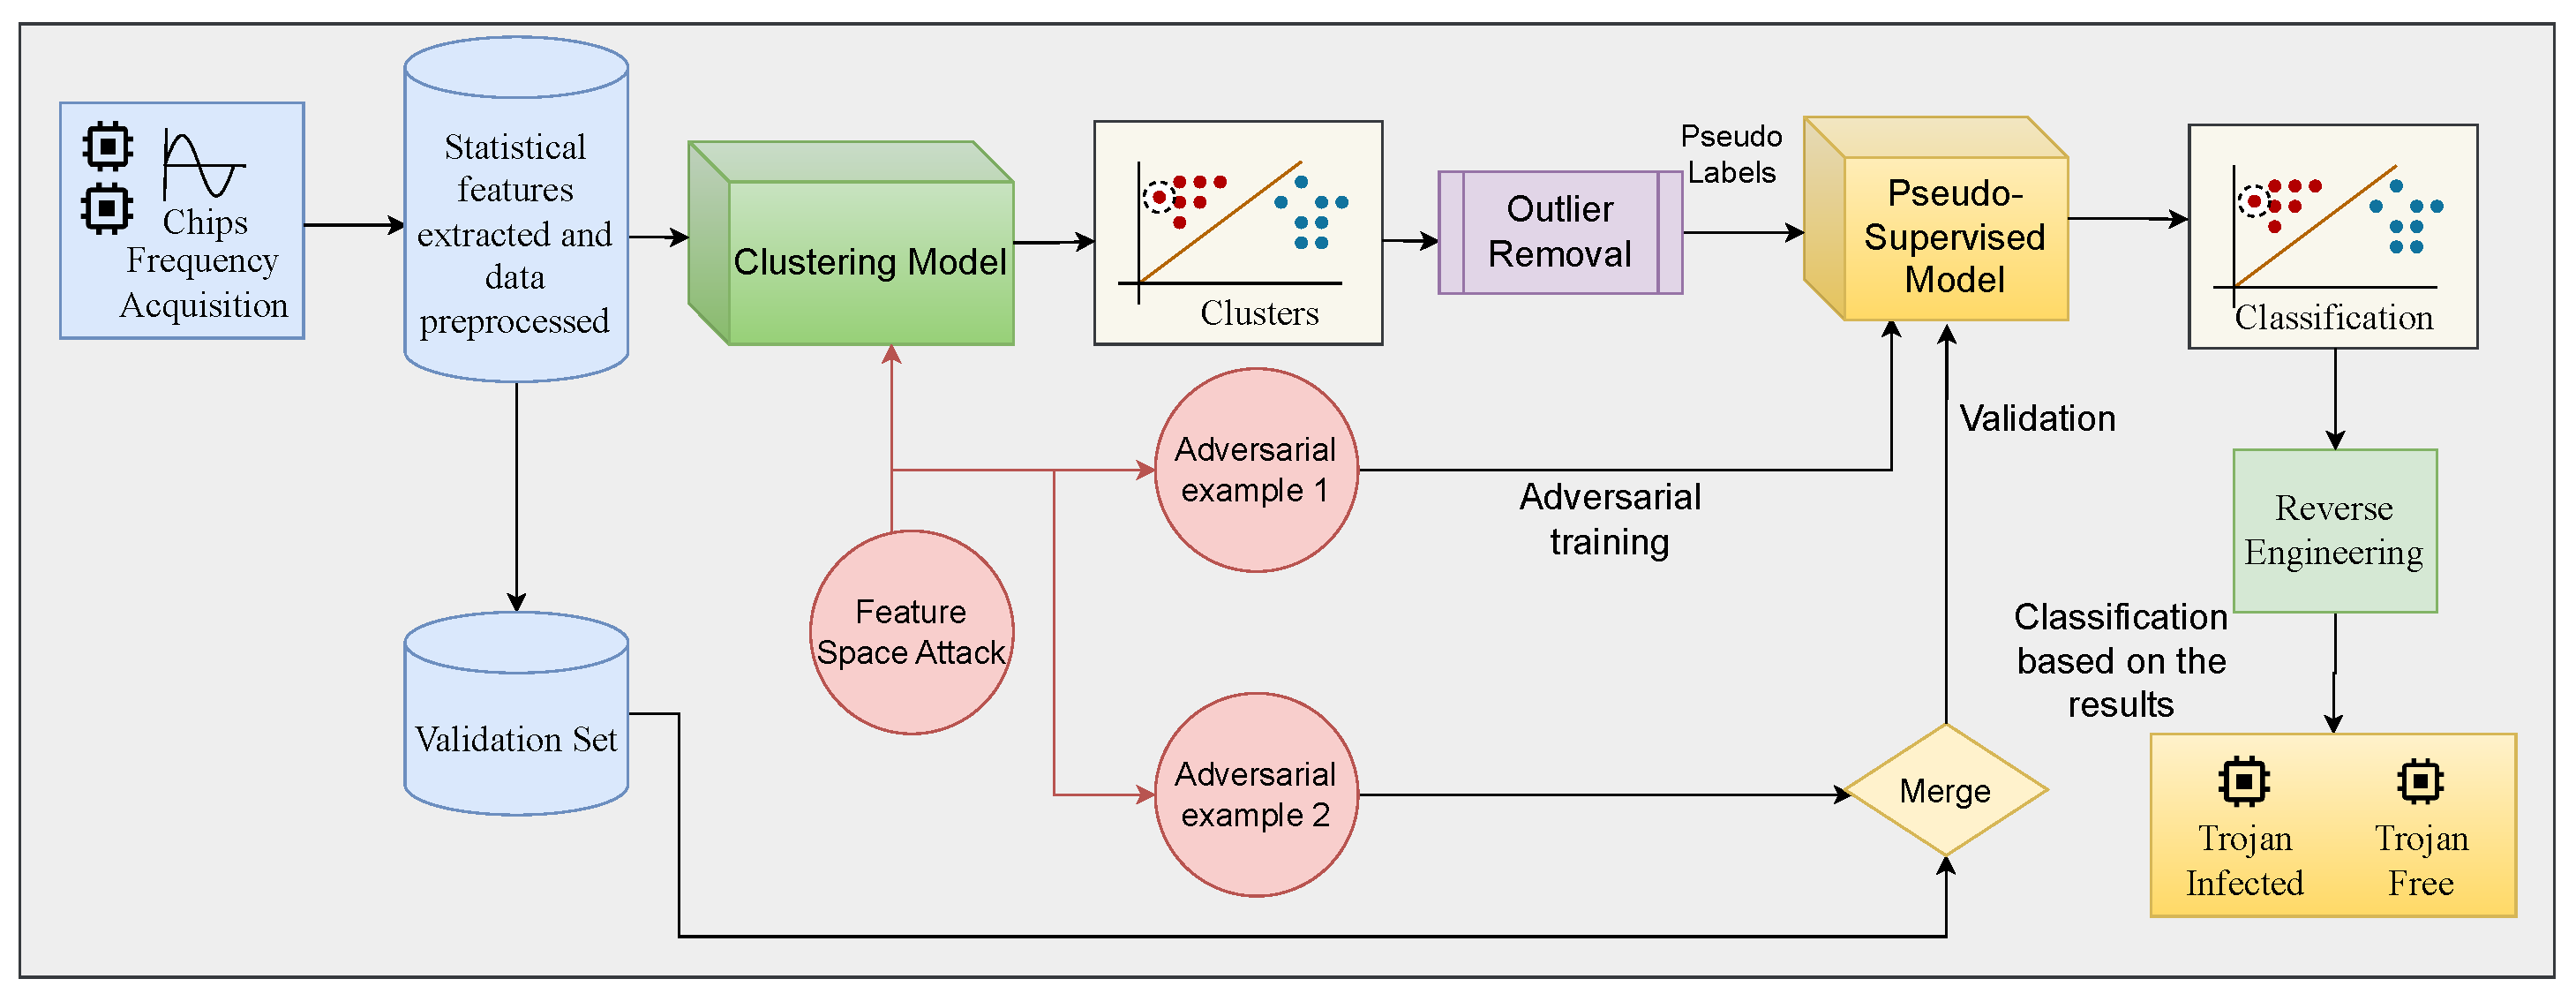
The proposed defense consists of two major stages: (1) unsupervised clusterwise pseudo-label generation, and (2) supervised classification and adversarial training. The first stage builds a trusted pseudo-labeled dataset from raw chip measurements, while the second leverages this dataset to train an adversarially resilient AdaBoost classifier. This section details the pseudo-label generation process, which is critical to ensuring robustness without golden references. The flow of the defensive approach is illustrated in Figure 7.

6.1. Per-Chip Normalization

Each chip provides frequency measurements from d   =   32 ring oscillators (ROs) across multiple instances (1001 per RO). Since each chip is fabricated independently, its absolute RO frequencies may differ due to process variations, voltage fluctuations, and measurement conditions. Consequently, direct comparison of raw frequency values across chips is misleading, as differences may reflect environmental drift rather than Trojan activity. The step-by-step implementation of this procedure is detailed in Algorithm 3.
To ensure comparability, we normalize each chip individually by standardizing all of its RO measurements. For chip i, the normalized measurement R ˜ i j for RO j is given by
R ˜ i j = R i j μ i σ i ,
where R i j is the raw frequency of RO j on chip i, while μ i and σ i denote the mean and standard deviation computed across all ROs and instances of chip i. This normalization preserves the shape of the distribution while removing chip-specific offsets and scales, allowing the subsequent feature extraction to focus on statistical anomalies caused by Trojan insertion rather than unrelated chip-to-chip variability.
Algorithm 3 Per-Chip Normalization
Require: Raw frequency measurements { R i j } for each chip i
Ensure: Normalized measurements R ˜ i j
  1:
for all chip i do
  2:
    Compute μ i mean ( { R i j } )
  3:
    Compute σ i std ( { R i j } )
  4:
    for all measurement R i j of chip i do
  5:
         R ˜ i j ( R i j μ i ) / σ i
  6:
    end for
  7:
end for

6.2. Statistical Descriptors

While normalization aligns chips to a common reference scale, it does not explicitly capture higher-order distributional information. HTs are known to alter not only the mean frequency of ROs, but also their variability and distributional shape. To capture these effects, we compute a set of statistical descriptors for each RO of each chip.
For chip i and RO j, let R ˜ i j k denote the normalized frequency measurement of the k-th instance ( k = 1 , , n ) of RO j. We define the following descriptors:
μ i j = 1 n k = 1 n R ˜ i j k ,
σ i j = 1 n k = 1 n ( R ˜ i j k μ i j ) 2 ,
skew i j = 1 n k = 1 n R ˜ i j k μ i j σ i j 3 ,
kurt i j = 1 n k = 1 n R ˜ i j k μ i j σ i j 4 3 ,
where:
  • R ˜ i j k is the normalized frequency of the k-th measurement of RO j on chip i after per-chip normalization.
  • n is the total number of measurement instances per RO.
  • μ i j is the mean of the normalized RO measurements, representing the central tendency.
  • σ i j is the standard deviation of the normalized RO measurements, capturing variability.
  • skew i j measures the asymmetry of the RO frequency distribution. Positive skew indicates a longer tail on the right, while negative skew indicates a longer tail on the left.
  • kurt i j quantifies the tail heaviness (peakedness) of the distribution. The subtraction of 3 makes it excess kurtosis, so that a normal distribution has kurtosis zero.
Concatenating these descriptors across all d ROs yields the chip-level statistical feature vector:
x i ( stat ) = μ i j , σ i j , skew i j , kurt i j j = 1 d .
This feature vector summarizes both the central tendency and higher-order moments of each RO’s frequency distribution, enabling detection of subtle anomalies caused by HTs.

6.3. Correlation Features

HTs may also influence how ROs interact with each other. A Trojan that alters power distribution, for example, may create correlated fluctuations across multiple oscillators. To capture such interdependencies, we compute the Pearson correlation coefficients between every pair of ROs:
ρ j , k = cov ( R ˜ · j , R ˜ · k ) σ j σ k , 1 j < k d ,
where σ j and σ k are the standard deviations of oscillators j and k, respectively. The upper-triangular portion of the correlation matrix is vectorized and appended to the statistical descriptors, yielding a combined feature vector:
x i = x i ( stat ) , ρ j , k .
This feature vector now reflects both local RO statistics and global RO interactions. The collection of these vectors X = { x 1 , x 2 , , x m } constitutes the input dataset for the proposed framework. Specifically, each x i serves as an input sample for the Normalization procedure (Algorithm 1) and is subsequently processed by the Adversarial Attack Algorithm (Algorithm 2) to generate perturbed training examples.

6.4. Dimensionality Reduction

The combined feature space is high-dimensional, containing thousands of features (from both statistical descriptors and correlations). To improve clustering efficiency and robustness, we apply principal component analysis (PCA). Features are first standardized, then projected into a lower-dimensional subspace. Principal components are retained until 95% of the total variance is preserved, ensuring that the reduced representation maintains essential discriminatory information while discarding redundant noise. The reduced chip representation is denoted as z i .
We employ PCA to reduce feature dimensionality while preserving 95% of the total variance. While it is often argued that anomalies reside in low-variance components, this assumption holds primarily for raw data. In our framework, we utilize engineered statistical features (e.g., Delta, Autocorrelation) specifically designed to amplify the Trojan’s signature. Consequently, the Trojan-induced deviations manifest as structural variance captured in the top Principal Components.
The discarded bottom 5% of variance corresponds primarily to uncorrelated stochastic noise, such as thermal fluctuations and measurement jitter, which do not correlate with the Trojan’s systematic structural impact. Removing these low-variance components acts as a denoising step, enhancing the signal-to-noise ratio (SNR) for the subsequent clustering phase.

6.5. Clusterwise Pseudo-Labeling

To separate Trojan-free and Trojan-inserted chips without a golden reference, we apply k-means clustering ( k = 2 ) to the PCA-reduced chip representations { z i } . Each chip is thus assigned a cluster label c i { 0 , 1 } . However, directly using cluster labels as ground truth risks propagating noise, as some chips may be ambiguously assigned. To mitigate this, we introduce a clusterwise filtering strategy that retains only high-confidence chips.

6.5.1. Per-Chip Validation Metrics

For each chip i, two complementary metrics are computed:
  • Silhouette score s i , which quantifies how well chip i fits within its assigned cluster relative to the nearest alternative cluster. Higher s i indicates stronger cluster membership.
  • Bootstrap stability π i , defined as the fraction of clustering runs (under bootstrap resampling of features) in which chip i is consistently assigned to the same cluster. This measures robustness to perturbations.

6.5.2. Clusterwise Thresholding

To avoid global thresholds that may unfairly penalize minority clusters, thresholds are computed within each cluster. Specifically, for cluster C k , we calculate the median silhouette s ˜ k and median stability π ˜ k . A chip i C k is retained if
s i s ˜ k and π i π ˜ k .
The retained chips form a high-confidence seed set T with pseudo-labels y i = c i . Non-retained chips are excluded from training, preventing mislabeled samples from corrupting the supervised model. This filtering step thus converts noisy unsupervised clusters into a small but trustworthy pseudo-labeled dataset, which can then be leveraged by downstream classifiers.

6.6. Refining Decision Boundaries via Core-Based Learning

A critical aspect of our framework is ensuring that the supervised classifier does not merely replicate the errors of the initial unsupervised clustering. Standard k-means assumes spherical clusters and often misclassifies samples at the decision boundaries (low confidence regions).
By applying Clusterwise Filtering (Equation (13)), we remove these ambiguous boundary samples and retain only the “Cluster Cores”, samples with high silhouette scores and bootstrap stability. The supervised model (AdaBoost) is then trained exclusively on these high-confidence cores. Unlike k-means, AdaBoost learns a non-linear discriminative hyperplane. This allows the model to generalize the properties of the core samples to correctly classify the previously ambiguous boundary samples, effectively correcting the initial clustering errors rather than propagating them.

6.7. Training the Supervised Model

The pseudo-labeled dataset is used to train an AdaBoost classifier. AdaBoost, short for Adaptive Boosting, is an ensemble learning method that combines multiple weak classifiers (e.g., decision trees) to form a strong classifier. The training process emphasizes misclassified samples by assigning them higher weights, ensuring that subsequent classifiers focus on these challenging cases.
The weight update process in AdaBoost is governed by the following equations:
α t = 1 2 ln 1 e t e t ,
where α t represents the weight of the t-th weak classifier, and e t is its error rate. The sample weights are updated as:
w i t + 1 = w i t exp α t y i h t ( x i ) ,
where y i is the true label of sample i, x i is the input feature, and h t ( x i ) is the prediction of the t-th weak classifier. These weights are normalized to maintain a valid probability distribution.
The first AdaBoost model, modell, is trained using the pseudo-labeled dataset and saved as model1.pkl. This model is tested against adv_sample to evaluate its initial robustness against adversarial attacks.

6.8. Adversarial Training and Model Enhancement

To enhance resilience, the pseudo-labeled dataset is augmented with adv_sample2, creating a comprehensive training set that includes diverse adversarial scenarios. A second AdaBoost model, model2, is trained on this augmented dataset following the same methodology as model1. The inclusion of adversarial examples during training enables model2 to learn robust decision boundaries, making it resilient to future adversarial perturbations.

6.9. Validation and Testing

The final model, model2, is tested against both adv_sample and a validation set. The validation process evaluates classification accuracy, precision, recall, F1-score, and robustness against adversarial attacks. Results demonstrate that model2 significantly outperforms model1, achieving higher accuracy and resilience.
To further validate the model’s reliability, reverse engineering is applied to Trojan-infected samples. This step identifies the insertion points of HTs within the integrated circuits, providing actionable insights for hardware security.
The proposed method effectively transforms an unsupervised clustering model into a pseudo-supervised framework. By integrating adversarial training, outlier removal, and pseudo-labeling, the approach enhances the robustness of HT detection. Unlike traditional supervised learning, this method does not rely on ground truth labels, making it adaptable to scenarios where labeled data is scarce or unavailable.
The use of AdaBoost further strengthens the system by creating a robust classifier capable of handling adversarial perturbations. This iterative and modular methodology can be extended to other unsupervised machine learning applications, paving the way for more secure and trustworthy clustering systems.
This defensive approach establishes a secure and reliable framework for HT detection, ensuring the integrity of integrated circuits in adversarial environments.

7. Results and Discussions

This section discusses the results of an unsupervised approach to detecting the HT, adversarial attack in some of the models and the results after implementing the defense strategy.

7.1. Hardware Trojan Detection

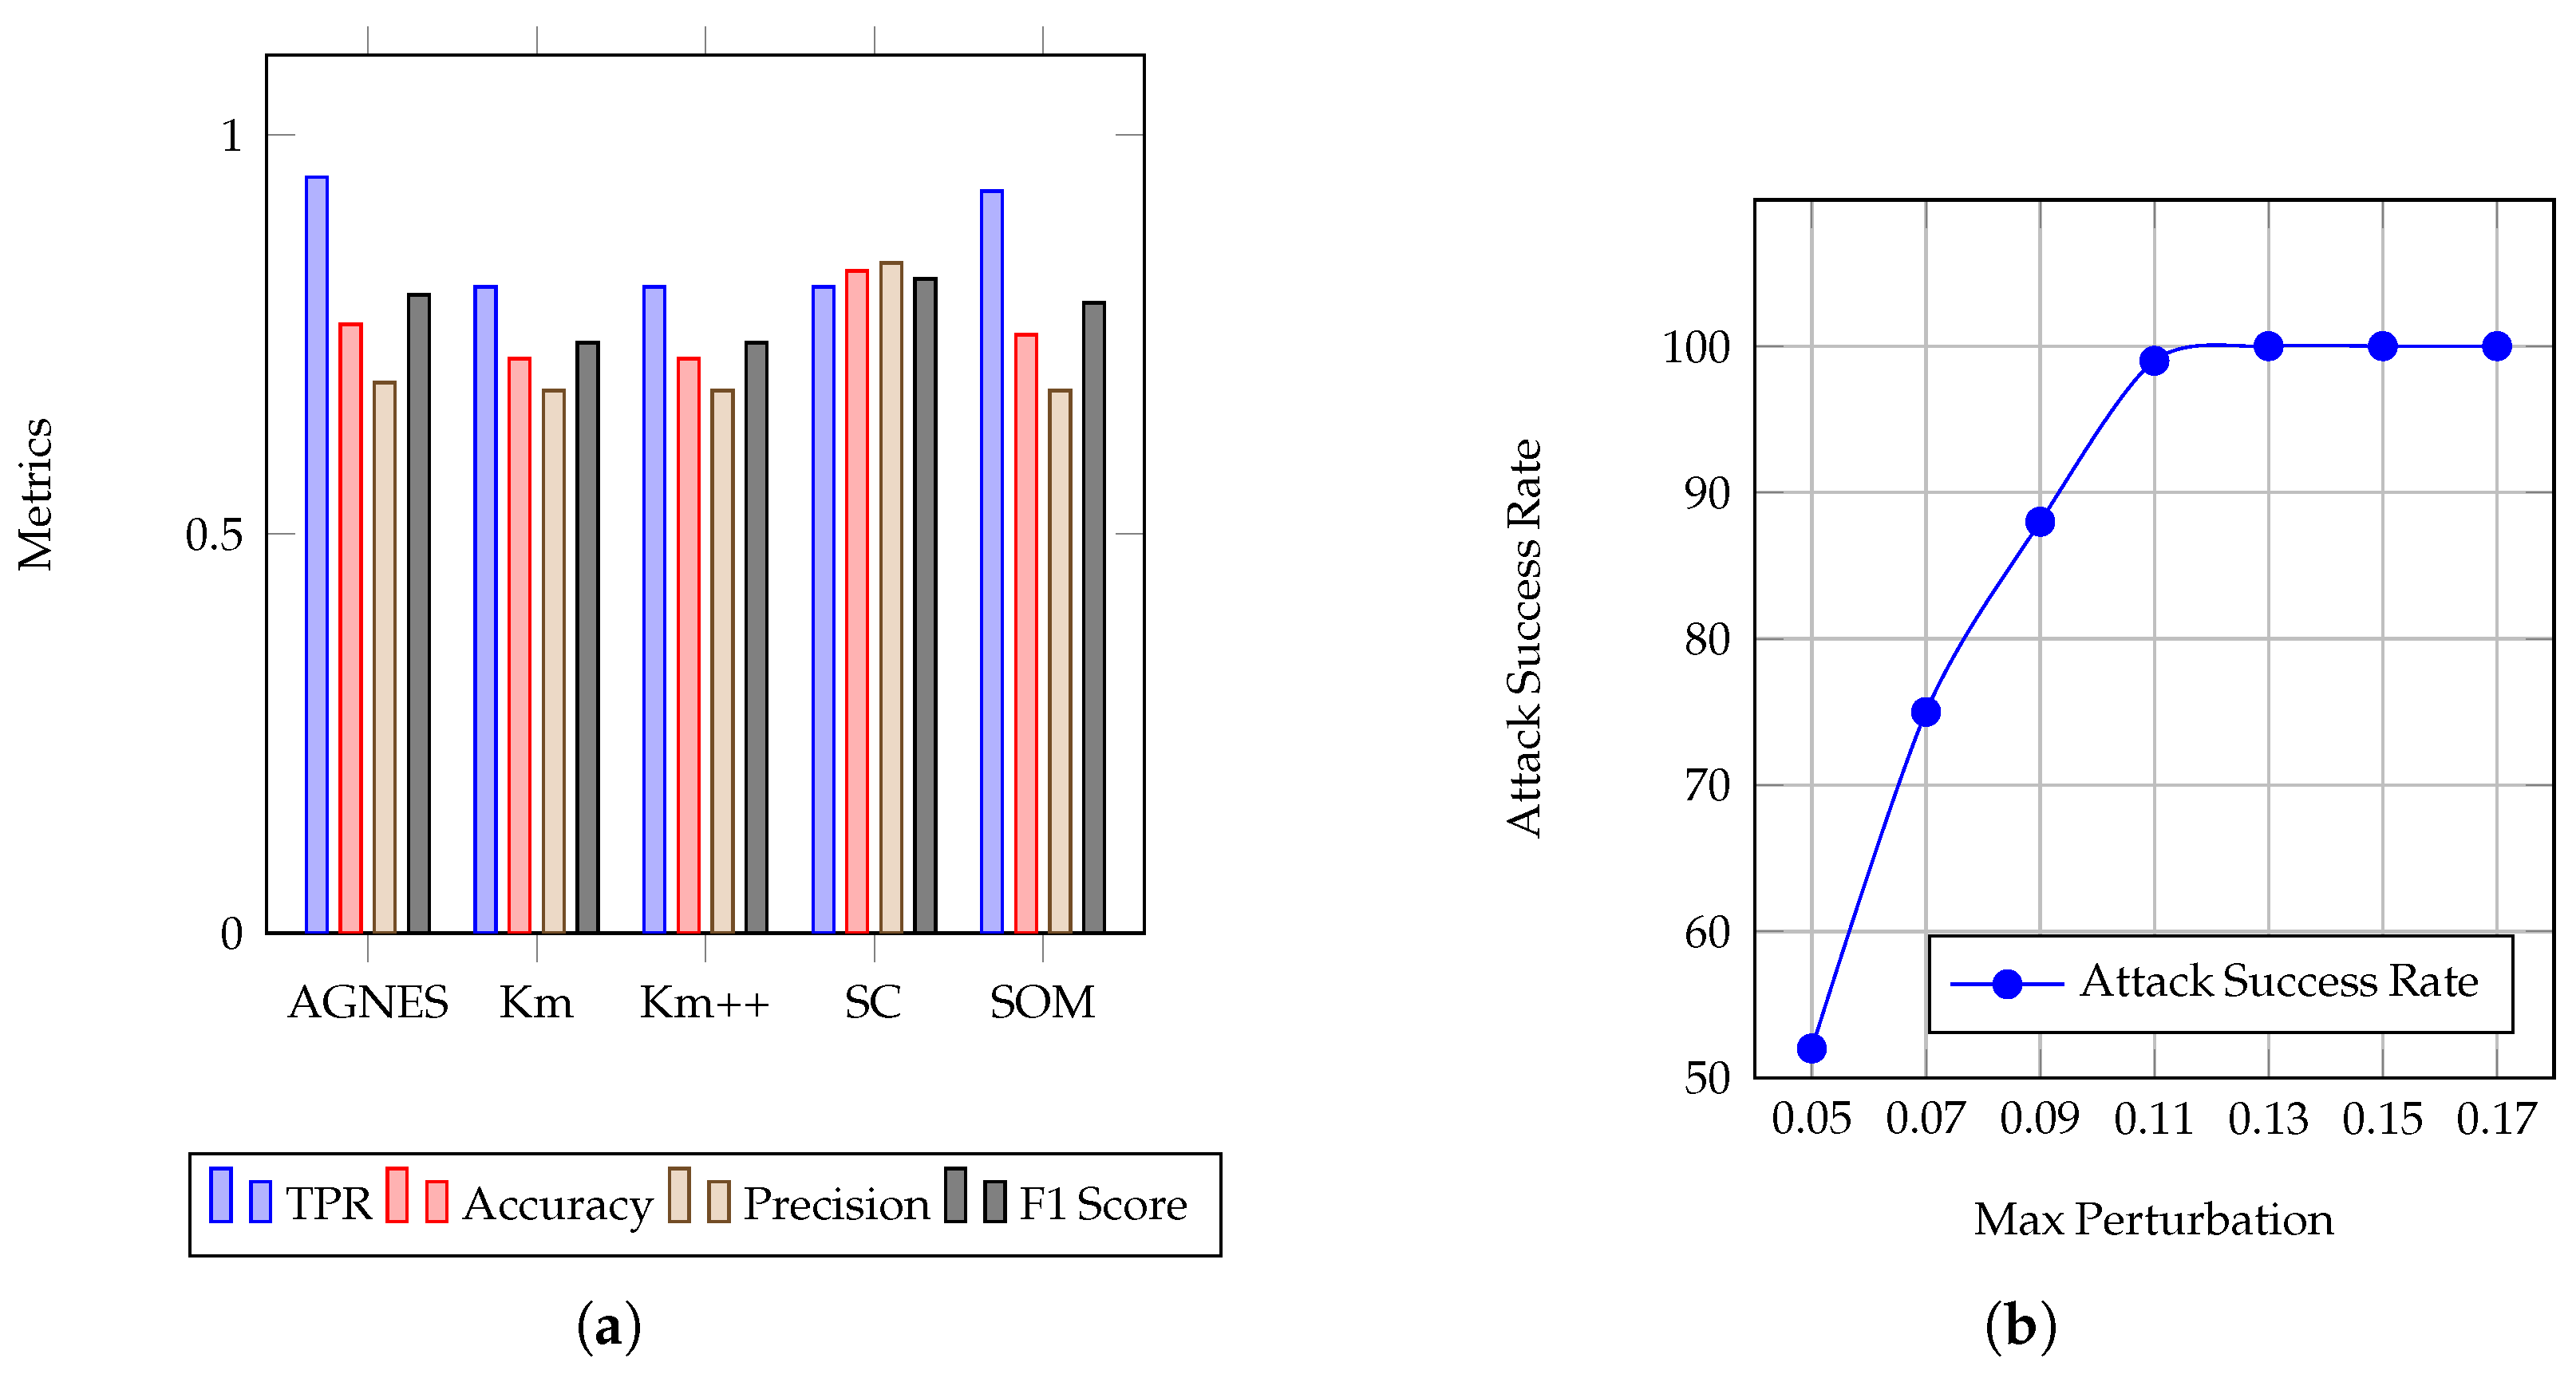
Figure 8a showcases a comparison of performance metrics for statistical feature-based models, including Agglomerative Nesting (AGNES), K-means (Km), K-means++ (Km++), Spectral Clustering (SC), and Self-Organizing Map (SOM), with a focus on True Positive Rate (TPR), Accuracy, Precision, and F1 Score. Notably, AGNES emerges as the top performer across all metrics, attaining the highest scores in TPR, Accuracy, Precision, and F1 Score. Specifically, AGNES achieves the highest accuracy score of 0.947, indicating its robustness in correctly classifying instances within the dataset. Conversely, SOM records the lowest accuracy score of 0.68 among the models evaluated, suggesting comparatively poorer performance in accurately predicting class labels. Despite variations in performance across different metrics, AGNES consistently demonstrates superior performance compared to the other models. These results highlight AGNES as a standout choice for statistical feature-based modeling tasks, given its exceptional accuracy and overall effectiveness. Further investigations could explore the underlying mechanisms contributing to AGNES’s superiority and identify potential strategies for enhancing the performance of less effective models like SOM.

7.2. Effect of Adversarial Attack

In our study on adversarial attacks, we conducted experiments using the same FPGA-experiment dataset and focused on the statistical feature extraction method employed by the K-Means clustering model. Our objective was to evaluate the susceptibility of this model to adversarial perturbations. We introduced perturbations to the Trojan-infected cluster nearest to the Trojan-free cluster, aiming to manipulate the model’s classification of Trojan-infected data as Trojan-free. To execute the experiment, we generated adversarial samples using our attack algorithm for all instances within the source cluster identified in the original dataset. We evaluated the effectiveness of the attack using performance metrics, such as the attack success rate, based on the magnitude of the maximum perturbation added to the test samples. The maximum perturbation represents the level of noise introduced, which we incrementally increased in each iteration until reaching the maximum attack success rate. Notably, as the noise level becomes excessive, resulting in a 100% success rate, we advise caution and recommend limiting the perturbation size before reaching this threshold. This precaution helps maintain a balance between maximizing the effectiveness of the attack and avoiding detection. Figure 8b depicts a line graph illustrating the relationship between the maximum perturbation and the attack success rate.
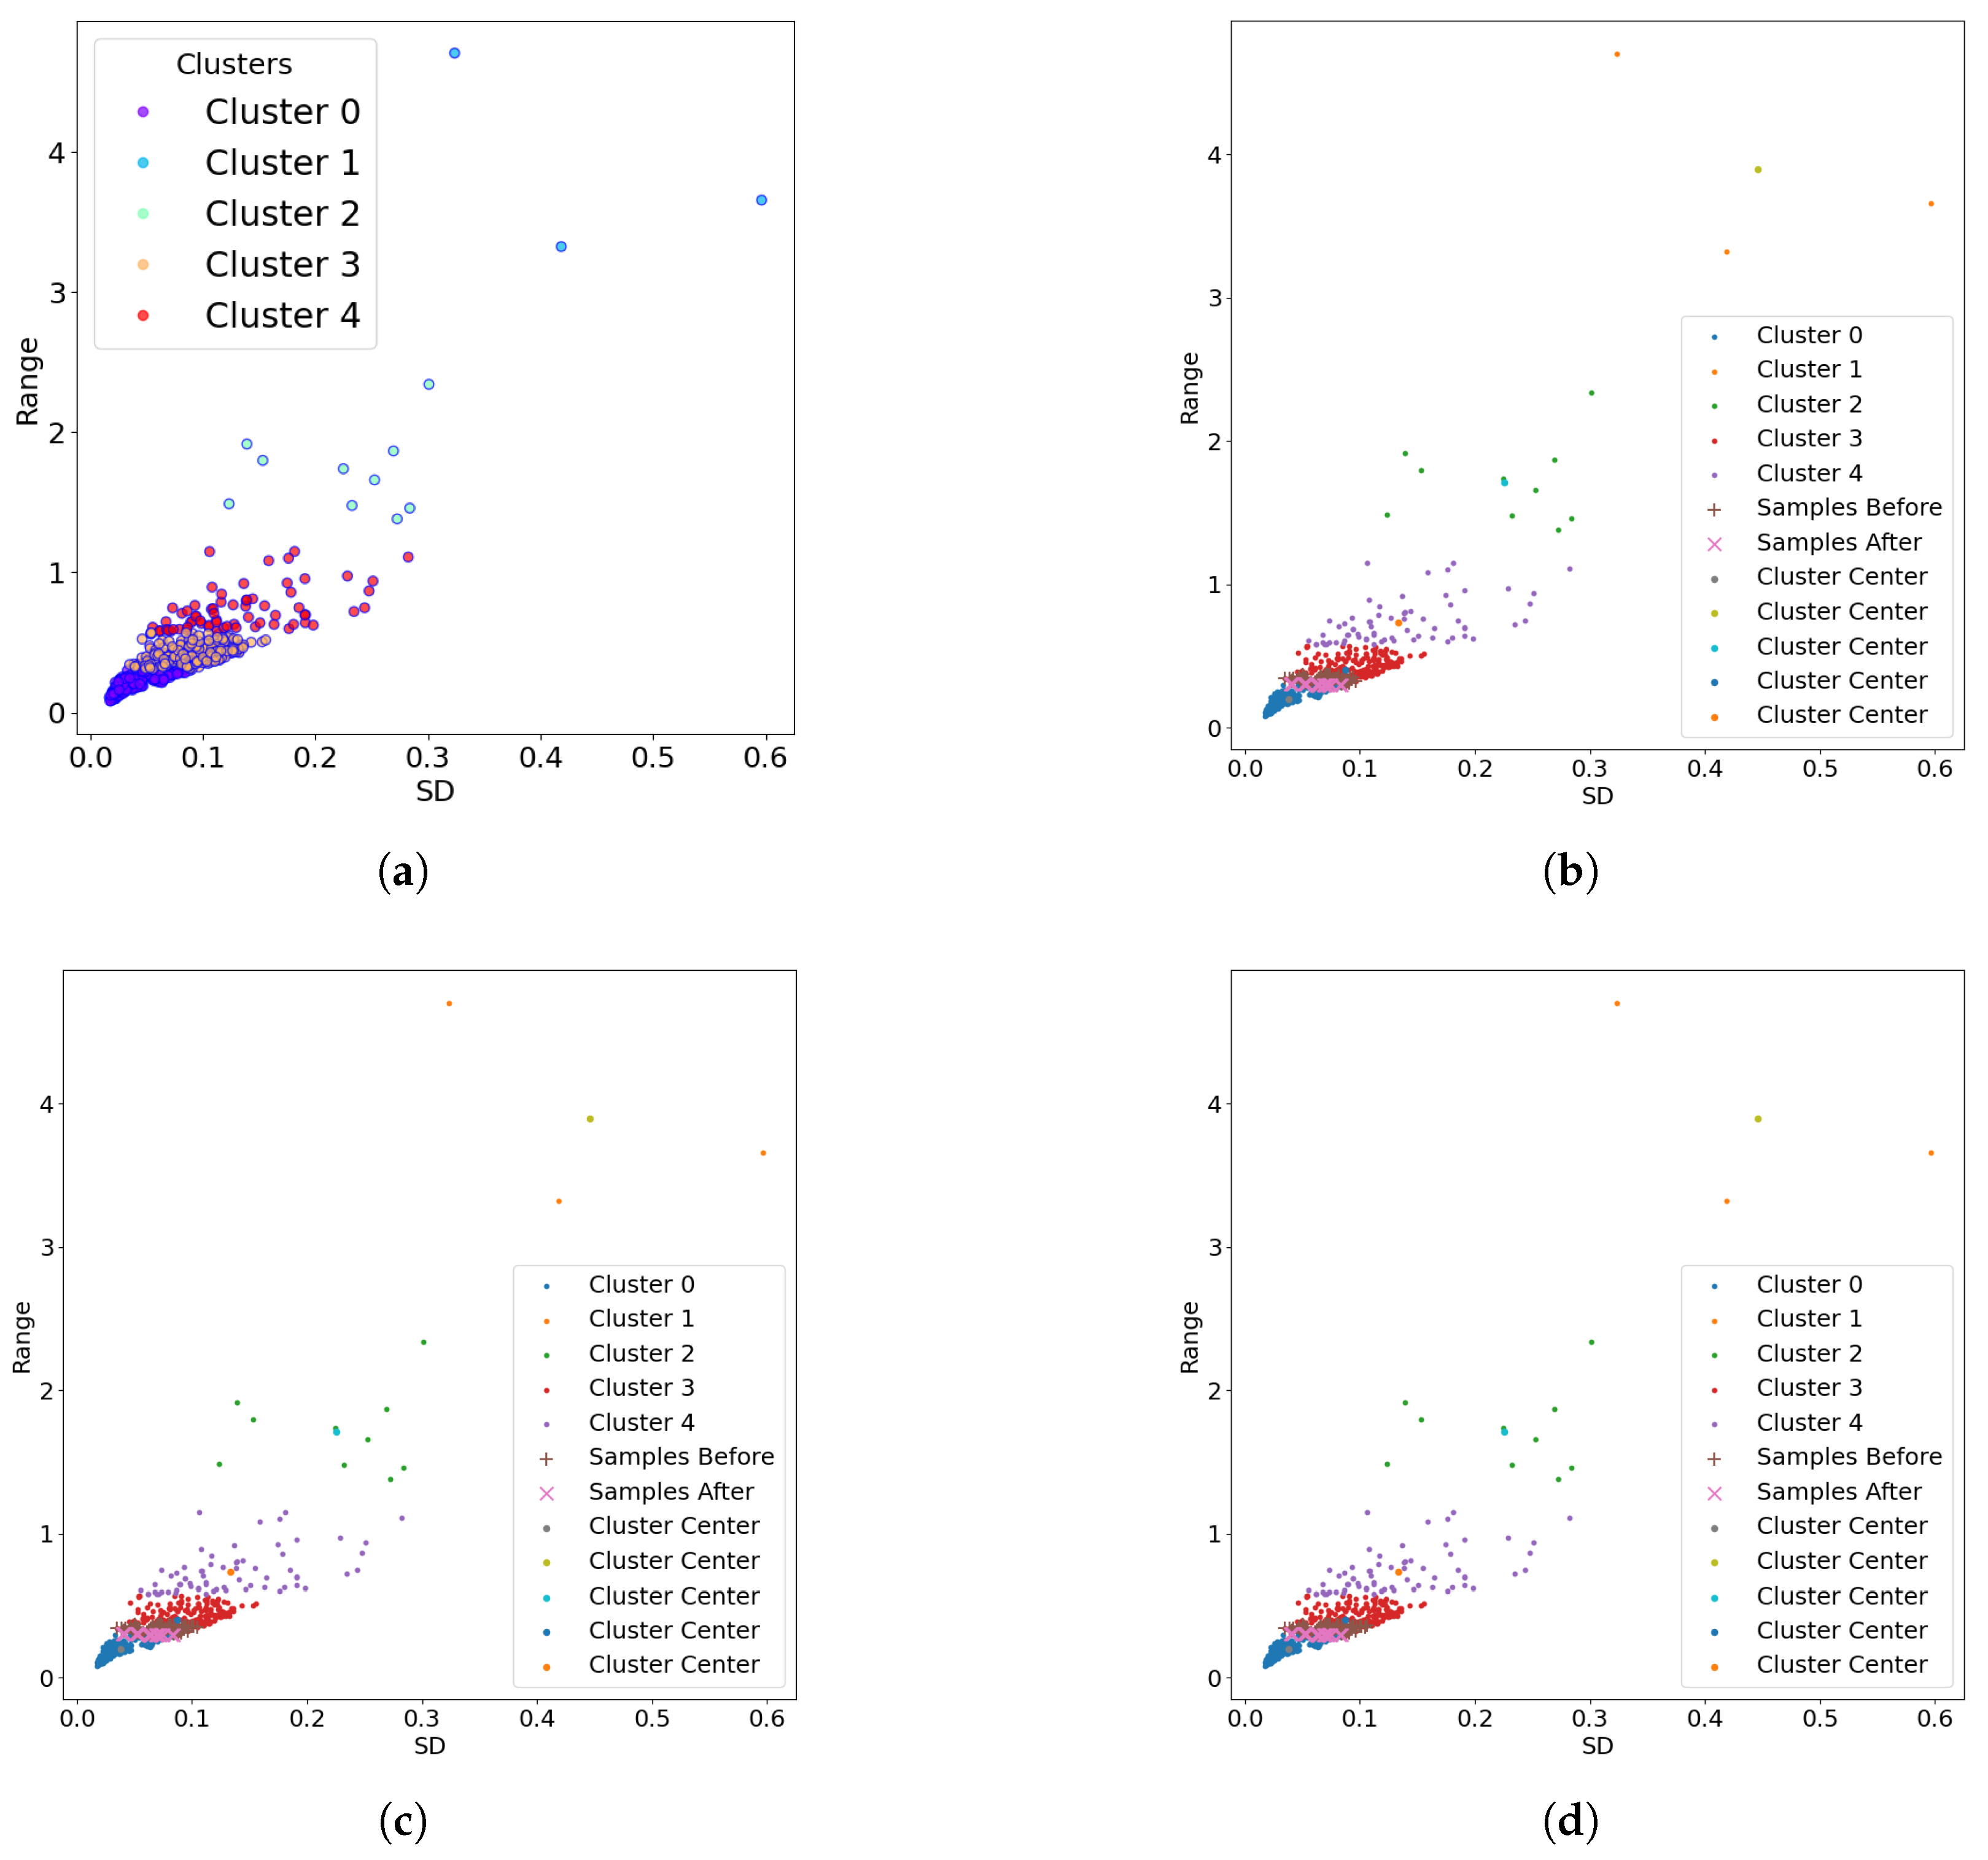
Figure 9a illustrates the K-Means clustering process, which partitions the samples into five distinct clusters. Among these clusters, the one situated lowest on the y-axis represents the Trojan-free data, denoted as cluster 0 and depicted with blue dots. The remaining clusters correspond to Trojan-infected data, discerned through a comparison with labels obtained during data collection. The cluster closest to the Trojan-free cluster is designated as the source cluster (cluster 3, marked with red dots), with the Trojan-free cluster being the target. In the clustering process, points from cluster 3 that are in close proximity to cluster 0 are selected for perturbation. The goal is to induce misclassification of these points as Trojan-free. Subsequently, in Figure 9b, a minimal perturbation is introduced, resulting in an 88% success rate in classifying the perturbed points as Trojan-free. Increasing the perturbation to 0.11, as depicted in Figure 9c, boosts the success rate to 99%. However, an excessive perturbation level of 0.13, as shown in Figure 9d, leads to the misclassification of all points as Trojan-free. Hence, for optimal results in this scenario, it is recommended to limit the perturbation to 0.11.

7.3. Clusterwise Pseudo-Label Generation

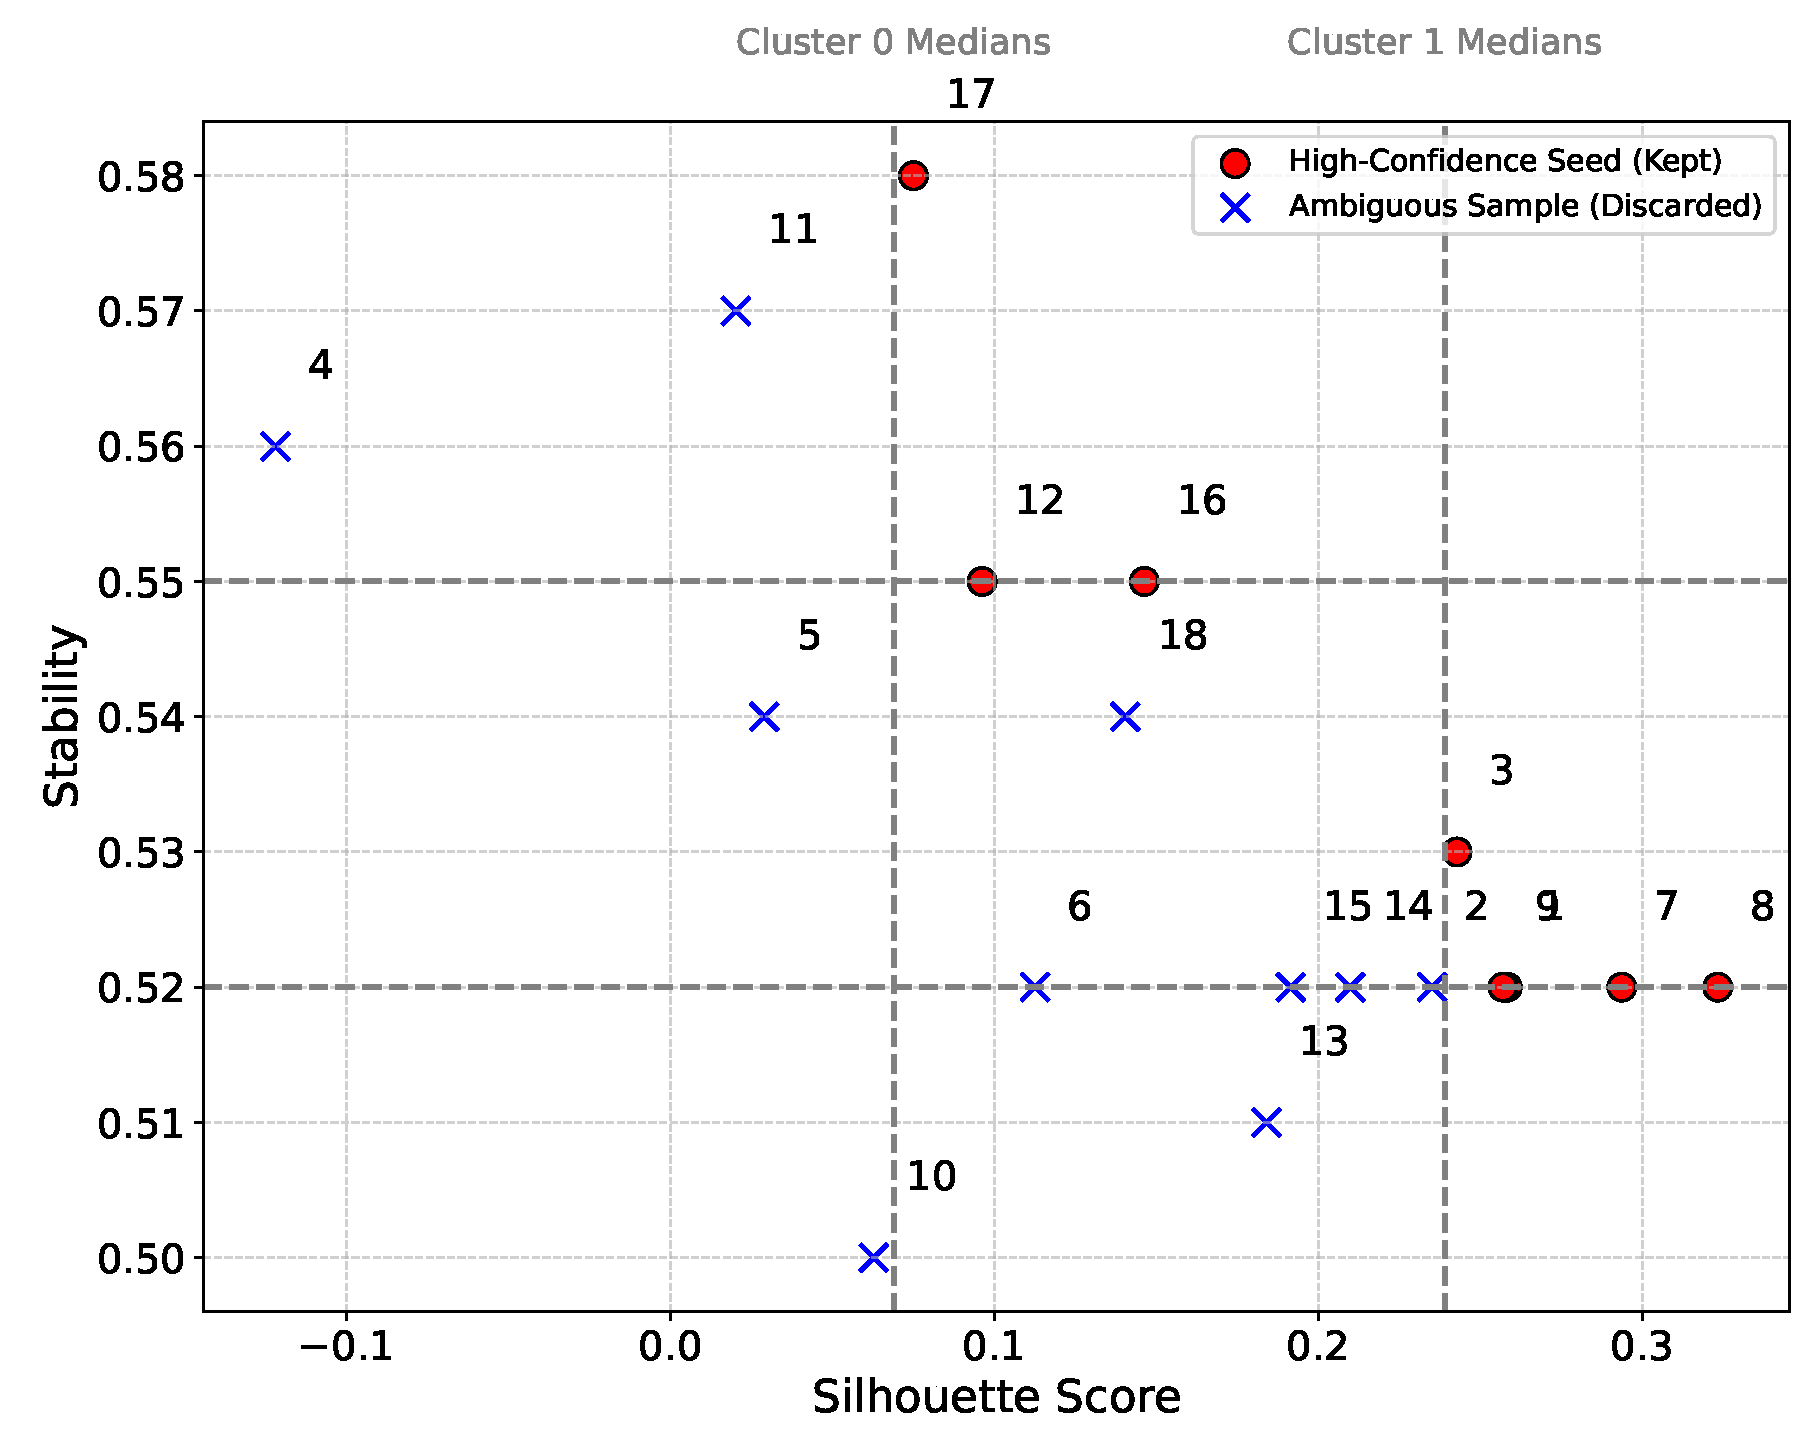
Applying the preprocessing pipeline (per-chip normalization, statistical descriptors, correlation features, PCA, and k-means clustering with k = 2 ) yielded two well-separated clusters. To reduce label noise, we employed the clusterwise filtering strategy described in Section 6. As shown in Figure 10, eight chips were retained as high-confidence representatives: { 1 , 3 , 7 , 8 , 9 , 12 , 16 , 17 } . These chips served as pseudo-labeled seeds for the supervised stage, with cluster assignments directly mapped to Trojan-free (label 0) and Trojan-inserted (label 1). Each point corresponds to a chip, positioned by its silhouette score and bootstrap stability. Dashed lines indicate the median silhouette and stability values within each cluster, serving as thresholds. Specifically, the vertical dashed lines represent the median silhouette scores; the left line corresponds to Cluster 0’s median silhouette (≈0.08), and the right line corresponds to Cluster 1’s median silhouette (≈0.25). The horizontal dashed lines represent the median stability values; the upper line corresponds to Cluster 0’s median stability (≈0.55), and the lower line corresponds to Cluster 1’s median stability (≈0.52). Chips above both medians for their respective clusters are retained (red circles), while those falling below either threshold are discarded (blue crosses). This filtering ensures that only structurally consistent chips contribute to pseudo-label propagation, improving robustness against noisy cluster assignments.

7.4. Adversarial Robustness

The effectiveness of the proposed defense mechanism was thoroughly evaluated by testing the adversarially trained AdaBoost model (model2) against both adversarial samples (adv_sample). The results highlight the resilience of model2 to adversarial attacks while maintaining high classification accuracy for HT detection. Below, a detailed analysis of the post-defense results is presented, supported by performance metrics, confusion matrices, and additional insights.

7.4.1. Performance Metrics and Model Improvement

Table 2 provides a comprehensive comparison of performance metrics before attack, after attack, and after implementing the defense. The table shows that the performance of the clustering model decreases from 72.395% accuracy to 55.20% because of the adversarial attack. Prior to the defense, the clustering model was highly susceptible to adversarial manipulation, with an attack success rate of 100% for adversarial samples. This resulted in a significant degradation of classification accuracy and other performance metrics. However, the integration of adversarial training and pseudo-labeling led to a remarkable improvement in performance. The adversarially trained model2 achieved a classification accuracy of 99.056% and f1 score of 98.70% for validating the adversarial dataset. Key metrics such as precision and recall were also maximized, while False Negative Rate was minimized, underscoring the model’s robustness. The significant improvement over the original performance is because of the outlier removal that filters a clean dataset to train the supervised model.

7.4.2. Confusion Matrix Analysis and Classification Behavior

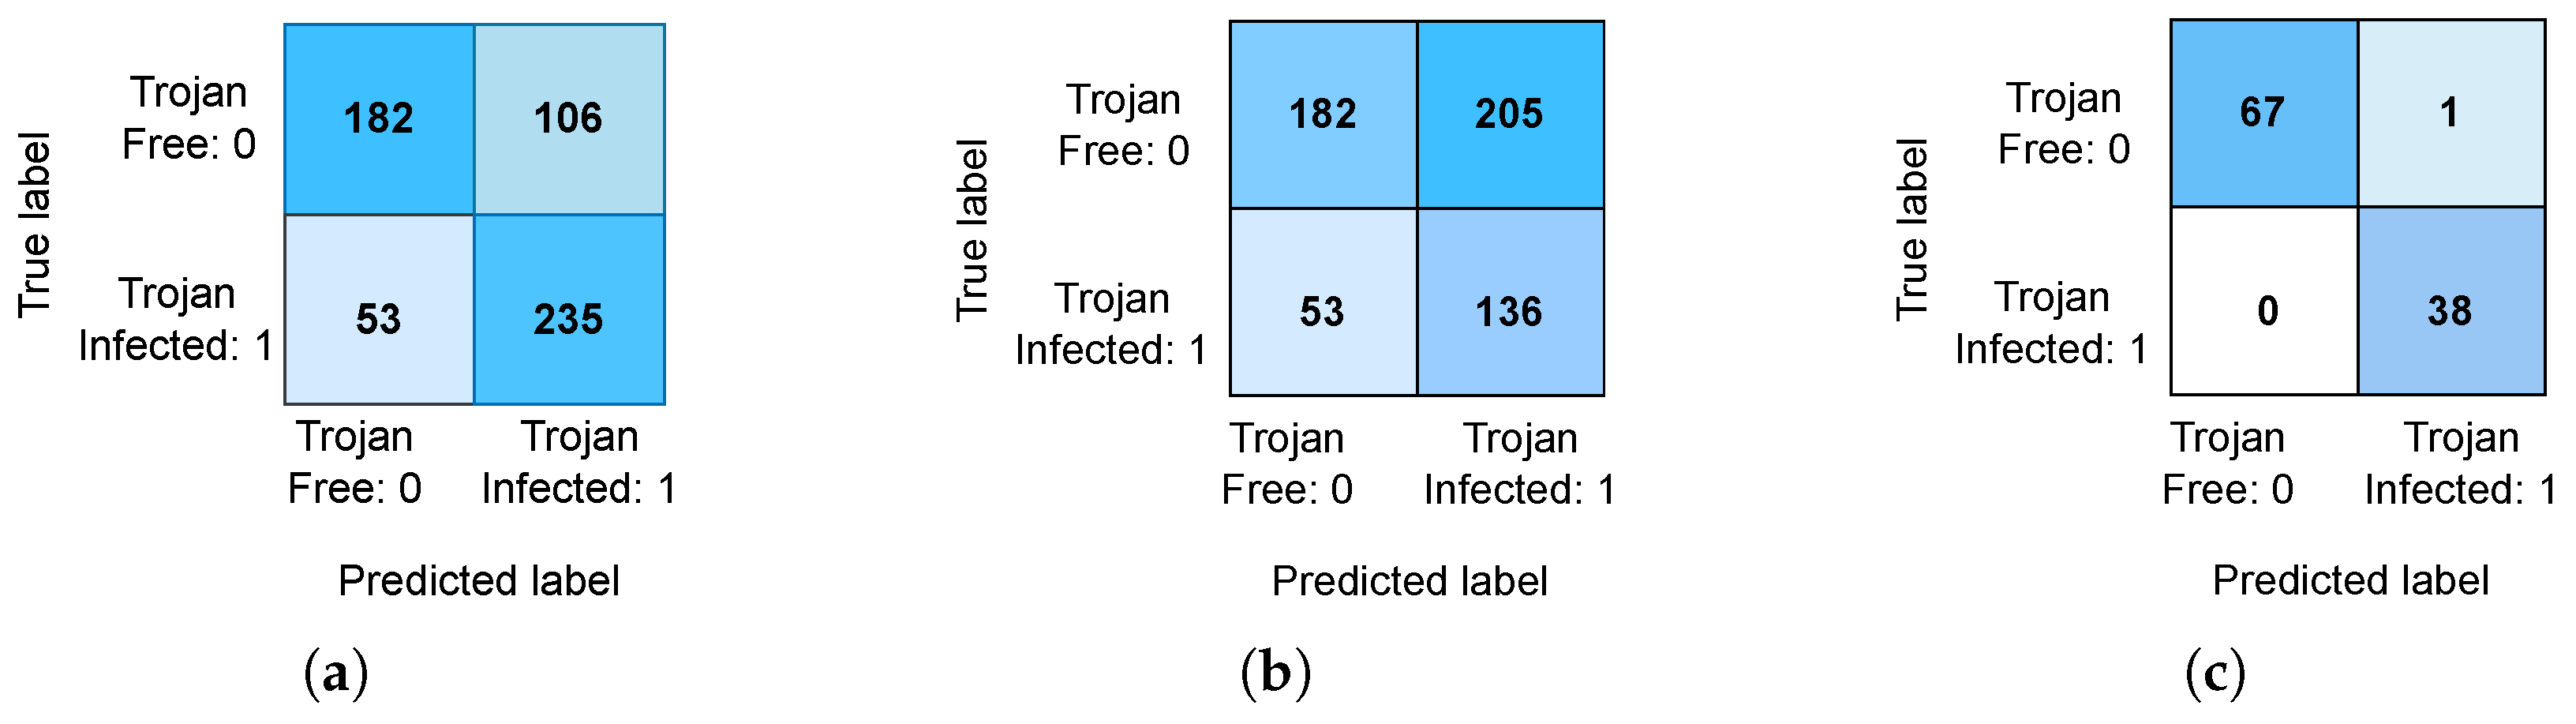
The confusion matrices in Figure 11 illustrate the classification outcomes before the attack, after applying the attack and after applying the defense strategy. These matrices provide a granular view of the model’s ability to differentiate between Trojan-free and Trojan-infected samples: As shown in Figure 11b, the clustering model failed to detect most of the Trojan-infected samples from adv_sample, misclassifying all targeted adversarial examples as Trojan-free. This highlights the model’s vulnerability to adversarial perturbations.
In contrast, Figure 11c demonstrates that, after adversarial training, model2 successfully classified all Trojan-infected and Trojan-free samples without any errors, even in the presence of adversarial perturbations. This result underscores the robustness of the proposed defense mechanism. The adversarially trained model (model2) was further evaluated using an independent validation dataset. The results reaffirmed the model’s robustness, with consistent performance metrics across both benign and adversarial scenarios. The validation results confirm the model’s ability to generalize well to unseen data, highlighting its potential for real-world deployment. It should be noted that the samples for the proposed pseudo-supervised model were drawn exclusively from the validation set, which explains the discrepancy in the number of samples shown in Figure 11c compared to the others.

7.4.3. Adversarial Impact and Defense Performance

The performance metrics summarized in Table 2 highlight the effectiveness of the proposed defense framework against adversarial attacks on statistical feature extraction. Before the attack, the K-Means clustering model achieved a moderate accuracy of 72.39%, with a precision of 68.91% and a recall of 81.59%. However, when subjected to a feature space attack, the model’s performance significantly deteriorated, with accuracy dropping to 55.20%, precision declining to 39.88%, and the false negative rate increasing to 28.04%. This demonstrates the susceptibility of the clustering model to adversarial perturbations, which impair its ability to distinguish between Trojan-free and Trojan-infected samples.
In contrast, the post-defense results reveal the robustness of the proposed framework. After incorporating the defense strategy, the model achieved near-perfect performance metrics, with an accuracy of 99.05%, precision of 97.43%, and recall of 100%, resulting in an F1 score of 98.87%. Additionally, the false negative rate was reduced to 0%, indicating that all Trojan-infected samples were correctly identified. These results underscore the effectiveness of the defense mechanism in mitigating the impact of adversarial attacks, ensuring reliable classification of Trojan-infected and Trojan-free samples even in the presence of feature space attacks.

7.5. Sensitivity-Specificity Trade-Off

As shown in Table 2, our framework achieves an FNR of 0.00% while maintaining a low FPR of 1.47%. This performance profile highlights a critical trade-off in hardware assurance. Given that a single missed Trojan (False Negative) can compromise an entire mission-critical system, our optimization objective prioritizes sensitivity over specificity. The non-zero FPR indicates that the decision boundary is slightly conservative, occasionally flagging benign chips with extreme process variations as potential threats. This is a preferable outcome to the alternative; a False Positive results in minor yield loss, whereas a False Negative results in a security breach. Thus, the 0% FNR is not an artifact of small-sample overfitting, but a result of a security-centric margin maximization against the tested benchmarks.

7.6. Robustness vs. Overfitting

A common concern in adversarial defense is whether the model is merely “overfitting” to the specific attack algorithm used during training. In our framework, the adversarial training process (Section 6) utilizes Algorithm 2 to generate perturbations that represent the worst-case directions, the shortest geometric paths to the decision boundary.
This approach aligns with the fundamental principles of Robust Optimization established by Madry et al. [32]. They demonstrated that training against a strong, iterative adversary (solving the inner maximization problem) provides transferable robustness against a wide range of weaker or sub-optimal attacks.
By optimizing the decision boundary to resist these worst-case shifts, our model achieves geometric hardening. Since any alternative attack method (e.g., GAN-based generation or manual physical tuning) must ultimately cross this same decision margin to succeed, maximizing the margin against the optimal attack provides implicit robustness against unseen attack vectors. Thus, the performance recovery represents a genuine improvement in margin width, rather than the memorization of specific adversarial samples.

8. Conclusions

This study presents a golden-free framework for detecting HTs by leveraging self-supervised clustering and adversarial training. By introducing a pseudo-supervised learning approach, the proposed method enhances the resilience of unsupervised models against specific adversarial manipulations. Experimental results on FPGA platforms demonstrate that the framework achieves high classification accuracy and recall, offering a robust alternative to traditional methods that rely on expensive golden reference models.
Furthermore, the approach exhibits computational efficiency, as the detection logic scales with the number of distributed sensors rather than the underlying transistor count. While the current validation on FPGAs yields promising results, extending this framework to heterogeneous System-on-Chips (SoCs) remains a critical direction for future research. Specifically, addressing the complex power noise floors and sensor placement constraints in billion-transistor designs will be essential for industrial adoption. Ultimately, these findings highlight the potential of integrating adversarial defense mechanisms into statistical side-channel analysis to enhance hardware trust.


Author Contributions

Conceptualization, A.G. and F.A.; methodology, A.G.; software, A.G.; formal analysis, A.G.; investigation, A.G.; data curation, A.G.; writing—original draft preparation, A.G.; writing—review and editing, A.G., F.A. and M.A.H.; visualization, A.G.; validation, A.G., M.A. and G.G.; resources, F.A.; supervision, F.A.; project administration, F.A.; funding acquisition, F.A. M.A. and G.G. contributed to experimental support and preliminary result verification. M.A.H. provided technical feedback and constructive comments during manuscript review. All authors have read and agreed to the published version of the manuscript.

Funding

This research received no external funding.

Data Availability Statement

The data presented in this study are available from the corresponding author upon reasonable request. The data are not publicly available due to hardware security and experimental constraints.

Acknowledgments

The authors acknowledge the support of the SMART Research Lab at Wright State University for providing experimental infrastructure and technical resources. During the preparation of this manuscript, the authors used GPT-5.2 (OpenAI) for language refinement and clarity improvement. The authors reviewed and edited the content and take full responsibility for the final manuscript.

Conflicts of Interest

The authors declare no conflicts of interest. The funders had no role in the design of the study; in the collection, analyses, or interpretation of data; in the writing of the manuscript; or in the decision to publish the results.

Abbreviations

The following abbreviations are used in this manuscript:
AGNESAgglomerative Nesting
AMLAdversarial Machine Learning
AUCArea Under the Curve
FNRFalse Negative Rate
FPRFalse Positive Rate
FPGAField-Programmable Gate Array
HTHardware Trojan
ICIntegrated Circuit
KmK-means
Km++K-means++
MLMachine Learning
NNNeural Network
PCAPrincipal Component Analysis
RORing Oscillator
SCSpectral Clustering
SCASide-Channel Analysis
SOMSelf-Organizing Map
SVMSupport Vector Machine
TPRTrue Positive Rate
UARTUniversal Asynchronous Receiver–Transmitter
WCSSWithin-Cluster Sum of Squares
XDCXilinx Design Constraints

References

  1. Narasimhan, S.; Du, D.; Chakraborty, R.S.; Paul, S.; Wolff, F.; Papachristou, C.; Roy, K.; Bhunia, S. Multiple-parameter side-channel analysis: A non-invasive hardware Trojan detection approach. In Proceedings of the 2010 IEEE International Symposium on Hardware-Oriented Security and Trust (HOST), Anaheim, CA, USA, 13–14 June 2010; IEEE: New York, NY, USA, 2010; pp. 13–18. [Google Scholar]
  2. Gubbi, K.I.; Saber Latibari, B.; Srikanth, A.; Sheaves, T.; Beheshti-Shirazi, S.A.; PD, S.M.; Rafatirad, S.; Sasan, A.; Homayoun, H.; Salehi, S. Hardware trojan detection using machine learning: A tutorial. ACM Trans. Embed. Comput. Syst. 2023, 22, 46. [Google Scholar] [CrossRef]
  3. Bao, C.; Forte, D.; Srivastava, A. On application of one-class SVM to reverse engineering-based hardware Trojan detection. In Proceedings of the Fifteenth International Symposium on Quality Electronic Design, Santa Clara, CA, USA, 3–5 March 2014; IEEE: New York, NY, USA, 2014; pp. 47–54. [Google Scholar]
  4. Gourousis, T.; Zhang, Z.; Yan, M.; Zhang, M.; Mittal, A.; Shrivastava, A.; Restuccia, F.; Fei, Y.; Onabajo, M. Identification of Stealthy Hardware Trojans through On-Chip Temperature Sensing and an Autoencoder-Based Machine Learning Algorithm. In Proceedings of the 2023 IEEE 66th International Midwest Symposium on Circuits and Systems (MWSCAS), Phoenix, AZ, USA, 6–9 August 2023; IEEE: New York, NY, USA, 2023; pp. 30–34. [Google Scholar]
  5. Alotaibi, A.; Rassam, M.A. Adversarial machine learning attacks against intrusion detection systems: A survey on strategies and defense. Future Internet 2023, 15, 62. [Google Scholar] [CrossRef]
  6. Vapnik, V.N. Statistical Learning Theory; Adaptive and Learning Systems for Signal Processing, Communications, and Control; John Wiley & Sons: Chichester, UK, 1998. [Google Scholar]
  7. Caron, M.; Bojanowski, P.; Joulin, A.; Douze, M. Deep clustering for unsupervised learning of visual features. In Proceedings of the European Conference on Computer Vision (ECCV), Munich, Germany, 8–14 September 2018; Springer: Berlin/Heidelberg, Germany, 2018; pp. 132–149. [Google Scholar]
  8. Lee, D.H. Pseudo-label: The simple and efficient semi-supervised learning method for deep neural networks. In Proceedings of the Workshop on Challenges in Representation Learning, ICML, Atlanta, GA, USA, 16–21 June 2013; Volume 3, p. 896. [Google Scholar]
  9. Sidhu, S.; Mohd, B.J.; Hayajneh, T. Hardware security in IoT devices with emphasis on hardware trojans. J. Sens. Actuator Netw. 2019, 8, 42. [Google Scholar] [CrossRef]
  10. Hamlet, J.R.; Mayo, J.R.; Kammler, V.G. Targeted modification of hardware trojans. J. Hardw. Syst. Secur. 2019, 3, 189–197. [Google Scholar] [CrossRef]
  11. Becker, G.T.; Regazzoni, F.; Paar, C.; Burleson, W.P. Stealthy dopant-level hardware trojans: Extended version. J. Cryptogr. Eng. 2014, 4, 19–31. [Google Scholar] [CrossRef]
  12. Ghimire, A.; Alkurdi, M.; Gurung, K.; Amsaad, F. Adversarial Attack Against Golden Reference-Free Hardware Trojan Detection Approach. In Proceedings of the 2024 IEEE Physical Assurance and Inspection of Electronics (PAINE), Huntsville, AL, USA, 12–14 November 2024; IEEE: New York, NY, USA, 2024; pp. 1–7. [Google Scholar]
  13. Ghimire, A.; Alkurdi, M.; Amsaad, F. Enhancing Hardware Trojan Security through Reference-Free Clustering using Representatives. In Proceedings of the 2024 37th International Conference on VLSI Design and 2024 23rd International Conference on Embedded Systems (VLSID), Kolkata, India, 6–10 January 2024; IEEE: New York, NY, USA, 2024; pp. 467–473. [Google Scholar]
  14. Kulkarni, A.; Pino, Y.; French, M.; Mohsenin, T. Real-time anomaly detection framework for many-core router through machine-learning techniques. ACM J. Emerg. Technol. Comput. Syst. (JETC) 2016, 13, 1–22. [Google Scholar]
  15. Hasegawa, K.; Yanagisawa, M.; Togawa, N. A hardware-Trojan classification method using machine learning at gate-level netlists based on Trojan features. IEICE Trans. Fundam. Electron. Commun. Comput. Sci. 2017, 100, 1427–1438. [Google Scholar]
  16. Ma, P.; Li, J.; Liu, H.; Shi, J.; Zhang, S.; Pan, W.; Hao, Y. Hardware Trojan detection methods for gate-level netlists based on graph neural networks. IEEE Trans. Comput. 2025, 74, 1470–1481. [Google Scholar] [CrossRef]
  17. Xiao, J.; Chai, S.; Gao, Y.; Huang, Y.; Zhang, F.; Chen, T. HTs-GCN: Identifying Hardware Trojan Nodes in Integrated Circuits Using a Graph Convolutional Network. IEEE Trans. Comput.-Aided Des. Integr. Circuits Syst. 2025, 44, 2353–2366. [Google Scholar]
  18. Jiang, Z.; Ding, Q. A framework for hardware trojan detection based on contrastive learning. Sci. Rep. 2024, 14, 30847. [Google Scholar] [CrossRef]
  19. Finlayson, S.G.; Bowers, J.D.; Ito, J.; Zittrain, J.L.; Beam, A.L.; Kohane, I.S. Adversarial attacks on medical machine learning. Science 2019, 363, 1287–1289. [Google Scholar] [CrossRef]
  20. Brendel, W.; Rauber, J.; Bethge, M. Decision-based adversarial attacks: Reliable attacks against black-box machine learning models. arXiv 2017, arXiv:1712.04248. [Google Scholar]
  21. Apruzzese, G.; Colajanni, M.; Ferretti, L.; Marchetti, M. Addressing adversarial attacks against security systems based on machine learning. In Proceedings of the 2019 11th International Conference on Cyber Conflict (CyCon), Tallinn, Estonia, 28–31 May 2019; IEEE: New York, NY, USA, 2019; Volume 900, pp. 1–18. [Google Scholar]
  22. Nozawa, K.; Hasegawa, K.; Hidano, S.; Kiyomoto, S.; Hashimoto, K.; Togawa, N. Generating adversarial examples for hardware-trojan detection at gate-level netlists. J. Inf. Process. 2021, 29, 236–246. [Google Scholar] [CrossRef]
  23. Pan, Z.; Mishra, P. Ai trojan attack for evading machine learning-based detection of hardware trojans. IEEE Trans. Comput. 2023, 74, 860–874. [Google Scholar] [CrossRef]
  24. Hasegawa, K.; Hidano, S.; Nozawa, K.; Kiyomoto, S.; Togawa, N. R-htdetector: Robust hardware-trojan detection based on adversarial training. IEEE Trans. Comput. 2022, 72, 333–345. [Google Scholar]
  25. Biggio, B.; Rieck, K.; Ariu, D.; Wressnegger, C.; Corona, I.; Giacinto, G.; Roli, F. Poisoning behavioral malware clustering. In Proceedings of the 2014 Workshop on Artificial Intelligent and Security Workshop, Scottsdale, AZ, USA, 7 November 2014; Association for Computing Machinery: New York, NY, USA, 2014; pp. 27–36. [Google Scholar]
  26. Zhang, C.; Tang, Z. Novel poisoning attacks for clustering methods via robust feature generation. Neurocomputing 2024, 598, 127925. [Google Scholar] [CrossRef]
  27. Cinà, A.E.; Torcinovich, A.; Pelillo, M. A black-box adversarial attack for poisoning clustering. Pattern Recognit. 2022, 122, 108306. [Google Scholar] [CrossRef]
  28. Chhabra, A.; Sekhari, A.; Mohapatra, P. On the robustness of deep clustering models: Adversarial attacks and defenses. Adv. Neural Inf. Process. Syst. 2022, 35, 20566–20579. [Google Scholar]
  29. Chhabra, A.; Roy, A.; Mohapatra, P. Suspicion-free adversarial attacks on clustering algorithms. Proc. AAAI Conf. Artif. Intell. 2020, 34, 3625–3632. [Google Scholar] [CrossRef]
  30. Sakurai, T.; Newton, A.R. Alpha-power law MOSFET model and its applications to CMOS inverter delay and other formulas. IEEE J. Solid-State Circuits 2002, 25, 584–594. [Google Scholar] [CrossRef]
  31. Jain, A.K. Data clustering: 50 years beyond K-means. Pattern Recognit. Lett. 2010, 31, 651–666. [Google Scholar] [CrossRef]
  32. Madry, A.; Makelov, A.; Schmidt, L.; Tsipras, D.; Vladu, A. Towards deep learning models resistant to adversarial attacks. arXiv 2017, arXiv:1706.06083. [Google Scholar]
Figure 1. Hardware Trojan leaks sensitive data through routing to another output. Labels A–D denote the primary inputs of the circuit; the green gate represents the original asset (legitimate logic), while the yellow and brown components highlight the added Trojan trigger and payload, respectively.
Microelectronics 02 00002 g001
Figure 2. Overview of the threat model where an HT is inserted into an IC design before fabrication, and a machine learning detection system is used to identify and counter adversarial evasion attempts through side-channel analysis [12].
Microelectronics 02 00002 g002
Figure 3. AI-assisted framework for the clustering and detection of Trojans on hardware. The blue and red dots in the clustering stage represent distinct data clusters derived from hardware features, used to differentiate between secure and potentially compromised ICs prior to reverse engineering.
Microelectronics 02 00002 g003
Figure 4. FPGA-based hardware setup used to gather side-channel data in AI-driven image processing for the detection and clustering of hardware Trojans. The blue dashed lines indicate a logical zoom-in of the 8-bit counter used for quantization, while the red dashed lines denote a logical zoom-in of the 5-stage RO sensing unit.
Microelectronics 02 00002 g004
Figure 5. Comparison of RO1 frequency series measurements highlighting the impact of data cleaning and normalization across different chips: (a) Contrast between raw Trojan-free measurements (Chip 1) and cleaned/normalized Trojan-infected measurements (Chip 12); (b) Contrast between cleaned/normalized Trojan-free measurements (Chip 1) and raw Trojan-infected measurements (Chip 12). The split visualization prevents complete overlapping of data with identical median frequencies, ensuring the Trojan-induced deviations remain clearly observable.
Microelectronics 02 00002 g005
Figure 6. Feature importance analysis derived from the AdaBoost classifier.
Microelectronics 02 00002 g006
Figure 7. Proposed defense approach against adversarial attack on clustering-based hardware Trojan detection system. Blue and red dots represent Trojan-free and Trojan-infected data clusters, respectively. Dashed circles indicate targeted data instances within the feature space undergoing adversarial perturbation and validation to enhance model resilience.
Microelectronics 02 00002 g007
Figure 8. Valuation of statistical feature-based model performance and robustness against perturbation attacks. (a) Comparison of performance metrics for statistical features based models; (b) Line Graph of Max Perturbation vs. Attack Success Rate.
Microelectronics 02 00002 g008
Figure 9. Scatter plot showing different perturbation scenarios. (a) K-Means clustering before applying perturbation; (b) Max perturbation of 0.09 applied giving 88% attack success rate; (c) Max perturbation of 0.11 applied giving 99% attack success rate; (d) Max perturbation of 0.13 applied giving 100% attack success rate.
Microelectronics 02 00002 g009
Figure 10. Chip-Level Clustering with Clusterwise Filtering.
Microelectronics 02 00002 g010
Figure 11. Confusion matrix of pre-attack, post adversarial attack and post adversarial training. (a) Before applying perturbation; (b) After adversarial attack with max perturbation of 0.11 on Clustering model; (c) After adversarial attack with max perturbation of 0.11 on Proposed Model. The color intensity represents the quantity of samples in each category, with darker blue shading indicating a higher frequency of classification outcomes.
Microelectronics 02 00002 g011
Table 1. Summary of Key Dataset Features.
AttributeValue
Total Chips in Dataset18
RO Units per Chip32
Instances per Chip1001
Chips Not Contaminated by Trojans9
Chips with Trojan Presence9
Table 2. Table showing performance metrics for clustering model before and after the adversarial attack and defense on statistical feature extraction.
CaseModelAttack TypeAccuracyPrecisionRecallFNRFPRF1 Score
Pre-attackK-MeansN/A72.39%68.91%81.59%18.4%36.81%74.7%
Post-attackK-MeansFeature Space
Attack
55.20%39.88%71.9%28.04%52.97%51.32%
Post-defenseProposed
Framework
Feature Space
Attack
99.05%97.43%100%0%1.47%98.87%
Disclaimer/Publisher’s Note: The statements, opinions and data contained in all publications are solely those of the individual author(s) and contributor(s) and not of MDPI and/or the editor(s). MDPI and/or the editor(s) disclaim responsibility for any injury to people or property resulting from any ideas, methods, instructions or products referred to in the content.