
Article

Capillary Blood Sampling for Assessing Metabolic Profiles of PBMCs: Comparisons with Venepuncture at Rest and Post-Maximal Exercise

1
Cellular Health and Metabolism Facility, College of Life and Environmental Sciences, University of Birmingham, Birmingham B15 2TT, UK
2
School of Sport, Exercise and Rehabilitation Sciences, University of Birmingham, Birmingham B15 2TT, UK
3
College of Life and Environmental Sciences, University of Birmingham, Birmingham B15 2TT, UK
*
Author to whom correspondence should be addressed.
Clin. Bioenerg. 2026, 2(3), 14; https://doi.org/10.3390/clinbioenerg2030014
Submission received: 13 February 2026 / Revised: 25 June 2026 / Accepted: 30 June 2026 / Published: 12 August 2026

Abstract

Peripheral blood mononuclear cell (PBMC) bioenergetic profiling has emerged as a promising minimally invasive tool for assessing immunometabolic health, yet traditional venepuncture presents practical barriers for certain populations and longitudinal studies. This study examined PBMC bioenergetic profiles from upper-arm capillary blood using the Tasso+ device and compared these to traditional venepuncture. Healthy adults provided paired capillary and venous blood samples at rest and following maximal exercise. PBMCs were isolated and assessed using Seahorse XF technology for mitochondrial respiration and glycolytic function, alongside haematological and T-cell immunophenotyping via flow cytometry. Bland–Altman analysis demonstrated narrow limits of agreement and small mean bias between sampling methods for T-cell subsets and normalised bioenergetic parameters, whereas absolute bioenergetic rates showed wider limits of agreement with a consistently greater negative bias, indicating systematically lower values in capillary compared with venous samples. Formal equivalence testing confirmed method equivalence for only total CD4+ T cells and CD4+ naïve T cells at rest. For bioenergetic parameters, equivalence was demonstrated for proton leak respiration, mitochondrial health index, ATP supply rate, and glycolytic metrics. Absolute mitochondrial and glycolytic rates were not equivalent between methods. Both sampling methods preserved PBMC activation capacity following PMA/ionomycin stimulation. Our findings support capillary blood sampling using the Tasso+ device as a minimally invasive alternative to venepuncture for PBMC metabolic phenotyping and immunological assessments. However, caution should be exercised if using the methods interchangeably, given that only selected bioenergetic parameters and T-cell subsets demonstrate acceptable equivalence.

1. Introduction

Peripheral blood mononuclear cells (PBMCs) have emerged as a model system for assessing immunometabolic health across diverse physiological and pathological conditions [1,2]. These circulating immune cells, comprising predominantly lymphocytes and monocytes, serve not only as effectors of immune responses but also as systemic metabolic sensors that undergo dynamic metabolic reprogramming in response to various stimuli [3,4]. As such, PBMC bioenergetic profiling has gained traction as a minimally invasive biomarker approach for investigating cellular energy metabolism in clinical research and translational medicine.
The application of Seahorse extracellular flux (XF) analysis has revolutionised the field of cellular bioenergetics by enabling real-time, simultaneous measurement of mitochondrial respiration (oxygen consumption rate, OCR) and glycolytic function (proton efflux rate, PER) in living cells [3,5]. This technology has proven particularly valuable for characterising PBMC metabolic phenotypes, as it requires relatively small cell numbers and provides real-time information about cellular energy production pathways without radioactive substrates [6,7].
PBMC bioenergetic signatures have demonstrated clinical utility across multiple disease states. For example, in rheumatic conditions, disease activity associates with increased basal respiration, while therapeutic efficacy correlates with bioenergetic response to mitogenic stimulation [4]. Similarly, modified PBMC mitochondrial function has been documented in end-stage renal disease, with significant reductions in basal respiration, ATP turnover, maximal respiration, and spare respiratory capacity compared to healthy controls [8]. In oncology, PBMC bioenergetics have shown promise as predictive biomarkers for immunotherapy response, whereby melanoma patients that responded well to anti-Programmed Death (PD)-1 therapy exhibited higher basal glycolytic activity and reserve respiratory capacity compared to non-responders [9]. Studies have also identified associations between PBMC mitochondrial function and systemic bioenergetic capacity, including relationships with brain morphology in Type 2 diabetes [10] and alterations in myalgic encephalomyelitis/chronic fatigue syndrome, characterised by decreased mitochondrial coupling efficiency [11]. Furthermore, PBMC metabolic profiles have gained popularity recently for calculating the bioenergetic health index (BHI) or mitochondrial health index (MHI) as a marker for mitochondrial function in clinical settings [3,7].
Large-scale clinical datasets required to validate the predictive capabilities of PBMC bioenergetic biomarkers are limited by the requirement of venous blood sampling and suboptimal blood processing [7]. Specifically, the collection of venous blood samples using venepuncture presents several practical barriers that limit its applicability in certain populations and research contexts. For example, in paediatric populations, venepuncture poses unique challenges including small vein size, limited patient cooperation, heightened pain sensitivity, and increased procedural error rate [12,13]. Repeated venepuncture sampling also presents challenges for longitudinal studies requiring frequent blood collection. Venepuncture also necessitates trained phlebotomy personnel and is often restricted to clinical settings, limiting opportunities for field-based research and at home sampling. These limitations are particularly relevant for studies investigating chronic diseases, therapeutic and health monitoring, or population-based research where repetitive sampling is preferable.
Recent advances in upper-arm semiautomated self-collection devices such as the Tasso+ device offer easier use, greater capillary blood volume, and less pain than venepuncture or other capillary sampling methods (e.g., finger-prick). The Tasso+ device has created opportunities to overcome limitations associated with traditional venepuncture as well as low blood volume associated with capillary sampling [14]. Tasso+ devices employ microneedle technology with vacuum-assisted collection from the upper arm, enabling self-collection of liquid capillary blood samples in a minimally invasive manner. Unlike traditional capillary methods, this approach avoids potential interference from tissue fluid that can occur with manual expression techniques. Validation studies have already revealed the feasibility and accuracy of Tasso+ devices for various clinical applications, including SARS-CoV-2 antibody testing, autoantibody analysis in immune-mediated rheumatic diseases, cytomegalovirus DNAemia quantitation in transplant recipients, and chemistry analyte panels for clinical trial safety monitoring [14,15,16,17,18]. These devices have also demonstrated high patient acceptability, with most users reporting less pain compared to venepuncture and a preference for using the device in future sampling [19,20]. Despite extensive validation for serology and clinical chemistry applications, a critical knowledge gap remains regarding the suitability of capillary blood sampling for cellular bioenergetic analysis. PBMCs isolated for metabolic profiling require sufficient cell numbers, high viability, and preservation of metabolic phenotypes. The potential impact of sampling method on cellular composition, activation state, or metabolic function has not been systematically evaluated.
Given that acute exercise of sufficient intensity represents a well-characterised physiological stressor that profoundly affects immune cell metabolism, exercise provides an ideal model for validating methodological equivalence for sample comparisons in PBMC analysis. Exercise induces immediate mobilisation of all leukocytes, particularly cytolytic natural killer cells, gamma-delta T cells, and more differentiated subsets of T cells, while triggering complex metabolic responses involving oxidative phosphorylation, glycolysis, and reactive oxygen species production within these cells [21]. Studies have also demonstrated that moderate-to-vigorous exercise preferentially mobilises activated T cells primed for glucose uptake, with increases in mitochondrial respiratory function at the tissue level when accounting for exercise-induced leukocytosis [22]. The utility of acute exercise as a stressor for validating sampling methodologies lies in its ability to produce reproducible, physiologically relevant metabolic perturbations. If capillary blood sampling can capture similar exercise-induced immune cell bioenergetic shifts as venous blood, this would provide further support for methodological acceptance under dynamic, rather than merely static, conditions.
The present study aimed to address this knowledge gap by evaluating whether capillary blood sampling from the upper arm using the Tasso+ device can (i) be used to establish reliable PBMC metabolic profiles and (ii) determine whether PBMC bioenergetic profiles from capillary blood samples are in agreement with PBMCs isolated from venous blood. To our knowledge, this represents the first systematic comparison of sampling method for PBMC metabolic analysis using Seahorse XF technology. Critically, we employed maximal exercise as an acute physiological stressor to assess whether both sampling approaches equally capture stress-induced metabolic responses, providing validation under dynamic and resting conditions. We hypothesised that (1) PBMCs isolated from capillary blood would yield similar haematological parameters and cellular compositions compared with venous blood; (2) bioenergetic parameters including mitochondrial and glycolytic metabolic phenotypes would not differ between PBMCs isolated between capillary and venous blood samples; and (3) any exercise-induced bioenergetic change would be captured by both sampling approach.

2. Materials and Methods

2.1. Participants

Fourteen participants provided informed consent to take part in this study. Individuals were excluded if they smoked or vaped, had a body mass index (BMI) greater than 30 kg/m2, or reported a history of cardiovascular, metabolic, respiratory, or neurological disorders. Additional inclusion criteria required that participants had not donated blood within the previous 12 weeks and were deemed safe to engage in exercise, as assessed by the Physical Activity Readiness Questionnaire (PAR-Q) [23]. The study received favourable ethical approval from the Science, Technology, Engineering and Mathematics Ethical Review Committee at the University of Birmingham (ERN_19-1574PA10) and adhered to the principles of the Declaration of Helsinki, with the exception of prior registration on a publicly accessible database.

2.2. Study Design

All participants completed two visits to the School of Sport, Exercise and Rehabilitation Sciences at the University of Birmingham. An initial screening visit involved measuring height, weight, and blood pressure. At least 7 days after the screening visit, the experimental trial took place, consisting of an incremental exercise protocol to exhaustion on a cycle ergometer. Paired venous and capillary blood samples were collected before and after the maximal exercise test. Before attending the experimental visit, individuals adhered to an overnight fast and avoided caffeine and alcohol for 24 h, as well as vigorous physical activity for 48 h. Upon arrival, participants completed the Wisconsin Upper Respiratory Symptom Survey (WURSS-44), providing ratings of upper respiratory symptoms experienced during the preceding 24 h [24]. The questionnaire yields a total symptom score by summing responses to each question, scored from 0 (not sick) to 7 (severe). The trial was rescheduled if the participant had a total score of >30. After a 15 min seated rest period, a capillary and venous blood sample was taken (Capillary Pre, Venous Pre). Participants then completed a 5 min warmup in which cycling workload was gradually increased until a rating of perceived exertion (RPE) of 11 was reached. The incremental cycling protocol commenced immediately after the warm-up, with power output (W) increasing by 30 W every 2 min until participants reached volitional fatigue. Heart rate (Polar H10 Verity Sense, Polar, Finland) and RPE were recorded at the end of each stage. Volitional exhaustion was defined as a cadence dropping below 60 revolutions per minute (RPM) for more than 10 s. Throughout the test, participants wore a face mask connected to a metabolic cart (Vyntus, Vyaire, IL, USA) to enable continuous breath-by-breath gas analysis. Immediately after exercise cessation, a capillary and venous blood sample was taken (Capillary Post, Venous Post). The average time taken to complete sampling of venous blood was 51.68 ± 24.12 s, and 229.47 ± 113.90 s for capillary blood. Of the 14 participants enrolled, 2 yielded insufficient capillary blood volume (<0.5 mL) and were completely excluded from all analyses to maintain paired capillary–venous comparisons. PBMC isolation was performed on the remaining 12 participants. PBMC yield following isolation determined downstream analytical capacity. One participant yielded < 0.6 × 10⁶ PBMCs from their post-exercise capillary sample and was therefore excluded from all cell-based assays. Of the remaining 11 participants, 4 yielded 0.6–1.4 × 10⁶ PBMCs from all blood samples, sufficient for T-cell immunophenotyping and PMA/ionomycin activation studies but insufficient for complete XF metabolic profiling (minimum requirement: 1.4 × 10⁶ cells per sample). Six participants yielded ≥ 1.4 × 10⁶ PBMCs from all blood samples collected and completed all assays. Final analytical cohorts were as follows: n = 12 for haematological analysis and T-cell immunophenotyping, n = 11 for activation metabolic profiling, and n = 6 for comprehensive metabolic profiling.

2.3. Venous Blood Sampling

Venous blood samples were collected between 09:00 and 10:00 following an overnight fast from 10 pm. An intravenous cannula was placed into the antecubital vein of the arm, and a 10 mL pre-exercise blood sample was collected into a K2EDTA vacutainer tube (Becton, Dickinson & Company, Oxford, UK). K2EDTA vacutainer tubes were used to minimise inter-sample variation [7]. The cannula was flushed with 2 mL of isotonic saline (0.9% sodium chloride; PosiFlush, BD, Franklin Lakes, NJ, USA), and this was repeated every 15 min (where applicable) to prevent blood clots. Prior to the post-exercise blood sample (10 mL), 2 mL of blood was taken and discarded to prevent sampling of residual blood. Samples were gently inverted several times to prevent coagulation and processed within 2 h for downstream assays.

2.4. Capillary Blood Sampling

Capillary blood samples were collected at the same time from the upper arm using the Tasso+ Direct device according to the manufacturer’s instructions. The skin of the upper lateral arm was prepared by rubbing until warm and sterilising with an alcohol wipe before attaching the device to the skin. The device was activated to collect capillary blood into K2EDTA microtainer tubes (Becton, Dickinson & Company, Oxford, UK) for up to 5 min or until the sampling tube was almost full (Capillary blood collection is limited to a maximum of approximately 1 mL of whole blood per microtainer tube). To ensure enough capillary blood (≥0.5 mL) was available for downstream metabolic profiling of PBMCs, capillary blood was pooled together from 2 microtainer tubes collected from each arm. Samples were gently inverted several times to prevent coagulation and processed within 2 h for downstream assays.

2.5. Haematology Analysis

Whole blood counts were performed on the day of capillary and venous blood sampling (n = 12) using an automated haematology analyser (Yumizen H500, HORIBA Medical, Kyoto, Japan) to examine whole blood concentrations of red blood cells, haemoglobin, haematocrit, platelets, total white blood cells, and subsets including neutrophils, lymphocytes, monocytes, eosinophils, basophils, and large immature cells (Supplementary Table S1).

2.6. Flow Cytometry

T-cell phenotyping from venous and capillary whole blood samples was carried out using flow cytometry (n = 12). A Cytoflex-S instrument (Beckman Coulter, Brea, CA, USA) was used to detect CD4+, CD8+, gamma-delta (γδ) T cells, and their effector memory subpopulations. All antibodies were obtained from BioLegend (San Diego, CA, USA) and titrated to optimise separation of positive and negative cell populations. Data were processed using CytExpert version 2.5 (Beckman Coulter, CA, USA). Compensation was applied daily using UltraComp eBeads (ThermoFisher Scientific, Waltham, MA, USA). Cell viability was assessed using 7-amino-actinomycin D (7-AAD), enabling the exclusion of non-viable cells. For staining, 100 µL of whole blood was incubated for 20 min with an antibody cocktail consisting of CD3-FITC, CD8-APC, CD4-BV410, TCR γδ-BV525, CCR7-PE, CD45RA-APC750, and 7-AAD. Following incubation, samples underwent two phosphate-buffered saline (PBS) washes (5 min, 350× g, 21 °C) before acquisition on the flow cytometer. T-cell subsets were defined within the CD3+ gate using quadrant gating with CCR7 and CD45RA to identify naïve (CD45RA+ CCR7+), central memory (CD45RA-CCR7+), effector memory (CD45RA-CCR7-), and terminally differentiated effector memory (TEMRA; CD45RA+CCR7-) phenotypes. This was applied across CD4+ helper T cells (CD3+/CD4+), CD8+ cytotoxic T cells (CD3+/CD8+), and γδ T-cell populations (CD3+/CD4-CD8-/TCRγδ+). A minimum of 50,000 lymphocyte events were recorded per sample. All peripheral blood immune cell concentrations (cells/µL) were derived by combining cell frequencies with whole blood lymphocyte counts obtained from the haematology analyser. All post-exercise immune cell concentrations were adjusted for relative shifts in blood volume using an adapted version of the Dill and Costill equation.

2.7. PBMC Isolation

PBMCs were isolated from 2 mL venous or ≥1 mL capillary whole blood using EasySep™ Direct PBMC isolation kits (STEMCELL Technologies, Vancouver, BC, Canada) with “The Easy Eight” magnet, according to the manufacturer’s instructions (n = 12). This isolation method was selected based on superior reproducibility and consistency for PBMC metabolic profiling applications [7]. Following isolation, DPBS was added to the enriched PBMC suspension (up to 4 mL) and centrifuged at 500× g for 10 min at room temperature. PBMCs were washed into 5 mL of pre-warmed XF media (Seahorse XF RPMI pH 7.4, supplemented with 10 mM glucose, 2 mM L-glutamine, and 1 mM sodium pyruvate), and centrifuged again at 500× g for 10 min at room temperature before finally resuspending into 1 mL of XF media for counting. Viable PBMCs (Supplementary Figure S1) were counted automatically after staining with acridine orange and propidium iodide using a Cellometer Auto 2000 Cell Counter (Nexcelom Bioscience, Lawrence, MA, USA).

2.8. Seahorse XF Analysis

2.8.1. Cell Preparation

PBMCs were seeded into XFe96 V3 PS microwell plates (Agilent Technologies, Santa Clara, CA, USA) pre-coated with Cultrex poly-D-lysine (#3439-100-01, bio-techne, R&D Systems, McKinley Place, MN, USA) at a density of 2 × 10⁵ cells per well. To improve plating efficiency between wells, cells were counted after centrifugation and diluted to the necessary cell seeding density and volume prior to seeding with an automated multi-stepper pipette (Voyager, Integra Biosciences, Thatcham, UK). Cells were initially seeded in a volume of 80 µL per well and then centrifuged at 100× g for 1 min without braking to facilitate cellular adhesion. After incubation at 37 °C under air for 15 min, the experimental well volume was increased to 180 µL by addition of XF media. Background control wells received only 180 µL/well of XF media. Four experimental wells were used for each sample group and were visually inspected with an inverted light microscope for even cell seeding. Wells identified with heterogeneous cell settling were excluded prior to experimentation.

2.8.2. Real-Time Metabolic Profiling Protocol

Full cellular bioenergetic profiles were assessed in 6 participants using an XFe96 analyser (Agilent Technologies, Santa Clara, CA, USA). Following 4 baseline measurement cycles, the sequential injection of oligomycin (2 µg/mL, Sigma-Aldrich, Burlington, MA, USA, catalogue #O4876), BAM15 (3 µM, bio-techne, catalogue #5737), rotenone (2 µM, Sigma-Aldrich, catalogue #R8875) plus antimycin A (2 µM, Sigma-Aldrich, catalogue #A8674), and monensin (25 µM, Sigma-Aldrich, catalogue #M5273) were added to establish ATP-coupled respiration, maximal respiratory capacity, non-mitochondrial respiration, and maximal glycolysis, respectively [7]. Each measurement cycle consisted of a 3 min mix and 3 min measure period. For immune cell activation profiling, phorbol 12-myristate 13-acetate (PMA, 100 ng/mL, Sigma-Aldrich, catalogue #P8139) plus ionomycin (1 µg/mL, Sigma-Aldrich, catalogue #I0634) were injected following baseline measurements, followed by sequential injection of oligomycin, rotenone plus antimycin A, and monensin to assess stimulated bioenergetic responses. Metabolic profiling from immune cell activation was completed in 11 participants.

2.9. Data Analysis

Mitochondrial and glycolytic bioenergetic parameters were calculated from the OCR and proton production rate (PPR) as previously described [7,25,26]. For measurements of glycolytic metabolic profiling, extracellular acidification rates (ECAR) were converted to PER using Seahorse Analytics (Agilent Technologies) by considering the buffering capacity of XF RPMI media. Glycolytic PER (glycoPER), an accurate measure of glycolysis, was obtained by subtracting mitochondrial PER from total PER using a pre-determined H+/O2 value of 0.38 as empirically calculated by [26]. ATP synthesis rates were calculated as described previously [26,27]. Mitochondrial control analysis including the respiratory control ratio (RCR) and mitochondrial health index (MHI), were calculated from mitochondrial bioenergetic parameters, as detailed in [7]. ATP-stimulation indices were calculated as the fold-change in the ATP synthesis rate following PMA/ionomycin stimulation relative to baseline (ATP SI = stimulated rate/basal rate), determined separately for mitochondrial ATP synthesis (mitoATP SI), glycolytic ATP synthesis (glycoATP SI), and total ATP synthesis (total ATP SI).

2.10. Statistical Analysis

Statistical analyses were performed using GraphPad Prism Version 10.3.1 (San Diego, CA, USA). Data are presented as the mean ± SD unless otherwise indicated. For all bioenergetic comparisons between capillary and venous sampling methods, two-way ANOVA was used with the sampling method (capillary vs. venous) and condition (pre-exercise vs. post-exercise) as factors. Tukey’s multiple comparisons test was applied as post hoc analysis to compare specific pairs of means. Correlations between capillary and venous measurements were assessed using the Pearson correlation coefficient (r) to evaluate the strength and direction of linear relationships between sampling methods. For all haematology and T-cell profiling data, paired t-tests were used with sampling method (capillary vs. venous) or within sampling method for each condition (pre-exercise vs. post-exercise). For all analyses, statistical significance was defined as p < 0.01 to reflect strong confidence limits.
Agreement between capillary and venous sampling was characterised using Bland–Altman analysis [28]. For each parameter, the absolute difference (CAP − VEN) per donor pair was plotted against the paired mean (CAP + VEN)/2. Systematic bias was defined as the mean of individual differences, and 95% limits of agreement (LoAs) were calculated as bias ± 1.96 × SD of the differences. The width of the LoA was interpreted relative to the scale of each parameter to assess the clinical or biological meaningfulness of the observed disagreement; narrower LoAs relative to the parameter range indicate better individual-level concordance. The direction of systematic bias (positive or negative) indicated whether capillary values systematically exceed or fall below venous values.
Formal equivalence testing was performed using the Two One-Sided Tests (TOST) procedure to determine whether the mean difference between capillary and venous sampling fell within a pre-specified equivalence margin (δ), thereby justifying the use of methods interchangeably. For T-cell subset data (n = 12 donors), δ was defined a priori as ±20% of the VEN Pre reference mean for each subset. This margin was selected based on established clinical flow cytometry standards for between-method agreement [29], where differences ≤20% are considered acceptable for diagnostic immunophenotyping applications and would not materially affect clinical interpretation of immune cell populations (e.g., distinguishing healthy from immunocompromised states). Adopting this margin reflects the practical reality that in clinical practice, equivalent methods should yield results that lead to the same diagnostic or research conclusions despite minor numerical differences. For bioenergetic parameters (n = 6 donors), δ was derived from an independent repeated-measures dataset of the same donor assessed across three separate experimental runs using identical isolation and assay conditions. This approach provided a realistic estimate of the combined within-run analytical and between-run processing variability expected when two independently prepared PBMC samples are compared on the same day. Specifically, δ was calculated as the VEN Pre reference mean × (pooled CV% + 3 × SD of within-experiment CVs) ÷ 100, where pooled CV% represents the coefficient of variation across all replicates pooled from the three experiments. This formula-based approach has several advantages for equivalence margin selection: (1) it accounts for both analytical noise (within-run variation) and processing variability (between-run variation), reflecting the independent processing chains that capillary and venous samples undergo; (2) it is parameter specific, recognising that inherently more variable parameters (e.g., RCR, fold-change ratios) should have proportionally larger acceptable margins than tightly regulated parameters (e.g., coupling efficiency); and (3) it is anchored to actual measured variability in the laboratory system rather than arbitrary fixed percentages. By including the term (3 × SD of within-experiment CVs), the margin accounts for day-to-day variation in assay performance beyond the average coefficient of variation, establishing a realistic threshold for acceptable interchangeability under real-world conditions. Differences exceeding δ suggest method-specific biases or variability that would necessitate establishment of separate reference ranges for capillary and venous blood, defeating the goal of interchangeability. Equivalence was declared when the 90% confidence interval of the mean paired difference (CAP − VEN) fell entirely within [−δ, +δ], evaluated using a one-tailed t-distribution with df = n − 1 at α = 0.05.

3. Results

3.1. Participant Characteristics and Haematology

Participant demographic and physiological characteristics are presented in Supplementary Table S1. The final analytical cohort (n = 12) demonstrated a relatively narrow age range (27 ± 7 years), with minimal age-related metabolic variability. Body composition measurements confirmed a healthy cohort (BMI: 22.7 ± 2.1 kg/m2; waist-to-hip ratio: 0.8 ± 0.1), with no participants classified as overweight or obese. Cardiorespiratory fitness assessment revealed ‘good’ aerobic capacity relative to age defined by ACSM guidelines (VO2peak: 44.8 ± 8.2 mL/kg/min). Resting cardiovascular measurements (heart rate: 63 ± 11 bpm) confirmed normal baseline function.
Whole blood count analysis from paired capillary and venous samples (n = 12) revealed minimal between-method differences for most haematological parameters (Supplementary Figure S1). Red blood cell counts, haemoglobin concentration, and haematocrit showed no significant differences between venous and capillary blood at either timepoint (Figure S1A–C). Maximal exercise induced significant haemoconcentration in venous samples (increased RBC, HGB, and HCT), whereas these exercise-induced changes did not reach statistical significance compared with rest in capillary samples. Notably, platelet counts were significantly lower in capillary samples compared with venous at both rest and post-exercise (p < 0.0001; Figure S1D), falling below the normal clinical reference range (150 × 103/µL). White blood cell populations, including total leucocytes, neutrophils, lymphocytes, and monocytes, demonstrated comparable values between sampling method with significant exercise-induced changes detected in both sample types (Figure S1E–H).

3.2. T-Cell Immunophenotyping

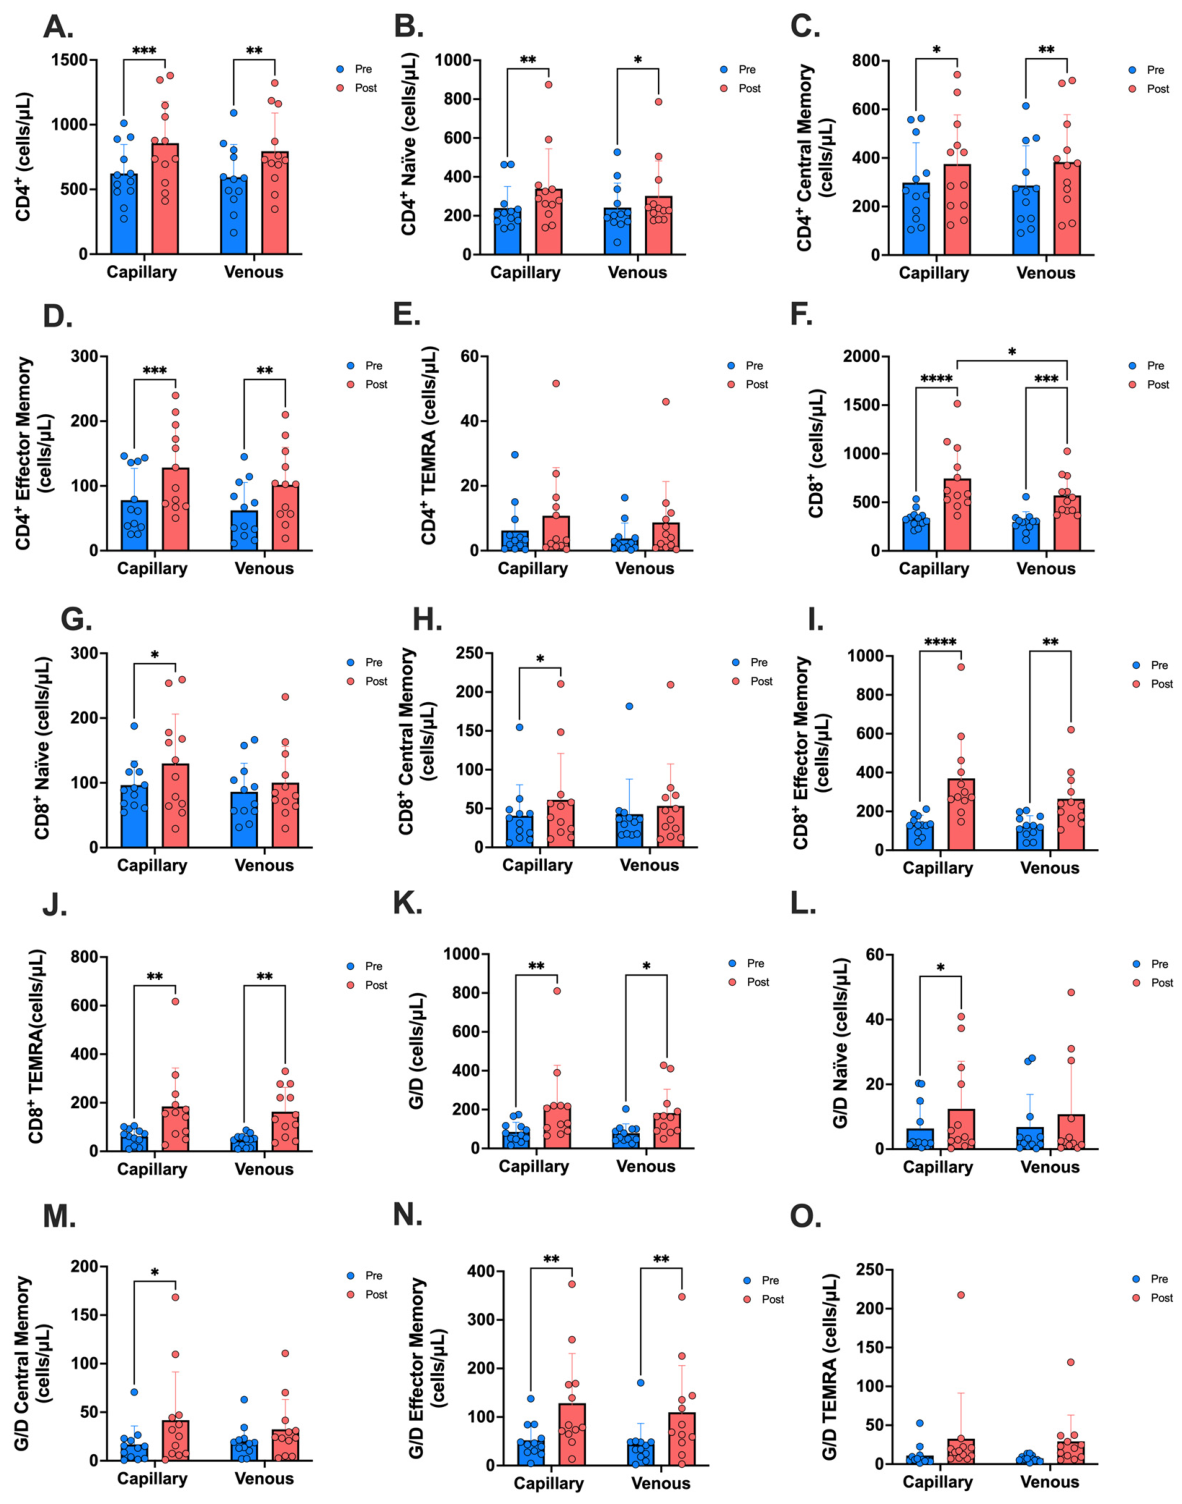
T-cell subset enumeration from paired capillary and venous samples is presented in Figure 1. No significant differences were observed between capillary and venous blood at pre-exercise for any T-cell population. Maximal exercise induced significant increases in total CD4+, CD8+, and γδ T cells from both capillary and venous samples (Figure 1A,F,K). Within CD4+ sub-populations, naïve, central memory, and effector memory T cells all increased significantly post-exercise from both sampling methods (Figure 1B–D). CD4+ TEMRA cells did not change significantly post-exercise from either method (Figure 1E). CD8+ naïve and central memory T cells increased significantly in capillary samples only (Figure 1G,H). CD8+ effector memory and TEMRA T cells increased significantly post-exercise from both sampling methods (Figure 1I,J). γδ naïve and central memory T cells increased significantly in capillary samples only (Figure 1L,M). γδ effector memory T cells increased significantly post-exercise from both sampling methods (Figure 1N). γδ TEMRA cells did not change significantly post-exercise in either method (Figure 1O).
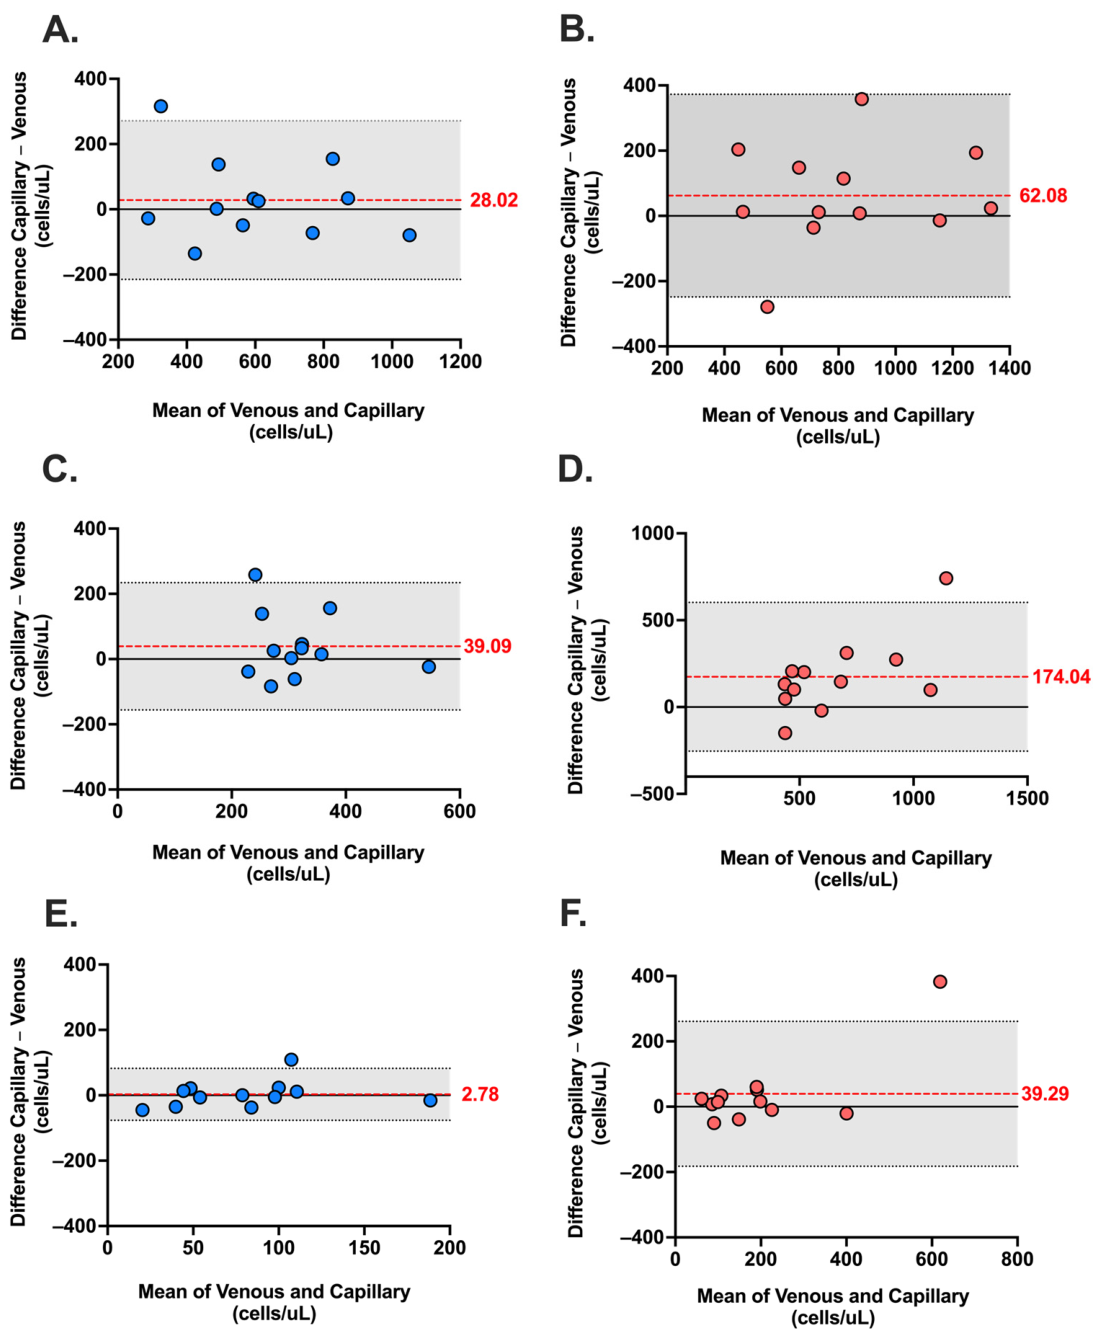
Bland–Altman analysis was used to characterise the magnitude and direction of agreement between capillary and venous sampling at the individual level (Figure 2). At rest, all three T-cell parent populations demonstrated a small positive bias, indicating capillary values were marginally higher than venous. CD4+ T cells showed a mean bias of +28.0 cells/μL (95% LoA: −215.2 to +271.2 cells/μL). CD8+ T cells demonstrated a bias of +39.09 cells/μL (95% LoA: −156.0 to +234.2 cells/μL). Gamma-delta T cells showed the smallest absolute bias of +2.78 cells/μL (95% LoA: −76.67 to +82.22 cells/μL). Post-exercise, CD4+ T cells showed a post-exercise bias of +62.1 cells/μL (95% LoA: −248.5 to +372.6 cells/μL). CD8+ T cells demonstrated the largest bias of +174.0 cells/μL (95% LoA: −254.1 to +602.2 cells/μL). Gamma-delta T cells showed a post-exercise bias of +39.3 cells/μL (95% LoA: −182.5 to +261.0 cells/μL). The width of the LoA was proportionally wide for all subsets relative to their reference means. Importantly, the LoAs were symmetrically distributed around the bias for all subsets, indicating no consistent directional bias at the individual level.
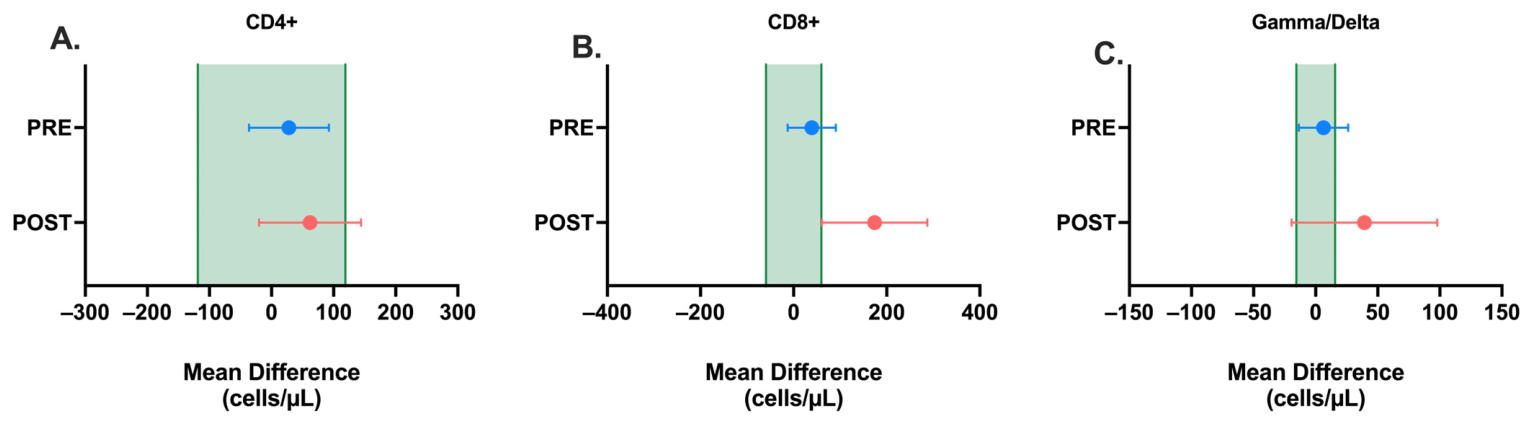
To formally test whether capillary and venous sampling are interchangeable for T-cell subset enumeration, TOST equivalence analysis was performed using an equivalence margin of ±20% of the Venous Pre reference mean for each subset, as per [29], (Table 1, Figure 3). For total CD4+ T cells at rest, the 90% CI of the mean difference fell within the equivalence margin (±118.9 cells/μL), confirming equivalence (p = 0.014). CD4+ naïve T cells also demonstrated equivalence at rest (90% CI: −29.7 to +24.9 cells/μL; δ = ±48.4 cells/μL; p = 0.006). All remaining subsets, including central memory, effector memory, and TEMRA CD4+ T cells and all sub-populations of CD8+ and γδ T-cell populations, did not meet equivalence criteria at either rest or post-exercise (Table 1). Post-exercise, no subsets achieved equivalence, consistent with the increased bias and LoA width observed in the Bland–Altman analysis.

3.3. Bioenergetic Metabolic Phenotyping

Analysis of absolute bioenergetic rates (pmol/min/well) revealed no significant differences between capillary and venous sampling methods for mitochondrial respiratory or glycolytic parameters at rest or post-exercise (Figure S2). The basal mitochondrial oxygen consumption rate (Basal mitoOCR) was comparable between capillary and venous samples at rest and post-exercise (Supplementary Figure S2A). Similarly, proton leak, ATP-coupled respiration, maximal mitochondrial respiratory capacity, basal glycolytic proton efflux rate (glycoPER), and basal and maximal total ATP supply rates showed no significant between-method differences either before or after maximal exercise (Supplementary Figure S2). Exercise induced a significant between-method difference in maximal glycoPER between capillary and venous samples (p < 0.01; Supplementary Figure S2G), though this effect did not reach statistical significance at rest. No other post-exercise between-method differences were observed for absolute rates. Capillary- and venous-derived mitoOCR, glycoPER, and total ATP supply rates were all very strongly correlated between sampling methods at rest and post-exercise timepoints (mitoOCR: r = 0.74 and 0.73; glycoPER: r = 0.74 and 0.78; ATP supply rates: r = 0.80 and 0.79, respectively), though confidence intervals were wide, particularly for mitoOCR and glycoPER (Supplementary Figure S3).
Despite comparable group-level values, Bland–Altman analysis revealed wide limits of agreement for all absolute bioenergetic parameters, with a consistent negative bias indicating systematically lower values in capillary-derived samples (Supplementary Figures S4 and S5). The negative bias was consistent across all absolute parameters, indicating that capillary-derived PBMCs systematically produced lower absolute bioenergetic outputs than venous-derived cells. The LoAs were substantially wide relative to the scale of each parameter, reflecting both systematic bias and substantial inter-individual variability in the direction of the method difference. Formal TOST equivalence analysis confirmed that no absolute bioenergetic parameters met equivalence criteria at either rest or post-exercise (Supplementary Table S2). The 90% CIs of the mean differences substantially exceeded the equivalence margins derived from independent processing variability data for all parameters, except for proton leak respiration, which demonstrated equivalence at both timepoints. The equivalence of proton leak is consistent with its low absolute magnitude and known high intra-individual variability, which results in a proportionally wider equivalence margin. For all other absolute parameters, the systematic negative bias and wide CIs indicate that the methods are not interchangeable for absolute rate comparisons.
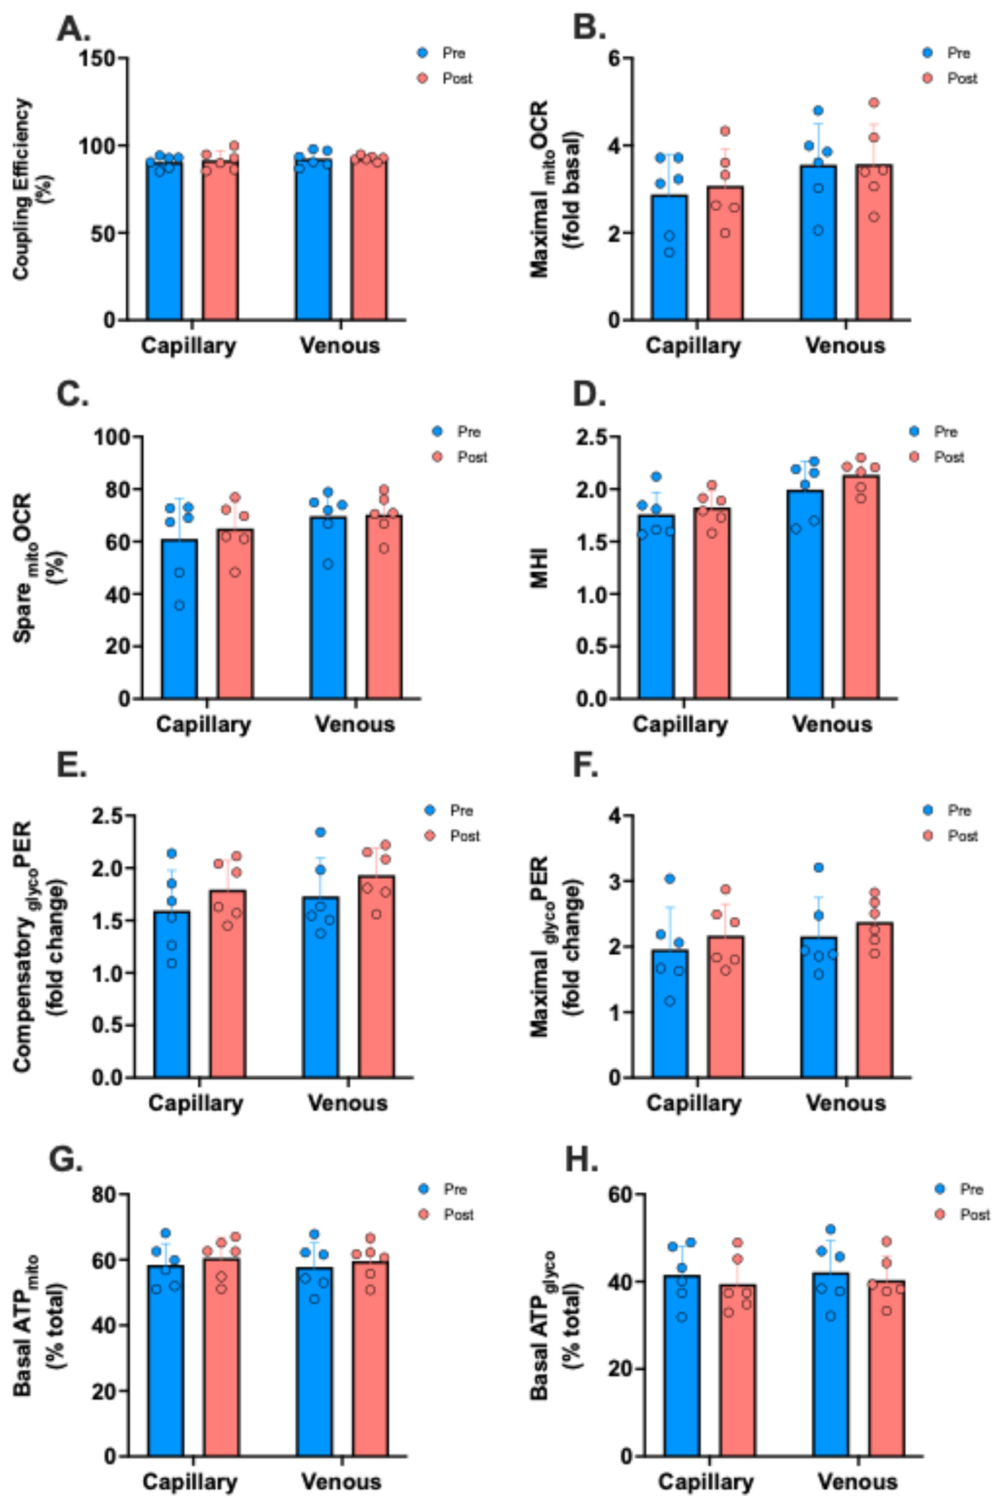
Given the poor agreement observed for absolute bioenergetic parameters (Supplementary Figures S4 and S5 and Table S2), we focused on normalised parameters that provide metabolic phenotype characterisation independent of technical variations in cell seeding and mitochondrial content. Analysis of normalised PBMC bioenergetic parameters from paired capillary and venous samples revealed no significant differences between sampling method either at rest or post-exercise (Figure 4). Mitochondrial coupling efficiency was consistently high (>90%) in PBMCs from both samples (Figure 4A). Maximal mitochondrial respiration, expressed as the fold-change from basal, showed no significant difference between capillary and venous sampling (Figure 4B). Spare respiratory capacity, representing reserve mitochondrial capacity expressed as the percentage of maximal capacity, was equivalent between sampling methods (Figure 4C). The MHI, a composite metric integrating spare capacity, ATP production, proton leak, and non-mitochondrial OCR, reflecting mitochondrial functional health, showed no significant between-method difference (Figure 4D). Compensatory glycolysis and maximal glycolysis, expressed as the fold-change from basal glycolytic rate, also demonstrated comparable increases between sampling method (Figure 4E,F). ATP substrate preference analysis revealed consistent mitochondrial (~60%) versus glycolytic (~40%) ATP supply under basal conditions in both capillary and venous samples (Figure 4G,H). Moreover, maximal exercise did not significantly alter normalised bioenergetic parameters in either sampling method. While visual trends indicated potential changes in some parameters (e.g., MHI, mitochondrial ATP supply, and compensatory glycolysis), these did not reach statistical significance.
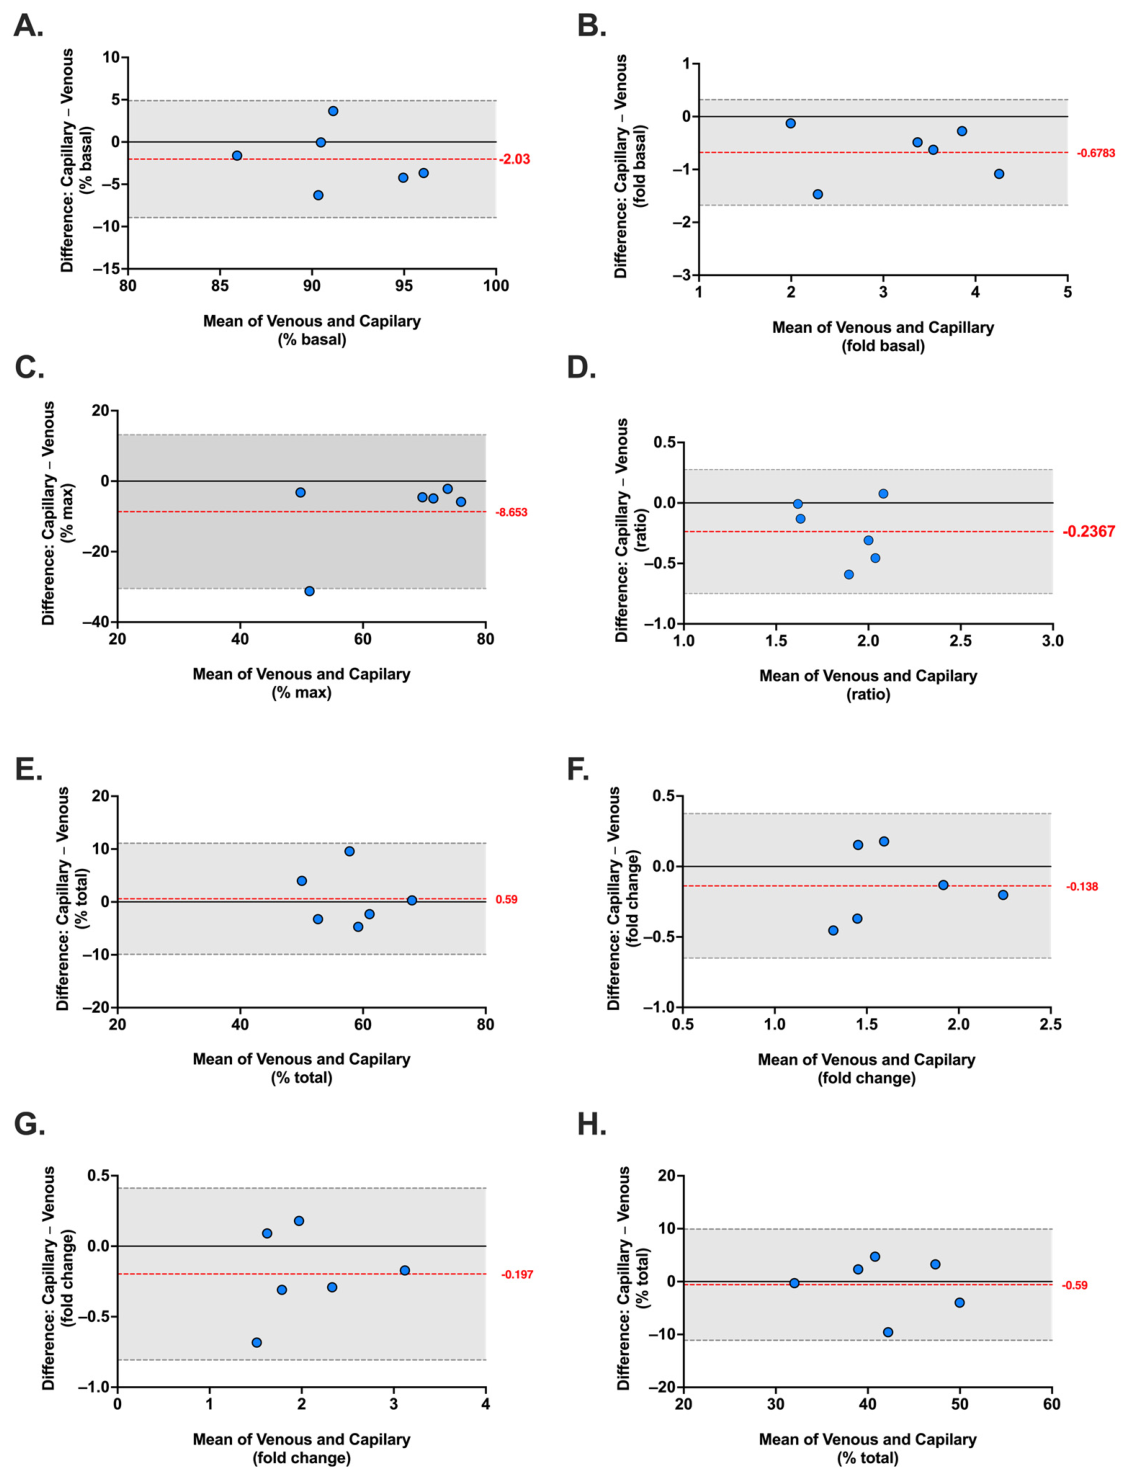
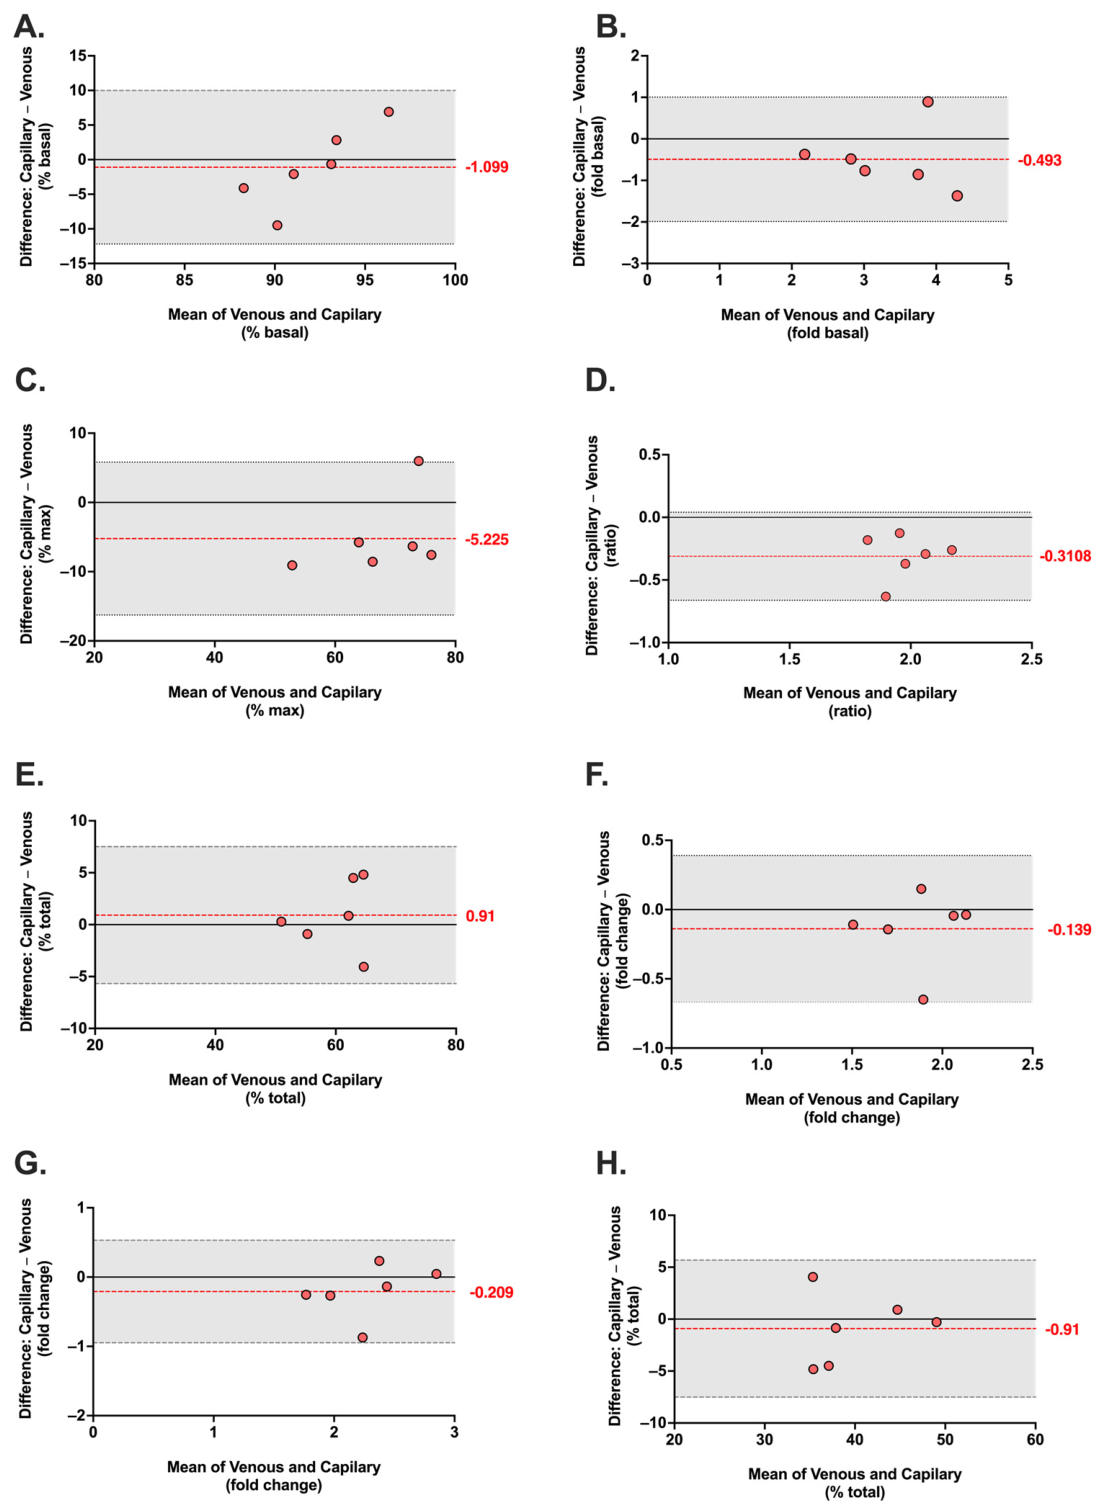
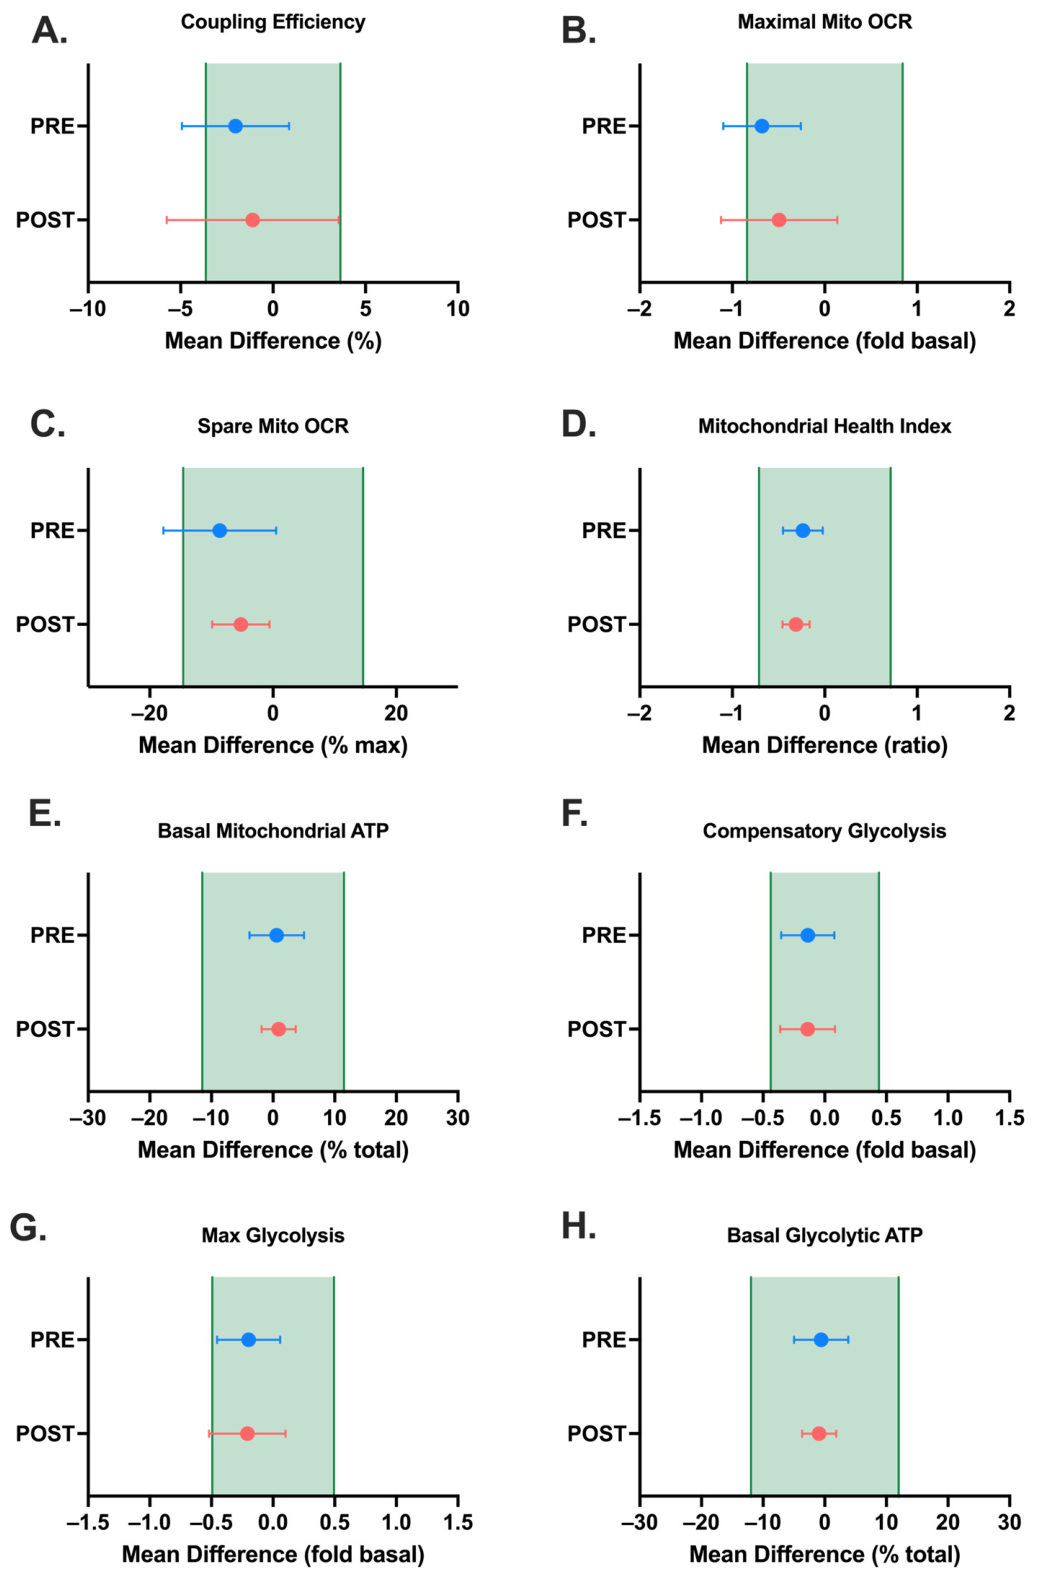
Bland–Altman analysis of normalised bioenergetic parameters revealed substantially narrower limits of agreement and smaller bias compared to absolute parameters, reflecting the variance-cancellation properties of ratio-based metrics (Figure 5 and Figure 6). At rest, coupling efficiency showed a small negative bias (−2.03%; 95% LoA: −8.94 to +4.88%). MHI demonstrated a bias of −0.24 (95% LoA: −0.75 to +0.28). ATP fraction parameters (basal ATP-MITO % and ATP-GLYC %) demonstrated the narrowest LoA of all parameters assessed, reflecting the complementary and tightly constrained nature of these metrics. Post-exercise, the LoAs were of comparable width for most parameters (Figure 6). TOST equivalence analysis for normalised bioenergetic parameters is presented in Table 2 and Figure 7. At rest, equivalence was demonstrated for mitochondrial health index, compensatory glycolysis, max glycolysis fold basal, basal ATP-MITO, and basal ATP-GLYC. Post-exercise, these same parameters retained equivalence, with the addition of spare mitochondrial respiration. Neither coupling efficiency nor maximal respiratory capacity met equivalence.

3.4. Bioenergetic Response to Acute Immune Activation

We next evaluated whether metabolic shifts during acute immune cell activation were similarly preserved between capillary and venous samples. To assess the capacity of PBMCs to upregulate ATP supply in response to immune activation, cells were stimulated with phorbol 12-myristate 13-acetate (PMA) and ionomycin, which mimics T-cell receptor activation and calcium signalling, respectively. ATP-stimulation indices were calculated as the fold-change in ATP supply rate between activated (PMA/ionomycin-stimulated) and non-activated cells for total, mitochondrial, and glycolytic ATP supply (Figure 8). These internally normalised metrics provide a measure of metabolic responsiveness independent of absolute baseline differences between donors, consistent with the normalised parameter approach used for metabolic phenotype characterisation.
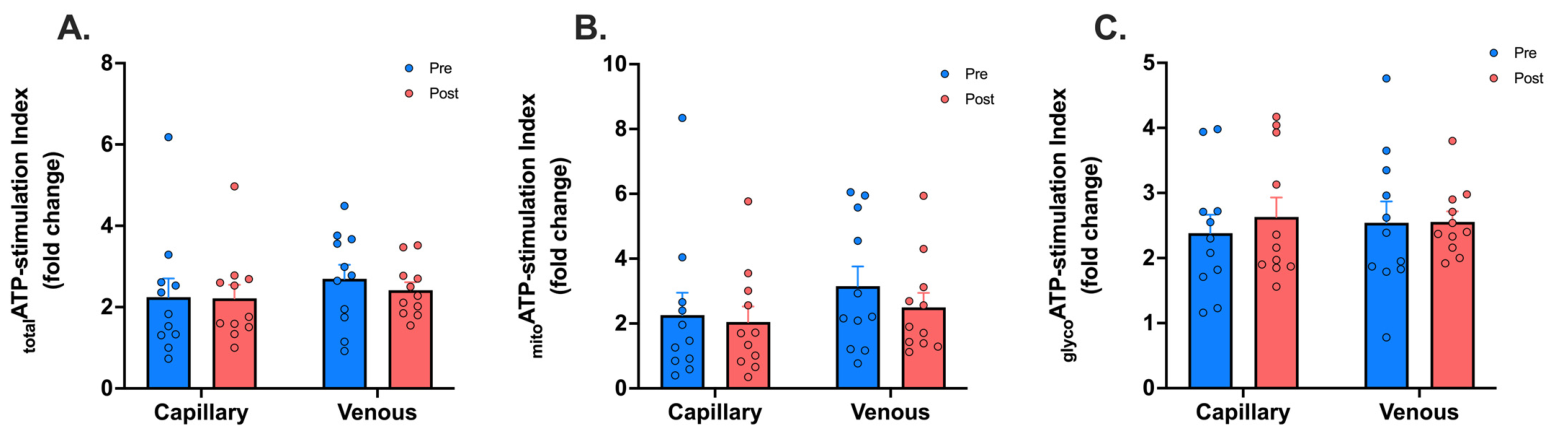
The total ATP synthesis rate increased by 2-fold upon stimulation with PMA and ionomycin, consistent with a 2-fold increase in mitochondrial ATP supply and roughly 2.5-fold increase in glycolytic ATP supply, demonstrating the typical metabolic shifts in activated PBMCs. Analysis of ATP-stimulation indices revealed no significant differences between capillary and venous samples at either rest or post-exercise samples (Figure 8). Total ATP-stimulation index, representing the overall capacity to upregulate ATP supply upon immune activation, demonstrated equivalent responses in capillary and venous samples across both conditions (Figure 8A). Corresponding mitochondrial and glycolytic ATP-stimulation indices, reflecting the fold-increase in mitochondrial and glycolytic ATP supply following activation, were also comparable between sampling methods at both timepoints (Figure 8B,C). These findings indicate that PBMCs from capillary blood retain similar capacity to mount metabolic responses to immune activation compared with venous blood, and this capacity is maintained regardless of prior exercise stress.

4. Discussion

This study provides the first systematic validation of capillary blood sampling using the Tasso+ device for T-cell immunophenotyping and PBMC bioenergetic profiling using XF analysis. We employed Bland–Altman analysis and TOST tests to rigorously examine method agreement and equivalence, moving from simple statistical comparisons to clinically meaningful assessments of individual-level concordance.
Whole blood analysis revealed equivalent haematological profiles between methods except for platelet counts, which were significantly lower in capillary samples due to a well-documented technical artefact of dermal puncture and platelet adhesion to collection surfaces [14]. This does not impact PBMC isolation as platelets are removed during isolation. Importantly, lymphocyte and monocyte counts showed no between-method differences, confirming comparable cell numbers for PBMC isolation. These findings support the use of capillary blood for PBMC isolation and lymphocyte immunophenotyping, though platelet enumeration requires venepuncture to avoid technical artefacts.
The present study demonstrates that capillary blood sampling using the Tasso+ device provides comparable resting T-cell profiles to conventional venous sampling across all CD4+, CD8+, and γδ T-cell populations examined. Formal equivalence testing confirmed that total CD4+ and CD4+ naïve T cells at rest met the pre-specified equivalence criterion of ±20% of the venous reference mean, supporting the interchangeability of the two methods for these populations under resting conditions. The failure of remaining sub-populations to meet equivalence criteria at rest is noteworthy and likely reflects the proportionally narrow equivalence margins imposed for small sample populations with low absolute counts, such as TEMRA and effector memory subsets. This is consistent with the Bland–Altman analysis, which demonstrated symmetrically distributed limits of agreement with small positive bias at rest across all populations, indicating no systematic directional advantage of either method under resting conditions.
Post-exercise, no T-cell population met equivalence criteria, and Bland–Altman analysis revealed increased bias and wider limits of agreement across all subsets. Notably, several sub-populations, including CD8+ naïve, CD8+ central memory, γδ naïve, and γδ central memory T cells, showed significant exercise-induced increases in capillary but not venous samples. These observations raise several questions regarding the mechanisms driving the post-exercise divergence between sampling methods. One possible explanation is consistent with exercise-induced lymphocyte mobilisation, whereby shear stress and catecholamine-driven demargination preferentially release T cells into the peripheral microcirculation [30]. If this mechanism were operative, the larger post-exercise bias and wider limits of agreement in capillary samples might represent earlier and more pronounced detection of mobilised cells being released into the capillary circulation before subsequent redistribution into the systemic venous compartment. The leg-dominant nature of the exercise and arm-based capillary sampling site argues against a local response. An alternative possibility is that mobilisation of cells from marginal pools contributes to the observed capillary bias, with proximity to the pulmonary reservoir potentially playing a role. However, these mechanistic interpretations remain speculative, as the present study did not directly investigate the underlying physiological drivers of the post-exercise bias (e.g., via catecholamine measurement, temporal sampling kinetics, or direct assessment of marginal pool mobilisation). Regardless of the underlying mechanism, the key findings are clear: the two methods are not interchangeable for post-exercise immunophenotyping, and the choice of sampling method may influence the detection of exercise-induced lymphocyte responses, particularly for subsets with the most dynamic mobilisation kinetics such as CD8+ effector memory, TEMRA, and γδ T cells. T-cell concentrations demonstrated narrow limits of agreement between methods for total CD4+, CD8+, and γδ T-cell populations, with small positive bias at rest and increased bias post-exercise (Figure 2, Table 1).
Analysis of bioenergetic parameters revealed no statistically significant between-method differences for absolute metabolic rates (pmol/min/well) or normalised parameters (ratios, percentages, and fold-changes) at rest or post-exercise (Figure 3 and Figure S2). However, Bland–Altman analysis revealed that absolute bioenergetic rates showed a consistent negative bias and wide limits of agreement, reflecting systematically lower capillary values, while normalised parameters demonstrated narrower limits of agreement with smaller and more variable bias (Figure 5 and Figure 6; Supplementary Figures S3 and S4). TOST equivalence analysis confirmed that absolute parameters were not interchangeable between methods, whereas several normalised parameters, including MHI, glycolytic fold-change parameters, and ATP fraction metrics, met equivalence criteria at rest and/or post-exercise (Table 2; Figure 7). This discrepancy between ANOVA (no significant group difference) and TOST/Bland–Altman (not equivalent) highlights a critical limitation of relying solely on p-values for method validation, demonstrating that the absence of statistical significance does not guarantee clinically acceptable or individually consistent agreement.
Bland–Altman analysis revealed that the width of the limits of agreement for normalised parameters was broadly stable between rest and post-exercise conditions, with no systematic worsening or improvement in individual-level concordance following maximal exercise. An exception was spare respiratory capacity (% max), which showed a notable reduction in LoA width post-exercise (pre: −30.5 to +13.2%; post: −16.3 to +5.8%). TOST analysis correspondingly showed that spare respiratory capacity achieved equivalence post-exercise (TOST p = 0.029) but not at rest. These condition-specific patterns underscore the value of performing equivalence validation under the specific physiological states relevant to the intended application, rather than assuming equivalence generalises across all conditions.
Our TOST equivalence analysis provides the first formal assessment of method interchangeability for PBMC bioenergetic profiling from capillary blood. The equivalence margins were derived from an independent characterisation of processing variability specifically, the combined within-run analytical noise and between-run processing variability observed when the same donor’s cells were independently prepared across separate experimental days. This approach acknowledged the practical reality that samples from two different blood draws on the same day, one capillary and one venous, will experience independent processing chains, introducing variability beyond simple replicate well noise. By basing margins on measured laboratory variability rather than arbitrary fixed percentages, we established thresholds that are more meaningful and achievable for real-time bioenergetic measurements. Importantly, the formula (pooled CV% + 3 × SD of within-experiment CVs) yields parameter-specific margins that appropriately reflect biological and technical reality: inherently variable parameters (RCR, CV = 47%; fold-change ratios, CV = 24–33%) have proportionally larger acceptable margins than tightly regulated parameters (coupling efficiency, CV = 4.0%). This parameter-specific approach acknowledges that methods cannot be equally interchangeable across all measurements, as some parameters are inherently noisier than others. The practical implication is that a capillary sample and venous sample collected on the same day and independently processed can be considered interchangeable if their results fall within these empirically derived, parameter-specific margins. Results exceeding these margins would signal method-specific biases requiring separate reference ranges and precluding interchangeable use. Equivalence for MHI, compensatory and maximal glycolytic (pre-exercise), and ATP fraction parameters (Table 2) are clinically meaningful, as these metrics have demonstrated utility for immunometabolic phenotyping in disease states and longitudinal studies [7,11,31]. The non-equivalence of coupling efficiency, despite narrow limits of agreement, reflects the tight physiological regulation of this parameter; the equivalence margins, though derived from real processing variability, are proportionally small relative to the inter-individual LoA at n = 6. Larger sample sizes would be expected to substantially narrow the confidence intervals and may reveal equivalence for these parameters in future validation studies.
Despite clear exercise-induced T-cell mobilisation detected by flow cytometry (Figure 1), PBMC bioenergetic parameters showed no significant change (Figure 3). This reflects biological limitations of heterogeneous cell measurements. First, PBMCs are lymphocyte dominated (~70–80%), and while PBMC measurements primarily reflect T-cell metabolism, different T-cell subsets (naïve and memory) exhibit a predominantly oxidative basal metabolic preference under resting conditions [31,32]. Substantial metabolic differentiation emerges through increased glycolysis primarily upon activation [32]. Thus, replacing one T-cell type with another (e.g., naïve with effector memory) would not necessarily alter bioenergetic profiles. Second, blood was collected immediately post-exercise, the PBMCs isolated and then rested 1 h at 37 °C before analysis. Exercise mobilises existing cell pools (redistribution, not de novo activation), and metabolic reprogramming (increased glycolysis, mitochondrial biogenesis) requires hours to days to manifest. The 1 h rest period may allow transient activation states to dissipate while being too early for metabolic adaptation. Third, we assessed bioenergetic parameters under basal conditions in unstimulated PBMCs, where subset differences are modest compared to the significant increases during activation [33].
Importantly, PBMCs isolated from both capillary and venous blood failed to demonstrate exercise-induced metabolic changes, reflecting biological limitations of PBMC measurements rather than differential method sensitivity. This validates that capillary sampling provides equivalent detection sensitivity to venous sampling for assessment of cellular metabolic profiles using XF analysis. For subset-specific metabolic profiling, alternative approaches are required: flow cytometry-based metabolic assays enabling single-cell phenotype-metabolism correlation, FACS-sorted populations for subset-specific analysis, or T-cell-specific stimulation protocols (anti-CD3/CD28) that selectively activate T-cell receptor pathways.
Furthermore, ATP-stimulation indices following PMA/ionomycin activation showed no between-method differences (Figure 6), validating functional capacity preservation. This activation capacity representing the cells’ ability to mount metabolic responses when challenged may be more biologically relevant than basal measurements for immune function assessment, as it reflects functional reserve required for responding to pathogens, vaccines, or inflammatory stimuli [21]. Notably, activation capacity showed no exercise effects despite T-cell mobilisation. This likely reflects PMA/ionomycin being a non-specific pan-cellular activator that bypasses receptor-mediated signalling. PMA directly activates protein kinase C, while ionomycin induces calcium influx across all cell membranes, maximally activating the entire PBMC population. When all subsets are maximally activated, exercise-induced T-cell compositional shifts are masked by monocytes, which exhibit substantially higher metabolic rates than T cells during activation due to larger size and higher mitochondrial content [33]. Furthermore, maximal stimulation creates a ceiling effect where all cell types reach similar fold-increases regardless of subset identity. For detecting exercise-induced changes in T-cell activation capacity specifically, T-cell-specific stimulation (anti-CD3/CD28, antigen recall) applied to purified populations would be more appropriate.
The absence of exercise-induced changes in PBMC bioenergetic parameters is itself a positive finding, demonstrating that maximal exercise stress does not acutely impair mitochondrial function or metabolic capacity. PBMCs isolated immediately post-exercise showed preserved coupling efficiency, spare respiratory capacity, ATP production, and activation capacity consistent with resting samples, indicating mobilised immune cells retain full metabolic competence. The preservation of activation capacity post-exercise, regardless of sampling method, validates that neither exercise stress nor capillary collection impairs fundamental PBMC metabolic responsiveness. More generally capillary-derived PBMCs retained metabolic phenotype characteristics of venous-derived PBMCs, including high coupling efficiency (>90%), substantial spare respiratory capacity, and balanced ATP supply (~60% mitochondrial, ~40% glycolytic under basal conditions). These metrics have established clinical utility in chronic fatigue syndrome [11], end-stage renal disease [8], and rheumatic diseases [4], supporting the suitability of capillary sampling for mitochondrial health assessment. Therefore, PBMC bioenergetic profiling remains highly appropriate for assessing overall metabolic health, mitochondrial function, and activation potential particularly for longitudinal disease monitoring, treatment assessment, or population comparisons where compositional shifts are not the primary outcome [30,31,32].
Whilst our data support the use of capillary blood samples for real-time PBMC metabolic profiling, several considerations warrant acknowledgment. Firstly, in a clinical setting, absolute bioenergetic profiles from capillary-derived PBMCs should not be used interchangeably with venous profiles and require separate reference ranges, analogous to clinical chemistry practice where capillary and venous reference ranges differ for certain analytes (e.g., glucose and lactate). For studies requiring absolute rate comparisons, post-assay normalisation to cell number or mitochondrial content is recommended to account for technical and biological variance. Whilst normalised parameters inherently incorporate this principle, achieving agreement without additional post hoc steps makes them more suitable metrics for metabolic phenotype characterisation. Secondly, the low sample size (n = 6 for bioenergetics and n = 11 for activation) used in our study, while adequate for detecting methodological differences and representing initial validation in healthy individuals, warrants further confirmation in larger datasets. Additionally, extension to clinical populations with immune dysfunction or metabolic disease is necessary to confirm equivalence across disease states, where baseline metabolic phenotypes may differ from healthy controls. Thirdly, the ~2–3 min capillary collection time (vs. <1 min venepuncture) may have influenced post-exercise immunophenotyping, as lymphocytes rapidly egress following exercise cessation [34,35]. Capillary volume limitations (~0.6–1 mL maximum) also restrict experimental replicates compared with venepuncture, although this is adequate for comprehensive bioenergetic profiling when sufficient sample volume (>1 mL) is collected and multiple devices can increase capacity for expanded panels. Finally, although T-cell immunophenotyping indicates comparable cellular composition between methods, detailed flow cytometric characterisation of PBMC subsets post-isolation was not performed in this study. Future work incorporating detailed subset analysis alongside bioenergetic profiling would provide additional confidence, and for studies requiring subset-specific metabolic phenotyping or detecting compositional changes via bioenergetic signatures, the use of PBMCs alone would not be recommended.

5. Conclusions

Capillary blood sampling using the Tasso+ device provides comparable T-cell subsets and PBMC bioenergetic profiles under basal and activated conditions when compared with conventional venous sampling, with only minimal statistically significant differences. However, formal equivalence testing confirmed interchangeability for only total CD4+ and naïve CD4+ T cells pre-exercise, compensatory glycolysis (pre- and post-exercise), maximal glycolysis (pre-exercise), spare respiratory capacity (post-exercise), mitochondrial and glycolytic ATP fractions (pre- and post-exercise), and MHI (pre- and post-exercise). All absolute and other normalised bioenergetic rate parameters and T-cell subsets were not interchangeable between methods and would therefore require separate reference ranges. These findings validate capillary blood collection as a minimally invasive alternative to venepuncture for immunometabolic research, with normalised bioenergetic parameters representing the most appropriate metrics for cross-method comparisons. By eliminating venepuncture barriers such as procedural pain, trained personnel requirements, and logistical constraints, capillary sampling enables research previously impractical. Home-based sampling facilitates investigation of day-to-day metabolic variability, responses to interventions, and comprehensive profiling in populations where venepuncture is challenging. Decentralised studies become feasible without trained phlebotomists, expanding accessibility for individuals with mobility limitations. As PBMC bioenergetic biomarkers emerge as indicators of metabolic health and disease progression, accessible sampling methods become essential for clinical translation.

Supplementary Materials

The following supporting information can be downloaded at: https://www.mdpi.com/article/10.3390/clinbioenerg2030014/s1.

Author Contributions

Conceptualisation, J.B. and A.J.W.; methodology, J.B., A.J.W., and P.A.C.; validation, J.B., D.N., A.J.W., T.E.N., and P.A.C.; formal analysis, J.B., D.N., and P.A.C.; investigation, J.B., D.N., P.A.C., and A.J.W.; data curation, J.B., D.N., T.E.N., and P.A.C.; writing—original draft preparation, J.B. and P.A.C.; writing—review and editing, J.B., D.N., P.A.C., T.E.N., and A.J.W.; supervision, J.B. and A.J.W.; project administration, J.B. and A.J.W.; funding acquisition, J.B. and A.J.W. All authors have read and agreed to the published version of the manuscript.

Funding

This research was funded by the University of Birmingham’s Cellular Health and Metabolism Facility and research budgets from J.B and A.J.W.

Institutional Review Board Statement

The study was conducted in accordance with the Declaration of Helsinki and given a favourable ethical opinion by the Science, Technology, Engineering and Mathematics Ethical Review Committee at the University of Birmingham (ERN_19-1574PA10; approval date: 14 June 2024).

Informed Consent Statement

Informed consent was obtained from all subjects involved in the study.

Data Availability Statement

The raw data supporting the conclusions of this article will be made available by the authors on request.

Acknowledgments

The authors thank all the participants for their time in taking part in this study. During the preparation of this manuscript/study, the authors used [Claude AI, Sonnet 4.5] for the purposes of formatting and grammar checking of text. The authors have reviewed and edited the output and take full responsibility for the content of this publication.

Conflicts of Interest

The authors declare no conflicts of interest.

Abbreviations

The following abbreviations are used in this manuscript:
ANOVAAnalysis of variance
ATPAdenosine triphosphate
BHIBioenergetic health index
CMVCytomegalovirus
ECARExtracellular acidification rate
PERProton efflux rate
MHIMitochondrial health index
OCROxygen consumption rate
PBMCPeripheral blood mononuclear cells
PMAPhorbol 12-myristate 13-acetate
RCRRespiratory control ratio
RPERating of perceived exertion
RPMRevolutions per minute
XFExtracellular flux
GlycoPERGlycolytic proton efflux rate
TEMRATerminally differentiated effector memory T cells
DPBSDulbecco’s modified phosphate-buffered saline
BMIBody mass index
K2EDTADipotassium ethylenediaminetetraacetic acid
PAR-QPhysical Activity Readiness Questionnaire
WURSSWisconsin Upper Respiratory Symptom Survey
7-AAD7-Aminoactinomycin

References

  1. Jones, N.; Piasecka, J.; Bryant, A.H.; Jones, R.H.; Skibinski, D.O.F.; Francis, N.J.; Thornton, C.A. Bioenergetic analysis of human peripheral blood mononuclear cells. Clin. Exp. Immunol. 2015, 182, 69–80. [Google Scholar] [CrossRef] [Scilit]
  2. Nicholas, D.; Proctor, E.A.; Raval, F.M.; Ip, B.C.; Habib, C.; Ritou, E.; Grammatopoulos, T.N.; Steenkamp, D.; Dooms, H.; Apovian, C.M.; et al. Advances in the quantification of mitochondrial function in primary human immune cells through extracellular flux analysis. PLoS ONE 2017, 12, e0170975. [Google Scholar] [CrossRef] [Scilit] [PubMed]
  3. Chacko, B.K.; Kramer, P.A.; Ravi, S.; Benavides, G.A.; Mitchell, T.; Dranka, B.P.; Ferrick, D.; Singal, A.K.; Ballinger, S.W.; Bailey, S.M.; et al. The bioenergetic health index: A new concept in mitochondrial translational research. Clin. Sci. 2013, 127, 367–373. [Google Scholar]
  4. Kramer, P.A.; Ravi, S.; Chacko, B.; Johnson, M.S.; Darley-Usmar, V.M. A review of the mitochondrial and glycolytic metabolism in human platelets and leukocytes: Implications for their use as bioenergetic biomarkers. Redox Biol. 2014, 2, 206–210. [Google Scholar] [CrossRef] [Scilit] [PubMed]
  5. Nicholls, D.G.; Darley-Usmar, V.M.; Wu, M.; Jensen, P.B.; Rogers, G.W.; Ferrick, D.A. Bioenergetic profile experiment using C2C12 myoblast cells. J. Vis. Exp. 2010, 46, 2511. [Google Scholar] [CrossRef] [Scilit] [PubMed]
  6. Windt, G.J.W.; Chang, C.H.; Pearce, E.L. Measuring bioenergetics in T cells using a Seahorse Extracellular Flux Analyzer. Curr. Protoc. Immunol. 2016, 113, 3–16. [Google Scholar] [CrossRef] [Scilit] [PubMed]
  7. Macleod, M.; Pradana, F.; Wadley, A.J.; Barlow, J. Comprehensive real-time metabolic profiling of peripheral blood mononuclear cells reveals important methodological considerations for immunometabolism research. Front. Immunol. 2025, 16, 1676550. [Google Scholar] [CrossRef] [Scilit] [PubMed]
  8. Altintas, M.M.; DiBartolo, S.; Tadros, L.; Samelko, B.; Wasse, H. Metabolic changes in peripheral blood mononuclear cells isolated from patients with end stage renal disease. Front. Endocrinol. 2021, 12, 629239. [Google Scholar] [CrossRef] [Scilit] [PubMed]
  9. Triozzi, P.L.; Stirling, E.R.; Song, Q.; Westwood, B.; Kooshki, M.; Forbes, M.E.; Holbrook, B.C.; Cook, K.L.; Alexander-Miller, M.A.; Miller, L.D.; et al. Circulating immune bioenergetic, metabolic, and genetic signatures predict melanoma patients’ response to anti-PD-1 immune checkpoint blockade. Clin. Cancer Res. 2022, 28, 1192–1202. [Google Scholar] [CrossRef] [Scilit] [PubMed]
  10. Mahapatra, G.; Smith, S.C.; Hughes, T.M.; Wagner, B.; Maldjian, J.A.; Freedman, B.I.; Molina, A.J.A. Blood-based bioenergetic profiling is related to differences in brain morphology in African Americans with Type 2 diabetes. Clin. Sci. 2018, 132, 2509–2518. [Google Scholar] [CrossRef] [Scilit] [PubMed]
  11. Fernandez-Guerra, P.; Gonzalez-Ebsen, A.C.; Boonen, S.E.; Courraud, J.; Gregersen, N.; Mehlsen, J.; Palmfeldt, J.; Olsen, R.K.J.; Brinth, L.S. Bioenergetic and proteomic profiling of immune cells in myalgic encephalomyelitis/chronic fatigue syndrome patients: An exploratory study. Biomolecules 2021, 11, 961. [Google Scholar] [CrossRef] [Scilit] [PubMed]
  12. Ricci, V.; Bertini, G.; Dani, C. Peripheral venepuncture in pediatric patients: A mini-review of clinical practice and technological advances. J. Clin. Med. 2025, 14, 6397. [Google Scholar] [CrossRef] [Scilit] [PubMed]
  13. Daihimfar, F.; Babamohamadi, H.; Ghorbani, R. A comparison of the effects of acupressure and music on venepuncture pain intensity in children: A randomized controlled clinical trial. Pain Res. Manag. 2024, 2024, 2504732. [Google Scholar] [CrossRef] [Scilit] [PubMed]
  14. Hendelman, T.; Chaudhary, A.; LeClair, A.C.; van Leuven, K.; Chee, J.; Fink, S.L.; Welch, E.J.; Berthier, E.; Quist, B.A.; Wald, A.; et al. Self-collection of capillary blood using Tasso-SST devices for Anti-SARS-CoV-2 IgG antibody testing. PLoS ONE 2021, 16, e0255841. [Google Scholar] [CrossRef] [Scilit] [PubMed]
  15. Zarbl, J.; Eimer, E.; Gigg, C.; Bendzuck, G.; Korinth, M.; Elling-Audersch, C.; Kleyer, A.; Simon, D.; Boeltz, S.; Krusche, M.; et al. Remote self-collection of capillary blood using upper arm devices for autoantibody analysis in patients with immune-mediated inflammatory rheumatic diseases. RMD Open 2022, 8, e002641. [Google Scholar] [CrossRef] [Scilit] [PubMed]
  16. Phan, T.; Kumar, L.; Woo, M.; Sadowska-Klasa, A.; Castor, J.; Pepper, G.; Fisher, C.E.; Limaye, A.P. Evaluation of the Tasso+ blood self-collection device for quantitation of plasma cytomegalovirus (CMV) DNAemia in adult solid organ transplant recipients (SOTr). Microbiol. Spectr. 2024, 12, e0003024. [Google Scholar] [CrossRef] [Scilit] [PubMed]
  17. Wickremsinhe, E.; Fantana, A.; Berthier, E.; Quist, B.A.; Lopez de Castilla, D.; Fix, C.; Chan, K.; Shi, J.; Walker, M.G.; Kherani, J.F.; et al. Standard Venepuncture vs a Capillary Blood Collection Device for the Prospective Determination of Abnormal Liver Chemistry. J. Appl. Lab. Med. 2023, 8, 535–550. [Google Scholar] [CrossRef] [Scilit] [PubMed]
  18. Drucker, C.; O’Dwyer, B.; Hugo, P.; Fix, C.; Keane, C.; Rachmuth, G. Self-Collection of Blood Specimens in Clinical Trials. Appl. Clin. Trials Online 2021. Available online: https://www.appliedclinicaltrialsonline.com/view/self-collection-of-blood-specimens-in-clinical-trials (accessed on 16 June 2026).
  19. King, E.R.; Garrett, H.E.; Abernathy, H.; Cassidy, C.A.; Cabell, C.R.; Shook-Sa, B.E.; Juliano, J.J.; Boyce, R.M.; Aiello, A.E.; Ciccone, E.J. Comparison of capillary blood self-collection using the Tasso-SST device with venous phlebotomy for anti-SARS-CoV-2 antibody measurement. J. Immunol. Methods 2023, 520, 113523. [Google Scholar] [CrossRef] [Scilit] [PubMed]
  20. Dasari, H.; Smyrnova, A.; Leng, J.; Ducharme, F.M. Feasibility, acceptability, and safety of a novel device for self-collecting capillary blood samples in clinical trials in the context of the pandemic and beyond. PLoS ONE 2024, 19, e0304155. [Google Scholar] [CrossRef] [Scilit] [PubMed]
  21. Rosa-Neto, J.C.; Lira, F.S.; Antunes, B.M. The physical exercise-induced oxidative/inflammatory response in peripheral blood mononuclear cells: Signaling cellular energetic stress situations. Life Sci. 2023, 320, 121574. [Google Scholar] [CrossRef] [Scilit] [PubMed]
  22. Theall, B.; Stampley, J.; Cho, E.; Granger, J.; Johannsen, N.M.; Irving, B.A.; Spielmann, G. Impact of acute exercise on peripheral blood mononuclear cells nutrient sensing and mitochondrial oxidative capacity in healthy young adults. Physiol. Rep. 2021, 9, e15147. [Google Scholar] [CrossRef] [Scilit] [PubMed]
  23. Chisholm, D.M.; Collis, M.L.; Kulak, L.L.; Davenport, W.; Gruber, N.; Stewart, G. PAR-Q Validation Report: The Evaluation of a Self-Administered Pre-Exercise Screening Questionnaire for Adults; BC Ministry of Health and Health and Welfare: Victoria, BC, Canada, 1978.
  24. Barrett, B.; Locken, K.; Maberry, R.; Schwamman, J.; Bobula, J.; Brown, R.; Stauffacher, E.A. The Wisconsin Upper Respiratory Symptom Survey: Development of an instrument to measure the common cold. J. Fam. Pract. 2002, 51, 265. [Google Scholar] [PubMed]
  25. Brand, M.D.; Nicholls, D.G. Assessing mitochondrial dysfunction in cells. Biochem. J. 2011, 435, 297–312. [Google Scholar] [CrossRef] [Scilit] [PubMed]
  26. Desousa, B.R.; Kim, K.K.; Jones, A.E.; Ball, A.B.; Hsieh, W.Y.; Swain, P.; Morrow, D.H.; Brownstein, A.J.; Ferrick, D.A.; Shirihai, O.S.; et al. Calculation of ATP production rates using the Seahorse XF Analyzer. EMBO Rep. 2023, 24, e56380. [Google Scholar] [CrossRef] [Scilit] [PubMed]
  27. Mookerjee, S.A.; Gerencser, A.A.; Nicholls, D.G.; Brand, M.D. Quantifying intracellular rates of glycolytic and oxidative ATP production and consumption using extracellular flux measurements. J. Biol. Chem. 2017, 292, 7189–7207. [Google Scholar] [CrossRef] [Scilit] [PubMed]
  28. Bland, J.M.; Altman, D.G. Statistical methods for assessing agreement between two methods of clinical measurement. Lancet 1986, 8, 307–310. [Google Scholar] [CrossRef] [Scilit]
  29. Ticchioni, M.; Brouzes, C.; Durrieu, F.; Lambert, C.; Association Française de Cytométrie Accreditation Working Group (AFC-AG). Acceptable “Real-Life” Variability for Lymphocyte Counts by Flow Cytometry. Cytom. Part B Clin. Cytom. 2019, 5, 379–388. [Google Scholar] [CrossRef] [Scilit] [PubMed]
  30. Stampley, J.E.; Cho, E.; Wang, H.; Theall, B.; Johannsen, N.M.; Spielmann, G.; Irving, B.A. Impact of maximal exercise on immune cell mobilization and bioenergetics. Physiol. Rep. 2023, 11, e15753. [Google Scholar] [CrossRef] [Scilit] [PubMed]
  31. van der Windt, G.J.W.; Everts, B.; Chang, C.-H.; Curtis, J.D.; Freitas, T.C.; Amiel, E.; Pearce, E.J.; Pearce, E.L. Mitochondrial respiratory capacity is a critical regulator of CD8+ T cell memory development. Immunity 2012, 36, 68–78. [Google Scholar] [CrossRef] [Scilit] [PubMed]
  32. Chacko, B.K.; Kramer, P.A.; Ravi, S.; Benavides, G.A.; Mitchell, T.; Dranka, B.P.; Ferrick, D.; Singal, A.K.; Ballinger, S.W.; Bailey, S.M.; et al. Methods for defining distinct bioenergetic profiles in platelets, lymphocytes, monocytes, and neutrophils, and the oxidative burst from human blood. Lab. Investig. 2014, 94, 690–700. [Google Scholar] [CrossRef] [Scilit] [PubMed]
  33. Ruple, B.A.; Carlini, N.A.; Kofoed, J.S.; Rostamkhani, H.; Hanson, B.E.; Wilcox, I.; Craig, J.C.; Osburn, S.C.; Drummond, M.J.; Broxterman, R.M.; et al. Transcriptomic analyses of peripheral blood mononuclear cells reveal age-specific basal and acute exercise responsiveness differences in humans. Am. J. Physiol.-Endocrinol. Metab. 2025, 329, E382–E391. [Google Scholar] [CrossRef] [Scilit] [PubMed]
  34. Rooney, B.V.; Bigley, A.B.; LaVoy, E.C.; Laughlin, M.; Pedlar, C.; Simpson, R.J. Lymphocytes and monocytes egress peripheral blood within minutes after cessation of steady state exercise: A detailed temporal analysis of leukocyte extravasation. Physiol. Behav. 2018, 194, 260–267. [Google Scholar] [CrossRef] [Scilit] [PubMed]
  35. Adams, G.R.; Zaldivar, F.P.; Nance, D.M.; Kodesh, E.; Radom-Aizik, S.; Cooper, D.M. Exercise and leukocyte interchange among central circulation, lung, spleen, and muscle. Brain Behav. Immun. 2011, 25, 658–666. [Google Scholar] [CrossRef] [Scilit] [PubMed]
Figure 1. T-cell subsets are comparable between venous and capillary blood before and after maximal exercise. Absolute counts of circulating T-cell populations measured by flow cytometry from venous and capillary blood samples collected before (blue bars) and after (red bars) maximal exercise. Panels show different T-cell subsets, CD4+ total (A), CD4+ naïve (B), CD4+ central memory (C), CD4+ effector memory (D), CD4+ TEMRA (E), CD8+ total (F), CD8+ naïve (G), CD8+ central memory (H), CD8+ effector memory (I), CD8+ TEMRA (J), γδ total (K), γδ naïve (L), γδ central memory (M), γδ effector memory (N), and γδ TEMRA (O). Data presented as mean ± SD, n = 12 paired samples. Statistical comparisons by two-way repeated-measures ANOVA with Tukey’s post hoc analysis. Asterisks denote significant differences for pre- and post-maximal exercise within sampling method; * p < 0.05, ** p < 0.01, *** p < 0.001 and **** p < 0.0001.
Clinbioenerg 02 00014 g001
Figure 2. Bland–Altman analysis of T-cell subset counts derived from capillary and venous blood sampling before and after maximal exercise. Bland–Altman plots depicting the agreement between capillary and venous blood-derived cell counts for total CD4+ T-cells (A,B), CD8+ T-cells (C,D), and gamma delta (γδ) T-cells (E,F) at pre-exercise (blue circles) and post-exercise (red circles) timepoints. The y-axis represents the difference between capillary and venous measurements (capillary minus venous; cells/µL), and the x-axis represents the mean of both methods (cells/µL). The dashed red horizontal line denotes the mean bias, with values indicated for each panel. Dashed grey horizontal lines and shaded area indicate 95% limits of agreement (bias ± 1.96 SD). n = 12 paired samples.
Clinbioenerg 02 00014 g002
Figure 3. Two One-Sided Tests (TOST) equivalence analysis for T-cell subset enumeration between capillary and venous blood sampling. Forest plots showing the mean paired difference (CAP − VEN, cells/μL) and 90% confidence interval (CI) for total CD4+ T-cells (A), CD8+ T-cells (B), and γδ T-cells (C) at rest (PRE—blue symbols) and following maximal exercise (POST—red symbols). Each horizontal bar represents the 90% CI of the mean difference; the central point denotes the mean difference. Vertical green lines and shading indicate the pre-specified equivalence margin. Equivalence is declared when the entire 90% CI falls within the shaded equivalence zone. Positive values indicate capillary values higher than venous. n = 12 donors.
Clinbioenerg 02 00014 g003
Figure 4. Normalised bioenergetic parameters show no significant differences between capillary and venous blood sampling. Normalised bioenergetic parameters measured from paired capillary and venous blood samples before (Pre, blue bars) and after (Post, red bars) maximal exercise in PBMCs. (A) Coupling efficiency (percentage of basal respiration dedicated to ATP synthesis), (B) maximal mitochondrial respiration (fold-change from basal mitoOCR), (C) spare respiratory capacity (percentage of maximal capacity), (D) mitochondrial health index (MHI; composite metric integrating spare capacity, ATP production, and proton leak), (E) basal mitochondrial ATP supply (percentage of total ATP supply), (F) compensatory glycolysis (fold-change from basal glycoPER following oligomycin treatment), (G) maximal glycolysis (fold-change from basal glycoPER following monensin treatment), and (H) basal glycolytic ATP supply (percentage of total ATP supply). Data presented as mean ± SD, n = 6 paired samples. Statistical comparisons by two-way repeated-measures ANOVA with Tukey’s post hoc analysis. No significant differences were observed between capillary and venous samples at either timepoint for any parameter.
Clinbioenerg 02 00014 g004
Figure 5. Bland–Altman analysis between capillary and venous blood sampling for normalised bioenergetic parameters. Bland–Altman plots showing differences (capillary−venous, y-axis) plotted against the mean of both methods (x-axis) for normalised bioenergetic parameters at before exercise (pre-exercise). (A) Coupling efficiency (%), (B) maximal mitoOCR (fold basal), (C) spare respiratory capacity (% maximal), (D) mitochondrial health index, (E) basal mitochondrial ATP (% total), (F) compensatory glycolysis (fold basal), (G) maximal glycolysis (fold basal), and (H) basal glycolytic ATP (% total). Dashed red horizontal line represents mean bias (numerical value shown in each panel). Dashed grey horizontal lines and shaded area indicate 95% limits of agreement (bias ± 1.96 SD). n = 6 paired samples.
Clinbioenerg 02 00014 g005
Figure 6. Bland–Altman analysis between capillary and venous blood for normalised bioenergetic parameters post-exercise. Bland–Altman plots showing differences (capillary−venous, y-axis) plotted against the mean of both methods (x-axis) for normalised bioenergetic parameters after maximal exercise (post-exercise). (A) Coupling efficiency (%), (B) maximal mitoOCR (fold basal), (C) spare respiratory capacity (% maximal), (D) mitochondrial health index (MHI), (E) basal mitochondrial ATP (% total), (F) compensatory glycolysis (fold basal), (G) maximal glycolysis (fold basal), and (H) basal glycolytic ATP (% total). Solid horizontal line represents mean bias (numerical value shown in each panel). Dashed grey horizontal lines and shaded area indicate 95% limits of agreement (bias ± 1.96 SD). n = 6 paired samples.
Clinbioenerg 02 00014 g006
Figure 7. Two One-Sided Tests (TOST) equivalence analysis for normalised bioenergetic parameters between capillary and venous PBMC sampling. Forest plots showing the mean paired difference (CAP − VEN) and 90% confidence interval (CI) for normalised bioenergetic parameters at rest (PRE) and following maximal exercise (POST): (A) coupling efficiency (%), (B) maximal mitochondrial OCR (fold basal), (C) spare mitochondrial OCR (% max), (D) mitochondrial health index (ratio), (E) basal mitochondrial ATP supply (% total), (F) compensatory glycolysis (fold basal), (G) max glycolysis (fold basal), and (H) basal glycolytic ATP supply (% total). Each horizontal bar represents the 90% CI of the mean difference; the central point denotes the mean difference. Vertical green lines and shading indicate the pre-specified equivalence margin (δ), derived for each parameter. The shaded region between the dashed lines represents the equivalence zone; equivalence is declared when the entire 90% CI falls within this zone. Positive values indicate capillary values higher than venous. n = 6 donors.
Clinbioenerg 02 00014 g007
Figure 8. ATP-stimulation indices show comparable metabolic responsiveness between capillary and venous PBMCs. ATP-stimulation indices calculated as fold-change in ATP supply rate from baseline (non-activated) to activated state (PMA/ionomycin stimulation) in paired capillary and venous PBMC samples before (Pre, blue bars) and after (Post, red bars) maximal exercise. (A) Total ATP-stimulation index (fold-change in total ATP supply), (B) mitochondrial ATP-stimulation index (fold-change in mitochondrial ATP production), and (C) glycolytic ATP-stimulation index (fold-change in glycolytic ATP production). Data presented as mean ± SD, n = 11 paired samples. Statistical comparisons by two-way repeated measures ANOVA with Tukey’s post hoc analysis. No significant differences were observed between capillary and venous samples at either timepoint.
Clinbioenerg 02 00014 g008
Table 1. Two One-Sided Tests (TOST) equivalence analysis for T-cell subsets and sub-populations: capillary versus venous blood sampling. Mean paired difference (CAP − VEN, cells/μL) and 90% confidence interval (CI) for total and memory sub-populations of CD4+, CD8+, and γδ T-cells assessed at rest (PRE) and following maximal exercise (POST) from paired capillary and venous whole blood samples. The equivalence margin δ was defined a priori as ±20% of the VEN Pre reference mean for each subset, representing the maximum difference considered clinically acceptable for immunophenotyping applications. This margin was applied uniformly across all subsets and timepoints, as the VEN Pre condition represents the stable resting reference state for each population. Equivalence was declared when both bounds of the 90% CI of the mean difference fell entirely within [−δ, +δ]. The TOST p-value represents the maximum of the two one-sided p-values; values below 0.05 indicate that the mean difference is significantly different from zero, reflecting a systematic bias between methods. Equivalence is determined by the CI relative to the margin, not by the p-value alone. A one-tailed t-distribution with df = 11 was used for CI construction. n = 12 donors. CI, confidence interval; TEMRA, terminally differentiated effector memory T-cells re-expressing CD45RA; G/D, gamma delta; VEN Pre, venous pre-exercise reference.
T-Cell SubsetMean Difference (CAP − VEN, Cells/μL)90% CI Lower90% CI UpperTOST p-ValueEquivalence
CD4+ (Total)PRE28.022−36.30592.3490.0138Equivalent
CD4+ (Total)POST62.075−20.071144.2210.1201Not equivalent
CD4+ NaïvePRE−2.442−29.74624.8630.0058Equivalent
CD4+ NaïvePOST37.2655.39769.1330.2710Not equivalent
CD4+ Central MemoryPRE12.242−35.97360.4560.0609Not equivalent
CD4+ Central MemoryPOST−8.016−66.85250.8200.0805Not equivalent
CD4+ Effector MemoryPRE15.7771.81129.7420.6624Not equivalent
CD4+ Effector MemoryPOST26.7949.48944.0990.9179Not equivalent
CD4+ TEMRAPRE2.4550.0444.8660.8844Not equivalent
CD4+ TEMRAPOST2.0850.3343.8360.9003Not equivalent
CD8+ (Total)PRE39.086−12.52390.6950.2466Not equivalent
CD8+ (Total)POST174.04360.807287.2780.9518Not equivalent
CD8+ NaïvePRE10.367−12.61933.3540.3012Not equivalent
CD8+ NaïvePOST29.604−0.27559.4840.7637Not equivalent
CD8+ Central MemoryPRE−1.993−14.27310.2880.1787Not equivalent
CD8+ Central MemoryPOST7.863−8.63424.3610.4704Not equivalent
CD8+ Effector MemoryPRE8.648−14.92132.2160.1247Not equivalent
CD8+ Effector MemoryPOST105.12741.946168.3080.9786Not equivalent
CD8+ TEMRAPRE15.8203.29728.3430.8238Not equivalent
CD8+ TEMRAPOST21.818−25.97969.6160.6796Not equivalent
Gamma Delta (Total)PRE6.346−13.55226.2440.2107Not equivalent
Gamma Delta (Total)POST39.291−19.36397.9450.7583Not equivalent
G/D NaïvePRE−0.447−3.3722.4780.2914Not equivalent
G/D NaïvePOST1.634−5.1928.4610.5272Not equivalent
G/D Central MemoryPRE−3.088−9.0222.8450.3978Not equivalent
G/D Central MemoryPOST9.514−6.00825.0360.7330Not equivalent
G/D Effector MemoryPRE8.152−4.55720.8600.4650Not equivalent
G/D Effector MemoryPOST18.699−9.37246.7700.7305Not equivalent
G/D TEMRAPRE3.633−2.6489.9130.7246Not equivalent
G/D TEMRAPOST3.463−10.73017.6570.5968Not equivalent
Table 2. Two One-Sided Tests (TOST) equivalence analysis for normalised bioenergetic parameters: capillary versus venous PBMC sampling. Mean paired difference (CAP − VEN) and 90% confidence interval (CI) for normalised bioenergetic parameters assessed at rest (PRE) and following maximal exercise (POST) in PBMCs isolated from paired capillary and venous blood samples. Equivalence margin δ was defined a priori for each parameter, as described in Table 1. Equivalence was declared when both bounds of the 90% CI of the mean difference fell within [−δ, +δ]. The TOST p-value represents the maximum of the two one-sided p-values; values below 0.05 indicate that the mean difference is significantly different from zero. A one-tailed t-distribution with df = 5 was used for CI construction. n = 6 donors. CI, confidence interval; MHI, mitochondrial health index; CV, coefficient of variation; ATP-MITO %, proportion of basal ATP supply derived from mitochondrial oxidative phosphorylation; ATP-GLYC %, proportion of basal ATP supply derived from glycolysis.
ParameterMean Difference (CAP − VEN)90% CI Lower90% CI UpperTOST p-ValueEquivalence
Coupling efficiencyPRE−0.0203−0.04930.00870.1569Not equivalent
Coupling efficiencyPOST−0.0110−0.05750.03550.1607Not equivalent
MAX OCR (fold basal)PRE−0.6783−1.0972−0.25940.2337Not equivalent
MAX OCR (fold basal)POST−0.4930−1.12150.13550.1572Not equivalent
Spare mito respiration (% max)PRE−0.0866−0.17810.00500.1235Not equivalent
Spare mito respiration (% max)POST−0.0523−0.0986−0.00590.0048Equivalent
Mitochondrial health index (MHI)PRE−0.2367−0.4515−0.02180.0033Equivalent
Mitochondrial health index (MHI)POST−0.3108−0.4583−0.16340.0014Equivalent
Compensatory glycolysis (fold basal)PRE−0.1377−0.35290.07740.0185Equivalent
Compensatory glycolysis (fold basal)POST−0.1390−0.36110.08300.0209Equivalent
Max glycolysis (fold basal)PRE−0.1975−0.45320.05820.0334Equivalent
Max glycolysis (fold basal)POST−0.2087−0.51910.10180.0617Not equivalent
Basal ATP-MITO %PRE0.0059−0.03820.05000.0021Equivalent
Basal ATP-MITO %POST0.0091−0.01850.0368<0.001Equivalent
Basal ATP-GLYC %PRE−0.0059−0.05000.03820.0017Equivalent
Basal ATP-GLYC %POST−0.0091−0.03680.0185<0.001Equivalent
Disclaimer/Publisher’s Note: The statements, opinions and data contained in all publications are solely those of the individual author(s) and contributor(s) and not of MDPI and/or the editor(s). MDPI and/or the editor(s) disclaim responsibility for any injury to people or property resulting from any ideas, methods, instructions or products referred to in the content.