Abstract
Digital transformation in higher education necessitates a central role for university faculty, yet there is a lack of comprehensive tools to measure their actual pedagogical use of technology. This study aims to refine the definition of a composite indicator to evaluate mobile technology adoption among social science university teachers. Using the results of the validated MOBILE-APP questionnaire, administered to a sample of N = 295 teachers from various social science degree programs, we employed multilevel structural equation modeling (SEM) to develop and implement a synthetic indicator for assessing mobile technology adoption levels among educators. The analysis of the considered factors (motivation, training, tools, and use) revealed differences in mobile technology adoption based on degree program, age, and previous experience. High motivation, training, use of institutional tools, and propensity for use promote the adoption of mobile technologies. Three levels of mobile technology adoption are identified and characterized. This synthetic indicator can be used both technically and socially to track the evolution of mobile technology adoption, enabling comparative analyses and longitudinal assessments that inform strategic decisions in training, infrastructure, and curriculum development. This research represents a step forward in the development of quantitative indicators and the assessment of research practices.
1. Introduction
The digital transformation in higher education (HE) has become a fundamental requirement. In this context, university faculty play a central role, as their level of adoption and pedagogical use of technologies directly affect the quality of teaching and learning. However, despite increasing institutional interest in promoting technology-driven educational innovation, significant gaps remain in tools for thoroughly measuring the use of this technology in teaching.
The development of mobile technologies has caused a significant paradigm shift, changing not just how we communicate and access information but also the way teaching and learning happen [1]. Features of this technological growth, like ease of use, ubiquity, and immediacy, encourage universities to adopt new methods, procedures, and resources to meet evolving needs. Changes are necessary in teaching approaches and perspectives because various factors, such as age, predisposition, and training, affect how technologies are implemented. Although mobile technology has proven valuable in higher education, its adoption among university teachers faces challenges due to factors like a lack of knowledge and prejudices. Additionally, significant events like the pandemic have greatly impacted academic environments and have driven substantial changes in the adoption of mobile technologies in the years following COVID-19 [2].
Many evaluations of faculty digital skills currently depend on self-reported surveys or frameworks. While these methods can provide tools for identifying specific aspects of competence, they face difficulties in generating aggregated quantitative indicators. The lack of comprehensive indicators restricts institutions’ ability to make evidence-based strategic decisions. This issue is particularly relevant to social science university teachers. Our interest in this area is motivated by our multidisciplinary academic and research background, with an emphasis on information and data literacy skills in the social sciences [3,4].
We aim to advance the definition of a series of indicators, summarized in a synthetic indicator, related to the levels of mobile technology adoption among a group of teachers in social science disciplines. The objective is not only to provide a diagnostic tool but also to provide guidance on professional development, teacher training, and institutional digital transformation policies. Furthermore, this proposal aims to contribute to the academic discussion on how to operationalize complex concepts in educational contexts by using multivariate analysis techniques and conceptual validity criteria. Both technical and academic relevance would favor the measurement and understanding of the levels of adoption of mobile technology by social science teachers. This would lead to more active and innovative teaching, aligned with the needs and expectations of today’s students. Furthermore, such a synthetic indicator should facilitate comparisons between departments, faculties, or even universities, leading to informed decision-making regarding training, infrastructure, or curriculum redesign. Similarly, linking research to a real-life context makes it more meaningful and valuable, with possible future projections.
This study addresses the following research questions:
- RQ1: What are the levels of mobile technology adoption among university teachers in social science disciplines, as measured by the validated Mobile-APP questionnaire?
- RQ2: How can a synthetic indicator be constructed to represent the overall level of mobile technology adoption effectively?
- RQ3: Based on the synthetic indicator, how can social science faculty be classified and characterized according to their level of mobile technology adoption?
2. Literature Review
This literature review addresses the main and most recent studies related to the adoption of mobile technologies (MT) by university teachers, particularly those of social sciences, as well as their measurement through the use and application of specific synthetic indicators.
2.1. The Adoption of Mobile Technologies
Mobile technologies are defined as a collection of portable electronic devices, infrastructures, and applications that allow wireless and real-time access, processing, storage, and transmission of information. They include, among others, smartphones, tablets, laptops, e-readers, and wearable devices, along with mobile networks (such as 4G, 5G, and Wi-Fi) and apps that facilitate communication, learning, work, and entertainment from any location. In education, mobile technologies are notable for their ability to promote ubiquitous, personalized, and collaborative learning [5,6,7]. Their adoption has significant implications for how people access, create, and share knowledge, as well as for transforming educational practices, organizational processes, and social interactions. They enable greater flexibility, immediacy, and personalization of experiences, while also posing challenges related to digital literacy, information security, and the fair distribution of technological resources.
As Henderson et al. [8] and Picciano [9] pointed out, in recent years, traditional media have begun to be replaced by new forms of interaction and learning. Ubiquity, immediacy, ease of use, and connectivity have changed the rules of the educational game at all levels of teaching, especially at the university level. The presence of mobile technologies (MT) among students must be considered, as it is a generational aspect inherent in their cultural and cognitive–behavioral characteristics. Given the increasing integration of mobile technologies into teaching and learning processes, teachers’ attitudes are crucial [10]. This process has partially shifted after the pandemic crisis, although the transformation has not been as effective as one might expect. During this period, limitations in teachers’ competencies and their lack of motivation became apparent, as well as the need for increased interaction between the teaching staff and the library [11].
Gourlay and Oliver [12] underscored how the advancement of technologies, tools, and media has significantly transformed the methodologies for educational instruction. Conventional instructional media have given way to novel forms. This new educational landscape has led to a paradigm shift characterized by the proliferation of ubiquitous, immediate, user-friendly, and interconnected technologies.
The adoption of MT among faculty is crucial, considering its alignment with the generational gap. As stated by Kumar and Bervell [13], the attitude of educators plays a key role, given the increasing integration of mobile technologies. This shift has been altered somewhat by the pandemic crisis; however, the success of this transition has not met all expectations. Certain factors, such as teachers’ insufficient adaptation to mobile technologies [14], the rapid development of mobile technologies [15], and inequality in technological access [16], still present limitations that must be considered.
The process of adopting MT in universities is part of a transformation that has been going on for almost two decades. One of the first studies in this direction was that conducted by Al-Emran and Shaalan [17]. This review described the adoption of mobile technologies in higher education. It also took into account the perception of their acceptance among teaching staff. Similarly, Kearney et al. [18] conducted an empirical study on teachers’ attitudes towards the adoption of mobile technologies, finding unexpected limitations among students. In a similar vein, Al-Emran et al. [19,20] compared teachers’ and students’ attitudes towards the adoption of mobile technologies. Significant differences were found between the two groups (age, education, and familiarity with mobile devices).
In their empirical study, Hao et al. [21] underlined teachers’ perception of the use of mobile learning at university, both in terms of student motivation and its relationship with learning efficacy. The research by Lai et al. [22] was based on flipped lessons. They underscored the relationship between motivation, a command of mobile technologies, and self-efficacy. In a similar vein, Lawrence and Tar [23], Martin et al. [24], and Scherer et al. [25] analyzed and identified the factors that influence teachers’ decisions to adopt mobile technologies in HE. They highlighted the possibilities of accessibility, ubiquity, and direct interaction. Dolawattha et al. [26] developed a model (the Impact Model, IM) to measure the perceptions of university teaching staff regarding the adoption of mobile technologies to access and use the Moodle platform. Of the factors analyzed (motivation, ease of use, attitude, interaction, and usefulness), usefulness was the most relevant. Almaiah and Mulhem [27] compared universities that adopt mobile technologies with those that do not adopt them in their teaching processes. Teachers who were less familiar with these technologies were the most reluctant. Hu et al. [28] concluded that the main factors involved in the intention to adopt mobile technologies were based on expectations, ease of use, satisfaction in use, habits, and motivation. Other studies have been based on the forced adaptation to online learning due to the health crisis, revealing the shortcomings and differences among teachers and students in the processes of implementing and adopting these technologies [29,30]. Refs. [31,32,33] continued in the same direction, showing the relevance of the adoption of mobile technologies in universities and teachers’ intention to use them.
Bernacki et al. [34] underscored how mobile learning, defined as the use of personal electronic devices for educational engagement across diverse contexts, represents a relatively recent academic focus. That is why they critically examine its theoretical foundations, technological affordances, and empirical applications. Criollo et al. [35], in response to the need for more dynamic and student-centered learning models, reviewed the role of mobile technologies in transforming education. The study presents findings from a literature review across three scientific repositories, highlighting both the benefits and the challenges of implementing mobile learning. Addressing these issues is crucial to fully realizing the potential of mobile technologies in education. Rakhmatov [36] outlines the integration of mobile technologies in HE, outlining their advantages, limitations, and current applications. While various mobile services are proposed for educational use, their implementation remains limited and primarily focused on content delivery rather than as cognitive learning tools. Mobile devices are most commonly used for accessing materials, storing information, and managing schedules. Goundar and Kumar [37] presented a systematic mapping study on the use of mobile learning applications in HE, based on the analysis of publications from six databases. Findings reveal a growing academic interest and a predominant focus on solution-oriented studies, providing a foundation for guiding future research in mobile learning. Asadullah et al. [38] examined the evolution and impact of mobile learning in higher education from 2002 to 2021, analyzing 981 studies. The findings reveal significant growth, diverse applications across disciplines, and the use of innovative strategies such as gamified platforms, augmented reality, and location-based learning.
Recently, the impact of educational technology on learning outcomes varies depending on the type of technology used [39], highlighting the importance of faculty training and support in maximizing the potential benefits of mobile technologies. Key areas where digital and mobile technologies have driven educational reform and transformation have been identified through systematic literature reviews and bibliometric analyses, which highlight their global impact on teaching and learning practices [40,41,42] and take into account both advantages and limitations [43].
2.2. Synthetic Indicators
A synthetic indicator is a composite measure that combines multiple individual variables or indicators into a single numerical value, providing a simplified and comprehensive representation of a complex phenomenon. It is commonly used to compare, rank, or assess entities across multiple dimensions, while preserving the essential information from the original data. From a methodological perspective, recent developments in the construction of composite indicators have been increasingly popular across research fields and global institutions [44]. Despite their widespread use, composite indicators face criticism, especially regarding weighting and aggregation methods—two key steps examined in depth here. The study also highlights the often-overlooked but essential role of robustness analysis in validating these indicators. Overall, it offers a concise overview of current approaches and advancements, serving as a helpful guide for both researchers and practitioners working with composite indices.
Kuc-Czarnecka et al. [3] examined the arguments for and against the use of composite indicators, highlighting their inherently normative nature as tools designed to “tell a story” and emphasize specific phenomena. They question whether these indicators can be created more neutrally and flexibly, which reflects multiple perspectives. Through practical applications, such as measures of convergence in cohesion policy and the World Bank’s Doing Business Index, the study explores how composite indicators can incorporate diverse stakeholder viewpoints.
Alqararah [4] assessed the robustness of the Global Innovation Index by comparing it with alternative data-driven methodologies and examined the stability of rankings across different aggregation and weighting approaches to reduce subjectivity in the construction of composite indicators.
From an applied perspective, we observe the use of composite indicator construction across multiple fields. For example, the SDG Index is a composite index that measures countries’ performance on each of the 17 Sustainable Development Goals (SDGs), combining multiple specific indicators into a single global score to facilitate cross-country comparisons [45]. Martí and Puertas [46] evaluated sustainability through a synthetic index that improves the Sustainable Society Index by analyzing environmental, economic, and social dimensions in 154 countries. Tomaselli et al. [47] developed a synthetic indicator to measure well-being in Italy.
In education, noteworthy contributions include the study by Pinto et al. [48] who developed a synthetic performance indicator to examine the information behavior of a group of future professionals in the social sciences about information communication–dissemination competence, and the work of Grájeda et al. [49] who assess the perceived impact of university students’ use of artificial intelligence tools and propose the Synthetic Indicator of AI Tools Usage (SIUAIT). They conclude that the integration of these tools into higher education is crucial and should be approached with a critical perspective. Finally, Çağlayan et al. [50] investigated the factors shaping stakeholder perceptions of Higher Education Institution (HEI) rankings. Key predictors—such as performance expectancy, price value, habit, hedonic motivation, information quality, trust, and awareness—significantly affect both behavioral intentions and actual use of HEI rankings. The study offers a quantitative analysis of how different stakeholders perceive and engage with ranking systems.
In mobile education, a field of rapid technological changes and a consensual and cross-cutting educational political aim, synthetic indicators provide a powerful but simple tool for diagnostics and further improvement of their acceptance. This paper presents both a composite indicator that contributes to the state of the art and future research in the field, as well as its integration in Spanish universities, where there is a notable lack of studies, thereby contributing to a comparative map of the international situation.
3. Materials and Methods
3.1. The Instrument
The MOBILE-APP questionnaire was used, since it is linked with the applications of mobile technology in university teaching [51]. It was designed to measure teachers’ perceptions of the importance of using mobile technologies in the teaching and learning process. The questionnaire is structured around five dimensions: information literate university; information literate person; ACRL’s Framework; use of mobile technologies in teaching; and ICT and students. This work focuses exclusively on the analysis of the fourth aspect of MOBILE-APP, related to the use of mobile technologies in the teaching process, using 16 items (in a 1–5 Likert scale) “It included items about whether they consider that such technologies can make the job of teaching easier, adapting to teaching innovations, students’ motivation and the integration of facilitating tools. At the same time, they were asked about how they update their knowledge of mobile technologies, the type of mobile tools they use in their teaching, and what tasks they use them for” ([51], p. 212).
Items clustered around the following categories: MOTIV—Motivation to use mobile technologies in teaching; TRAIN—Sources of Training and Continuous Learning (virtual courses, on-site training, teaching innovation projects or self-learning); TOOLS—Tools for Enhancing Engagement in Mobile-Based Instruction (virtual classroom facilities (chat, forums, etc.), gamification platforms (Kahoot, Socrative, etc.) or online training questionnaires); and USE-Impact of the use of virtual campus/classrooms, online platforms and resources on teaching.
3.2. The Sample
A sample of teachers was selected from four Spanish public universities—Granada, Jaume I of Castellón, Murcia, and Complutense of Madrid—and eight degree programs: Audiovisual Communication, Information Science, Business Management and Administration, Economics, Education, Journalism, Pedagogy, and Tourism. All of them relate to social science. Data collection was conducted throughout the second semester of 2024.
The current study employed a stratified sampling process with proportional allocation, first considering degree programs and then the university. The study population comprised 3985 teachers teaching in the relevant degree programs. A database was created with basic information on 350 teachers randomly selected from various universities and their respective degrees. These teachers were then emailed with information about the research objectives and encouraged to participate. After confirming their participation, they received a URL and QR code to access the questionnaire. A total of N = 295 questionnaires were collected; the majority were completed online (62%), while the remaining copies were collected in print by technical support staff. The response rate was 84.3%.
Altogether, 49.2% of the teachers in the sample were female, and the average age was 45.37 years, with a range between 24 and 65 years. Table 1 shows the main socio-demographic characteristics for all respondents.

Table 1.
Socio-demographic characteristics of the sample. Teachers’ background.
The data show that 67.1% (21.3 + 45.8) of participants have more than 10 years’ teaching experience, and 17% (11.5 + 5.5) already had previous experience in blended or online teaching.
3.3. Procedures
We applied the following procedures to address the research questions:
1. To respond to RQ1, a descriptive and inferential analysis is conducted on the socio-demographic variables: University, degree course, teachers’ background, age, and sex, to examine the levels reported by teachers from the questionnaire. Since the data do not meet the requirements of statistical normality, non-parametric analysis methods are employed [52].
2. To address RQ2, the synthetic indicator (MobAPP-SI) was developed using Structural Equation Modeling (SEM) [53]. SEM expands on traditional linear modeling by enabling the simultaneous estimation of multiple relationships among observed and unobserved (latent) variables. It includes techniques such as path analysis and multivariate regression, and is particularly effective for constructing empirical indicators through its ability to integrate latent constructs within the model structure. Mazziotta et al. [54] SEM has been used for decades to create synthetic indicators across nearly every scientific discipline, for benchmarking research activity [55], communication competence of Social Science students [51], or well-being [47].
A SEM model has two parts: the measurement model, which shows how each item contributes to its respective construct or latent dimension, and the structural model, which allows us to see how the latent dimensions contribute to the overall indicator. To empirically determine the contribution of each construct to the indicator, we employed structural equation modeling in an outcome-oriented manner [56]. Theoretically, we considered a mixed multilevel model with reflective indicators at the first level and formative indicators at the second level [57,58].
Specifically, in the reflective first-order measurement model, each first-order latent variable or construct (ξj) is measured through a set of observed indicators (xj1, xj2, …, xjp), assuming a reflective structure. The relationship is given by
where xji, denotes the observed indicator, λji, the factor loading, ξj, the first-order latent variable, and δji, the measurement error.
Regarding the formative second-order construct, we assumed that all first-order latent variables had a positive impact on the levels of adoption of mobile technologies for teaching. This methodological approach provides a synthetic indicator without resorting to subjective weighting of the composite indicators [59,60].
The second-order latent variable (MobAPP-SI, η) is specified as a formative construct composed of multiple first-order latent variables:
where η represents the second-order latent construct (synthetic index MobAPP-SI), ξk the first-order latent variables, γk, the formative weights with k = 1, …, 4 and ζ, the disturbance term.
We chose SEM over other data-driven methods, such as multiple regression or Principal Component Analysis (PCA), because it allows us to model performance as a latent construct, inferred from several observed variables. SEM not only captures these theoretical relationships but also assesses measurement validity through its two-step approach, evaluating both the measurement and structural models. Unlike PCA, which is purely data-driven, SEM incorporates theoretical foundations, enabling more meaningful weighting of indicators. Additionally, SEM provides fit indices (e.g., CFI, RMSEA) to assess how well the model reflects the data, offering a more robust and conceptually aligned approach for constructing a synthetic performance indicator [61].
3. Regarding RQ3, a cluster analysis was performed on the MobAPP-SI scores to identify and describe homogeneous groups of teachers based on their levels of mobile technology adoption [62]. To determine the most suitable number of groups, we used an elbow plot that examined intra-cluster variance relative to the number of clusters [63]. After forming the clusters, we analyzed and outlined their main characteristics based on responses to the questionnaire.
4. Results
4.1. Adoption of Mobile Technologies Among University Teachers
The Kruskal–Wallis test indicated significant differences (p < 0.05) among universities and degree programs concerning the use of TRAIN and TOOLS. It also showed that having experience in online or blended teaching affects perceived MOTIV, TRAIN, and USE, leading to statistically significant differences. Additionally, age group was found to influence the use of mobile technologies, with a noted decline in usage as age increases. The Mann–Whitney U test showed that there are no sex differences in the adoption of Mobile technologies (p > 0.05).
An analysis by degrees shows a noticeable diversity in the results. While the overall scores for the MOTIV to use mobile technologies in teaching and the TOOLS available both reach nearly 4 points (on a scale of 1 to 5), the importance of keeping up to date through TRAIN scores 3.47, and the USE of mobile technologies barely exceeds 3 points (Table 2).
Table 2.
Mean results by degree program.
We found clear differences between disciplines. While the Economics and Business Administration degrees rank first in MOTIV, they rank at the bottom in USE. Education teachers are second in terms of TOOLS of mobile technologies in teaching, but they are last in TRAIN or USE. We can conclude that there is no common pattern of behavior in the categories analyzed, which highlights the need for a measuring tool like the synthetic indicator we propose here to reflect the diversity and heterogeneity in the sample.
4.2. Design and Construction of the Synthetic Indicator
The design and construction of the multidimensional synthetic indicator (MobAPP-SI) allow us to estimate social sciences teachers’ overall adoption of mobile technologies in teaching.
The model was fitted using the LISREL software [64]. As the observed variables are Likert-scale items, the polychoric correlation matrix and generalized least squares (GLS) were considered. To avoid possible model specification errors, we followed the recommendations of Li and Wang [57] and Shi and Maydeu-Olivares [65]. In particular, to evaluate the measurement model (Table 3), we considered the following indicators:
- Individual item reliability: measured by the factor loading of the items and the item-construct correlation. The outer loadings are significant, and their reliability, R2, is above 0.6, except for the item Gamification platforms (Kahoot, Socrative, etc.), whose individual reliability score of at least 0.5 would be acceptable since the rest of the items of the same construct have higher scores [66]. The non-significant items (8. I am self-taught, and 16. The future of teaching cannot be conceived separately from the setting) were removed from the study.
- Composite reliability: CR values exceed the threshold of 0.6. In addition, the Cronbach’s alpha scores exceeded 0.6 (see Table 1), indicating that the constructs have adequate reliability [66].
- Convergent and Discriminant validities: these are measured with their average variance extracted (AVE), which represents the explanatory power of the latent variables concerning the measured variables. In line with Machleit [67] and Zheng et al. [68], the threshold to establish convergent validity is 0.5.
Table 3.
Statistical details regarding the measurement side of the MobAPP-SI model (coefficients and goodness of fit, * p < 0.1, ** p < 0.05).
Table 3.
Statistical details regarding the measurement side of the MobAPP-SI model (coefficients and goodness of fit, * p < 0.1, ** p < 0.05).
| Constructs/Items | Factor Loading/ Standardized Factor Loading | Reliability | Composite Reliability (>0.7) | AVE (>0.5) | Cronbach’s Alpha (α > 0.7) |
|---|---|---|---|---|---|
| Motivation | |||||
| 1. Because they can help make my teaching easier | 0.71/0.74 ** | 0.66 | 0.869 | 0.807 | 0.860 |
| 2. As a way to adapt myself to innovations in teaching | 0.75/0.70 * | 0.60 | |||
| 3. As a way to motivate students | 0.91/0.90 ** | 0.80 | |||
| 4. With the aim of integrating facilitating tools | 0.91/0.89 ** | 0.78 | |||
| Training | |||||
| 5. Virtual courses | 0.80/0.76 * | 0.67 | 0.727 | 0.787 | 0.710 |
| 6. On-site training | 0.81/0.78 ** | 0.63 | |||
| 7. Participating in teaching innovation projects | 0.75/0.73 ** | 0.62 | |||
| Use | |||||
| 10. I use Gamification platforms (Kahoot, Socrative, etc.) | 0.88/0.87 * | 0.57 | 0.788 | 0.847 | 0.708 |
| 11. I use Online training questionnaires | 0.91/0.88 ** | 0.76 | |||
| 12. I use the mobile environment to carry out my teaching duties (preparing classes, correcting assignments, reviewing tasks, etc.) | 0.75/0.76 ** | 0.68 | |||
| 13. I use an app on my mobile to interact with my students so as to be able to provide them with academic information that may be of use to them | 0.68/0.66 * | 0.56 | |||
| Tools | |||||
| 9. I use Capabilities of the Virtual Classroom (chat, forums, etc.) | 0.78/0.74 ** | 0.62 | 0.704 | 0.563 | 0.748 |
| 14. The virtual campus/classroom is a basic tool in my teaching | 0.85/0.76 ** | 0.70 | |||
| 15. The incorporation of online platforms and resources has transformed my teaching practice | 0.82/0.81 * | 0.73 |
Results show an acceptable fit, given that both the GFI and the normed fit index (NFI) exceed 0.90, and the root mean square error of approximation (RMSEA) is below 0.07 [58,69].
The interrelationships among the items of interest and their particular contribution to the indicator proposed provide a number of clues about the process of adoption of mobile technologies. As can be seen, the items with the most weight in the model are in Motivation, item 3. As a way to motivate students, and 4. To integrate facilitating tools in Training, item 6. On-site training, in Tools, item 10. Gamification platforms (Kahoot, Socrative, etc.), and 11. Online training questionnaires; and in Use, item 14. The virtual campus/classroom.
The structural model achieves an acceptable predictive relevance for the endogenous construct (MobAPP-SI), since the reliability values are higher than 0.5. The results of the structural model show significant and positive relationships between the first-order constructs and SI. Use has the strongest effect on overall adoption of mobile technology, followed by Training and Motivation (Table 4 and Figure 1).
Table 4.
Standardized structural model for the synthetic indicator model (* p < 0.1, ** p < 0.05).
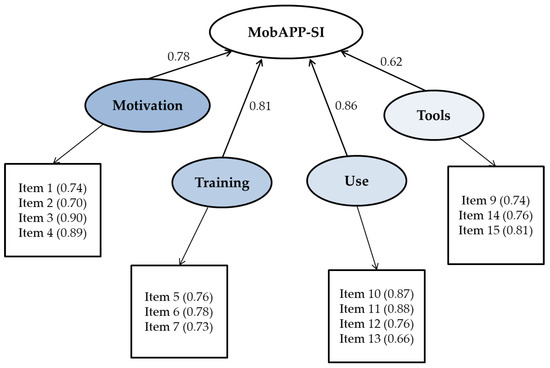
Figure 1.
Standardized MobAPP-SI model for the adoption of mobile technologies (factor loadings in parentheses).
4.3. Ranking by Disciplines
The MobAPP-SI scores provide a weighted diagnostic assessment of the analyzed academic degrees, serving as a useful tool for benchmarking and educational planning. To facilitate comparisons, MobAPP-SI values are standardized (Table 5, Figure 2).
Table 5.
Contribution to the MobAPP-SI of each first-order construct within each degree.
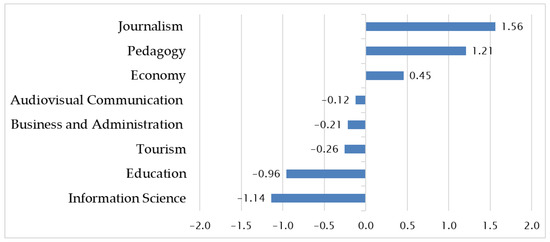
Figure 2.
Adoption of Mobile Technologies Across Disciplines: Ranking Based on MobAPP-SI.
The values of the MobAPP-SI indicator show the significance of the academic discipline. The interpretation of these results requires contextual information that is not immediately available in the row data or the results, which are empirical, not theory-based. For example, in Spain, Information Science teachers have been pioneers in adopting teaching platforms and, in general, mobile technology, so they are not so motivated and do not think they require additional training, which explains the low score in MobAPP-SI.
4.4. Characterizing the Levels of University Teachers
After implementing the SI, we evaluate the overall adoption level of mobile technologies. Using the SI scores, a cluster analysis identifies three groups of teachers. To understand the main features of these groups, we analyze the original responses provided in the MOBILE-APP questionnaire.
The three groups and their profiles are described below (Figure 3):
- −
- ADVANCED adoption: This group includes teachers with previous experience in blended and online teaching. They report high levels in MOTIV (average 4.39) and TOOLS (4.44), showing moderate levels in USE (3.8) and TRAIN (3.91). We can consider that this group, comprising 20% (n = 59) of the sample with a mean age of 44 years, is willing to adopt and use mobile technologies, as they see them as tools that can facilitate teaching and can also help to motivate students. This group demonstrates readiness to adopt mobile technologies. They are considered knowledgeable adopters.
- −
- MODERATE adoption: This group comprises 67% (n = 198) of the faculty sample (mean age 47). They present reasonable levels in all four categories, with average results in the interval 3–4 points. This group shows considerable MOTIV (3.94) and TOOLS (3.92) for teaching, but still needs to make an effort to incorporate them. This group presents a medium level of adoption of mobile technologies. They are considered prospective adopters.
- −
- LOW adoption: This last group includes the 13% (n = 38, mean age 55) of faculty members who are reluctant to use mobile technologies, and therefore is the smallest one. They declare little MOTIV (1.56), and some need for TRAIN (2.67), low USE (2.58), and TOOLS (2.97). We can consider that this group displays an improbable level of adoption of mobile technologies. They are deemed reluctant adopters.

Figure 3.
Mobile-APP responses by level of mobile technology adoption (The black line corresponds to the fitted trend line).
Figure 3.
Mobile-APP responses by level of mobile technology adoption (The black line corresponds to the fitted trend line).

5. Discussion
Motivation and the effective use of institutional tools are two key factors in the adoption of mobile technologies for teaching social sciences. Relevant studies, such as those by Kumar and Mohite [70] and Lawrence and Tar [23], highlighted motivation as a critical factor influencing faculty members’ decisions to adopt mobile technologies. Additionally, Sophonhiranrak [71] identified critical components for instructors, including readiness, learning management, and support systems. Supporting the findings of Hao et al. [21] and Aznar-Diaz et al. [72], our research reveals significant similarities in the varying attitudes of faculty members towards using mobile technologies in higher education. These studies collectively contribute to our understanding of the factors that drive motivation and the importance of training in the adoption of mobile technologies. The generation gap in both motivation and the use of mobile technologies is also highlighted [21,73].
Martin et al. [24] provided data that exhibited some convergences with our results. They described the attitudes, limitations, and predispositions of university faculty towards online teaching and the use of mobiles. This directly involves the perception of their skills, aptitudes, and attitudes. As their study was conducted before the COVID-19 health crisis, it does not take into account an essential element that is a key aspect of this study, namely, the forced adaptation to virtual teaching and the inevitable integration of technology. The work by Scherer et al. [25] not only analyzed the incorporation of technology by university faculty during the pandemic but also concluded that a greater level of involvement and training is necessary, which aligns with our findings.
The MobAPP-SI indicator provides a general overview of the levels of mobile technologies adoption among the Social Sciences faculty analyzed. As expected, higher levels of motivation, training, use, and tools favor the adoption of mobile technologies. We find some similarities with Yukhymenko-Lescroart et al. [74], who distinguished five faculty groups for mobile technology adoption based on their latent profiles (Technology Enthusiasts, Knowledgeable Adopters, Prospective Adopters, Knowledgeable Sceptics, and Non-Adopters). In our research, we identify three clusters among the faculty members: Advanced—Knowledgeable adopters, Medium—Prospective adopters, and Low—Reluctant adopters, which illustrates the diversity present among the faculty. The relationships between the items of interest and their specific contributions to the proposed indicator offer several insights into the process of adopting mobile technologies. The results reveal that motivation, face-to-face training, gamification platforms, online questionnaires for training, and the virtual campus platform play a fundamental role in enhancing teachers’ adoption of mobile technologies in their educational practice.
In their study, Gómez-García et al. [75] developed an instrument to assess five key dimensions related to artificial intelligence (AI): the effectiveness of AI tools, the effectiveness of ChatGPT, students’ proficiency in using AI tools, teachers’ proficiency in AI, and students’ advanced skills in AI. Their findings emphasized the importance of integrating AI tools into higher education, advocating for a critical approach to this integration. We found similarities with our research, which also focuses on AI. Furthermore, our study aligns with the work of Grájeda et al. [49], which highlights the positive impact of technology on comprehension, creativity, and productivity. However, both of these studies primarily examine the interactions between teachers and students regarding AI usage. As we move forward, new perspectives are emerging for incorporating these technologies into teaching and learning processes, signaling a significant shift in educational practices.
In line with Kuc-Czarnecka et al. [3], our results suggest that by broadening the framing of their construction, composite indicators can serve as shared tools for evidence-based analysis, while allowing for varied interpretations of relevance and priority.
Al-Emran et al. [20] developed an integrative model using the SEM methodology, which takes into account the context of mobile learning. However, while they obtained interesting results in terms of the adoption of mobile technologies and their relationship with the ease and utility of their use, the study was conducted with a sample of postgraduate students, which complements our results but does not provide a basis for comparative assessment.
It is important to note that composite indicator methods usually assume that the assigned weights accurately represent the broader population being evaluated. Therefore, this assumption should be critically examined when interpreting the results, as the representativeness of the weights can significantly affect the interpretation, validity, and generalizability of the findings [4,44]. However, our methodology provides empirically derived weights through structural equation modeling (SEM), which helps to address the issue of weight assignment and enhances the representativeness and robustness of the composite indicator.
This study has several limitations that should be acknowledged. First, the sample is limited to social sciences faculty in Spain, which may restrict the generalizability of the findings to other disciplines or international contexts. Second, the use of self-reported data introduces the possibility of response bias. Third, the cross-sectional design limits the ability to draw causal inferences about the relationships examined. Regarding the synthetic performance indicator developed through SEM, further research is needed to test its scalability and validity across different academic fields and educational systems. Future studies could expand the sample and apply longitudinal designs to strengthen the robustness and applicability of the results.
6. Conclusions
The perceptions expressed by teachers regarding the adoption of mobile technologies showed considerable variation across different degrees and universities in the Training and Tools categories. It was observed that age influences the intention to use mobile technologies, with usage decreasing as age increases. Additionally, prior teaching experience in online or blended learning affects Motivation, Training, and Tools.
Digital transformation in higher education requires robust instruments to understand, monitor, and guide the integration of mobile technologies into teaching practice. In this regard, the synthetic indicator developed in this study directly addresses the gap highlighted in the introduction: the absence of integrative tools capable of quantitatively and comparatively reflecting the levels of technology adoption among social science faculty.
The findings demonstrate that factors such as motivation, continuous training, the use of institutional tools, and prior teaching experience are decisive in determining the degree of mobile technology adoption. Equally important is the recognition of three faculty profiles—advanced adopters, moderate adopters, and reluctant adopters—which provides a valuable framework for designing targeted institutional strategies. These profiles make visible the heterogeneity of adoption levels, suggesting that “one-size-fits-all” training policies may be ineffective. Instead, differentiated approaches are needed to encourage reluctant adopters, consolidate moderate adopters, and further empower advanced adopters.
Thus, the indicator is not only a diagnostic tool but also a strategic instrument to promote innovation in teaching practices, design professional development programs tailored to actual needs, and support evidence-based decision-making in universities. In doing so, it helps bridge the gap between institutional interest in digital innovation and the practical realities of faculty, ultimately fostering a more inclusive, equitable, and sustainable educational transformation.
Furthermore, this research contributes methodologically to the broader academic debate on how to operationalize complex constructs in educational contexts through synthetic indicators. By applying structural equation modeling, the study provides an empirically validated and conceptually grounded tool that can be replicated, compared, and expanded.
Future research could expand the study to include how artificial intelligence is integrated into teaching through mobile devices and explore alternative predictive methods for motivation, assessment, and diagnosis. It is important to foster a positive attitude among faculty toward adopting these technologies, as this process is irreversible and constantly evolving with new technologies surpassing earlier ones. Similarly, universities should emphasize training and ongoing professional development for faculty using engaging multimedia resources like podcasts and microlearning modules.
Author Contributions
Conceptualization, M.P. and D.C.M.; methodology, R.F.-P.; software, R.F.-P.; validation, R.F.-P.; formal analysis, R.F.-P.; investigation, R.F.-P., M.P. and D.C.M.; resources, R.F.-P., M.P. and D.C.M.; data curation, R.F.-P.; writing—original draft preparation, R.F.-P., M.P. and D.C.M.; writing—review and editing, R.F.-P., M.P. and D.C.M.; visualization, R.F.-P.; supervision, M.P.; project administration, M.P.; funding acquisition, M.P. All authors have read and agreed to the published version of the manuscript.
Funding
Project funded by PID2021-128808OB-I00, MICIU/AEI/10.13039/501100011033/ and by the European Regional Development Fund (ERDF/EU).
Acknowledgments
The authors are deeply grateful to all the teaching staff, who made this study possible, and to the referees for their constructive and insightful feedback, which has substantially enhanced the quality of our work.
Conflicts of Interest
The authors declare no conflict of interest.
References
- Bozkurt, A. Generative artificial intelligence (AI) powered conversational educational agents: The inevitable paradigm shift. Asian J. Distance Educ. 2023, 18, 198–204. [Google Scholar]
- Curelaru, M.; Curelaru, V.; Cristea, M. Students’ perceptions of online learning during COVID-19 pandemic: A qualitative approach. Sustainability 2022, 14, 8138. [Google Scholar] [CrossRef]
- Kuc-Czarnecka, M.; Lo Piano, S.; Saltelli, A. Quantitative storytelling in the making of a composite indicator. Soc. Indic. Res. 2020, 149, 775–802. [Google Scholar] [CrossRef]
- Alqararah, K. Assessing the robustness of composite indicators: The case of the Global Innovation Index. J. Innov. Entrep. 2023, 12, 61. [Google Scholar] [CrossRef]
- Zafrullah, Z.; Ramadhani, A.M. The use of mobile learning in schools as a learning media: Bibliometric analysis. Indones. J. Educ. Res. Technol. 2024, 4, 187–202. [Google Scholar]
- Fu, J.; Yan, S.; Chen, X. A Mobile Technology-Based Framework for Digital Libraries: Bridging Accessibility and Personalized Learning. Int. J. Interact. Mob. Technol. 2025, 19, 193. [Google Scholar] [CrossRef]
- Kitcharoen, P.; Howimanporn, S.; Chookaew, S. Enhancing Teachers’ AI Competencies through Artificial Intelligence of Things Professional Development Training. Int. J. Interact. Mob. Technol. 2024, 18, 4. [Google Scholar] [CrossRef]
- Henderson, M.; Selwyn, N.; Aston, R. What works and why? Student perceptions of ‘useful’ digital technology in university teaching and learning. Stud. High. Educ. 2017, 42, 1567–1579. [Google Scholar] [CrossRef]
- Picciano, A.G. Online Education: Foundations, Planning, and Pedagogy; Routledge: Abingdon, UK, 2018. [Google Scholar]
- Liu, C.; Hwang, G.J.; Tu, Y.F.; Yin, Y.; Wang, Y. Research advancement and foci of mobile technology-supported music education: A systematic review and social network analysis on 2008–2019 academic publications. Interact. Learn. Environ. 2023, 31, 4535–4554. [Google Scholar] [CrossRef]
- Pinto, M.; Caballero Mariscal, D.; Segura, A. Experiences of information literacy and mobile technologies amongst undergraduates in times of COVID. A qualitative approach. Aslib J. Inf. Manag. 2022, 74, 181–201. [Google Scholar] [CrossRef]
- Gourlay, L.; Oliver, M. Student Engagement in the Digital University: Sociomaterial Assemblages; Routledge: Abingdon, UK, 2018. [Google Scholar]
- Kumar, J.A.; Bervell, B. Google Classroom for mobile learning in higher education: Modelling the initial perceptions of students. Educ. Inf. Technol. 2019, 24, 1793–1817. [Google Scholar] [CrossRef]
- Thaanyane, M.; Jita, T. The use of mobile technology in higher education: Implications for students and instructors. Edelweiss Appl. Sci. Technol. 2024, 8, 1236–1243. [Google Scholar] [CrossRef]
- Sha, L.; Wang, X.; Liu, T. Understanding college students’ acceptance of machine translation in foreign language learning: An integrated model of UTAUT and task-technology fit. Humanit. Soc. Sci. Commun. 2025, 12, 561. [Google Scholar] [CrossRef]
- Pham Thi, T.D.; Pham, V.K.; Duong, N.T. Understanding M-learning app adoption: An integrated model for college students in Vietnam. Interact. Learn. Environ. 2025, 1–23. [Google Scholar] [CrossRef]
- Al-Emran, M.; Shaalan, K. Learners and educators attitudes towards mobile learning in higher education: State of the art. In Proceedings of the International Conference on Advances in Computing, Communications and Informatics (ICACCI), Kochi, India, 2–4 September 2015; pp. 907–913. [Google Scholar] [CrossRef]
- Kearney, M.; Burden, K.; Rai, T. Investigating teachers’ adoption of signature mobile pedagogies. Comput. Educ. 2015, 80, 48–57. [Google Scholar] [CrossRef]
- Al-Emran, M.; Elsherif, H.M.; Shaalan, K. Investigating attitudes towards the use of mobile learning in higher education. Comput. Hum. Behav. 2016, 56, 93–102. [Google Scholar] [CrossRef]
- Al-Emran, M.; Mezhuyev, V.; Kamaludin, A. Towards a conceptual model for examining the impact of knowledge management factors on mobile learning acceptance. Technol. Soc. 2020, 61, 101247. [Google Scholar] [CrossRef]
- Hao, S.; Dennen, V.P.; Mei, L. Influential factors for mobile learning acceptance among Chinese users. Educ. Technol. Res. Dev. 2017, 65, 101–123. [Google Scholar] [CrossRef]
- Lai, Y.C.; Ng, M.; Yang, R. Teaching ICT with the flipped classroom approach in higher education settings. J. Res. Sci. Math. Technol. Educ. 2018, 1, 29–45. [Google Scholar] [CrossRef]
- Lawrence, J.E.; Tar, U.A. Factors that influence teachers’ adoption and integration of ICT in teaching/learning process. Educ. Media Int. 2018, 55, 79–105. [Google Scholar] [CrossRef]
- Martin, F.; Budhrani, K.; Wang, C. Examining faculty perception of their readiness to teach online. Online Learn. J. 2019, 23, 97–119. [Google Scholar] [CrossRef]
- Scherer, R.; Howard, S.K.; Tondeur, J.; Siddiq, F. Profiling teachers’ readiness for online teaching and learning in higher education: Who’s ready? Comput. Hum. Behav. 2021, 118, 106675. [Google Scholar] [CrossRef]
- Dolawattha, D.D.M.; Pramadasa, H.K.; Jayaweera, P.M. The Impact Model: Teachers’ Mobile Learning Adoption in Higher Education. Int. J. Educ. Dev. Using Inf. Commun. Technol. 2019, 15, 71–88. [Google Scholar] [CrossRef]
- Almaiah, M.A.; Al Mulhem, A. Analysis of the essential factors affecting of intention to use of mobile learning applications: A comparison between universities adopters and non-adopters. Educ. Inf. Technol. 2019, 24, 1433–1468. [Google Scholar] [CrossRef]
- Hu, S.; Laxman, K.; Lee, K. Exploring factors affecting academics’ adoption of emerging mobile technologies-an extended UTAUT perspective. Educ. Inf. Technol. 2020, 25, 4615–4635. [Google Scholar] [CrossRef]
- Zaidi, S.F.H.; Osmanaj, V.; Ali, O.; Zaidi, S.A.H. Adoption of mobile technology for mobile learning by university students during COVID-19. Int. J. Inf. Learn. Technol. 2021, 38, 329–343. [Google Scholar] [CrossRef]
- Raza, S.A.; Qazi, W.; Khan, K.A.; Salam, J. Social Isolation and Acceptance of the Learning Management System (LMS) in the time of COVID-19 Pandemic: An Expansion of the UTAUT Model. J. Educ. Comput. Res. 2021, 59, 183–208. [Google Scholar] [CrossRef]
- Nikolopoulou, K.; Gialamas, V.; Lavidas, K.; Komis, V. Teachers’ readiness to adopt mobile learning in classrooms: A study in Greece. Technol. Knowl. Learn. 2021, 26, 53–77. [Google Scholar] [CrossRef]
- Dahri, N.A.; Al-Rahmi, W.M.; Almogren, A.S.; Yahaya, N.; Vighio, M.S.; Al-maatuok, Q.; Al-Rahmi, A.M.; Al-Adwan, A.S. Acceptance of mobile learning technology by teachers: Influencing mobile self-efficacy and 21st-century skills-based training. Sustainability 2023, 15, 8514. [Google Scholar] [CrossRef]
- Jurayev, T.N. The use of mobile learning applications in higher education institutes. Adv. Mob. Learn. Educ. Res. 2023, 3, 610–620. [Google Scholar] [CrossRef]
- Bernacki, M.L.; Greene, J.A.; Crompton, H. Mobile technology, learning, and achievement: Advances in understanding and measuring the role of mobile technology in education. Contemp. Educ. Psychol. 2020, 60, 101827. [Google Scholar] [CrossRef]
- Criollo-C, S.; Guerrero-Arias, A.; Jaramillo-Alcázar, Á.; Luján-Mora, S. Mobile learning technologies for education: Benefits and pending issues. Appl. Sci. 2021, 11, 4111. [Google Scholar] [CrossRef]
- Rakhmatov, D. Mobile technologies in the higher education system. Ment. Enlight. Sci.-Methodol. J. 2021, 3, 183–198. [Google Scholar]
- Goundar, M.S.; Kumar, B.A. The use of mobile learning applications in higher education institutes. Educ. Inf. Technol. 2022, 27, 1213–1236. [Google Scholar] [CrossRef]
- Asadullah, M.; Yeasmin, M.; Alam, A.F.; Alsolami, A.; Ahmad, N.; Atoum, I. Towards a sustainable future: A systematic review of Mobile Learning and studies in Higher Education. Sustainability 2023, 15, 12847. [Google Scholar] [CrossRef]
- Akintayo, O.T.; Eden, C.A.; Ayeni, O.O.; Onyebuchi, N.C. Evaluating the impact of educational technology on learning outcomes in the higher education sector: A systematic review. Int. J. Manag. Entrep. Res. 2024, 6, 1395–1422. [Google Scholar] [CrossRef]
- Tlili, A.; Padilla-Zea, N.; Garzón, J.; Wang, Y.; Kinshuk, K.; Burgos, D. The changing landscape of mobile learning pedagogy: A systematic literature review. Interact. Learn. Environ. 2023, 31, 6462–6479. [Google Scholar]
- Wang, C.; Chen, X.; Yu, T.; Liu, Y.; Jing, Y. Education reform and change driven by digital technology: A bibliometric study from a global perspective. Humanit. Soc. Sci. Commun. 2024, 11, 256. [Google Scholar] [CrossRef]
- Valencia-Arias, A.; Cardona-Acevedo, S.; Gómez-Molina, S.; Vélez Holguín, R.M.; Valencia, J. Adoption of mobile learning in the university context: Systematic literature review. PLoS ONE 2024, 19, e0304116. [Google Scholar] [CrossRef]
- Năstase, L.L. Sustainable Education and University Students’ Well-Being in the Digital Age: A Mixed-Methods Study on Problematic Smartphone Use. Sustainability 2025, 17, 5728. [Google Scholar] [CrossRef]
- Greco, S.; Ishizaka, A.; Tasiou, M.; Torrisi, G. On the methodological framework of composite indices: A review of the issues of weighting, aggregation, and robustness. Soc. Indic. Res. 2019, 141, 61–94. [Google Scholar] [CrossRef]
- Sachs, J.; Kroll, C.; Lafortune, G.; Fuller, G.; Woelm, F. Sustainable Development Report; Cambridge University Press: Cambridge, UK, 2023. [Google Scholar]
- Marti, L.; Puertas, R. Assessment of sustainability using a synthetic index. Environ. Impact Assess. Rev. 2020, 84, 106375. [Google Scholar] [CrossRef]
- Tomaselli, V.; Fordellone, M.; Vichi, M. Building Well-Being Composite Indicator for Micro-Territorial Areas Through PLS-SEM and K-Means Approach. Soc. Indic. Res. 2021, 153, 407–429. [Google Scholar] [CrossRef]
- Pinto, M.; Fernández-Pascual, R.; Sales, D. Communication of information in the digital age among social sciences students: Uncovering a synthetic indicator of performance. Aslib J. Inf. Manag. 2018, 70, 326–343. [Google Scholar] [CrossRef]
- Grájeda, A.; Burgos, J.; Córdova, P.; Sanjinés, A. Assessing student-perceived impact of using artificial intelligence tools: Construction of a synthetic index of application in higher education. Cogent Educ. 2024, 11, 2287917. [Google Scholar] [CrossRef]
- Çağlayan, M.; Çağlayan, E.; Acartürk, C. Stakeholder Perspectives on Rankings of Higher Education Institutions: A Structural Equation Modeling Analysis. Res. High. Educ. 2025, 66, 18. [Google Scholar] [CrossRef]
- Pinto, M.; Sales, D.; Fernández-Pascual, R.; Caballero-Mariscal, D. Attitudes, perceptions and prospectings on mobile information literacy training: Design and validation of the MOBILE-APP questionnaire. J. Librariansh. Inf. Sci. 2020, 52, 208–223. [Google Scholar] [CrossRef]
- Mertler, C.A.; Vannatta, R.A.; LaVenia, K.N. Advanced and Multivariate Statistical Methods: Practical Application and Interpretation; Routledge: Abingdon, UK, 2021. [Google Scholar]
- Kline, R.B. Principles and Practice of Structural Equation Modeling, 5th ed.; The Guilford Press: New York, NY, USA, 2023. [Google Scholar]
- Mazziotta, M.; Pareto, A. Synthesis of indicators: The composite indicators approach. In Complexity in Society: From Indicators Construction to Their Synthesis; Springer International Publishing: Cham, Switzerland, 2017; pp. 159–191. [Google Scholar]
- Luque-Martínez, T.; del Barrio-Garcia, S. Constructing a synthetic indicator of research activity. Scientometrics 2016, 108, 1049–1064. [Google Scholar] [CrossRef]
- Afshar Ali, M.; Alam, K.; Taylor, B. Incorporating affordability, efficiency, and quality in the ICT development index: Implications for index building and ICT policymaking. Inf. Soc. 2020, 36, 71–96. [Google Scholar] [CrossRef]
- Li, R.; Wang, L. Investigating weight constraint methods for causal-formative indicator modeling. Behav. Res. Methods 2024, 56, 6485–6497. [Google Scholar] [CrossRef]
- Amora, J.T. On the validity assessment of formative measurement models in PLS-SEM. Data Anal. Perspect. J. 2023, 4, 1–7. [Google Scholar]
- Lauro, N.C.; Grassia, M.G.; Cataldo, R. Model based composite indicators: New developments in partial least squares-path modeling for the building of different types of composite indicators. Soc. Indic. Res. 2018, 135, 421–455. [Google Scholar] [CrossRef]
- Jendryczko, D.; Nussbeck, F.W. Estimating and investigating multiple constructs multiple indicators social relations models with and without roles within the traditional structural equation modeling framework: A tutorial. Psychol. Methods 2022, 29, 919–946. [Google Scholar] [CrossRef]
- Hsu, T.C.; Chang, Y.S.; Chen, M.S.; Tsai, I.F.; Yu, C.Y. A validity and reliability study of the formative model for the indicators of STEAM education creations. Educ. Inf. Technol. 2023, 28, 8855–8878. [Google Scholar] [CrossRef]
- Mardia, K.V.; Kent, J.T.; Taylor, C.C. Multivariate Analysis; John Wiley & Sons: Hoboken, NJ, USA, 2024. [Google Scholar]
- Syakur, M.A.; Khotimah, B.K.; Rochman, E.M.; Satoto, B.D. Integration k-means clustering method and elbow method for identification of the best customer profile cluster. In Proceedings of the IOP Conference Series: Materials Science and Engineering, Moscow, Russia, 25–27 April 2018; IOP Publishing: Bristol, UK, 2018; Volume 336, p. 012017. [Google Scholar]
- Jöreskog, K.G.; Olsson, U.H.; Wallentin, F.Y. Multivariate Analysis with LISREL; Springer: Basel, Switzerland, 2016. [Google Scholar]
- Shi, D.; Maydeu-Olivares, A. The Effect of Estimation Methods on SEM Fit Indices. Educ. Psychol. Meas. 2020, 80, 421–445. [Google Scholar] [CrossRef] [PubMed]
- Hair, J.F., Jr.; Hult, G.T.M.; Ringle, C.M.; Sarstedt, M.; Danks, N.P.; Ray, S. Evaluation of Formative Measurement Models. In Partial Least Squares Structural Equation Modeling (PLS-SEM) Using R: A Workbook; Springer International Publishing: Cham, Switzerland, 2021; pp. 91–113. [Google Scholar]
- Machleit, K.A. Developing measures of latent constructs: A practical guide to psychometric theory. In Handbook of Research Methods in Consumer Psychology; Routledge: Abingdon, UK, 2019; pp. 93–103. [Google Scholar]
- Zheng, B.Q.; Bentler, P.M. Enhancing model fit evaluation in SEM: Practical tips for optimizing chi-square tests. Struct. Equ. Model. Multidiscip. J. 2025, 32, 136–141. [Google Scholar] [CrossRef]
- Bauer, J.; Mayer, A.; Fuchs, C.; Schamberger, T. Misspecifications in structural equation modeling: The choice of latent variables, causal-formative constructs or composites. arXiv 2025, arXiv:2507.21998. [Google Scholar] [CrossRef]
- Kumar, B.A.; Mohite, P. Usability guideline for mobile learning apps: An empirical study. Int. J. Mob. Learn. Organ. 2016, 10, 223–237. [Google Scholar] [CrossRef]
- Sophonhiranrak, S. Features, barriers, and influencing factors of mobile learning in higher education: A systematic review. Heliyon 2021, 7, e06696. [Google Scholar] [CrossRef]
- Aznar-Díaz, I.; Hinojo-Lucena, F.J.; Caceres-Reche, M.P.; Romero-Rodríguez, J.M. Analysis of the determining factors of good teaching practices of mobile learning at the Spanish University. An explanatory model. Comput. Educ. 2020, 159, 104007. [Google Scholar] [CrossRef]
- Talan, T.; Doğan, Y.; Kalinkara, Y. Digital natives’ mobile learning adoption in terms of UTAUT-2 model: A structural equation model. Innoeduca Int. J. Technol. Educ. Innov. 2024, 10, 100–123. [Google Scholar] [CrossRef]
- Yukhymenko-Lescroart, M.A.; Donnelly-Hermosillo, D.F.; Cowan, C.C.; Berrett, B.D. A Latent Profile Analysis of University Faculty Subtypes for Mobile Technology Integration. Comput. Educ. Open 2021, 2, 100052. [Google Scholar] [CrossRef]
- Gómez-García, M.; Ruiz-Palmero, J.; Boumadan-Hamed, M.; Soto-Varela, R. Perceptions of future teachers and pedagogues on responsible AI. A measurement instrument. Rev. Iberoam. Educ. Distan. 2025, 28, 105–125. [Google Scholar]


Disclaimer/Publisher’s Note: The statements, opinions and data contained in all publications are solely those of the individual author(s) and contributor(s) and not of MDPI and/or the editor(s). MDPI and/or the editor(s) disclaim responsibility for any injury to people or property resulting from any ideas, methods, instructions or products referred to in the content. |
© 2025 by the authors. Licensee MDPI, Basel, Switzerland. This article is an open access article distributed under the terms and conditions of the Creative Commons Attribution (CC BY) license (https://creativecommons.org/licenses/by/4.0/).