Article

Alzheimer’s Disease Lipidome: Elevated Cortical Levels of Glycerolipids in Subjects with Mild Cognitive Impairment (MCI) but Not in Non-Demented Alzheimer’s Neuropathology (NDAN) Subjects

by
Paul L. Wood
1,*,
John E. Cebak
1,2 and
Aaron W. Beger
1,3
1
Metabolomics Unit, College of Veterinary Medicine, Lincoln Memorial University, 6965 Cumberland Gap Parkway, Harrogate, TN 37752, USA
2
Mayo Clinic, 3400 E Shea Blvd, Scottsdale, AZ 85259, USA
3
Department of Anatomy, Edward Via College of Osteopathic Medicine-Virginia Campus, 2265 Kraft Drive, Blacksburg, VA 24060, USA
*
Author to whom correspondence should be addressed.
J. Dement. Alzheimer's Dis. 2025, 2(3), 20; https://doi.org/10.3390/jdad2030020
Submission received: 5 March 2025 / Revised: 21 April 2025 / Accepted: 6 June 2025 / Published: 1 July 2025

Abstract

Background/Objectives: Abnormal brain glycerolipid metabolism has been reported for Alzheimer’s disease (AD). This includes both diacylglycerols (DGs) and monogalactosyl-DGs (MGDGs), which are elevated in AD subjects. While DGs are also elevated in subjects with mild cognitive impairment (MCI), MGDGs have not yet been examined at this early stage of cognitive impairment. Methods: MGDG, triacylglycerol (TG), and ether glycerolipid levels in the cerebral cortex gray matter of controls, MCI, and non-demented Alzheimer’s neuropathology (NDAN) subjects were monitored by high-resolution mass spectrometry (<2 ppm mass error). Results: MGDG, MGDG ether, DG ether, and TG levels were elevated in the cerebral cortex of MCI but not NDAN subjects. Conclusions: A diverse array of glycerolipids was elevated in MCI subjects, suggesting a role in cognitive dysfunction. This suggestion is further supported by the maintenance of normal glycerolipid levels in NDAN subjects with amyloid accumulation but not cognitive deficits. Our data clearly indicate that while complex lipid alterations occur in MCI subjects, relative to controls 20 years younger, no such lipid alterations occur in NDAN subjects. While amyloid deposition in MCI is not involved in the observed lipid alterations, other ongoing neuropathologies may contribute to changes in lipid dynamics and vice versa.
Keywords:
MGDG; DG; ether lipids; MCI; NDAN; AD; cortex

1. Introduction

The ever-increasing number of clinical cases of Alzheimer’s dementia (AD), as baby boomers become the geriatric boomers, poses a significant clinical management problem since there is currently no therapeutic option that addresses the cognitive deficit associated with this degenerative proteinopathy. While there are a number of hypotheses regarding the etiology of sporadic AD, none have resulted in an effective therapy for preserving cognition. Newer observations of relevance in the search for a therapeutic are the reports of non-demented individuals who, at autopsy, possess significant AD neuropathology (NDAN) [1,2]. These subjects may help define the basis of cognitive reserve that NDAN individuals possess. In this study, we investigated glycerolipid alterations in controls, NDAN subjects, and subjects with mild cognitive impairment (MCI). The goal was to define lipid alterations that may be components of the pathologic mechanisms responsible for the progressive cognitive decline characteristic of the progression from MCI to AD.
AD is a cognitive disorder characterized by complex neuropathologies, including neurofibrillary tangles, neuritic plaques, neuronal shrinkage, hypomyelination, neuroinflammation, and cholinergic dysfunction. The roles of these pathological processes in the evolution of cognitive dysfunction remain to be established. Studies of MCI subjects hold the potential to define early biochemical changes in this process. Lipidomics is one of the omics technologies that can be utilized in these studies. Lipidomics studies have reported elevated diacylglycerol (DG) levels in the neocortex of late-onset Alzheimer’s disease (AD) [1,2,3,4] and in late-stage Parkinson’s and Lewy body diseases [5]. These lipid changes occur in both gray and white matter [1]. More recently, another glycerolipid family, monogalactosyl diacylglycerols (MGDGs), has been monitored in human neocortex [6] and has been reported to be increased in cortical gray and white matter in AD subjects [7].
MGDGs are unique non-bilayer lipids that are potentially involved in the organization of membrane proteins [8]. Since significant levels of these lipids have been monitored in both gray and white matter, MGDGs may play critical roles in neurotransmission [7]. In rodent studies, the levels of this lipid family reach maximal levels in the early stages of myelination and then decline thereafter [9,10,11]. This has led to the suggestion that MGDGs may serve as biomarkers of myelination [12]. Biosynthesis of MGDGs involves galactosyltransferases [13,14,15], which are postulated to be dysregulated in AD oligodendrocytes [16]. Degradation of MGDGs involves galactolipase (EC 3.1.1.26), which results in the release of two fatty acids and the generation of galactosylglycerol [17]. Galactolipase has been characterized in the gastrointestinal tract but not in the brain [17]. Galactosylglycerol, which can act as an osmolyte [18], has been reported in human plasma and urine [19], but its presence in the brain has not been investigated.
Based on the potential importance of MGDGs in the development of cognitive dysfunction in AD [7], we determined that it would be valuable to investigate MCI subjects and Non-Demented Alzheimer’s Neuropathology (NDAN) subjects. NDAN subjects are unique in that they possess significant amyloid deposition without cognitive deficit [20].
Heterogeneity of dementia populations complicates biochemical studies. Therefore, it is important for researchers to acquire data from demented subsets with and without AD neuropathology as well as from NDAN subjects. The integration of these studies will enable the definition of factors responsible for AD neuropathology and potentially lead to the identification of biochemical and/or structural mechanisms that are responsible for cognitive dysfunction. Similarly, MCI subjects represent a heterogeneous population, of which a significant proportion progresses to AD [1,2]. It is therefore also important to include MCI samples in any biochemical study to potentially define biochemical changes that occur early in the development of dementia. Our data indicate that MGDG accumulation, noted in AD cortex [7], occurs early in the disease process, as per our observation in MCI subjects. In addition, our data on unaltered MGDG levels in NDAN subjects indicate that altered MGDG metabolism is not driven by amyloid deposition. We hypothesized that MGDG levels would be elevated in MCI but not in NDAN, implicating glycerolipid dysregulation in early cognitive impairment rather than in amyloid deposition.

2. Materials and Methods

2.1. Donor Tissues

Post-mortem tissues (frontal lobe grey) were provided to the Oregon Brain Bank from volunteer subjects who were evaluated at Oregon Health and Science University in an aging study (IRB 00001623). The subject demographics are presented in Table 1. The 15 mg tissue samples were from the same brain dissections examined in previous studies [1,2].

2.2. Lipidomics Analyses

Approximately 15 mg of frozen tissue was sonicated in 1 mL of water and 1 mL of methanol containing 2 nanomoles of [13C3]DG 36:2 [6,21]. The sonicates were shaken (Thermo Fisher Multitube Vortex, Thermo Fisher, Boston, MA, USA) at room temperature for 30 min following the addition of 2 mL of tert-butylmethylether (MTBE). The samples were then centrifuged at 4000× g for 30 min at room temperature. Aliquots (1 mL) of the upper organic layer were transferred to a deep-well microplate, and the samples were dried via vacuum centrifugation (Eppendorf Vacufuge Plus, Eppendorf, Enfield, CT, USA).
To the dried samples were added 200 μL of 2-propanol/methanol/chloroform (8:4:4), containing 5 mM ammonium chloride [6,21]. Flow infusion analysis (12 µL/min), coupled with negative and positive electrospray ionization (290–1000 amu), was performed using high-resolution mass spectrometry (HRMS, 140,000 at 200 amu) data acquisition with an orbitrap mass spectrometer (Thermo Q Exactive; Table 2). Between sample injections, the syringe and tubing were flushed with 1 mL of methanol followed by 1 mL of hexane/ethyl acetate/chloroform/water (3:2:1:0.1).
For MS/MS analyses, parent ions were selected with a 0.4 amu window and collision energies of 15, 30, and 50 arbitrary units. MS/MS data were only utilized to validate lipid annotations and were not quantitative since analytical standards were not available. Product ions were monitored with a resolution of 240,000 (<2 ppm mass error). For diacyl MGDGs, the product ions of the chloride adducts were the sn-1 and sn-2 fatty acid substituents, while with alkyl-acyl MGDGs and DGs, the product ions were the sn-2 fatty acid substituents [6]. The product ions were [monoacylglycerols]+ for DGs, [MH-FA]+ for TGs, and cholesterol [369.3516]+ for cholesterol esters.

2.3. Data Processing

HRMS data were imported into an in-house Microsoft Excel spreadsheet containing a list of diacyl MGDGs, alkyl-acyl MGDGs, DGe, TGs, and CEs, along with their exact masses and calculated ions ([6], Table 2). Imported ion scans with less than 2 ppm mass error relative to the calculated ions were recorded as hits. Relative lipid levels were determined as the ratio of the peak signal intensities of endogenous lipids to the peak signal intensity of the internal standard [13C3]DG 36:2 [M + Cl = 658.5179], prior to correction for tissue wet weights. Data are presented as mean ± SD. Data were analyzed using one-way ANOVA, followed by the Tukey–Kramer test to determine differences between groups [1,2].

3. Results

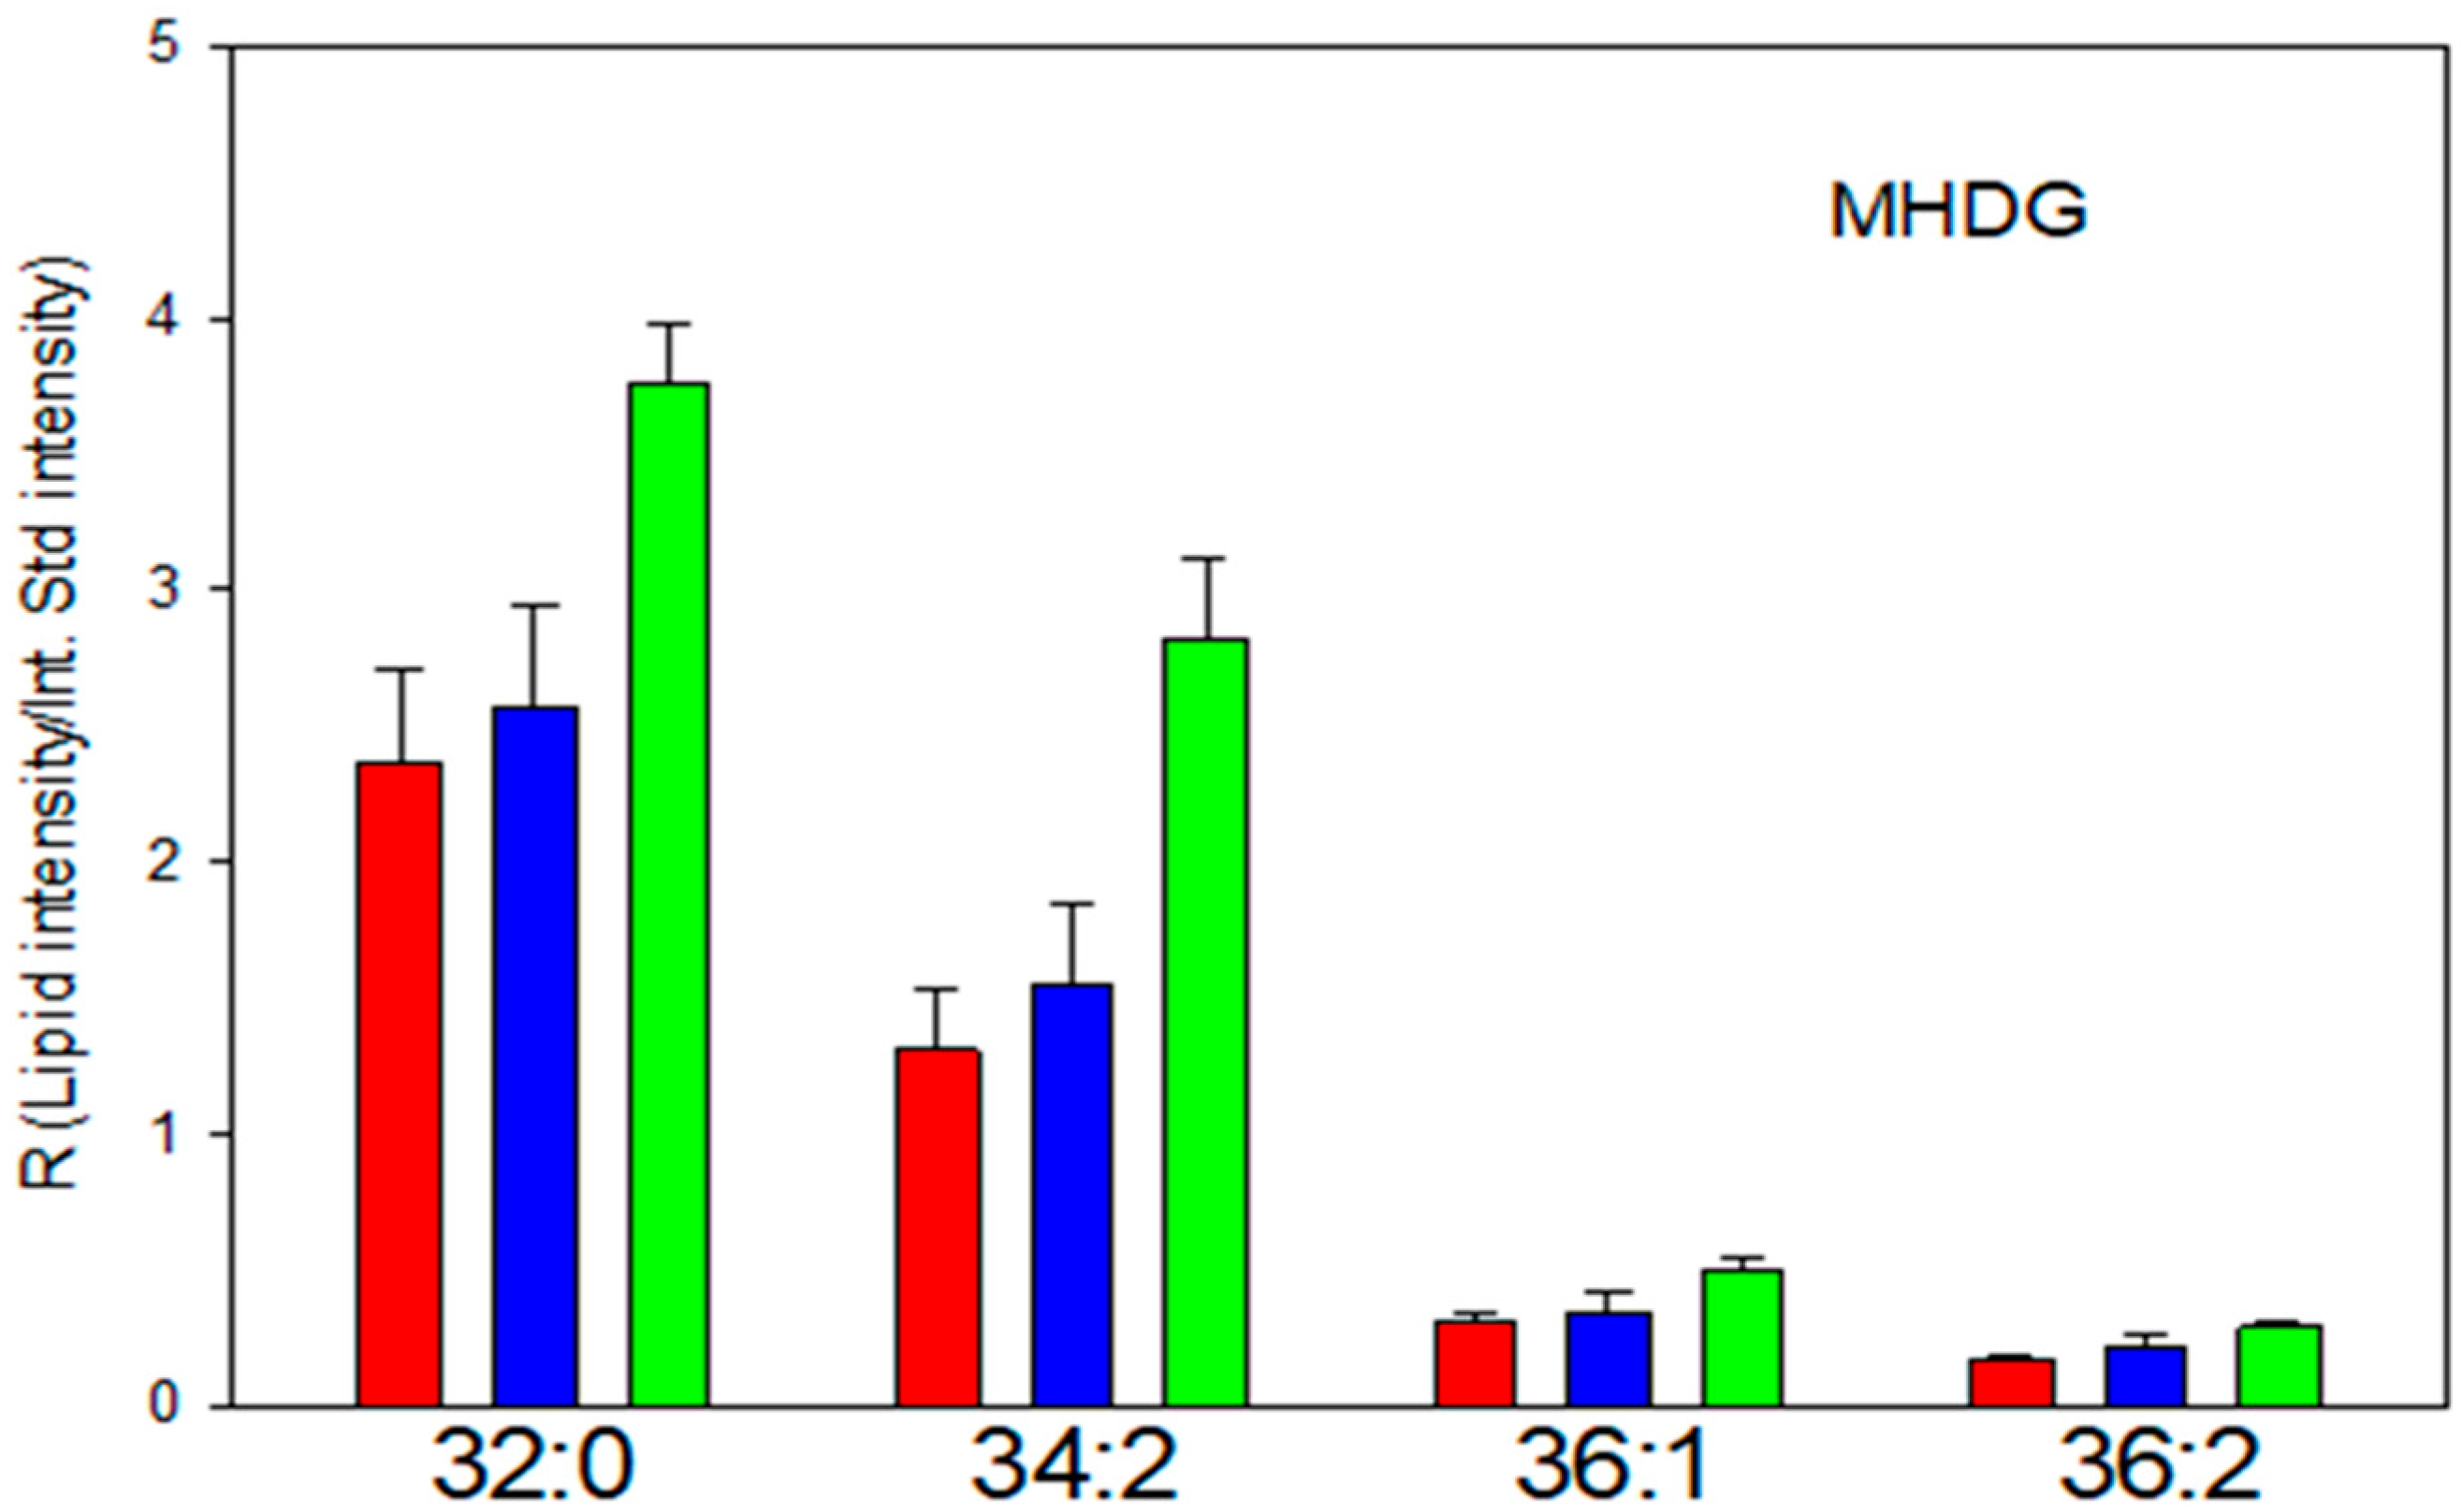
3.1. Diacyl MGDG/MHDG

MHDGs were detected at low levels in the cerebral cortex, as reported previously [6,7]. MHDG 32:0 (16:0/16:0) was the predominant MHDG, but the levels of all MGDGs were augmented in MCI subjects (Figure 1, Table 2). The other MHDGs (Table 2) included MHDG 34:2 (16:0/18:2), MHDG 36:1 (18:0/18:1), and MHDG 36:2 (18:0/18:2). No MHDGs with polyunsaturated fatty acid substituents were detected. Of interest was that the levels of MHDGs were not altered in old controls possessing Alzheimer’s neuropathology (NDAN; Figure 1).

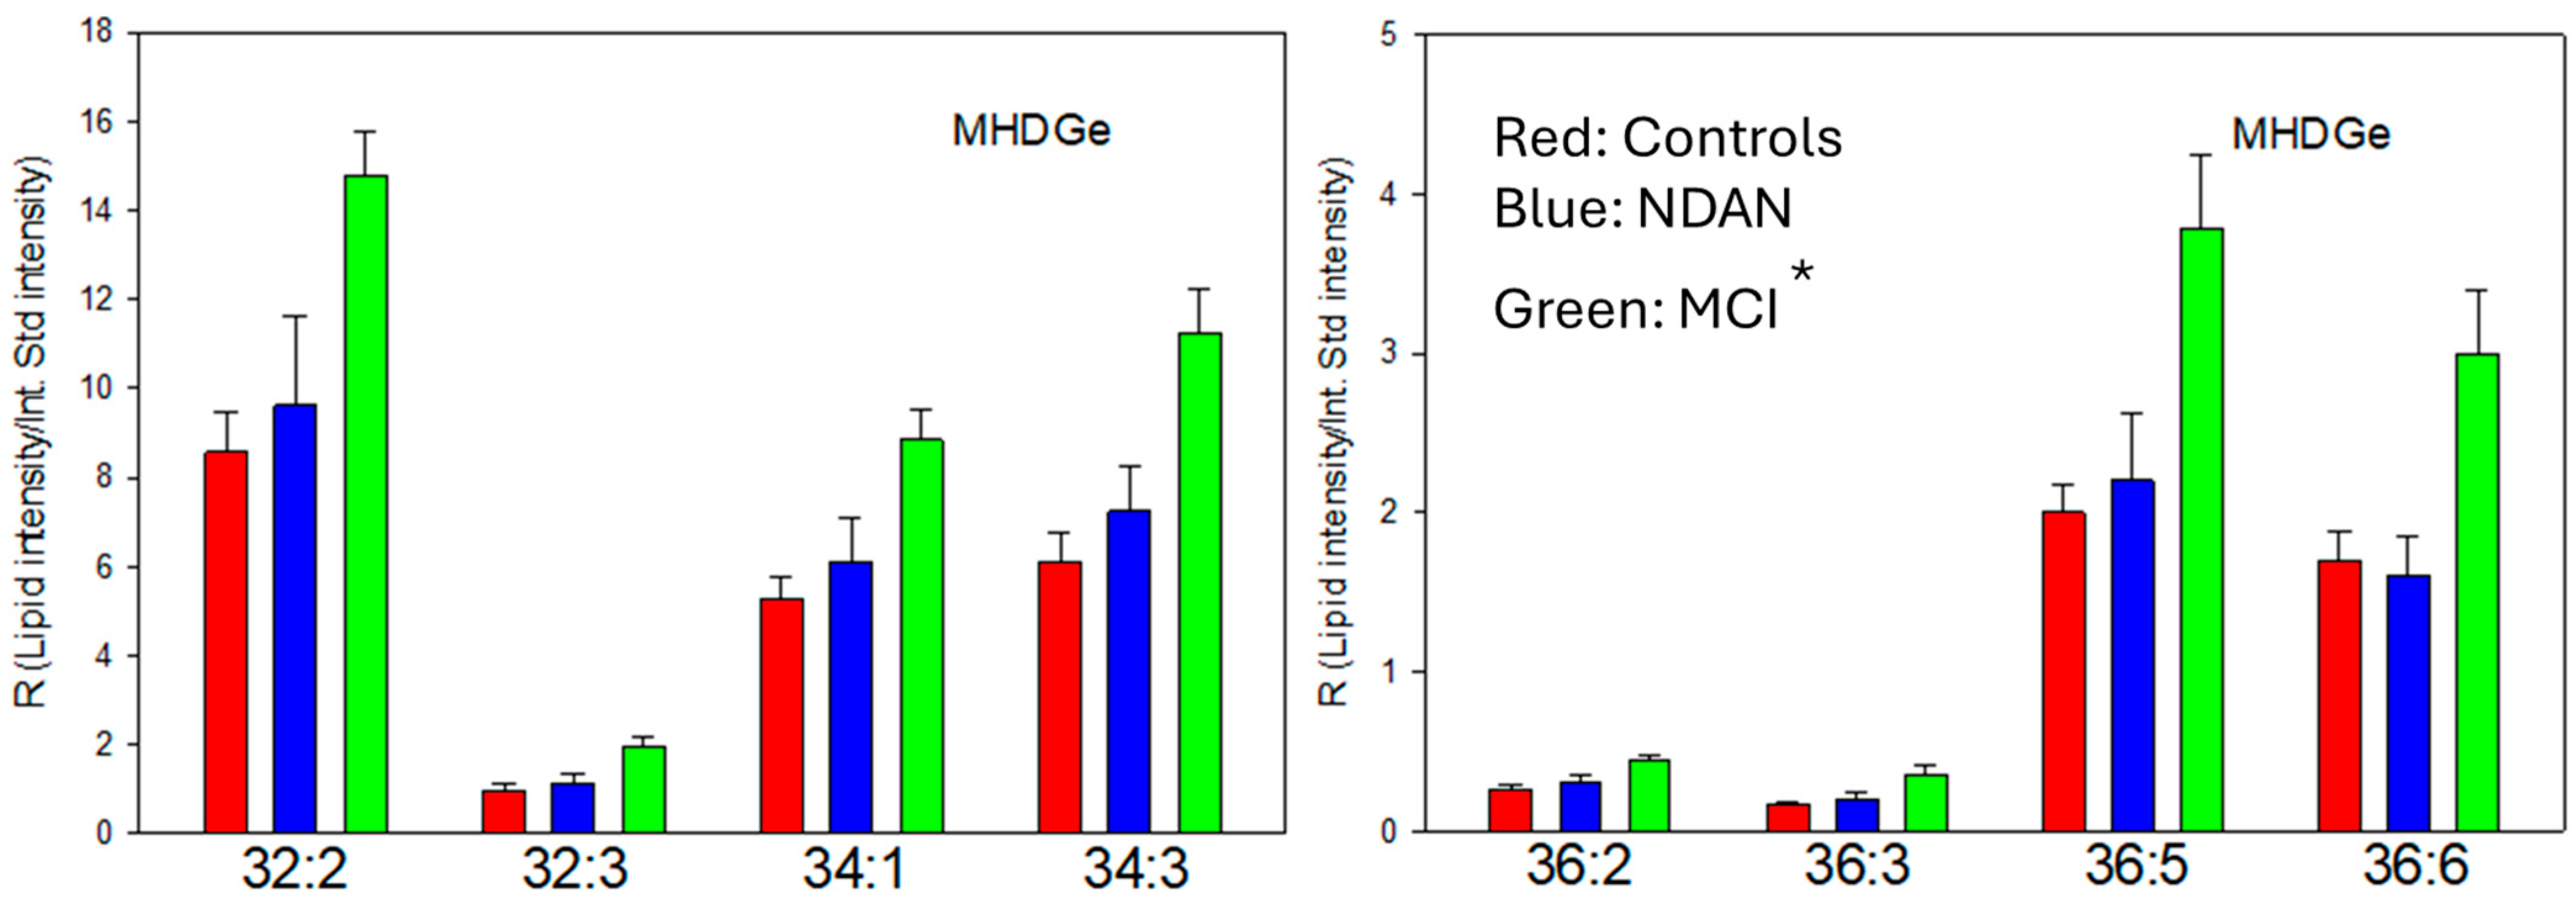
3.2. Alkyl-Acyl MGDG (MGDGe)

A number of MGDGe molecules were identified, with all the ether lipids elevated in the cortex of MCI but not NDAN subjects (Figure 2). These included (Figure 2; Table 2) MHDGe 32:2 (16:0e/16:2), MHDGe 32:3 (16:0e/16:3), MHDGe 34:1 (16:0e/18:1), MHDGe 34:3 (16:0e/18:3), MHDGe 36:2 (18:0e/18:2), MHDGe 36:3 (18:0e/18:3), MHDGe 36:5 (16:0e/20:5), and MHDGe 36:6 (16:0e/20:6). In contrast to the MGDGs, we also detected MGDGe species containing polyunsaturated fatty acid substituents, suggesting the possibility that these are metabolic products of ether glycerophospholipids (GPLs).

3.3. Alkyl-Acyl DG (DGe)

We [1,2,22] and others [3] have reported elevated DGs in the cortex of AD subjects and in MCI [1,2]. However, the ether forms of these glycerolipids have not been investigated. In this context, similar to the MGDG ethers, we monitored increases in cortical DG ethers in the cortex of MCI subjects (Figure 3). In contrast to MGDG ethers, there were more DG plasmalogens (i.e., DGp = alkenyl-acyl DG) than simpler ether forms (i.e., DGe = alkyl-acyl DG). These included DGp 34:0 (18:0p/16:0), DGp 36:1 (18:0p/18:1), DGp 36:2 (18:1p/18:1), and DGe40:3 (20:0p/20:3) (Figure 3; Table 2). None of the DG ethers possessed polyunsaturated fatty acid substituents.

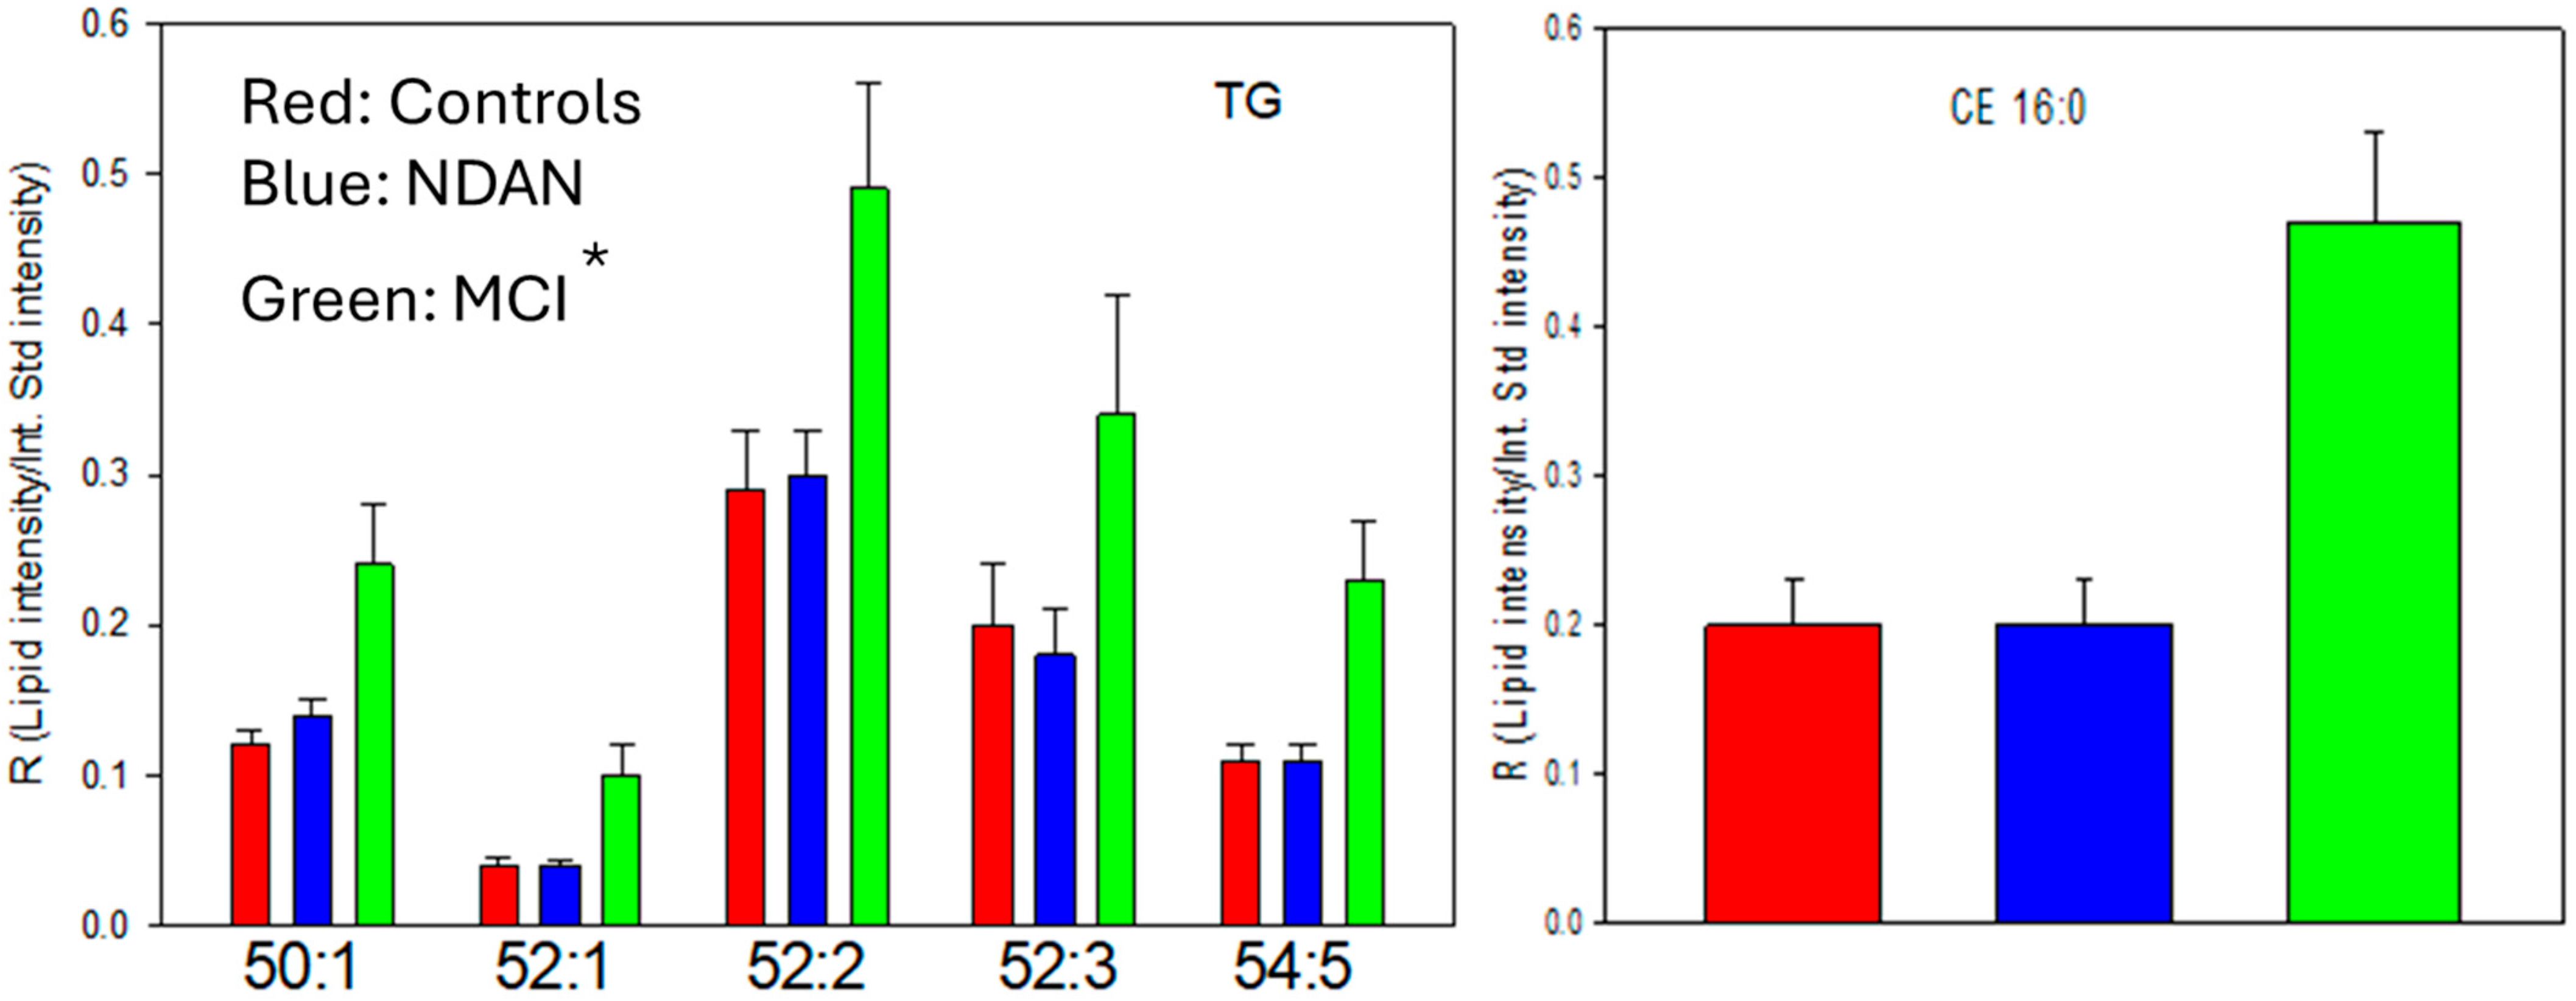
3.4. Lipid Droplets: Triacylglycerols (TGs) and Cholesterol Esters (CEs)

After noting the number of glycerolipid families that were elevated in MCI subjects, we examined TGs and sterol esters (CEs) in lipid droplets, which, along with associated perilipins, have been reported to be increased in AD [23,24]. This investigation revealed increases in a number of TGs and CE 16:0 in the cortex of MCI subjects (Figure 4). The TGs included TG 50:1 (16:0/16:0/18:1), TG 52:1 (16:0/18:0/18:1), TG 52:2 (16:0/18:1/18:1), TG 52:3 (16:0/18:1/18:2), and TG 54:5 (18:2/18:2/18:1 and 16:0/18:1/20:4).

4. Discussion

We have previously reported that DGs are elevated in the cerebral cortex of subjects with AD and MCI [1,2], and Parkinson’s and Lewy body diseases [5], leading to the conclusion that these neutral glycerolipids may represent a biomarker of neuroinflammation [22]. MGDGs represent the glycated products of galactosyltransferases and DGs [13,14,15], which could be augmented by increased DG glycation and/or decreased MGDG metabolism. With regard to increased biosynthesis, alterations in galactosyltransferase or the associated gene UDP glycosyltransferase 8 (UGT8) remain to be determined in MCI and AD. Similarly, the degradative enzyme galactolipase (EC 3.1.1.26) remains to be investigated in the brain [17].
There is a large family of galactosyltransferases [13,14,15] that remains to be fully characterized. In addition to transferring a galactose group to DGs, these enzymes are also involved in building the glycan headgroups of brain gangliosides and mucin-type O-glycan modifications of structural proteins. With regard to gangliosides, GM2, GM3, GM4, and GD3 levels are augmented in the frontal cortex of AD subjects [25]. However, the picture is further complicated in that other gangliosides are decreased. Studies of galactosyltransferases in Drosophila have demonstrated high enzyme levels at the glutamatergic neuromuscular junction (NMJ) and in the CNS, which are involved in the post-translational glycation of synaptic proteins [26,27]. Localization of galactosyltransferases at the NMJ also indicates that they could be involved in the biogenesis of MGDG and MGDGe/p lipids at this critical site of neurotransmission. Integrating all these lipidomic observations will be important in designing studies to evaluate mucin-type O-glycan protein modifications in AD brain synapses to understand possible alterations in the lipid–proteome interactome. Cortical synaptosomes from AD subjects offer a path forward for such analyses [28]. Analysis of these post-translational modifications of proteins may be of further importance since mucin-type O-glycan-modified proteins are essential for vascular integrity [29], which is altered early in the AD disease process [30].
A potential degradative enzyme for MGDGs is galactosylceramidase (EC 3.2.7.46). However, this enzyme is unlikely to be involved in the observed increases in MGDGs [7] since enzyme levels are augmented in AD [31]. This lack of understanding regarding the mechanisms of altered MGDG levels in MCI and AD contrasts with the observations that augmented DG levels may result from altered levels of miR-34a [32], a negative regulator of DG kinase, which is upregulated in the frontal cortex in AD [33]. DG kinase terminates DG signaling via conversion of DGs to phosphatidic acids [34].
Elevated DG and MGDG levels likely have multifaceted metabolic effects, influencing both signal transduction and membrane dynamics. In this regard, both DGs and MGDGs [35,36,37] activate protein kinase C, which can potentiate the neuroinflammation [38,39] prevalent in MCI and AD, but not in NDAN subjects [12,40]. These data suggest that alterations in DGs and MGDGs in MCI and AD are not dependent upon amyloid deposition, or vice versa, since NDAN subjects have significant amyloid deposition [20,41,42,43,44,45,46,47].
A further complication of this study and previous work [7] is the potential impact of abnormal peroxisomal function in AD [48,49] on the generation of alkyl-acyl MGDGs (MGDGe). The addition of a fatty alcohol (i.e., e = ether linkage) at sn-1 of the DG backbone occurs only in peroxisomes. While peroxisomal function does not appear to be greatly affected in MCI subjects [1,2], it can be significantly decreased in AD cortex [1,48,49], suggesting that accumulation of MGDGe in AD subjects does not involve increased synthesis but rather decreased metabolism and/or increased metabolism of ether glycerophospholipids (Figure 5), as has been suggested for DGs [22].
Lipid remodeling, which is a dynamic process, involves PLA removal of fatty acid substituents from the sn-2 position of glycerophospholipids, generating lysoglycerophospholipids, which can subsequently generate ether DGs and ether MGDGs (Figure 5). In this regard, PLA2 gene variants have been reported as a risk factor for the development of AD [50]. An alternate pathway may involve the sequential metabolism of ether GPLs: Alkyl-acyl-GPL → Alkyl-acyl phosphatidic acid → Alkyl-acyl glycerol (DGe). This route is supported by the reported decrement in cortical ether GPLs in AD [1,2,3,4]. In contrast, ether GPLs are unchanged in the cortex of MCI subjects [1,2]. A detailed analysis of GPLs and glycerolipids in the tissue samples utilized in this study has been published [1,2].

Study Limitations and Future Directions

The HRMS analyses utilized for this lipidomics study provide accurate lipidome data. The limitation of our study is the small sample sizes compared to the recent analyses of MGDGs in AD subjects [7]. Further studies with a larger sample set will allow more detailed analyses of different variables. Increased availability of NDAN brain samples is also essential for such studies. A larger sample set will allow further validation of these probe findings and allow a detailed evaluation of gender differences, regional brain differences, correlations with cognitive scores, and the potential impact of PMI.
The diversity of brain lipid alterations that have been reported for AD and MCI [48] complicates the interpretation of the integrated view of the effect(s) of these lipid changes on neuronal and glial function. It is critical that future research include an integrated investigation of all the reported lipid changes in each clinical sample, along with transcriptomics and microRNA (miR) measurements. In addition, sample sizes need to be increased to define potential subsets of patients, since AD is a multifactorial disease with multiple pathways contributing to the ultimate pathophysiology of cognitive dysfunction [51]. Integration of lipidomics [52,53,54,55] and other omics technologies should aid in characterizing different pathological mechanisms that lead to cognitive impairment. The evolving field of lipid–protein interactome analyses [53,54,55] is one such potentially fruitful approach in the study of the multi-factorial processes involved in the development of cognitive disorders. Alterations in the protein–lipid interactome can have multiple negative influences on membrane protein function, including enzymes, ion channels, and transporters. Lipid alterations can also affect membrane fusion events, including endocytosis, exocytosis, membrane trafficking, organelle construction, and cell division. These interactome studies are important since a subpopulation of demented patients possesses no AD neuropathology but decreased cortical thickness [47]. In addition, integrated studies of NDAN subjects may identify the biochemical basis for cognitive reserve in non-demented subjects who possess AD neuropathology. The NDAN patient population is large, with 40% of cognitively normal elderly individuals possessing AD neuropathology [47]. An exciting potential for research on NDAN individuals would be if the resistance factor(s) involved in maintaining cognition were a biochemical that could be replaced by supplementation or pharmacological treatment. Based on the limited success of all current AD therapeutics, this is a new avenue of research that holds significant potential for a breakthrough in dementia research.
Increasing our understanding of the lipid–protein interactome has the potential to make significant advances in AD research. The glycerolipids that are elevated in AD and in MCI are non-bilayer lipids that are present in all biological membranes [55,56,57]. Non-bilayer lipids are involved in membrane fusion and are required for the function of SNARE proteins. The SNARE complex mediates vesicle fusion, via merging lipid bilayers, for neurotransmitter release and vesicle recycling [58,59]. In this regard, SNARE complex polymorphisms in AD appear to correlate with deficits in visual selective attention [60], and ApoE polymorphisms alter SNARE complex dynamics [61]. These polymorphisms in combination with altered non-bilayer membrane composition could underlie a neurotransmitter basis of cognitive dysfunction. Altered glycerolipid concentrations in organelles may further exacerbate these perturbations in synaptic function [62]. Non-bilayer lipids also augment the binding of membrane proteins, altering the stability of membrane enzymes, transporters, and ion channels [63,64].
In addition to these complex alterations in membrane structure and function that result from elevated levels of non-bilayer glycerolipids, altered glycerolipid levels also alter signal transduction, as previously discussed by us [22] and others [65].

5. Conclusions

Glycerolipids, including DGs, MGDGs, and TGs, are increased in the neocortex of MCI subjects, suggesting a potential early role in the pathology of cognitive dysfunction in dementia. The normal levels of these lipids in NDAN subjects indicate that altered glycerolipid metabolism is independent of amyloid deposition.

Supplementary Materials

The following supporting information can be downloaded at: https://www.mdpi.com/article/10.3390/jdad2030020/s1, Supplementary Data: All raw lipidomics data.

Author Contributions

Conceptualization, P.L.W., J.E.C. and A.W.B.; methodology, P.L.W., J.E.C. and A.W.B.; software, P.L.W.; validation, P.L.W.; formal analysis, P.L.W.; investigation, P.L.W., J.E.C. and A.W.B.; resources, P.L.W.; data curation, P.L.W.; writing—original draft preparation, P.L.W.; writing—review and editing, P.L.W., J.E.C. and A.W.B.; visualization, P.L.W.; supervision, P.L.W.; project administration, P.L.W.; funding acquisition, P.L.W. All authors have read and agreed to the published version of the manuscript.

Funding

This research received no external funding and was funded by Lincoln Memorial University.

Institutional Review Board Statement

The study was conducted in accordance with the Declaration of Helsinki and approved by the Institutional Review Board of Oregon Health and Science University (IRB 00001623). Only de-identified tissues were studied.

Informed Consent Statement

Informed consent was obtained from all subjects involved in the study.

Data Availability Statement

Acknowledgments

We thank the participants of the aging study and their families for their valuable contribution to aging and Alzheimer’s research. We also thank R.L. Woltjer for the postmortem tissues maintained within the Oregon Brain Bank from volunteer subjects who gave informed consent for the aging study.

Conflicts of Interest

The authors declare no conflicts of interest.

References

  1. Wood, P.L.; Barnette, B.L.; Kaye, J.A.; Quinn, J.F.; Woltjer, R.L. Non-targeted lipidomics of CSF and frontal cortex grey and white matter in control, mild cognitive impairment, and Alzheimer’s disease subjects. Acta Neuropsychiatr. 2015, 27, 270–278. [Google Scholar] [CrossRef] [PubMed]
  2. Wood, P.L.; Medicherla, S.; Sheikh, N.; Terry, B.; Phillipps, A.; Kaye, J.A.; Quinn, J.F.; Woltjer, R.L. Targeted Lipidomics of Fontal Cortex and Plasma Diacylglycerols (DAG) in Mild Cognitive Impairment and Alzheimer’s Disease: Validation of DAG Accumulation Early in the Pathophysiology of Alzheimer’s Disease. J. Alzheimer’s Dis. 2015, 48, 537–546. [Google Scholar] [CrossRef] [PubMed]
  3. Chan, R.B.; Oliveira, T.G.; Cortes, E.P.; Honig, L.S.; Duff, K.E.; Small, S.A.; Wenk, M.R.; Shui, G.; Di Paolo, G. Comparative lipidomic analysis of mouse and human brain with Alzheimer disease. J. Biol. Chem. 2012, 287, 2678–2688. [Google Scholar] [CrossRef] [PubMed]
  4. Lam, S.M.; Wang, Y.; Duan, X.; Wenk, M.R.; Kalaria, R.N.; Chen, C.P.; Lai, M.K.; Shui, G. Brain lipidomes of subcortical ischemic vascular dementia and mixed dementia. Neurobiol. Aging 2014, 35, 2369–2381. [Google Scholar] [CrossRef] [PubMed]
  5. Wood, P.L.; Tippireddy, S.; Feriante, J.; Woltjer, R.L. Augmented frontal cortex diacylglycerol levels in Parkinson’s disease and Lewy Body Disease. PLoS ONE 2018, 13, e0191815. [Google Scholar] [CrossRef] [PubMed]
  6. Wood, P.L.; Hauther, K.A.; Scarborough, J.H.; Craney, D.J.; Dudzik, B.; Cebak, J.E.; Woltjer, R.L. Human brain lipidomics: Utilities of chloride adducts in flow injection analyses (FIA). Life 2021, 11, 403. [Google Scholar] [CrossRef]
  7. Blusztajn, J.K.; Aytan, N.; Rajendiran, T.; Mellott, T.J.; Soni, T.; Burant, C.F.; Serrano, G.E.; Beach, T.G.; Lin, H.; Stein, T.D. Cerebral Gray and White Matter Monogalactosyl Diglyceride Levels Rise with the Progression of Alzheimer’s Disease. J. Alzheimer’s Dis. 2023, 95, 1623–1634. [Google Scholar] [CrossRef] [PubMed]
  8. Garab, G.; Ughy, B.; Goss, R. Role of MGDG and Non-bilayer Lipid Phases in the Structure and Dynamics of Chloroplast Thylakoid Membranes. Subcell. Biochem. 2016, 86, 127–157. [Google Scholar] [PubMed]
  9. Inoue, T.; Dehmukh, D.S.; Pieringer, R.A. The association of the galactosyl diglycerides of brain with myelination. I. Changes in the concentration of monogalactosyl diglyceride in the somal and myelin fractions of brain of rats during development. J. Biol. Chem. 1971, 246, 5688–5694. [Google Scholar] [CrossRef] [PubMed]
  10. Deshmukh, D.S.; Inoue, T.; Pieringer, R.A. The association of the galactosyl diglycerides of brain with myelination. II. The inability of the myelin-deficient mutant, jimpy mouse, to synthesize galactosyl diglycerides effectively. J. Biol. Chem. 1971, 46, 5695–5699. [Google Scholar] [CrossRef] [PubMed]
  11. Shimomura, K.; Kishimoto, Y. Changes in monogalactosyl diacylglycerols, alkylgalactolipids and cerebroside fatty acid esters in maturing rat brain measured by high-performance liquid chromatography. Biochim. Biophys. Acta 1984, 794, 162–164. [Google Scholar] [CrossRef] [PubMed]
  12. Schmidt-Schultz, T.; Althaus, H.H. Monogalactosyl diglyceride, a marker for myelination, activates oligodendroglial protein kinase c. J. Neurochem. 1994, 62, 1578–1585. [Google Scholar] [CrossRef] [PubMed]
  13. Wenger, D.A.; Petitpas, J.W.; Pieringer, R.A. The metabolism of glyceride glycolipids. II. Biosynthesis of monogalactosyl diglyceride from uridine diphosphate galactose and diglyceride in brain. Biochemistry 1968, 7, 3700–3707. [Google Scholar] [CrossRef] [PubMed]
  14. Wenger, D.A.; Subba Rao, K.; Pieringer, R.A. The metabolism of glyceride glycolipids. 3. Biosynthesis of digalactosyl diglyceride by galactosyl transferase pathways. J. Biol. Chem. 1970, 245, 2513–2519. [Google Scholar] [CrossRef] [PubMed]
  15. van der Bijl, P.; Strous, G.J.; Lopes-Cardozo, M.; Thomas-Oates, J.; van Meer, G. Synthesis of non-hydroxy-galactosylceramides and galactosyldiglycerides by hydroxy-ceramide galactosyltransferase. Biochem. J. 1996, 317, 589–597. [Google Scholar] [CrossRef] [PubMed]
  16. McKenzie, A.T.; Moyon, S.; Wang, M.; Katsyv, I.; Song, W.M.; Zhou, X.; Dammer, E.B.; Duong, D.M.; Aaker, J.; Zhao, Y.; et al. Multiscale network modeling of oligodendrocytes reveals molecular components of myelin dysregulation in Alzheimer’s disease. Mol. Neurodegener. 2017, 12, 82. [Google Scholar] [CrossRef] [PubMed]
  17. Amara, S.; Barouh, N.; Lecomte, J.; Lafont, D.; Robert, S.; Villeneuve, P.; De Caro, A.; Carrière, F. Lipolysis of natural long chain and synthetic medium chain galactolipids by pancreatic lipase-related protein 2. Biochim. Biophys. Acta 2010, 1801, 508–516. [Google Scholar] [CrossRef] [PubMed]
  18. Kauss, H. Turnover of galactosylglycerol and osmotic balance in ochromonas. Plant Physiol. 1973, 52, 613–615. [Google Scholar] [CrossRef] [PubMed]
  19. Simón-Manso, Y.; Marupaka, R.; Yan, X.; Liang, Y.; Telu, K.H.; Mirokhin, Y.; Stein, S.E. Mass Spectrometry Fingerprints of Small-Molecule Metabolites in Biofluids: Building a Spectral Library of Recurrent Spectra for Urine Analysis. Anal. Chem. 2019, 91, 12021–12029. [Google Scholar] [CrossRef] [PubMed]
  20. Jellinger, K.A. Alzheimer’s changes in non-demented and demented patients. Acta Neuropathol. 1995, 89, 112–113. [Google Scholar] [CrossRef] [PubMed]
  21. Wood, P.L.; Woltjer, R.L. Electrospray Ionization High Resolution Mass Spectrometry of the Chloride Adducts of Steroids, Mono- and Oligo-saccharides, Xyloglucans, Ceramides, Gangliosides, and Phenols. In Springer Protocols, Neuromethods: Metabolomics; Wood, P.L., Ed.; Humana Press: New York, NY, USA, 2021; Volume 159, pp. 69–76. ISBN 978-1-0716-0863-0. [Google Scholar]
  22. Wood, P.L.; Cebak, J.E.; Woltjer, R.L. Diacylglycerols as biomarkers of sustained immune activation in Proteinopathies associated with dementia. Clin. Chim. Acta 2018, 476, 107–110. [Google Scholar] [CrossRef] [PubMed]
  23. Conte, M.; Medici, V.; Malagoli, D.; Chiariello, A.; Cirrincione, A.; Davin, A.; Chikhladze, M.; Vasuri, F.; Legname, G.; Ferrer, I.; et al. Expression pattern of perilipins in human brain during aging and in Alzheimer’s disease. Neuropathol. Appl. Neurobiol. 2022, 48, e12756. [Google Scholar] [CrossRef] [PubMed]
  24. Itabe, H.; Yamaguchi, T.; Nimura, S.; Sasabe, N. Perilipins: A diversity of intracellular lipid droplet proteins. Lipids Health Dis. 2017, 16, 83. [Google Scholar] [CrossRef] [PubMed]
  25. Chiricozzi, E.; Lunghi, G.; Di Biase, E.; Fazzari, M.; Sonnino, S.; Mauri, L. GM1 Ganglioside Is A Key Factor in Maintaining the Mammalian Neuronal Functions Avoiding Neurodegeneration. Int. J. Mol. Sci. 2020, 21, 868. [Google Scholar] [PubMed]
  26. Itoh, K.; Akimoto, Y.; Kondo, S.; Ichimiya, T.; Aoki, K.; Tiemeyer, M.; Nishihara, S. Glucuronylated core 1 glycans are required for precise localization of neuromuscular junctions and normal formation of basement membranes on Drosophila muscles. Dev. Biol. 2018, 436, 108–124. [Google Scholar] [CrossRef] [PubMed]
  27. Lin, Y.R.; Reddy, B.V.; Irvine, K.D. Requirement for a core 1 galactosyltransferase in the Drosophila nervous system. Dev. Dyn. 2008, 237, 3703–3714. [Google Scholar] [CrossRef] [PubMed]
  28. Jhou, J.F.; Tai, H.C. The Study of Postmortem Human Synaptosomes for Understanding Alzheimer’s Disease and Other Neurological Disorders: A Review. Neurol. Ther. 2017, 6 (Suppl. S1), 57–68. [Google Scholar] [CrossRef] [PubMed]
  29. Kim, M.; Roura, E.; Choi, Y.; Kim, J. Transcriptomic Analysis of the Porcine Gut in Response to Heat Stress and Dietary Soluble Fiber from Beet Pulp. Genes 2022, 13, 1456. [Google Scholar] [CrossRef] [PubMed]
  30. Sweeney, M.D.; Montagne, A.; Sagare, A.P.; Nation, D.A.; Schneider, L.S.; Chui, H.C.; Harrington, M.G.; Pa, J.; Law, M.; Wang, D.J.J.; et al. Vascular dysfunction-The disregarded partner of Alzheimer’s disease. Alzheimer’s Dement. 2019, 15, 158–167. [Google Scholar] [CrossRef] [PubMed]
  31. Katsel, P.; Li, C.; Haroutunian, V. Gene expression alterations in the sphingolipid metabolism pathways during progression of dementia and Alzheimer’s disease: A shift toward ceramide accumulation at the earliest recognizable stages of Alzheimer’s disease? Neurochem. Res. 2007, 32, 845–856. [Google Scholar] [CrossRef] [PubMed]
  32. Shin, J.; Xie, D.; Zhong, X.P. MicroRNA-34a enhances T cell activation by targeting diacylglycerol kinase ζ. PLoS ONE 2013, 8, e77983. [Google Scholar] [CrossRef] [PubMed]
  33. Sarkar, S.; Jun, S.; Rellick, S.; Quintana, D.D.; Cavendish, J.Z.; Simpkins, J.W. Expression of microRNA-34a in Alzheimer’s disease brain targets genes linked to synaptic plasticity, energy metabolism, and resting state network activity. Brain Res. 2016, 1646, 139–151. [Google Scholar] [CrossRef] [PubMed]
  34. Goto, K.; Hozumi, Y.; Nakano, T.; Saino, S.S.; Kondo, H. Cell biology and pathophysiology of the diacylglycerol kinase family: Morphological aspects in tissues and organs. Int. Rev. Cytol. 2007, 264, 25–63. [Google Scholar] [PubMed]
  35. Tsuchiya, R.; Tanaka, T.; Hozumi, Y.; Nakano, T.; Okada, M.; Topham, M.K.; Iino, M.; Goto, K. Downregulation of diacylglycerol kinase ζ enhances activation of cytokine-induced NF-κB signaling pathway. Biochim. Biophys. Acta 2015, 1853, 361–369. [Google Scholar] [CrossRef] [PubMed]
  36. Mérida, I.; Arranz-Nicolás, J.; Rodríguez-Rodríguez, C.; Ávila-Flores, A. Diacylglycerol kinase control of protein kinase, C. Biochem. J. 2019, 476, 1205–1219. [Google Scholar] [CrossRef] [PubMed]
  37. Brose, N.; Betz, A.; Wegmeyer, H. Divergent and convergent signaling by the diacylglycerol second messenger pathway in mammals. Curr. Opin. Neurobiol. 2004, 14, 328–340. [Google Scholar] [CrossRef] [PubMed]
  38. Muraleedharan, A.; Rotem-Dai, N.; Strominger, I.; Anto, N.P.; Isakov, N.; Monsonego, A.; Livneh, E. Protein kinase C eta is activated in reactive astrocytes of an Alzheimer’s disease mouse model: Evidence for its immunoregulatory function in primary astrocytes. Glia 2021, 69, 697–714. [Google Scholar] [CrossRef] [PubMed]
  39. Cai, Q.Y.; Liu, X.L.; Zhang, X.Q.; Liu, Y.X.; Li, M.; Zhao, C.Z.; Zhang, X.M.; Meng, Q.H. Anti-neuroinflammation activity of acetylpuerarin mediated by a PKC-delta-dependent caspase signaling pathway: In vivo and in vitro studies. Pharmazie 2016, 71, 575–582. [Google Scholar] [PubMed]
  40. Morimoto, K.; Horio, J.; Satoh, H.; Sue, L.; Beach, T.; Arita, S.; Tooyama, I.; Konishi, Y. Expression profiles of cytokines in the brains of Alzheimer’s disease (AD) patients compared to the brains of non-demented patients with and without increasing AD pathology. J. Alzheimer’s Dis. 2011, 25, 59–76. [Google Scholar] [CrossRef] [PubMed]
  41. Leng, F.; Edison, P. Neuroinflammation and microglial activation in Alzheimer disease: Where do we go from here? Nat. Rev. Neurol. 2021, 17, 157–172. [Google Scholar] [PubMed]
  42. Kok, F.K.; van Leerdam, S.L.; de Lange, E.C.M. Potential Mechanisms Underlying Resistance to Dementia in Non-Demented Individuals with Alzheimer’s Disease Neuropathology. J. Alzheimer’s Dis. 2022, 87, 51–81. [Google Scholar] [PubMed]
  43. Armstrong, R.A. beta-Amyloid (A beta) deposition in elderly non-demented patients and patients with Alzheimer’s disease. Neurosci. Lett. 1994, 178, 59–62. [Google Scholar] [CrossRef] [PubMed]
  44. Langui, D.; Probst, A.; Ulrich, J. Alzheimer’s changes in non-demented and demented patients: A statistical approach to their relationships. Acta Neuropathol. 1995, 89, 57–62. [Google Scholar] [CrossRef] [PubMed]
  45. Zhan, S.S.; Veerhuis, R.; Kamphorst, W.; Eikelenboom, P. Distribution of beta amyloid associated proteins in plaques in Alzheimer’s disease and in the non-demented elderly. Neurodegeneration 1995, 4, 291–297. [Google Scholar] [CrossRef] [PubMed]
  46. Armstrong, R.A. Beta-amyloid deposition in the medial temporal lobe in elderly non-demented brains and in Alzheimer’s disease. Dementia 1995, 6, 121–125. [Google Scholar] [CrossRef] [PubMed]
  47. Jansen, W.J.; Ossenkoppele, R.; Knol, D.L.; Tijms, B.M.; Scheltens, P.; Verhey, F.R.; Visser, P.J.; Amyloid Biomarker Study Group; Aalten, P.; Aarsland, D.; et al. Prevalence of cerebral amyloid pathology in persons without dementia: A meta-analysis. JAMA 2015, 313, 1924–1938. [Google Scholar] [CrossRef] [PubMed]
  48. Wood, P.L. Lipidomics of Alzheimer’s disease: Current status. Alzheimer’s Res. Ther. 2012, 4, 5. [Google Scholar] [CrossRef] [PubMed]
  49. Semikasev, E.; Ahlemeyer, B.; Acker, T.; Schänzer, A.; Baumgart-Vogt, E. Rise and fall of peroxisomes during Alzheimer’s disease: A pilot study in human brains. Acta Neuropathol. Commun. 2023, 11, 80. [Google Scholar] [CrossRef] [PubMed]
  50. Cordeiro, Q.; Noguti, R.; Bottino, C.M.; Vallada, H. Study of association between genetic polymorphisms of phospholipase A2 enzymes and Alzheimer’s disease. Arq. Neuropsiquiatr. 2010, 68, 189–193. [Google Scholar] [CrossRef] [PubMed]
  51. Wirth, M.; Villeneuve, S.; Haase, C.M.; Madison, C.M.; Oh, H.; Landau, S.M.; Rabinovici, G.D.; Jagust, W.J. Associations between Alzheimer disease biomarkers, neurodegeneration, and cognition in cognitively normal older people. JAMA Neurol. 2013, 70, 1512–1519. [Google Scholar] [CrossRef] [PubMed]
  52. Wood, P.L.; Cebak, J.E. Lipidomics Biomarker Studies: Errors, Limitations, and the Future. Biochem. Biophys. Res. Comm. 2018, 504, 569–575. [Google Scholar] [CrossRef] [PubMed]
  53. Ge, J.; Du, S.; Yao, S.Q. Bifunctional Lipid-Derived Affinity-Based Probes (AfBPs) for Analysis of Lipid-Protein Interactome. Acc. Chem. Res. 2022, 55, 3663–3674. [Google Scholar] [CrossRef] [PubMed]
  54. Fedoryshchak, R.O.; Gorelik, A.; Shen, M.; Shchepinova, M.M.; Pérez-Dorado, I. Tate EW Discovery of lipid-mediated protein-protein interactions in living cells using metabolic labeling with photoactivatable clickable probes. Chem. Sci. 2023, 14, 2419–2430. [Google Scholar] [CrossRef] [PubMed]
  55. Brehme, M.; Vidal, M. A global protein-lipid interactome map. Mol. Syst. Biol. 2010, 6, 443. [Google Scholar] [CrossRef] [PubMed]
  56. Chernomordik, L. Non-bilayer lipids and biological fusion intermediates. Chem. Phys. Lipids 1996, 81, 203–213. [Google Scholar] [CrossRef] [PubMed]
  57. Epand, R.M. Lipid polymorphism and protein-lipid interactions. Biochim. Biophys. Acta 1998, 1376, 353–368. [Google Scholar] [CrossRef] [PubMed]
  58. Zick, M.; Stroupe, C.; Orr, A.; Douville, D.; Wickner, W.T. Membranes linked by trans-SNARE complexes require lipids prone to non-bilayer structure for progression to fusion. Elife 2014, 3, e01879. [Google Scholar] [CrossRef] [PubMed]
  59. Holz, R.W.; Zimmerberg, J. Dynamic Relationship of the SNARE Complex with a Membrane. Biophys. J. 2019, 117, 627–630. [Google Scholar] [CrossRef] [PubMed]
  60. Costa, A.S.; Guerini, F.R.; Arosio, B.; Galimberti, D.; Zanzottera, M.; Bianchi, A.; Nemni, R.; Clerici, M. SNARE Complex Polymorphisms Associate with Alterations of Visual Selective Attention in Alzheimer’s Disease. J. Alzheimer’s Dis. 2019, 69, 179–188. [Google Scholar] [CrossRef] [PubMed]
  61. Wang, Y.; Liu, X.; Zheng, P.; Xie, Q.; Wang, C.; Pang, C. Molecular Dynamics of Apolipoprotein Genotypes APOE4 and SNARE Family Proteins and Their Impact on Alzheimer’s Disease. Life 2025, 15, 223. [Google Scholar] [CrossRef] [PubMed]
  62. Sato, M.; Ueda, Y.; Umezawa, Y. Imaging diacylglycerol dynamics at organelle membranes. Nat. Methods 2006, 3, 797–799. [Google Scholar] [CrossRef] [PubMed]
  63. Eichmann, T.O.; Lass, A. DAG tales: The multiple faces of diacylglycerol--stereochemistry, metabolism, and signaling. Cell Mol. Life Sci. 2015, 72, 3931–3952. [Google Scholar] [PubMed]
  64. Leikin, S.; Kozlov, M.M.; Fuller, N.L.; Rand, R.P. Measured effects of diacylglycerol on structural and elastic properties of phospholipid membranes. Biophys. J. 1996, 71, 2623–2632. [Google Scholar] [CrossRef] [PubMed]
  65. Carrasco, S.; Mérida, I. Diacylglycerol, when simplicity becomes complex. Trends Biochem. Sci. 2007, 32, 27–36. [Google Scholar] [CrossRef] [PubMed]
Figure 1. Relative concentrations (R = lipid peak area/peak area of internal standard) of monohexosyldiacylglycerols (MHDGs) in frontal cortex gray matter, corrected for tissue weight. YC, young controls (<85 years); old controls with AD neuropathology (>85 years, NDAN); MCI, mild cognitive impairment; Red, Young Controls; Blue, NDAN; Green, MCI. All MHDG levels were elevated in MCI, p < 0.01.
Jdad 02 00020 g001
Figure 2. Relative concentrations (R = lipid peak area/peak area of internal standard) of monohexosyldiacylglycerol ethers (MHDGe) in frontal cortex gray matter, corrected for tissue weight. YC, young controls (<85 years); old controls with AD neuropathology (>85 years, NDAN); MCI, mild cognitive impairment. Lipid levels were significantly increased in MCI. *, p < 0.01.
Jdad 02 00020 g002
Figure 3. Relative concentrations (R = lipid peak area/peak area of internal standard) of DG plasmalogens (DGp) and DG ethers (DGe) in frontal cortex gray matter, corrected for tissue weight. YC, young controls (<85 years); old controls with AD neuropathology (>85 years, NDAN); MCI, mild cognitive impairment. Lipid levels were significantly increased in MCI. *, p < 0.01.
Jdad 02 00020 g003
Figure 4. Relative concentrations (R = lipid peak area/peak area of internal standard) of TGs and CE 16:0 in frontal cortex gray matter, corrected for tissue weight. YC, young controls (<85 years); old controls with AD neuropathology (>85 years, NDAN); MCI, mild cognitive impairment. Lipid levels were significantly increased in MCI. *, p < 0.01.
Jdad 02 00020 g004
Figure 5. Presentation of glycerolipid pathways. DG and MGDG sources include de novo synthesis of phosphatidic acid and/or metabolism of glycerophospholipids (PC, PE, PS). Similarly, the metabolism of alkyl-acyl glycerophospholipids can generate DGe and MGDGe. 1-AcylGP, 1-acyl-glycereolphosphate; AGPS, alkylglycerolphosphate synthase; 1-AlkylGP, 1-alkyl-glycerolphosphate; AGPAT, acylglycerol-3-phosphate acyltransferase; ATX, autotaxin (lysophospholipase D); CDPPT, CDP-diacylglycerol-inositol/glycerol phosphatidyltransferase; CEPT, choline and ethanolamine phosphotransferases; CL, cardiolipin; DAGL, diacylglycerol lipase; DG, diacylglycerol; DGe, alkyl-acyl glycerol; DGAT, diacylglycerol acyltransferase; DHAP, dihydroxyacetone phosphate; DGK, diacylglycerol kinase; FA, fatty acid; G-3-P, glycerol-3-phosphate; GalT, galactosyltransferase; GPAT, glycerol-3-phosphate acyltransferase; GPL, glycerophospholipid; HSL, hormone-sensitive lipase; LPA, lysophosphatidic acid; LPAT, lysophospholipid acyltransferase; LPL, lipoprotein lipase; MGDG, monogalactosyl-DG; MGDGe, monogalactosyl-alkyl-acyl glycerol; PA, phosphatidic acid; PAP, phosphatidic acid phosphatase; PC, phosphatidylcholines; PE, phosphatidylethanolamine; PG, phosphatidylglycerol; PI, phosphatidylinositol; PLA2, phospholipase A2; PLC, phospholipase C; PLD, phospholipase D; PCT, phosphatidic acid cytidyltransferase; PS, phosphatidylserine; TAG, triacylglycerol; TAGL triacylglycerol lipase.
Jdad 02 00020 g005
Table 1. Subject demographics. The same tissue samples were used in a prior study [1,2], enabling direct comparison of findings.
GroupNAgePMI (hr)M/FBrak Score
Young Control (YC; <85 years)1465.1 ± 10.726.4 ± 16.78/60
NDAN (Old controls, OC; >85)891.5 ± 4.219.4 ± 15.54/42–4
MCI1489.3 ± 6.912.9 ± 11.64/103–6
Table 2. Lipid composition, exact masses, and monitored ions of lipid families in this study.
LipidExact Mass[M+NH4]+
CE 16:0624.5845642.6183
LipidExact Mass[M+NH4]+
TG 50:1 (16:0/16:0/18:1)832.7519850.7858
TG 52:1 (16:0/18:0/18:1)860.7833878.8176
TG 52:2 (16:0/18:1/18:1)858.7676876.8014
TG 52:3 (16:0/18:1.18:2)856.7519874.7858
TG 54:5 (18:2/18:2/18:1; 16:0/18:1/20:4)880.7519898.7858
LipidExact Mass[M+NH4]+
DGp 34:0 (18:0/16:0)580.5431598.5769
DGp 36:1 (18:0/18:1)606.5587624.5925
DGp 36:2 (18:1/18:1)604.5431622.5769
DGe (20:0/20:4)658.5900676.6238
LipidExact Mass[M+Cl]
MHDG 32:0 (16:0/16:0)730.5595765.5293
MHDG 34:2 (16:0/18:2)754.5595789.5293
MHDG 36:1 (18:0/18:1)784.6065819.5763
MHDG 36:2 (18:0/18:2)792.5908817.5606
LipidExact Mass[M+Cl]
MHDGe 32:2712.5489747.5188
MHDGe 32:3710.5333745.5031
MHDGe 34:1742.5959777.5657
MHDGe 34:3738.5646773.5344
MHDGe 36:2768.6115803.5814
MHDGe 36:3766.5959801.5657
MHDGe 36:5763.5646797.5344
MHDGe 36:6760.5499795.5188
Disclaimer/Publisher’s Note: The statements, opinions and data contained in all publications are solely those of the individual author(s) and contributor(s) and not of MDPI and/or the editor(s). MDPI and/or the editor(s) disclaim responsibility for any injury to people or property resulting from any ideas, methods, instructions or products referred to in the content.

