1. Introduction
Lithium-ion batteries offer an excellent set of characteristics, such as high energy density, long service life, high efficiency and decreasing cost [
1,
2]. Thus, their potential for reducing greenhouse gas emissions of the transport sector and buffer renewable energy is huge [
3,
4]. Constant development further pushes persisting limitations whereby the adherence to thermal limits is crucial [
5]. For doing so, various thermal simulations exist to precisely predict the thermal behavior of lithium-ion cells [
6,
7,
8]. Including different thermal management designs, a precise set of input parameters is essential for an exact state estimation [
9,
10].
In particular, the specific heat capacity is of high importance for the thermal management design of lithium-ion batteries [
11]. Basically describing the thermal budget of a battery cell, the specific heat capacity relates an amount of energy transfer to a defined temperature change. Thus, it defines the amount of heat required until a battery cell exceeds thermal limits during a high-performance scenario. Furthermore, it is also associated with the required cooling power during operation and it specifies the energy required to heat a battery cell to a defined state in cold environment scenarios [
12]. Due to its significant impact on the thermal behavior of lithium-ion cells, the specific heat capacity has been widely researched. As extensively summarized by Steinhardt et al. [
13], varying heat capacity measurement data on the individual material, jelly roll, or full cell level exist. However, the presented data scatter strongly and the identification of clear trends and correlations is difficult. Furthermore, the analytical prediction of the full cell specific heat capacity with mass fractions and specific heat capacities of constituting materials was never validated on a full cell level. In addition, parametric influences on the specific heat capacity of full cells often show opposing trends. Finally, very complex measurement setups involving expensive equipment and devices are often utilized. Thus, specific heat capacity measurements are not always widely available and can not be easily performed in standard laboratory environments.
On the one hand, the summary of Steinhardt et al. [
13] indicates that the
cell format plays an important role for the specific heat capacity. While cylindrical cells show a median heat capacity of
, the median heat capacity of prismatic and pouch cells is
and
higher, respectively. However, various chemistries with different measurement approaches are compared which complicate detailed comparisons.
On the other hand, the exact influence of
cell chemistry on the specific heat capacity remains unclear. While the heat capacity of the housing materials and the current collectors are easily accessible and widely available in the literature, the values for the anode, cathode, and separator are heterogeneous [
13]. Although different material compositions and electrolytes can explain some inconsistencies, the utilization of individual material heat capacities to assess the full cell heat capacity remains widely unexplored.
Moreover, the effect of
temperature on the full cell specific heat capacity of lithium-ion cells shows divergent characteristics. As depicted in
Figure 1a, most references report a positive correlation between specific heat capacity and temperature [
9,
11,
14,
15,
16,
17,
18,
19,
20,
21,
22,
23,
24]. While the increase ranges between
and
[
15,
21], Ruan et al. [
19] and Jaguemont et al. [
25] present a negative correlation or a constant specific heat capacity, respectively. However, it is not understood where such deviations of temperature influence come from and the general prediction of a temperature-dependent heat capacity is difficult.
Next, the influence of
state of charge (SOC) on the specific heat capacity is depicted in
Figure 1b. It is noteworthy that the variation over the full SOC range is significantly smaller than that for temperature. However, the discrepancy between the individual dependencies is remarkable. While there exist linear [
10,
15,
16,
21,
26,
27,
28,
29] as well as parabolic correlations [
20,
30], their magnitude ranges from
[
29] to
[
20] over the full SOC-range. Again, their exists no clear trend and neither cell chemistry nor cell format further clarify the presented parametric effects.
Finally, the relationship between specific heat capacity and
state of health (SOH) was only analyzed by Geder et al. [
31]. Analyzing five different cylindrical cells with varying aging intensities, no significant decline in specific heat capacity was found for any of the cells. However, since only one specific cell was examined, the general validity and transferability to other cells remains unclear.
Hence, this article addresses different influences on the specific heat capacity and aims to increase the understanding of the specific heat capacity for various cells. Therefore, an innovative measurement approach of Mertin [
32] is employed in order to provide a widely accessible and simple measurement setup for quantifying the specific heat capacity of lithium-ion cells. Being the key focus of this work, the parametric influences are analyzed in detail and full cell measurement data are compared to analytical predictions for the first time ever. In detail, this results in four subjects that will be analyzed in the following article:
Analysis of analytical calculation of specific heat capacities;
Influence of cell format and housing material on the specific heat capacity;
Effect of cell chemistry on the specific heat capacity;
Parametric effects of temperature, SOC, and SOH on the specific heat capacity.
The remainder of this article is structured as follows:
Section 2 briefly presents the thermodynamic basics as well as a summary of the measurement setup. Validation and measurement accuracy estimation is described before utilized sample cells are introduced. Next, the third section presents the results regarding various parametric influences and analytical prediction. Therefore, measurement results are presented and assessed. Furthermore, the collected experimental data are compared to analytical calculations to assess the applicability of predictive approaches for the specific heat capacity. Finally,
Section 4 gives a conclusion and states the potential for future work.
2. Experimental
The following sections will give an overview of the measurement setup as presented by Mertin [
32] for quantifying the specific heat capacity of lithium-ion cells and describe the employed sample cells. First, the thermodynamic background for battery heating and cooling is explained. Next, the measurement setup as well as the design of experiments is illustrated. Then, its accuracy and validation measurements are evaluated whereby theoretical and experimental data are analyzed. Finally, the sample cells utilized for assessing the parametric influences are presented with regard to their format, chemistry and capacity.
2.1. Thermodynamic Theory for Battery Heating and Cooling
During the heating of a battery cell, the arbitrarily generated heat
is partially stored inside the cell and partially removed due to cooling. While the heat capacity
C describes the amount of heat required to increase or decrease the cell temperature, the thermal resistance
characterizes the ability to withstand the creation of a thermal equilibrium when a temperature difference between the cell and the surrounding exists. Consequently, the process of heating a battery cell can be described as
whereby
is the constant ambient temperature and
is the cell temperature. When the steady state is reached, the cell temperature no longer increases, therefore the heat capacity becomes obsolete. Hence, the steady state heat balance is
Following this, the heat generation is turned off and the cell temperature starts to decrease. The cooling of a battery cell is then described as
In detail, the solution for the temperature curve in Equation (
3) can be modeled as
with
being the steady state cell temperature and
being the thermal time constant. Since the generated heat is zero, the speed of cooling down only depends on the heat capacity and the thermal resistance, which are related through the time constant defined as
Since , and can be measured and can be defined once the generated heat and the temperature delta between the cell and the surrounding is known, the only unknown parameter in the above equations is the heat capacity C. Utilizing this fundamental correlations of heat transfer in lithium-ion cells, a simple but precise measurement setup can be created.
2.2. Measurement Setup
By making use of the above defined equations of heat transfer, only few temperature measurements in combination with a defined electric heating are required for the determination of the heat capacity of a lithium-ion cell. As the measurement approach is thoroughly presented in Ref. [
32] in detail, the following paragraphs will summarize the setup and give an overview of the most important steps. In contrast to existing measurement setups, the measurement setup as presented by Mertin [
32] is inexpensive, widely available, and not restricted to individual cell formats and geometries. In order to precisely monitor the cell temperature, several PT100 temperature sensors are placed on the surface of a sample cell with thermally conductive paste as shown in
Figure 2. Being of small size and high precision, they allow for a precise temperature measurement without acting as a significant heat sink. By choosing multiple locations on the cell surface, the average cell temperature can thus be approximated. The sensors are placed across all dimensions of the cell in order to precisely monitor the temperatures at various cell locations. A special focus is placed on the central parts as well as the extreme areas at the cell side, the cell top and bottom including the surface close to he terminals. Furthermore, the terminals of the cell are contacted with cable lugs to enable a charging and discharging of the cell. For establishing a constant and defined cooling behavior, the cell is wrapped in a low thermal conductivity isolation material with a low thermal conductivity of
= 0.038
[
33]. This limits the heat transfer due to conduction and convection and leads to a predictable heating and cooling behavior of the cell for each measurement run. Next, a temperature sensor is placed beside the cell assembly to monitor the ambient temperature. Finally, the setup is placed inside a climate chamber with a fan to establish a constant ambient temperature.
For generating heat inside the cell, a pulsing charge and discharge current is used. As seen in
Figure 3a, alternating charge and discharge pulses with a duration of 4 s each are applied to the cell. Currents are chosen such that the induced thermal increase can be accurately measured while not exceeding common operating ranges. Since equal amounts of charge are first added and then removed, the SOC is not modified. Due to overvoltages, the cell voltage follows a distinct alternating slope which is illustrated in
Figure 3b. However, as the inner resistance and thus the voltage of the cell are temperature-dependent, the electric power and the generated heat is not constant but rather converges once the steady state is reached as displayed in
Figure 3d. Hence, the generated heat in Equations (1) and (2) can be assumed to be only caused by the inner cell resistance and the resulting overvoltages as the heat generation for higher currents is dominated by joule heating. Therefore, the pulse current
and
as well as the cell voltage
and
during charge and discharge can be related to the generated heat as
Thereby the generated heat inside the cell equals to the difference between the electrical input power and the electrical output power. Hence, the SOC of the cell remains constant even though more power is fed into the cell than extracted. This is caused by the inner resistance of the cell which converts a fraction of the electrical input energy into heat which increases the cell temperature. In consequence, the heat capacity of a lithium-ion cell can be calculated according to
whereby only three parameters are required. Although being dependent on temperature, the thermal resistance
is assumed to be constant for a measurement due to the low temperature increase in one measurement step.
As shown in
Figure 3c, the temperature of the ambient as well as the average cell temperature are recorded. The ambient temperature is increased stepwise for determining the temperature dependence of the heat capacity of the cell. Following this, the current pulsing always starts after the cell temperature has equalized to the set ambient temperature. Accounting for the temperature difference between the cell casing and the jelly roll, the determined temperature delta between the average cell temperature and the ambient temperature is fed into Equation (
7). In combination with the steady state power as displayed in
Figure 3d,
can be calculated. The characteristic temperature decline follows an exponential slope and thus Equation (
4) can be fitted to the recorded measurement data. As a result, the time constant of the cooling phase
can be obtained as a fitting parameter as displayed in
Figure 3e. Finally, it is possible to determine the heat capacity of the assembly by dividing the time constant
by the thermal resistance
as defined in Equation (
7). The resulting heat capacities can be found in
Figure 3f. Finally, the heat capacity of the cell can be transferred to the specific heat capacity by dividing the obtained cell heat capacity by the cell mass.
In conclusion, the presented measurement setup of Mertin [
32] offers a simple but accurate method to determine the heat capacity of lithium-ion cells. Essentially incorporating elements of the measurement approaches of Bryden et al. [
34] and Steinhardt et al. [
35], the major benefits are the simple measurement setup, which does not require any fans, electric heaters, or sophisticated isolation calorimeter containers. In addition, no maximum charge and discharge currents are required which makes expensive battery testers obsolete. Sample cells are subject to lower loads and only one measurement run is needed. By a simple variation of the ambient temperature and the SOC, the temperature- and SOC-dependent heat capacity can be determined.
2.3. Sample Cells
In order to analyze the different parametric influences on the specific heat capacity of pristine lithium-ion cells, four different cells are selected. Being one pouch cell, one prismatic cell and two cylindrical cells, all common cell formats are covered. On the one hand, cell #1 consists of a blended NCM111/NCM622 cathode with a graphite anode. It has and is designed for high-performance automotive applications. Cells #2, #3 and #4 consist of different high-nickel NCM cathodes. Furthermore, they have different anode chemistries with a graphite/silicon-oxide compound whereby the mass fraction of the graphite is strongly dominant. While cell #2 represents a large-format automotive prismatic cell with a characteristic aluminum housing, cell #3 is a cylindrical cell with aluminum housing. Finally, cell #4 is a larger-format cylindrical cell with a steel housing.
Furthermore, the influence of aging on the specific heat capacity is analyzed by utilizing four cells equal to cell #1. However, all of them have different SOHs. Being
,
,
and
, the varying aging intensities of cell #1, cell #1a, cell #1b and cell #1c can be examined, respectively. By selecting a variation of SOHs, a representative set for characterizing the operation before end-of-life with
SOH is reached is employed. The aged sample cells experienced realistic load cycles with varying temperature, SOC limits as well as charging powers. Being characterized by a varying intensity of different aging mechanisms, the underlying cell aging describes representative degradation in serial operation. For further information, the reader is referred to previous work [
36] where it is extensively presented.
2.4. Measurement Accuracy and Validation
For assessing the measurement accuracy of the presented measurement approach three different validations are performed. They are Gaussian error propagation, reference measurements, and repetitive measurements; absolute precision as well as the influence of reassembly are characterized.
First, the value of all relevant parameters in Equation (
7) is quantified. Following, the error of each individual parameter measurement is defined as summarized in
Table 1. While all values in the third column are extracted from
Figure 3, the corresponding inaccuracies require individual determination. Although temperature can be precisely recorded, the multiple locations of the temperature sensors on the cell housing and thermal inhomogeneity lead to the assumption of
error. Next, the inaccuracy of electric input power is comparably low. As input current and cell voltage are precisely monitored with a Basytec HPS [
37] and a Keithley 3706A [
38], the uncertainty is determined to be
. Finally, the error of specifying the time constant is assumed to be
. Though, this assumption is very conservative since goodness of fits of more than
are achieved during the fitting of exponential curves to the cooling phase. Then, the individual parameters can be inserted into it
whereby
is the set of input parameters for Equation (
7) and
represents the individual uncertainties for each parameter [
39]. Hence, the resulting inaccuracy of the presented measurement setup amounts to
.
Being in a reasonable range, the theoretically determined uncertainty is compared to reference measurements. Therefore, the heat capacity of cell #3 is measured inside an EV-ARC and inside a liquid calorimeter. On the one hand, the cell’s heat capacity inside the EV-ARC is measured between
and
. Amounting to
[
6], the value can be compared to liquid calorimetry. Utilizing water, the temperature increase of a defined water volume due to a heated cell is recorded inside the vacuum-based calorimeter. Amounting to
, a deviation of
between the EV-ARC and the liquid calorimeter is observed. Finally, the specific heat capacity of cell #3 is measured as presented in the previous section. Since the measured value is
, only a small deviation of less than
between the reference measurements and the developed measurement approach can be observed. Therefore, the theoretically determined inaccuracy of less than
is confirmed, especially when considering the uncertainties of EV-ARC and liquid calorimetry measurements.
For analyzing the reproducibility of the measurement setup, the heat capacity of cell #3 is consecutively measured four times without reassembly. Showing a standard deviation of only , the reproducibility is very high. Furthermore, the influence of reassembly is quantified by performing four repetitive measurements including reassembly. Although the standard deviation increases to , the influence of assembly is not significant. Lastly, the specific heat capacity of four cells equal to cell #1 is measured. Since all cells stem from the same production batch and are nearly identical, the low standard deviation of again indicates the high reproducibility of the presented measurement approach.
In summary, the described measurement setup shows reproducible and precise results. While all reference measurements agree well to the experimental data, experiments without reassembly show a very high reproducibility. Even though reassembly slightly increases the inaccuracy, the developed measurement approach can determine the specific heat capacity with an uncertainty below . However, for measurement series without reassembly the relative uncertainty is lower as the presented five percent.
3. Results and Discussion
The following sections present the results of the specific heat capacity analysis in detail. First, an analytical approach for calculating the specific heat capacity is presented and resulting values are compared to experimental data. Then, the influence of the cell format is analyzed by characterizing the effect of varying casings and individual materials. Next, the effect of different chemistries and corresponding compositions is described. Following this, the influence of temperature and SOC is characterized. Thus, the specific heat capacity of the four sample cells is measured at different temperatures and SOCs before dependencies can be formulated. Finally, the influence of aging on the specific heat capacity is assessed by examining four similar cells with varying SOHs between and .
3.1. Analytical Prediction of Specific Heat Capacity of Lithium-Ion Cells
As the measurement of the specific heat capacity of lithium-ion cells can be challenging and requires additional effort, it is desired to calculate specific heat capacities replacing complex experiments. One approach to performing this is the analytical calculation of the cell’s specific heat capacity as presented by Chen et al. [
40]. Based on the individual material characteristics and mass fraction, the specific heat capacity of lithium-ion cells can be determined by analytical summation of individual material heat capacities. As detailed information about the material composition is available for cell #1 and cell #3, their specific heat capacity can be calculated as it
whereby
represents the individual specific heat capacity of the materials found inside the cell as summarized in
Table 2. As
denotes the corresponding mass fraction, the resulting specific heat capacity of the cell can be determined. Although being frequently utilized in the literature [
40,
41], the analytical calculation of specific heat capacity has never been validated by comparing analytical calculations to experimental data. Shown in
Table 3, the measured full cell specific heat capacity is compared to the analytically predicted cell specific heat capacity for cell #1 and cell #3.
It can be observed that both analytically calculated specific heat capacities match with the measured values. As both experimentally determined values have a measurement uncertainty of about
, the agreement between measurement and analytically predicted specific heat capacity is significant and the analytically predicted full cell heat capacities agree well with the experimentally determined values. Even though the literature material’s specific heat capacities are selected, the resulting cell heat capacity is plausible. Furthermore, the dependencies of the specific heat capacity on temperature, SOC and SOH are not considered by the analytical prediction still giving a good approximation. Hence, the existing and commonly utilized approach of analytically predicting the specific heat capacity of full cells only by employing the literature material’s heat capacities and geometric information is validated for the first time. Although Loges et al. [
14] analyzed the prediction of the specific heat capacity on a unit cell level, this is the first validation on a full cell level whereby the availability of geometric cell information is of high importance.
3.2. Effect of Cell Format on the Specific Heat Capacity
In order to analyze the influence of different cell formats on the specific heat capacity of lithium-ion cells, the four sample cells described in
Table 4 are examined. Therefore, their specific heat capacity is measured at
and
SOC. Depicted in
Table 5, the varying resulting specific heat capacity of the sample cells can be observed.
Table 5 clearly indicates that the specific heat capacity of the pouch cell #1 is lower than for the prismatic cell #2. Being
in contrast to
, a difference of
exists. Furthermore, the cylindrical cells have an even lower specific heat capacity than the other cells. Amounting to
and
, cell #3 and cell #4 have a
to
lower specific heat capacity compared to the prismatic cell #2. Since cell #4 has a steel housing, its very low specific heat capacity can be explained by the low specific heat capacity of SPCC steel. On the one hand, this trend is in perfect agreement to the analysis presented by Steinhardt et al. [
13]. They concluded that
due to the mass fraction and specific heat capacity of the cell housing. On the other hand, they found that pouch cells have the highest specific heat capacity. Even though, the specific heat capacity of the pouch foil of cell #1 is remarkably higher than aluminum used for prismatic or cylindrical cell housings, it does not show the highest cell specific heat capacity in
Table 5.
Although the cell housing and its material can partly explain the observed difference in cell-specific heat capacity, the fifth column in
Table 5 indicates further inconsistencies. When calculating the jelly roll specific heat capacity according to
it is noteworthy that the jelly roll heat capacity behaves equally to the cell heat capacity meaning
. However, as those values are already compensated for the cell housing, the actual heat capacity of the jelly roll seems to be different for the individual cell formats. This can be caused by varying cell chemistry, different electrolyte compositions or varying layer thicknesses. Even when considering the measurement uncertainty of around 5% when comparing different cells, their variation in jelly roll specific heat capacity can still not be explained fully. Thus, the mentioned effects will be analyzed in detail in the following subsection.
In summary, the specific heat capacity of the analyzed prismatic cell is larger as for the pouch cell while cylindrical cells show the lowest specific heat capacity. This can be explained by the varying mass fractions of the individual cell casings as well as the specific heat capacity of the cell casing material. However, these two effects can not fully explain the large discrepancies between the specific heat capacities demanding further analysis on a material level.
3.3. Effect of Cell Chemistry on the Specific Heat Capacity
As stated in the previous section, different jelly rolls have a non-uniform heat capacity. This is supposed to be the consequence of the different materials utilized as well as the different mass fractions of the constituting materials.
On the one hand,
Table 2 gives an overview of the specific heat capacities of the individual materials inside the jelly roll.
and
are widely available and extracted from Pegel et al. [
6]. In contrast, the values for the active material are more diverse and did not experience as much analysis as common metals. Though, Loges et al. [
14] conducted a comprehensive study on several cells and analyzed constituting materials. Hence, median values from multiple cells presented by Loges et al. [
14] are utilized in the following. First, it can be seen that the specific heat capacity of anode and cathode is equal. With a value of
it is moderately lower as the jelly roll or cell specific heat capacity. Since all negative electrodes analyzed in Ref. [
14] are graphite anodes, the scattering of their specific heat capacity is very low. In contrast, positive electrodes are made of NCM, LCO or NCA and thus show a scattering of about
. Similar observations can be made for the specific heat capacity of the separator. Although the median value amounts to
, a scattering of
is found for different cells. Finally, the specific heat capacity of the electrolyte is comparably high with a median of
. While Loges et al. [
14] report consistent values around the median, Chen et al. [
40] measured a value of
. As no possible explanations for such discrepancies are given, a rather high uncertainty exists when choosing literature specific heat capacities for anode, cathode, separator and electrolyte when their exact composition is unknown. Nevertheless, clear levers for increasing or decreasing the jelly roll specific heat capacity can be identified. While the separator and the electrolyte are excellent materials to increase the jelly roll specific heat capacity, copper proves to strongly reduce the overall specific heat capacity.
First, the cell chemistry of cell #1 matches the chosen literature values very well. Having a NCM622/NCM111 blend a cathode and a graphite anode, it corresponds to the analyzed cells by Loges et al. [
14]. On the contrary, cell #3 has a high-nickel NCM cathode with a silicon-oxide/graphite composite anode. As both materials are comparably new, they do not perfectly match the cells analyzed by Loges et al. [
14]. Hence, the chosen anode and cathode specific heat capacities in
Table 2 are likely to be non-ideal for the analyzed cell.
When comparing both cells, cell #1 has a significantly higher mass fraction of electrolyte and separator compared to cell #3. This is the main reason why its predicted specific heat capacity is about higher as for cell #3. However, this also has an adverse effect on the energy density. Cell #3 has a remarkably higher gravimetric energy density than cell #1, due to the lower relative mass of the electrolyte and the separator. Therefore, a clear trade-off between energy density and specific heat capacity is identified.
While it is difficult to precisely predict the specific heat capacity of active materials due to their complexity and utilized additives, the composition of the electrolyte allows for calculating a predictive heat capacity. Since electrolyte commonly is a mixture of ethylene carbonate (EC), dimethyl carbonate (DMC), ethylmethyl carbonate (EMC) and LiPF
6 [
42], its specific heat capacity can be calculated as the sum of its components as described in Equation (
9). Due to the low mass fraction of the lithium salt, it can be neglected for the calculation of the specific heat capacity of the electrolyte. Being
,
and
[
43,
44,
45], the chosen median literature value of
in
Table 2 seems to be plausible. However, when high mass fractions of EMC or DMC are utilized, a higher specific heat capacity for the electrolyte is expected. Thus, the composition of the electrolyte allows for calculating its specific heat capacity according to the mixture between EC, DMC and EC. Detailed measurements of material specific heat capacities need to be performed in future work in order to analytically predict the specific heat capacity even more precisely.
3.4. Effect of Temperature on the Specific Heat Capacity
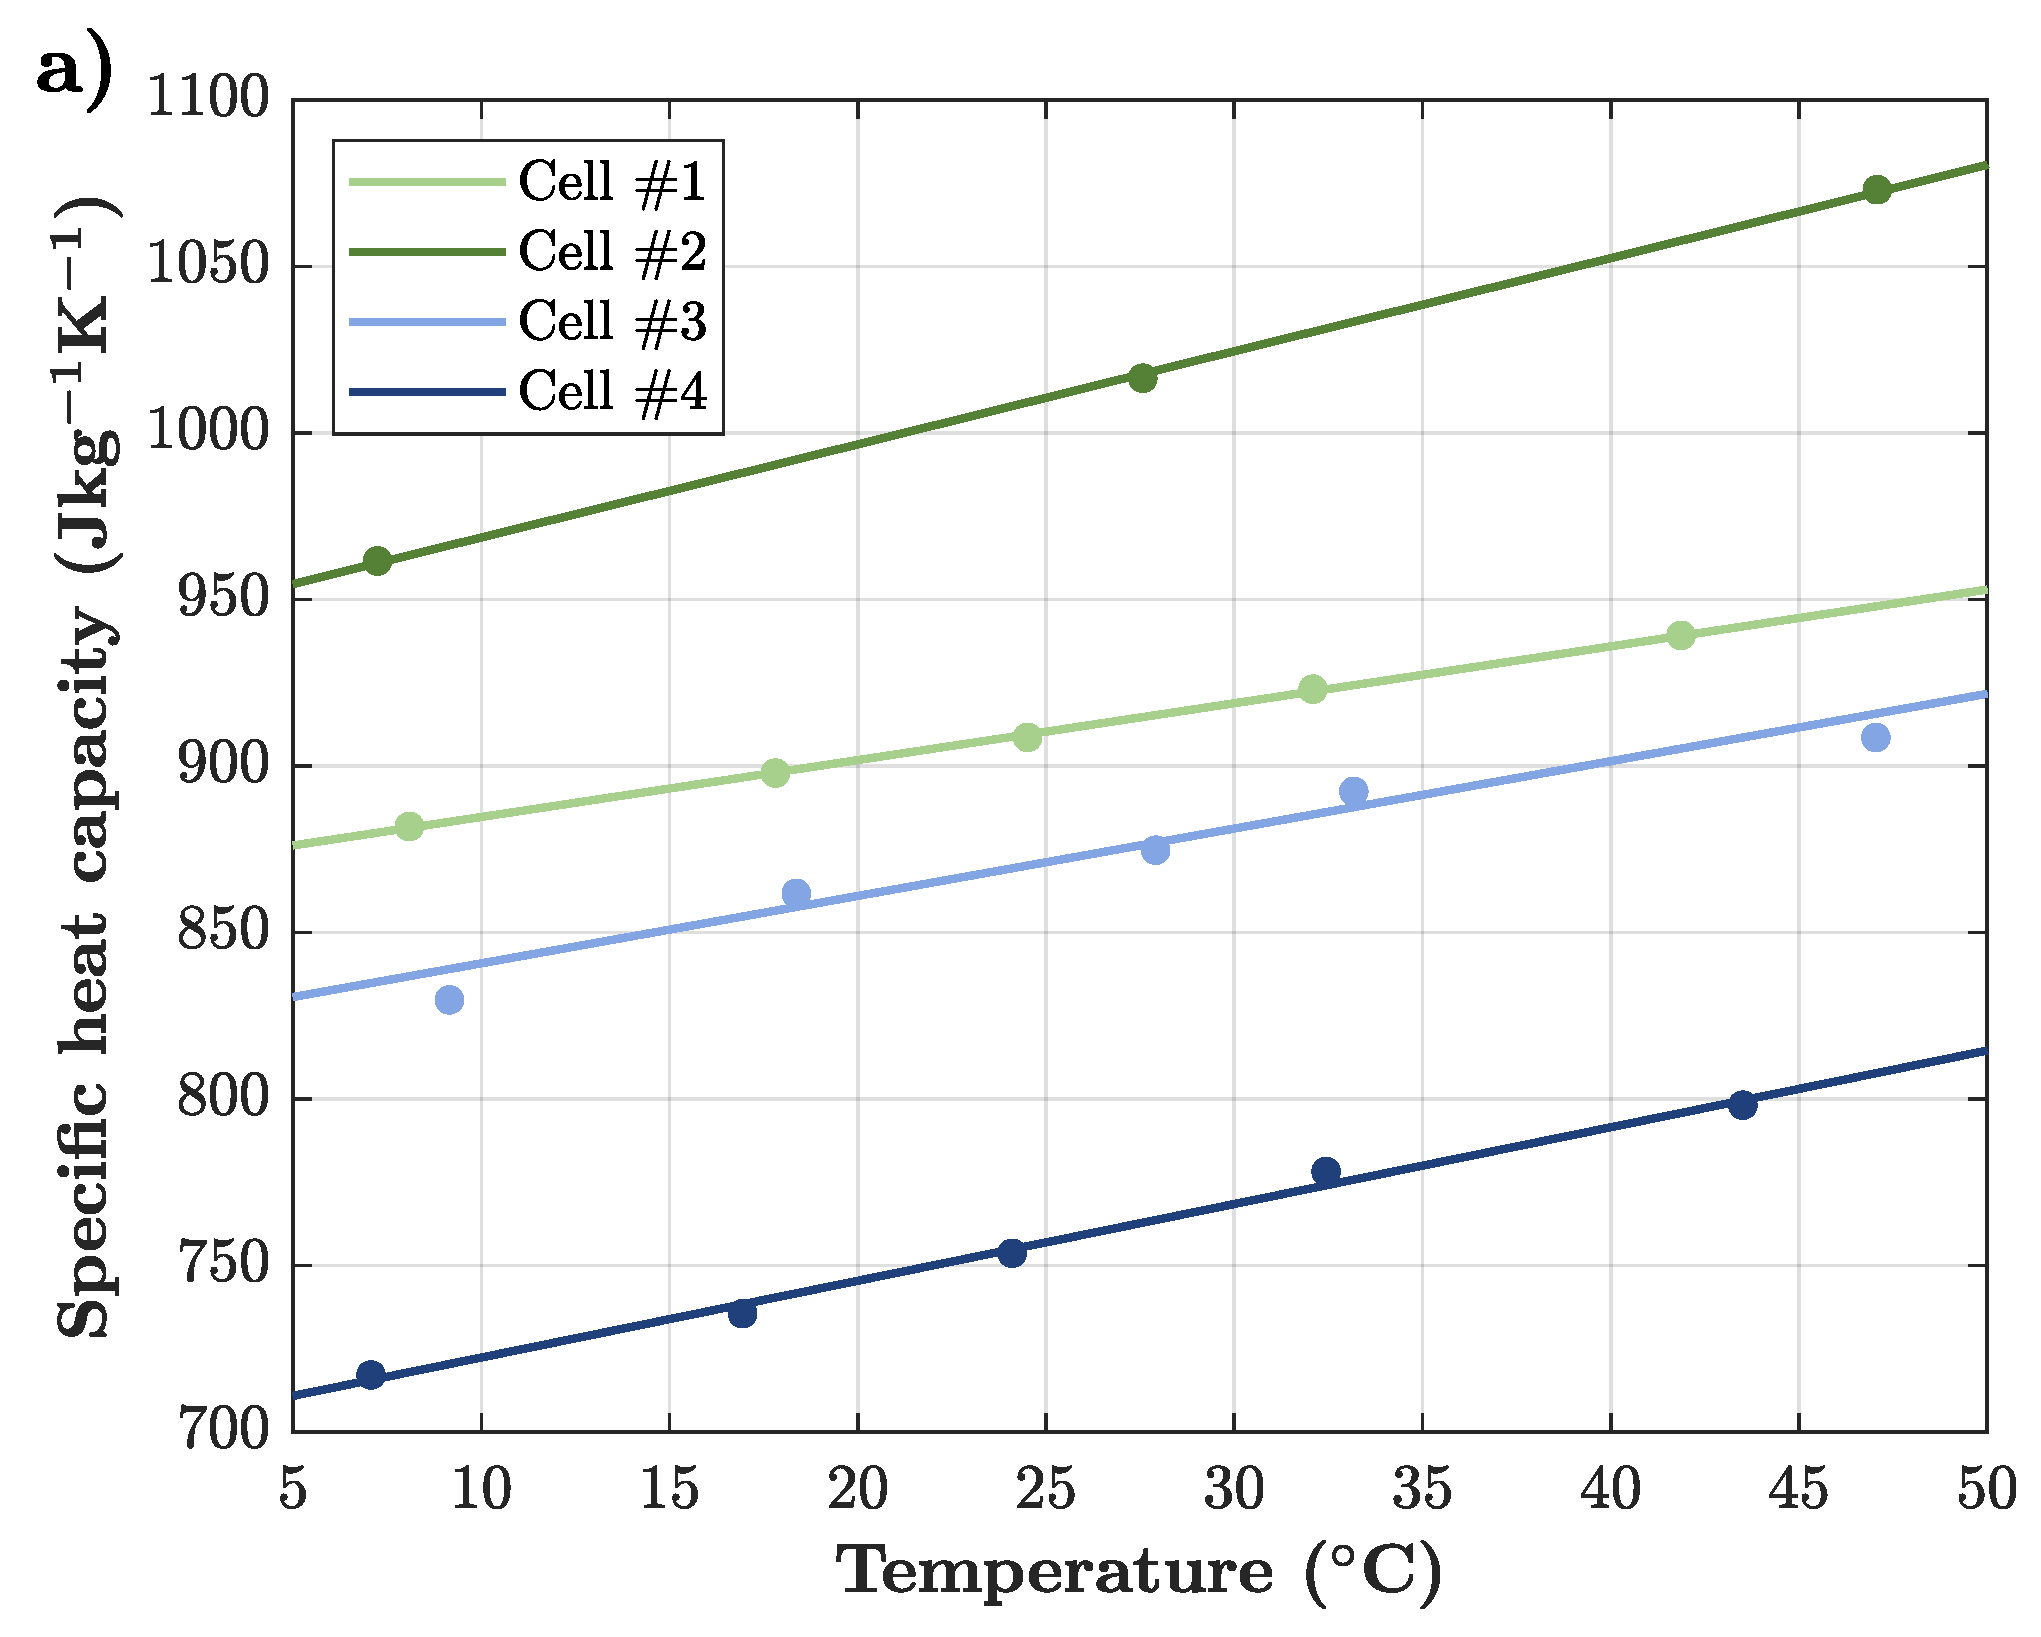
For assessing the influence of temperature on the specific heat capacity of lithium-ion cells, the specific heat capacity of all four sample cells is measured with the above-described measurement approach. Therefore, three to five measurement points between and are chosen and following a linear interpolation is performed.
First, cell #3 is comprehensively analyzed. Hence, five temperature points are selected for three different SOCs. Being
,
and
, a wide range of charging states is covered allowing for the identification of interaction effects between temperature and SOC. Visualized in
Figure 4, three different curves depict the temperature-dependent specific heat capacity for each SOC point. Interestingly, all curves have a very similar slope around
showing a common temperature-dependent behavior. In consequence, the specific heat capacity of cell #3 increases by about
corresponding to
from
to
. Furthermore, the uniform slope clearly indicates that there exists no significant interaction effect between temperature and SOC. Hence, the temperature-dependent specific heat capacity is only analyzed at
for the other three sample cells.
Following this, the influence of temperature on the specific heat capacity of all four sample cells is illustrated in
Figure 5a. Again, all curves show a positive slope ranging from
to
. It can be deduced that an increase in temperature leads to an increase in specific heat capacity for all sample cells. Even though the curves are vertically offset due their varying absolute value, they show a common temperature-dependent behavior. Also under consideration of the measurement uncertainty, the experimental results indicate a significant dependency. As no reassembly is required between the individual measurement points, the uncertainty is below 5%, far below the magnitude of measured temperature-induced effects. While the positive temperature dependency is in good agreement with
Figure 1a, it also confirms the findings on the material level of Loges et al. [
14]. They found that all constituting materials of the cell show an increase in specific heat capacity with rising temperature. Hence, it is reasonable that the full cell behaves similarly to its individual materials. It being caused by the increasing phonon vibrations of the metallic cell components as described by the debye model [
46], the rising temperature of metals leads to an increasing specific heat capacity. Nevertheless, it cannot be explained what causes varying magnitudes of the temperature dependence of the specific heat capacity. Potential causes such as different materials and varying material compositions need to be analyzed in future work. In addition, it is unclear how negative temperature dependencies, as shown in
Figure 1a, can be found. Screwed measurements, low measurement resolution or damaged cells could partly explain such opposing trends in the literature.
The found positive temperature dependence of the specific heat capacity of lithium-ion cells has significant effects on their thermal behavior. Since a low heat capacity at low temperatures is beneficial for reaching the maximum charging current temperature window earlier, charging times at low temperatures can be reduced. Furthermore, the high heat capacity at high temperatures has positive effects on charging times, too. Since a higher heat capacity allows for a later reduction of charging current or reduces the required cooling power, fast charging at higher cell temperatures is improved as well. The detailed effects of the temperature-dependent specific heat capacity on the charging performance are of high interest and will be precisely analyzed in future work.
In conclusion, the specific heat capacity of all cells increases with rising temperature between and . While all cells show a similar temperature-dependent behavior, no significant interaction between temperature and SOC is found. Furthermore, the positive correlation is in accordance to the increasing specific heat capacity of the constituting materials with increasing temperature.
3.5. Effect of SOC on the Specific Heat Capacity
The previous section showed that there exists no significant interaction between temperature and SOC regarding the specific heat capacity. Hence, the SOC-dependent specific heat capacity is only analyzed at for all sample cells. By measuring the specific heat capacity at an SOC of , and , a SOC dependence can be deduced by linear interpolation. The SOC is determined by coulometric measurement whereby the cell is fully charged and then the corresponding capacity is precisely removed to achieve a well-defined cell state.
Interestingly, all cells except cell #3 show a nearly constant behavior over the analyzed SOC range as illustrated in
Figure 5b. While cell #2 is characterized by a slight increase in specific heat capacity during charging, the specific heat capacity of cell #4 reduces by one percent over the analyzed SOC range. Moreover, cell #1 shows no recognizable change in specific heat capacity due to a variation in SOC. However, the specific heat capacity of the three presented cells can be considered constant over the SOC range with negligible error. As again no reassembly is required between the individual measurement points per cell, the effect of the measurement uncertainty is not considered significant as no systematic relative deviation can be observed.
However, the specific heat capacity of cell #3 apparently decreases with rising SOC. Showing a decline of
between the lowest and highest analyzed SOC stage, it results in a SOC dependence of
over the full SOC-range. While this is in accordance to findings of Saito et al. [
20], possible causes can be the varying states of lithiation. However, the lithium content inside the cell remains constant during charge and discharge which limits the impact of the SOC on the specific heat capacity. As the decreasing specific heat capacity with rising SOC leads to a lower thermal budget at high SOCs with possibly high temperatures, the measured SOC dependence of the specific heat capacity of cell #3 is adverse for the charging performance. Nevertheless, the low magnitude of the reduction in specific heat capacity leads to a reduced importance. Even for isothermal or adiabatic calorimetry experiments, the precise control of SOC is not essential for the measurement of the specific heat capacity. However, a well-defined SOC is beneficial for the measurement accuracy.
In summary, the specific heat capacity of the analyzed lithium-ion cells does not significantly depend on the SOC. While three cells showed a negligible effect of the SOC, cell #3 experienced a decline in specific heat capacity. Even though a negative correlation between SOC and specific heat capacity is negative for the charging performance, the low magnitude leads to a subordinate role. However, customized measurements on a material level can further clarify the variations in the SOC-dependent specific heat capacity of lithium-ion cells.
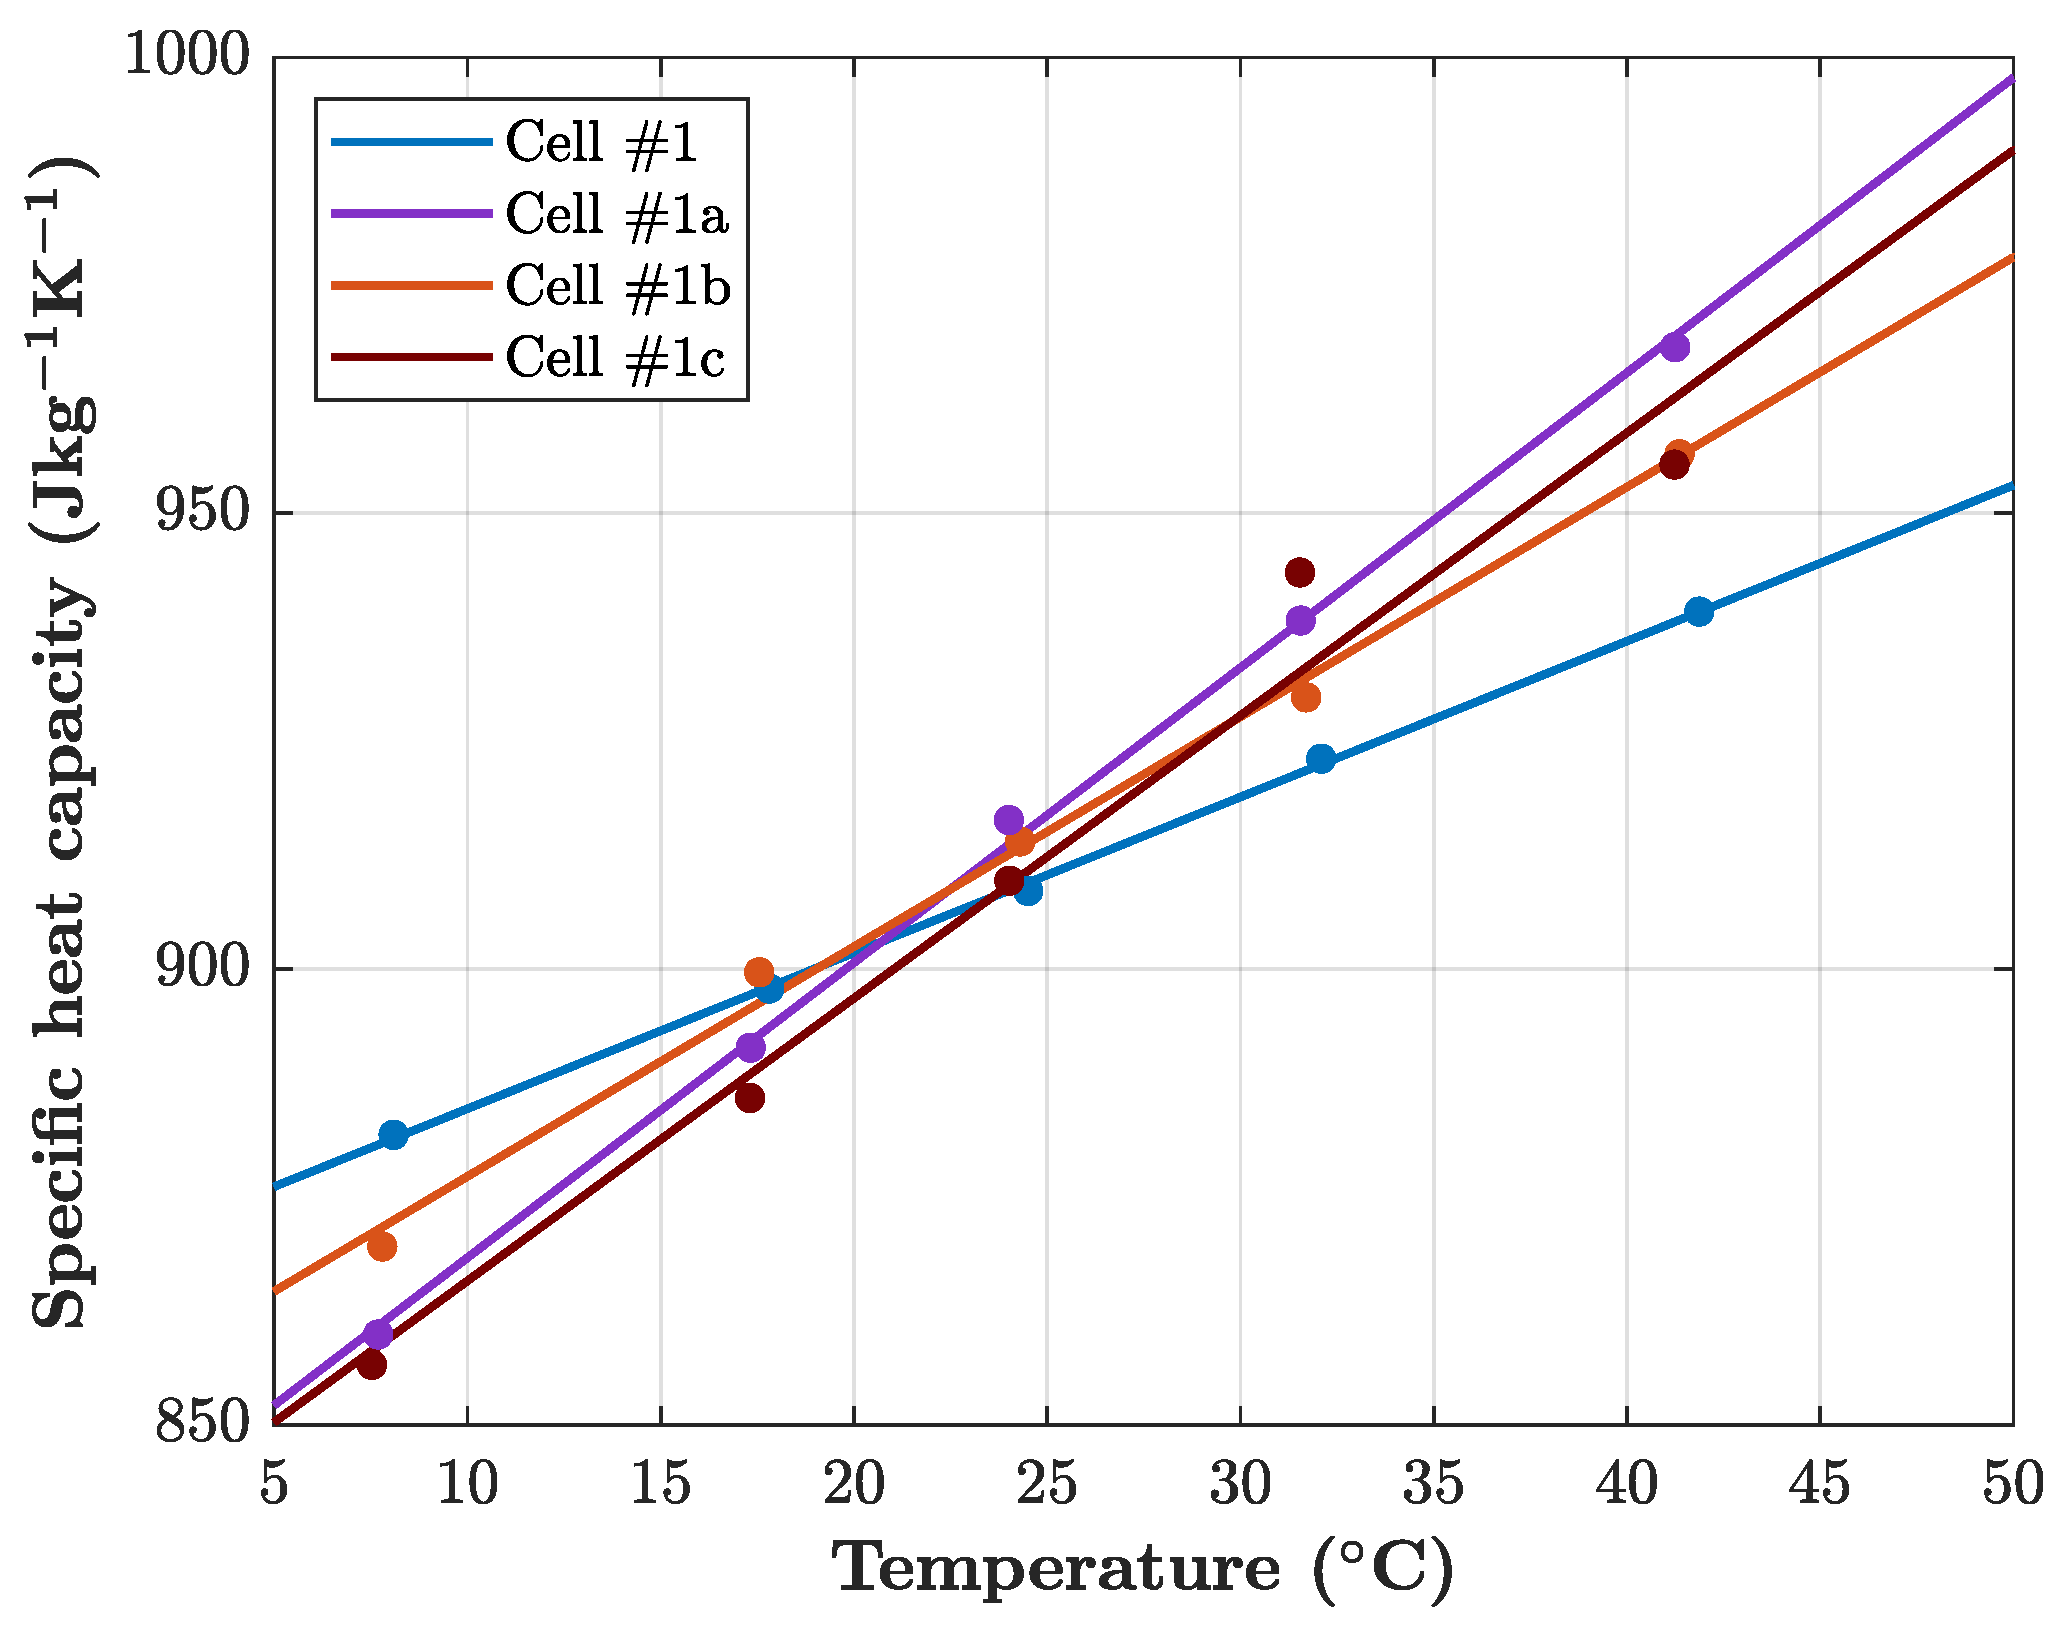
3.6. Effect of SOH on the Specific Heat Capacity
In order to characterize the influence of aging on the specific heat capacity of lithium-ion cells, four sample cells are selected. As all cells stem from the same production batch, they were initially identical. However, three of them experienced realistic aging cycles resulting in a reduced SOH of , and for cell #1a, cell #1b and cell #1c, respectively. The SOH is measured by capacity fade analysis whereby the remaining capacity of the aged cells is carefully measured and related to the pristine value. Following, their specific heat capacity at various temperatures and SOCs is presented and analyzed.
Illustrated in
Figure 6, it can be observed that all cells have a similar specific heat capacity. Ranging between
and
at
and SOC =
, aging does not significantly affect the specific heat capacity at room temperature. This is in perfect agreement to the findings of Geder et al. [
31] who found no effect of aging on the specific heat capacity of cylindrical lithium-ion cells. However, the slope of each temperature-dependent specific heat capacity curve varies. While the pristine cell #1 shows the lowest increase of
, the aged cells show an increase in specific heat capacity of about
. This indicates that aging does affect the temperature dependency of the specific heat capacity of lithium-ion cells. Although this can be related to changes in the molecular structure of the active materials, the non-uniform correlation between aging intensity and temperature dependence makes the identification of clear correlations difficult. Further measurements on a material level of aged cells are required to fully clarify the effect of temperature on the specific heat capacity of aged lithium-ion cells.
Furthermore, the influence of the SOC is analyzed by measuring the specific heat capacity at an SOC of , and . However, neither the absolute value nor the interaction between temperature and SOC is affected. Hence, aging does not have an effect on the SOC dependence of the specific heat capacity and the specific heat capacity of aged cells behaves equally as for pristine cells when the SOC is modified.
In conclusion, aging does not reduce the specific heat capacity of analyzed lithium-ion cells, which is in accordance with past findings in the literature. However, the temperature-dependent increase in specific heat capacity for aged cells is more profound. The SOC does not measurably affect the specific heat capacity of aged cells similarly to pristine cells.
4. Conclusions
This work analyzed the parametric effects on the specific heat capacity of lithium-ion cells in detail. Therefore, a simple measurement setup of Mertin [
32] was utilized. Allowing for high accessibility, it only involves basic laboratory equipment and is applicable to all cell formats. Showing a measurement error of below five percent, the various influences of cell format, cell chemistry, temperature, SOC and SOH on the specific heat capacity were determined.
It was found that the specific heat capacities of lithium-ion cells can be analytically calculated due to the good agreement between analytically predicted values and experimentally determined specific heat capacities. When detailed information about individual materials and mass fractions is available, the cell’s specific heat capacity can be determined by adding up individual material heat capacities. Furthermore, the cell format and the corresponding casing and cell material play an important role. The high specific heat capacity of electrolyte and separator identified those two components as significant levers to increase the specific heat capacity of lithium-ion cells. In accordance with the literature, temperature was determined to increase the specific heat capacity of all sample cells. Ranging from to , a significant rise in specific heat capacity over the cell operating range was identified. While this effect could not be linked to specific cell characteristics, it can have beneficial effects on the charging performance. Due to the faster heating at low temperatures and the lower temperature increase at high temperatures, lower charging times can be achieved. Finally, SOC and SOH did not show a significant impact on the specific heat capacity of the sample cells. Both conclusions agree well to findings in the literature. The non-uniform effect of the SOC only plays a subordinate role due to its low magnitude. Aging repetitively did not affect the absolute value of the specific heat capacity while moderately increasing its temperature dependence.
In summary, the results of this work show the following:
The specific heat capacity of lithium-ion cells can be analytically calculated by summing up individual material heat capacities;
The cell housing plays an important role for the specific heat capacity of lithium-ion cells;
The cell chemistry and corresponding layer thicknesses heavily influence the specific heat capacity of the jelly;
Temperature uniformly increases the specific heat capacity of lithium-ion cells which has positive effects on the charging performance;
SOC and SOH hardly affect the specific heat capacity of lithium-ion cells.
This work described the influence of varying parametric influences on the specific heat capacity of lithium-ion cells in detail. Significant correlations were identified and consequences for analytical prediction and charging performance were presented. Even though many trends were determined, specific heat capacity measurements on material level need to be analyzed in future work. Finally, the discovered conclusions need to be also analyzed for other cells in order to validate general validity. Specific heat capacity measurements for individual materials under consideration of temperature and SOC need to be performed in future work to precisely understand and predict the thermal behavior of lithium-ion cells.


 ,
, 


