Article

Vessel Traffic Risk Assessment Based on Uncertainty Analysis in the Risk Matrix

Navigation College, Dalian Maritime University, Dalian 116026, China
*
Author to whom correspondence should be addressed.
Algorithms 2018, 11(5), 60; https://doi.org/10.3390/a11050060
Submission received: 5 April 2018 / Revised: 28 April 2018 / Accepted: 2 May 2018 / Published: 3 May 2018
(This article belongs to the Special Issue Algorithms for Decision Making)

Abstract

:
Uncertainty analysis is considered to be a necessary step in the process of vessel traffic risk assessment. The purpose of this study is to propose the uncertainty analysis algorithm which can be used to investigate the reliability of the risk assessment result. Probability and possibility distributions are used to quantify the two types of uncertainty identified in the risk assessment process. In addition, the algorithm for appropriate time window selection is chosen by considering the uncertainty of vessel traffic accident occurrence and the variation trend of the vessel traffic risk caused by maritime rules becoming operative. Vessel traffic accident data from the United Kingdom’s marine accident investigation branch are used for the case study. Based on a comparison with the common method of estimating the vessel traffic risk and the algorithm for uncertainty quantification without considering the time window selection, the availability of the proposed algorithms is verified, which can provide guidance for vessel traffic risk management.

1. Introduction

Vessel traffic risk management aims to enhance maritime safety, which includes the protection of life, health, the marine environment and property [1]. An important aspect of risk management lies in vessel traffic risk assessment, which can guide the authority’s work for improving safety. The risk matrix is widely used for vessel traffic risk assessments [2]. The risk matrix displays the frequency (or probability) of events and their consequence (or severity) using a matrix [3].
The risk matrix provides a mechanism for assigning risk and making risk acceptance decisions using a risk categorization approach. Each cell in the risk matrix corresponds to a specific combination of the frequency and consequence, which indicates a level of risk. In the risk matrix, both the frequency and consequence are measured by a category scale: frequency, reasonable probability, remoteness and extremely remoteness for the frequency measurement; minor, significant, severe and catastrophic for the consequence measurement. In addition, each cell in the matrix can be assigned an indication of risk acceptability for decision-making on risk [4,5].
During the process of vessel traffic risk assessment, there are several methods that can be used to estimate the vessel traffic accident frequency and consequence [6,7,8]. The fundamental way to calculate the vessel traffic accident frequency is to divide the number of accidents recorded in a given period by the corresponding exposure for that period [2]. In general, the vessel traffic accident consequence can be measured in different ways, such as economic, environmental and safety consequences [9]. For the purposes of this study, only safety consequences are considered. However, concerns have been raised about the reliability of vessel traffic risk assessment results [5,10,11]. In order to investigate the vessel traffic risk assessment reliability, uncertainties in the risk assessment process should be analyzed. In practice, several qualitative frameworks [12,13] and quantitative methods [14] have been proposed to assess uncertainty in the field of maritime risk analysis.
There are typically two types of uncertainty: randomness resulting from inherent variability and cognitive imprecision resulting from expert opinions. The former type of uncertainty is often referred to as aleatory uncertainty whereas the latter is often referred to as epistemic uncertainty [15]. As vessel traffic accidents are random events, the number of accidents can be considered as a random number generated from a random event [16]. Thus, the vessel traffic accident frequency calculated by the number of accidents is often taken as a variable with aleatory uncertainty due to inherent variability [17]. With regards to the vessel traffic accident consequence, it can be taken as the result of many factors affecting one another through an ambiguous development process. In the field of maritime risk analysis, the number of fatalities is generally far less than the number of vessel traffic accidents. The accident consequence is often considered as a variable with epistemic uncertainty, as the available information is usually scarce and expert judgements are often incorporated in the process of analyzing the accident consequence [18].
Different mathematical methods are required in order to quantify different types of uncertainty. Aleatory uncertainty is often quantified by probability distributions [19]. For the quantification of epistemic uncertainty, a number of methods can be used, such as possibility theory and evidence theory [20]. In this study, possibility theory is selected to quantify epistemic uncertainty due to its mathematical simplicity [21]. It should be noted that the time window used for the inclusion of data has a major effect on the quantification of uncertainty [22]. Without considering the time window selection, uncertainties will be measured too conservatively or too optimistically. Therefore, it is considered necessary to propose an algorithm for time window selection.
When selecting the time window, the aleatory uncertainty of vessel traffic accident occurrences should be taken into account. In addition, it should be noted that the vessel traffic accident frequency changes over time due to maritime rules becoming operative on the vessel traffic being analyzed [23]. In other words, the time series of the accident frequency may reveal certain trends. Due to uncertainties and variation trends of the vessel traffic accident frequency, the time window selection comes down to constructing and splitting the uncertain time series. In this study, the aleatory uncertainty of the vessel traffic accident frequency is quantified by the Poisson distribution [18], so that the confidence intervals of the accident frequency can be obtained each year. When the confidence intervals are arranged in chronological order, the uncertain time series of the accident frequency is built up. Based on the orderliness of time series, the sliding window method [24] is used to split the uncertain time series, which aggregates the relatively concentrative confidence intervals. The latest segmentation is selected as the statistical time window.
The rest of the paper is organized as follows. Section 2 describes the algorithm for the quantification of the two types of uncertainty identified in the risk assessment process. In Section 3, the time window selection algorithm is described. The case study is carried out and comparisons are made to verify the superiority of the proposed algorithms in Section 4. Conclusions are provided in Section 5.

2. Algorithm for Uncertainty Analysis

2.1. The Aleatory Uncertainty Quantification

During the process of quantifying aleatory uncertainties, it is important to choose the suitable probability distribution. The European Maritime Safety Agency assumes that the occurrence of vessel traffic accidents obeys the Poisson distribution according to expert experience, historical statistical data and theoretical analysis [18]. According to the a priori knowledge of the European Maritime Safety Agency, the Poisson distribution is chosen to quantify the aleatory uncertainty of vessel traffic accidents in this study. With a given confidence level, the confidence interval of Poisson-distributed data can be calculated by [25]:
λ U = χ 1 α / 2 2 ( 2 n + 2 ) 2 λ L = χ α / 2 2 ( 2 n ) 2
where λ U and λ L are defined as the upper and lower limits of the confidence interval of n , which is the number of times an event occurs in a certain time window. a denotes the significance level and ( 1 a ) denotes the confidence level. χ 1 α / 2 2 ( 2 n + 2 ) is the ( 1 α / 2 ) th quantile of the chi-squared distribution with ( 2 n + 2 ) degrees of freedom; χ α / 2 2 ( 2 n ) is the ( α / 2 ) th quantile of the chi-squared distribution with ( 2 n ) degrees of freedom.
It should be noted that there is epistemic uncertainty when selecting the probability distribution due to referring to the a priori knowledge of the European Maritime Safety Agency. In other words, other probability distributions can also be selected to quantify aleatory uncertainty, such as the Normal distribution, the Log-normal distribution and the Beta distribution. However, the information available in this study is insufficient to model the Normal distribution, the Log-normal distribution and the Beta distribution. In order to make the epistemic uncertainty as small as possible, the Poisson distribution is selected in this study. When there is more information, it is possible to select other probability distributions to quantify the aleatory uncertainty of vessel traffic accidents. For the sake of simplicity, the possible effects of the epistemic uncertainty of selecting the Poisson distribution are not considered in this study, which can be studied further in the future.

2.2. The Epistemic Uncertainty Quantification

As discussed in the introduction section, the possibility theory is selected to quantify the level of epistemic uncertainty. Specifically, λ -cuts of the possibility distribution are calculated as the result of the epistemic uncertainty quantification, which is similar to the confidence interval [ λ L , λ U ] at the confidence level (1 − a ) in Section 2.1 [15]. According to the possibility theory, the domain of discourse of the variable X is set as Ux and R is set as the fuzzy set contained in Ux, and it is possible to obtain the λ -cut of X from the possibility distribution π ( x ) of X, by [26]:
R λ = { x | π ( x ) λ , x R }
where R λ is defined as the λ -cut of X, λ is taken as the threshold and λ [ 0 , 1 ] .
In addition, the possibility measure Π ( R ) and the necessary measure N ( R ) can be used to estimate the confidence level of R, denoted by P { x R } . We thus have:
Π ( R ) = max x R { π ( x ) } N ( R ) = 1 Π ( R ¯ ) N ( R ) P { x R } Π ( R )
When R is replaced by R λ , we thus have:
Π ( R λ ) = 1 N ( R λ ) = 1 λ N ( R λ ) P { x R λ } Π ( R λ )
By simplifying the Equation (4), we have:
P { x R λ } 1 λ
According to Equation (5), R λ can be regarded as the confidence interval at the confidence level (1 − λ ).

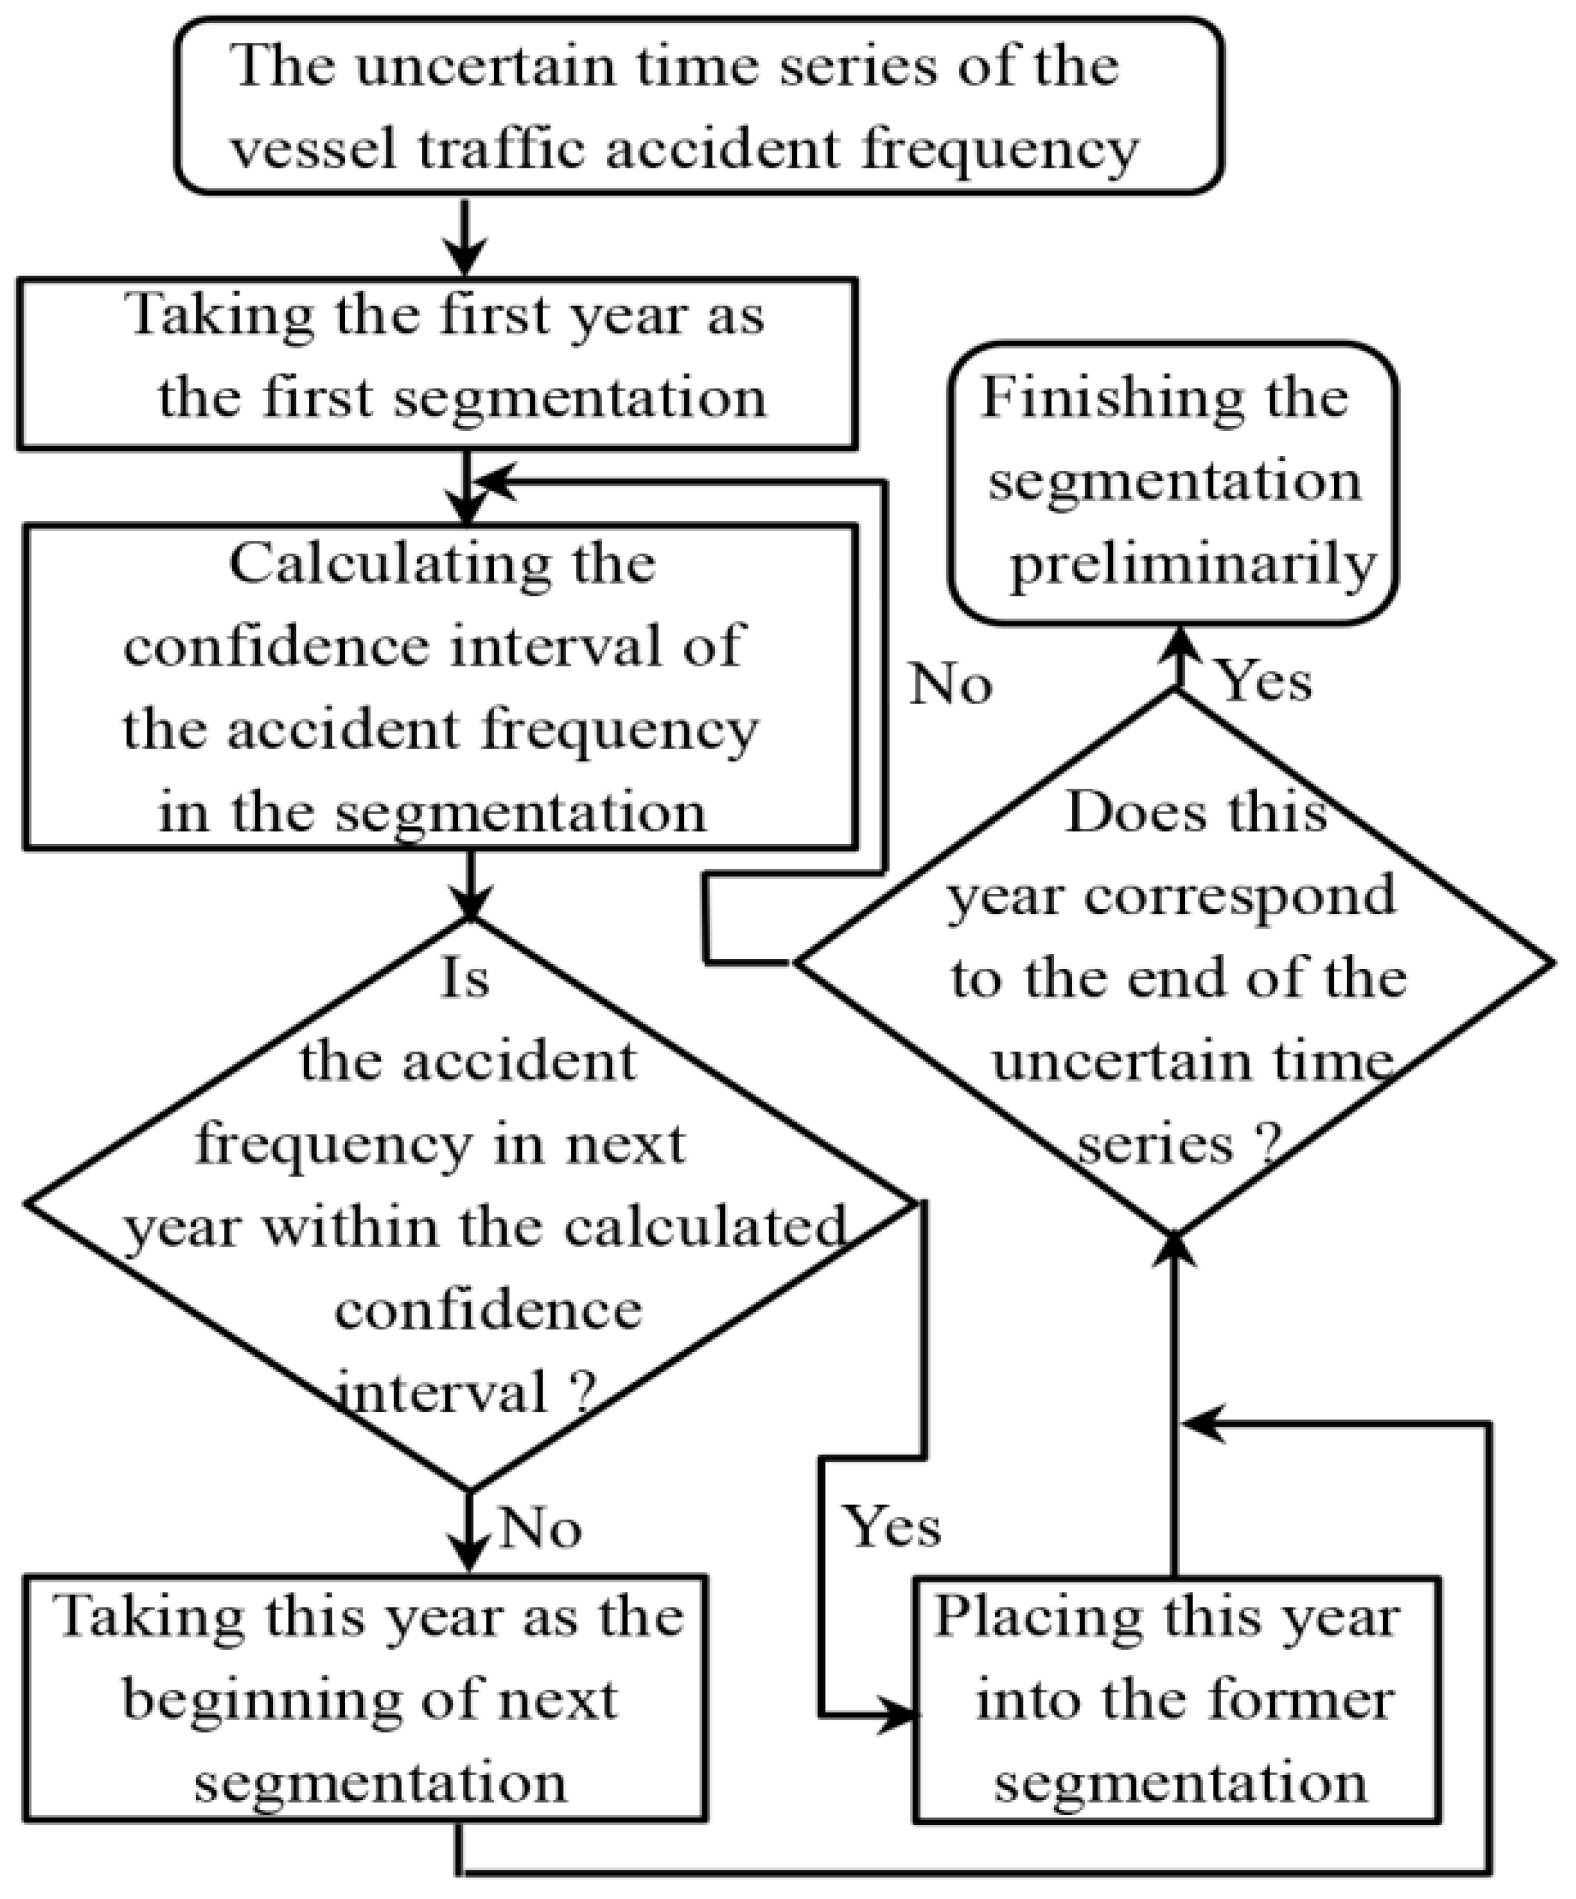
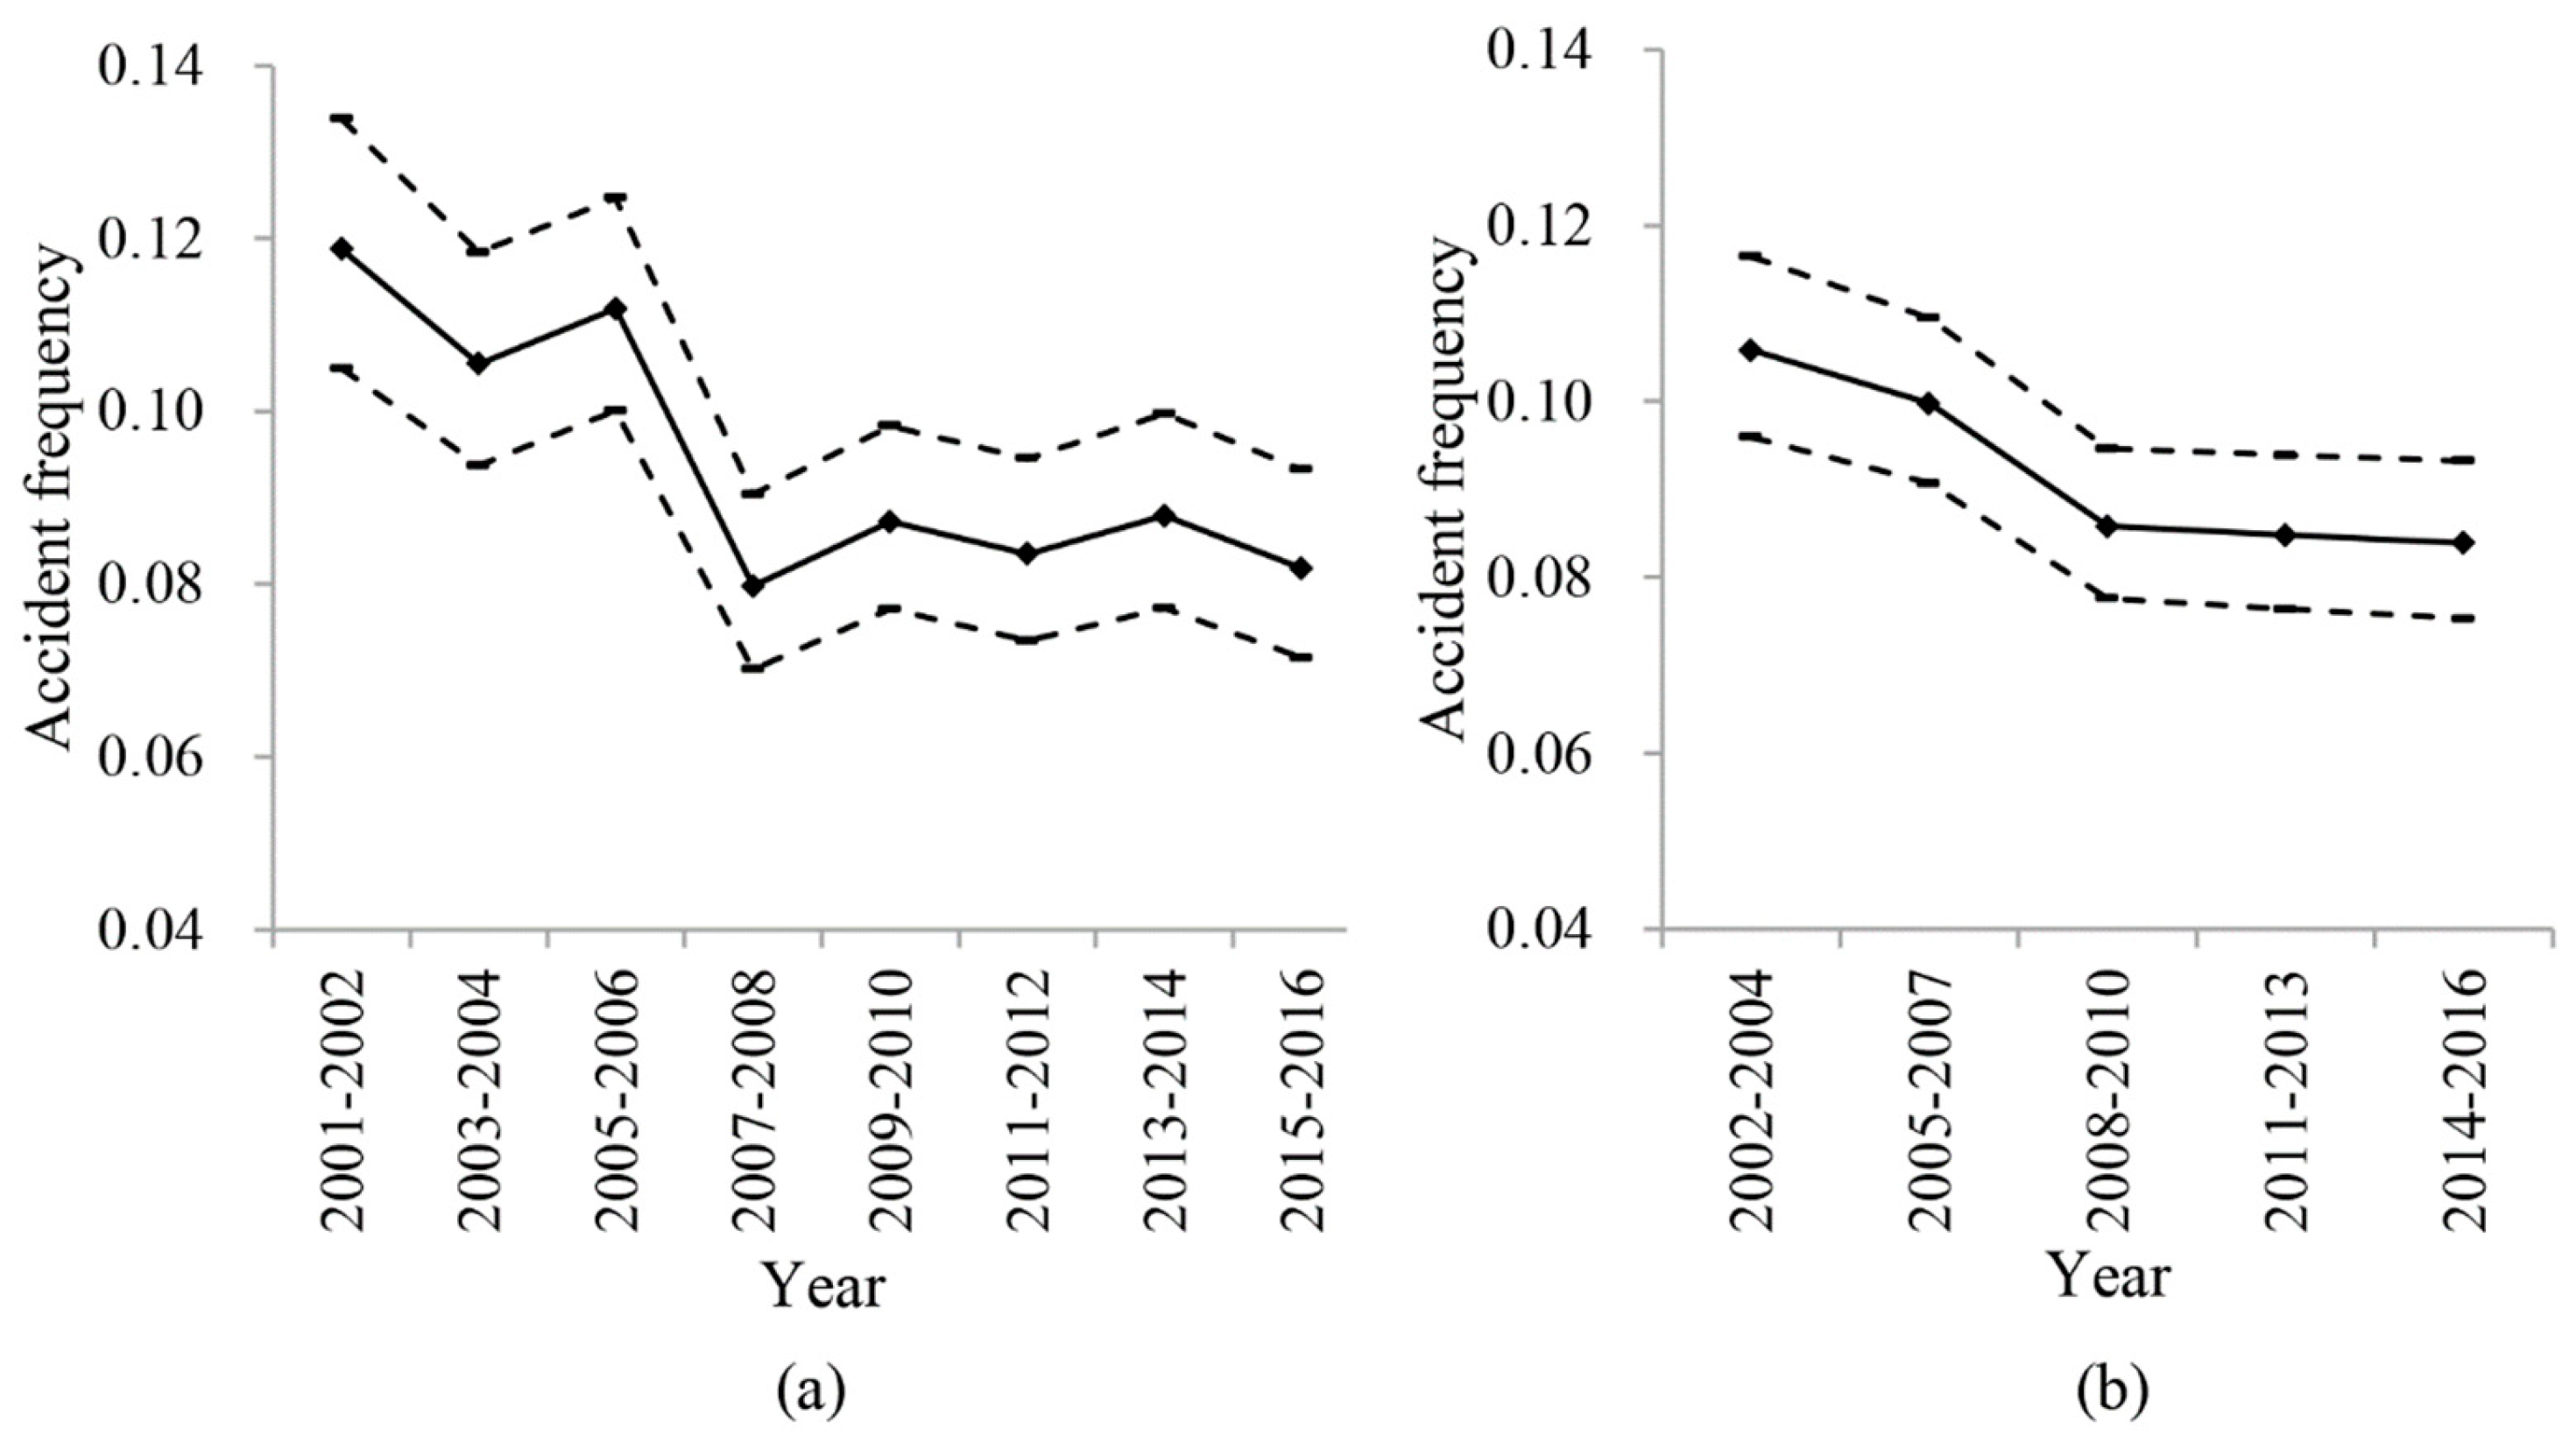
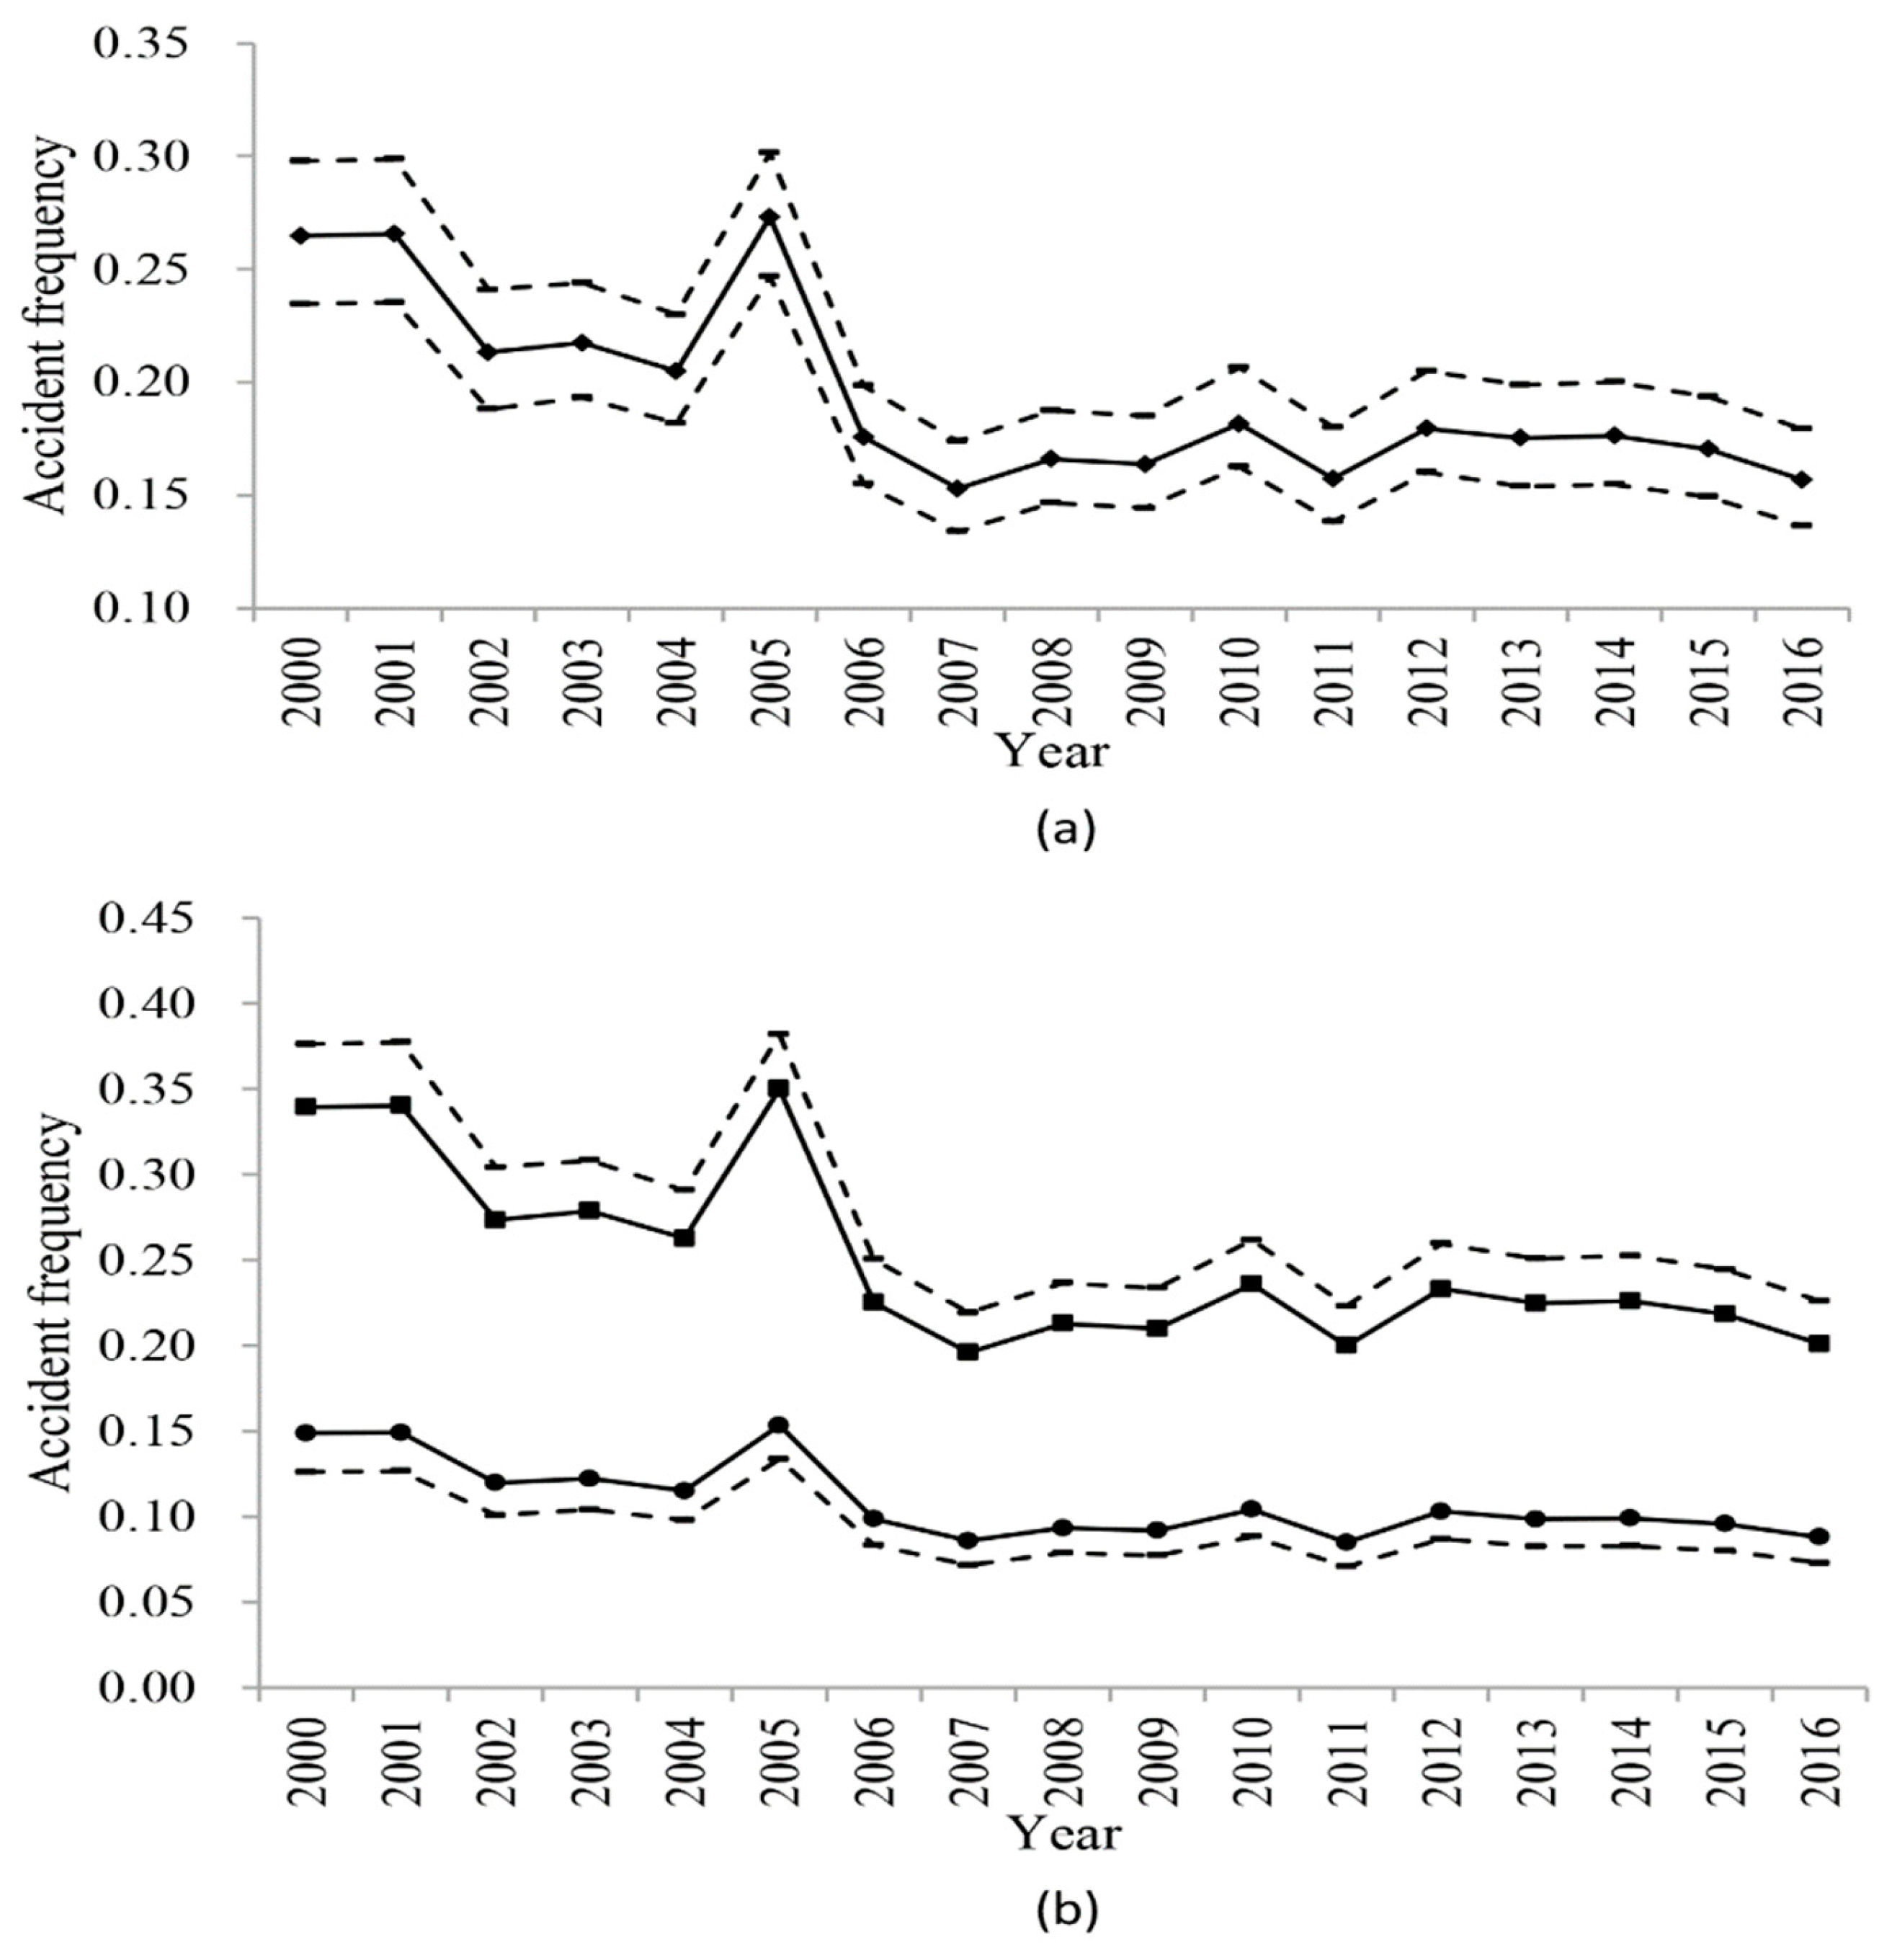
3. Algorithm for Time Window Selection
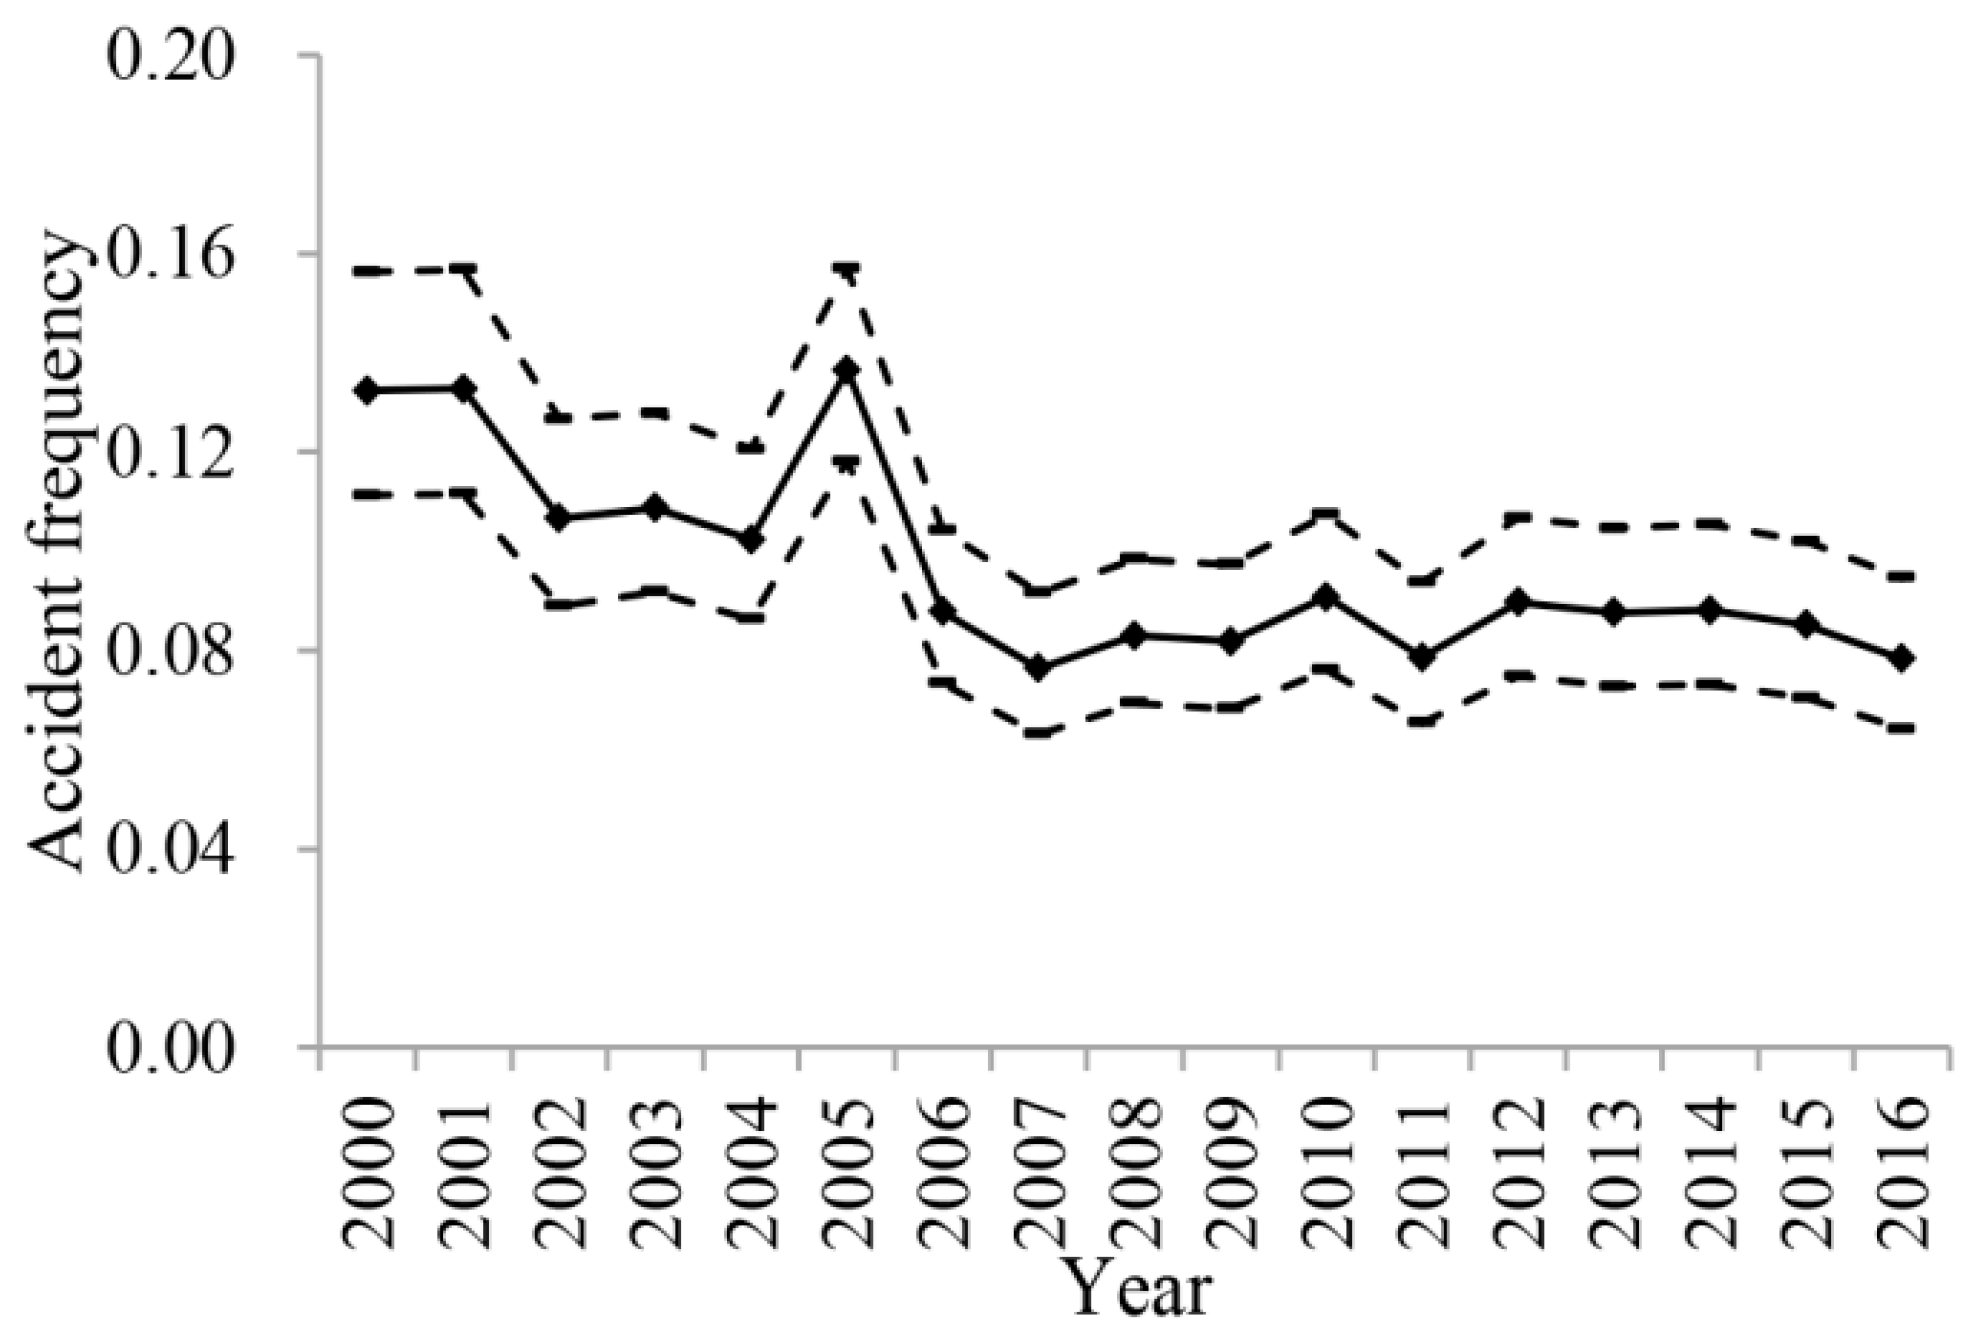
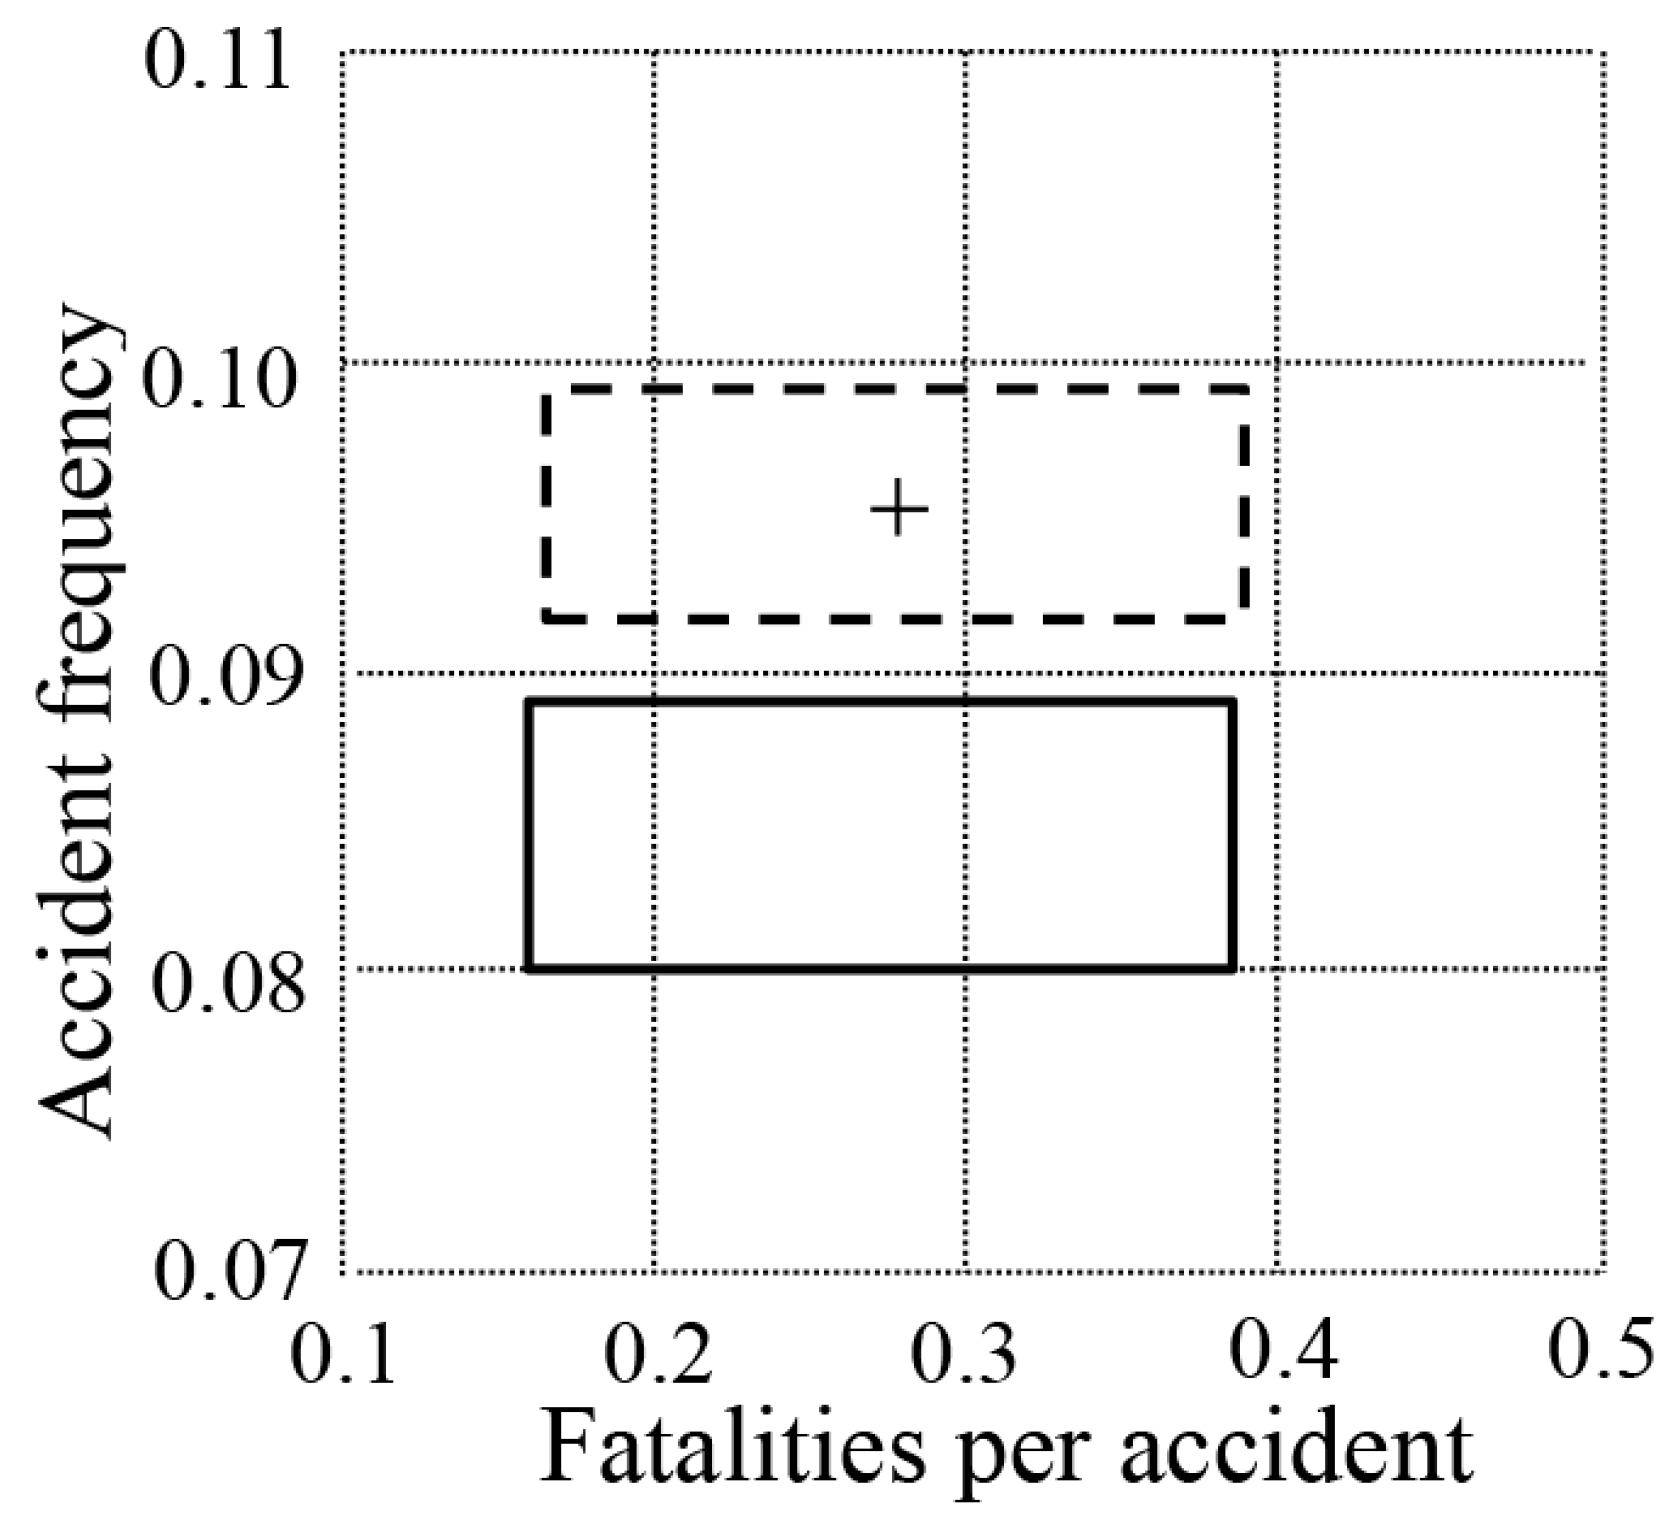
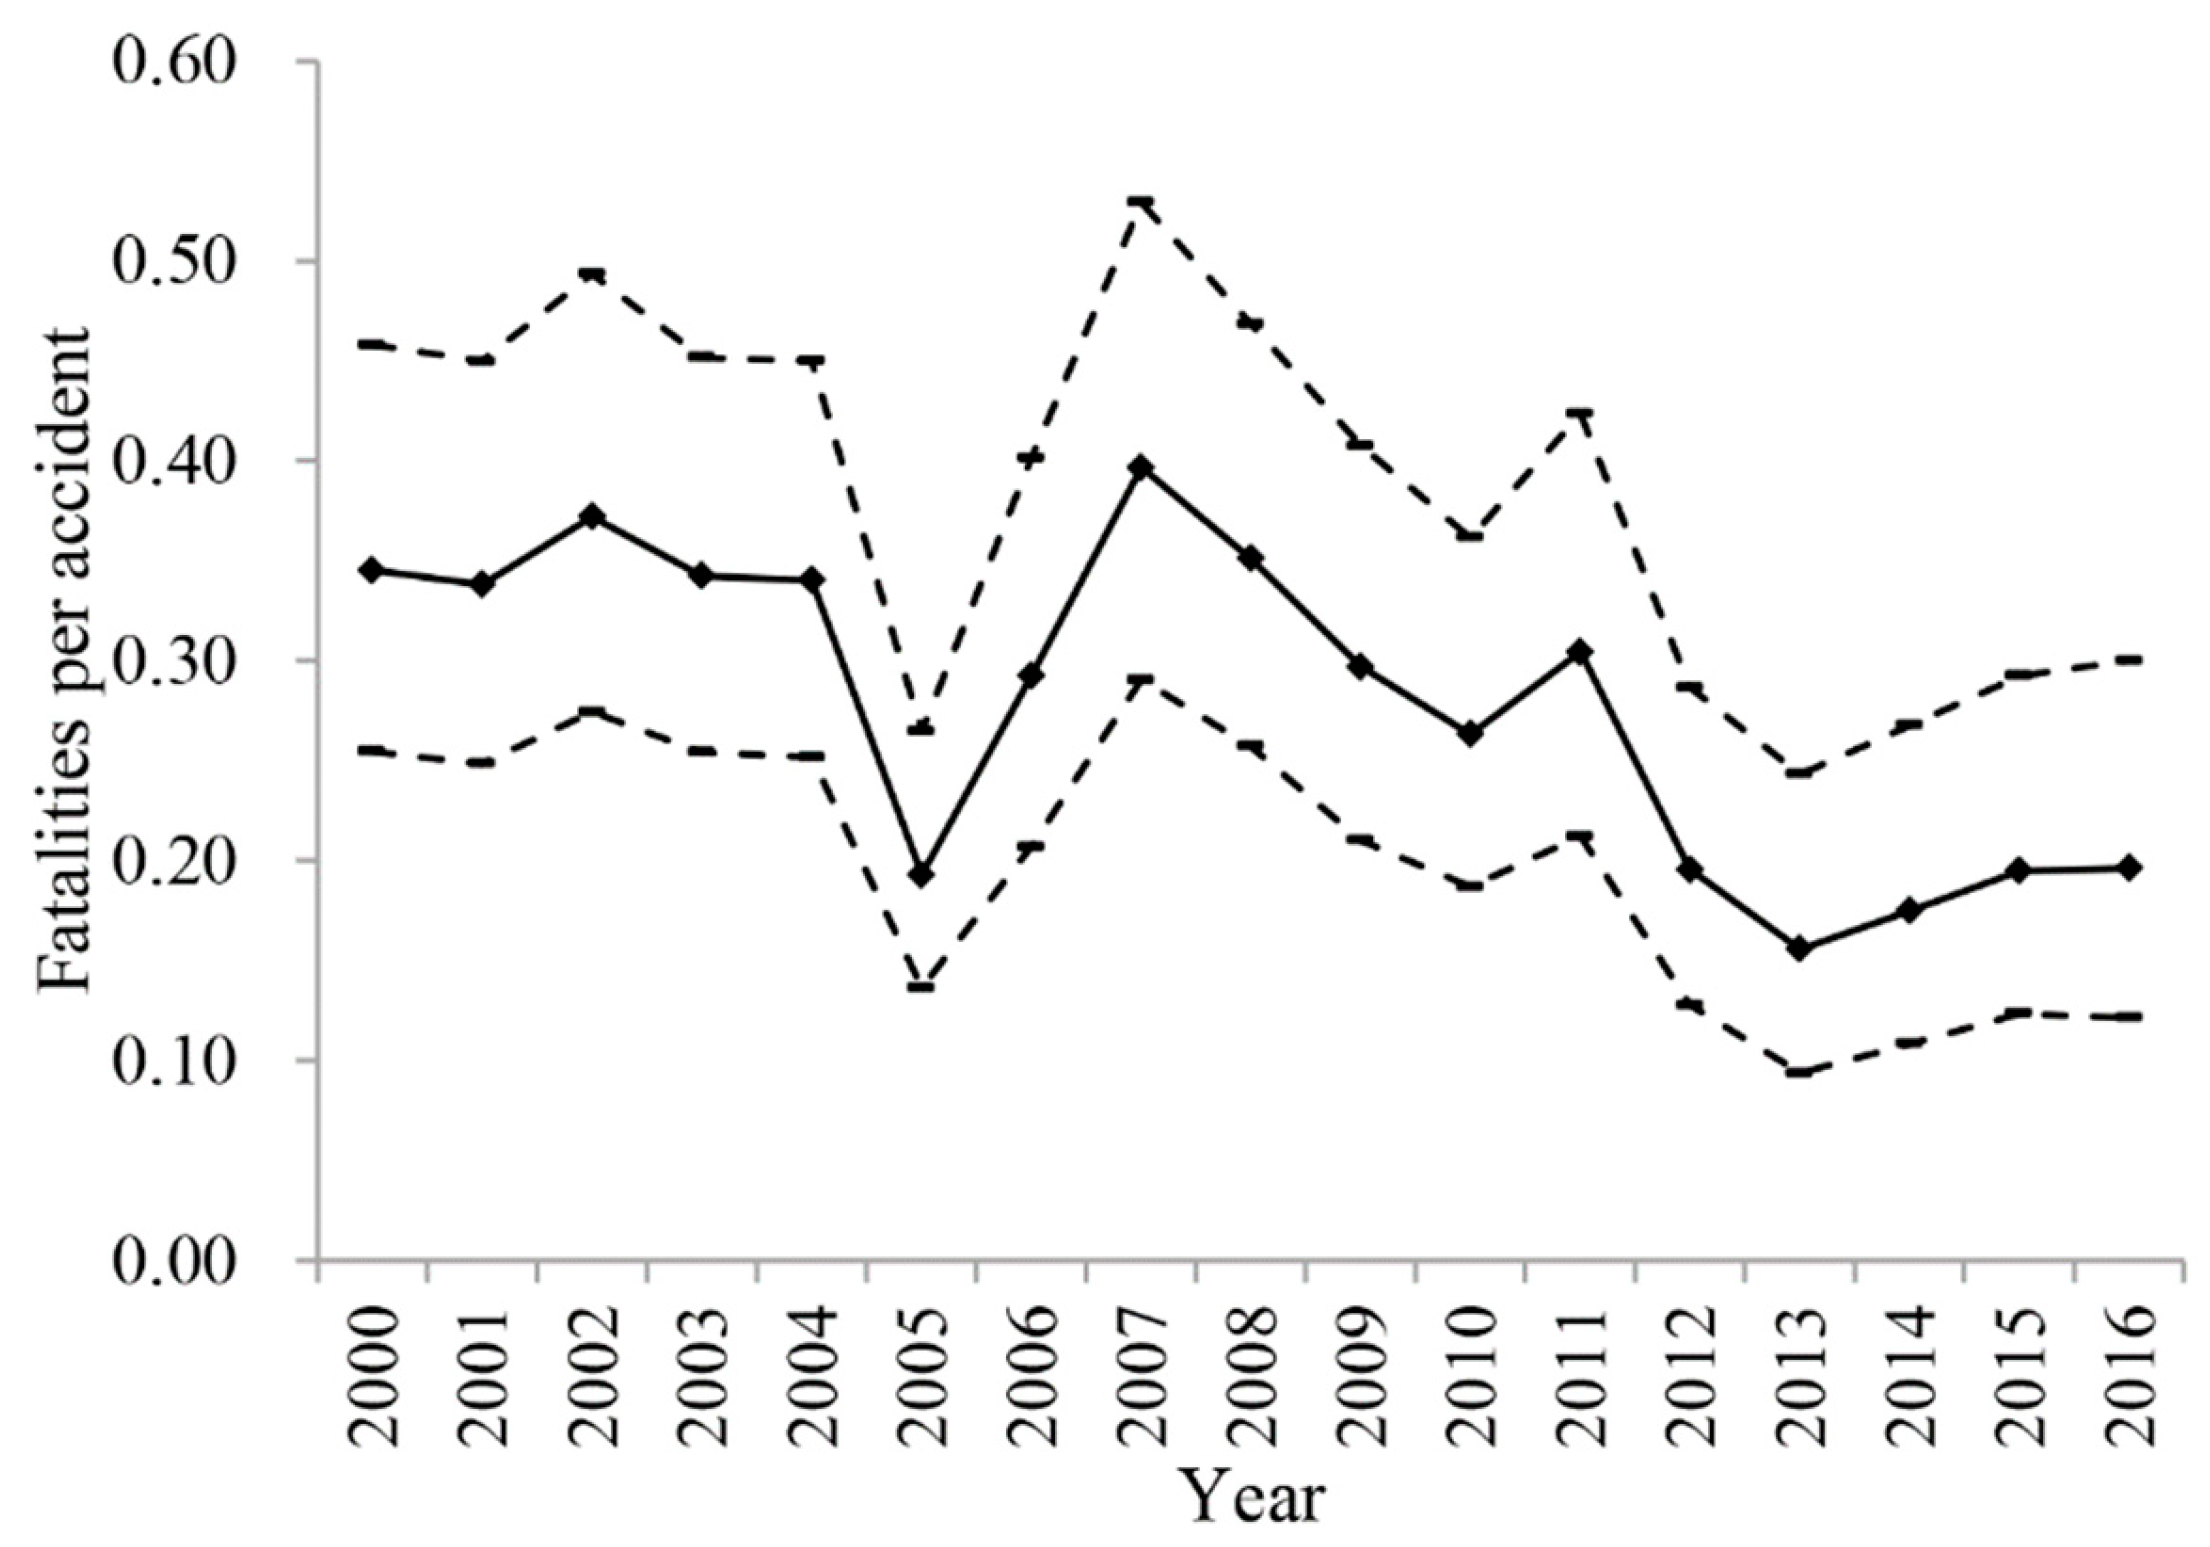
The vessel traffic accident frequency is chosen as the index in the process of time window selection because accident consequences are generated through a fuzzy development process after accidents occur and are considered as variables with epistemic uncertainty. Based on Equation (1), the limits of the confidence interval for the number of accidents can be calculated. Then the confidence interval for the vessel traffic accident frequency can be measured in the number of accidents per ship year. When the confidence intervals for the accident frequency each year are arranged in chronological order, the uncertain time series is formed [27].
According to the orderliness of time series, the closer the time interval is to the current time, the nearer the vessel traffic accident frequency measured over the time interval approximates to the current accident frequency. In order to reflect the variation trend of the vessel traffic accident frequency due to maritime rules becoming operative on the vessel traffic being analyzed, it is considered necessary to split the uncertain time series of the vessel traffic accident frequency calculated above.
The sliding window approach is applied in the process of splitting the uncertain time series. It regards the first year as the first segmentation and continues to expand until the vessel traffic accident frequency in certain years exceeds the confidence interval of the former segmentation. Then the next segmentation starts with this year. The aforementioned splitting procedure is repeated until the last year in the uncertain time series. It should be noted that whether the accident frequency in certain years exceeds the confidence interval of the former segmentation is used as the criterion for splitting the uncertain time series. The criterion is reasonable because it can aggregate relatively concentrative confidence intervals at a certain level of confidence. When the accident frequency exceeds the confidence interval of the former segmentation, it means that the accident frequency still changes under the influence of outside factors after overcoming the randomness of the accident data. In other words, different segmentations show different levels of the vessel traffic accident frequency. Changes in levels of the vessel traffic accident frequency reflect the effects of technical or operational developments, new requirements, or specific arrangements on the vessel traffic being analyzed. The above developments are often carried out along with maritime rules becoming operative. To represent the splitting process of the uncertain time series more clearly, the flowchart is shown in Figure 1.
After the preliminary segmentation, there is one more step to obtain the final segmentation result. When one segmentation only contains one year and there is no remarkable change between its adjacent segmentations, it means that the large random fluctuation of data from the year leads to the segmentation. In order to avoid excessive segmentation, the segmentation and its adjacent segmentations should be merged. It should be noted that the condition for the segmentation, as can be seen in Figure 1, is used to judge if there is a remarkable change. Finally, the latest segmentation is considered to be the statistical time window.

4. Results

Using the vessel traffic accident data from the United Kingdom’s marine accident investigation branch [28], the case study is carried out on the algorithms for uncertainty quantification and time window selection that were illustrated in Section 2 and Section 3. The vessel traffic accident data include the number of United Kingdom’s vessels, vessel traffic accidents and fatalities caused by the accidents for each year 2000–2016, which are shown in Table 1.
The vessel traffic accident frequency can be measured in the number of accidents per ship year. A ship year is defined as one ship sailing for one year, which can be understood as the corresponding exposure of the vessel traffic being analyzed. Then the vessel traffic accident frequency for each year between 2000 and2016 can be calculated by dividing the number of vessel traffic accidents by the number of vessels listed in Table 1. According to Equation (1), the confidence intervals of the vessel traffic accident frequency for each year between 2000 and2016 can be estimated using a given confidence level. Different confidence values can be set for different research purposes. In this study, the confidence level is set as 0.95 based on the a priori knowledge of the European Maritime Safety Agency [18]. When the confidence intervals are arranged in chronological order, an uncertain time series is formed. The uncertain time series is represented in Figure 2, in which the accident frequency for each year 2000–2016 are represented by diamond icons and are connected by a line, the limits of the confidence interval are shown and connected by dotted lines.
According to Section 3, the uncertain time series in Figure 2 is split by the sliding window approach. The first year (2000) in the uncertain time series is regarded as the first segmentation. As can be seen in Figure 2, the vessel traffic accident frequency and the corresponding confidence interval in the year 2000 are 0.132 and [0.111, 0.156]. Since the vessel traffic accident frequency in the year 2001 is 0.133 and it does not exceed the confidence interval [0.111, 0.156], the year 2001 should be merged into the first segmentation. Then the confidence interval is updated to [0.117, 0.149] based on Equation (1). The vessel traffic accident frequency in the year 2002 is 0.107 and it exceeds the confidence interval [0.117, 0.149]. As a result, the second segmentation starts with the year 2002. The above-mentioned splitting procedure is repeated until the year 2016. Then four segmentations are obtained, which are the years 2000–2001, 2002–2004, 2005, and 2006–2016. The year 2005 fits the required situation that a single segmentation only contains one year. The mean value of the vessel traffic accident frequency during the years 2006–2016 can be calculated as 0.084 and it exceeds the confidence interval of the segmentation from the year 2002 to 2004, which is [0.096, 0.116]. This indicates that there is remarkable change between the segmentation from the year 2002 to 2004 and the segmentation from the year 2006 to 2016. As discussed in Section 3, the remarkable change between segmentations reflects the effects of technical or operational developments, new requirements, or specific arrangements on the vessel traffic being analyzed. Thus, the above-mentioned segmentations should not be merged. Finally, four segmentations are determined, which are the years 2000–2001, 2002–2004, 2005, and 2006–2016. The most recent segmentation, 2006–2016, is treated as the statistical time window.
Based on the selected time window (2006–2016), the aleatory uncertainty of the vessel traffic accident frequency can be quantified as [0.080, 0.089] for the confidence value 0.95. For accident consequences, triangular distributions are used for the epistemic uncertainty quantification. The triangular distribution has three parameters (i, j, k), where j denotes the most likely value when the membership function is 1; i and k respectively denote the lowest and the highest possible values when the membership function equals to 0 [29]. The trapezoidal distribution can also be selected to quantify the epistemic uncertainty, which is another commonly used possibility distribution. In other words, there is epistemic uncertainty when selecting the possibility distribution. In order to make epistemic uncertainty as small as possible, the triangular distribution is selected in this study because less information is required to model the triangular distribution than to model the trapezoidal distribution. When there is more information about the accident consequence, it is possible to select other possibility distributions to quantify the epistemic uncertainty of the accident consequence.
In the risk matrix, the accident consequence refers to the mean value of fatalities from each vessel traffic accident specifically. It can be measured in the number of fatalities per accident. In the time window (2006–2016), the lowest value, the mean value and the highest value of fatalities per accident per year can be calculated as [0.155, 0.255, 0.394], which are considered as the three parameters of the triangular distribution. According to Equation (5), the epistemic uncertainty of accident consequence can be quantified as [0.160, 0.387] for the confidence value 0.95. Since the aleatory uncertainty of the vessel traffic frequency and the epistemic uncertainty of the accident consequence are quantified for the same confidence value, they can be represented in one risk matrix, which is shown by the rectangle of solid lines in Figure 3.
In order to verify the availability of the proposed algorithms, two comparisons have been made. The first comparison is between the common method of estimating the vessel traffic risk and the algorithm proposed to quantify uncertainties. The common method [2,5] measures the vessel traffic accident frequency and the accident consequence by averaging the historical accident data in Table 1. Then the accident frequency and consequence are calculated as 0.095 and 0.279, respectively, which are represented by a cross symbol in Figure 3. Using the algorithm proposed to quantify uncertainties, the confidence interval of the vessel traffic accident frequency and consequence can be estimated as [0.092, 0.099] and [0.165, 0.389], which make the dashed rectangle seen in Figure 3. It should be noted that the seventeen most recent years (2000–2016) are taken as the time window in the first comparison. As can be seen in Figure 3, the cross symbol is in the dashed rectangle area. It means that the algorithm proposed to quantify uncertainties is effective and can provide more information for vessel traffic risk management.
The second comparison is carried out to verify the availability of the proposed algorithm for time window selection. It is obvious in Figure 3 that the vessel traffic risk considering the time window selection is less than the vessel traffic risk calculated by all the historical accident data in the risk matrix. The reason for this is that the algorithm for time window selection can reflect the effects of technical or operational developments, new requirements, or specific arrangements on the vessel traffic being analyzed. According to Table 1 and Figure 2, the vessel traffic risk declines overall from the year 2000 until 2016. Thus, the vessel traffic risk may be overestimated without considering the time window selection.

5. Discussion

As the time window used for the inclusion of data has a major effect on the uncertainty quantification of the vessel traffic risk, the algorithm for time window selection is proposed, which has several assumptions or simplifications. Thus, the possible effects of selecting the vessel traffic accident frequency as the index, selecting one year of data as a basis and the underreporting of vessel traffic accidents on the time window selection are discussed.

5.1. The Selection of the Vessel Traffic Accident Frequency as the Index

The vessel traffic risk can be measured in two dimensions by the risk matrix, which displays the frequency and the consequence of the vessel traffic accident at the same time. As discussed in the introduction section, the time window selection should be considered in the process of uncertainty analysis of the vessel traffic risk. As accident consequences are generated through a fuzzy development process after accidents occur and are often determined by incorporating expert judgements [18], the vessel traffic accident frequency is selected as the representative index for the time window selection in the uncertainty analysis for simplification. Then the epistemic uncertainty of the accident consequence is quantified based on all the information included in the selected time window. If the vessel traffic risk is measured by a one-dimension value, the algorithm for time window selection should apply to the time series of the product of the accident frequency and the accident consequence.
In order to discuss the possible effects of the simplification, the algorithm for time window selection applies to the time series of fatalities in Table 1. According to Equation (1), the confidence intervals of fatalities per accident for the 2000–2016 period can be estimated for the confidence value 0.95 and can be arranged to form the uncertain time series, which is shown in Figure 4. Fatalities per accident in Figure 4 are represented by diamond icons and are connected by a line; the limits of the confidence interval are shown and connected by dotted lines.
According to Section 3, the uncertain time series in Figure 4 can be split into four segmentations, which are the years 2000–2004, 2005, 2006–2011 and 2012–2016. By comparison with the segmentation result in Figure 2, we find that accident frequency declines while fatalities per accident remain stable from the years 2000 to 2004. In addition, the accident frequency remains stable while fatalities per accident decline from the year 2006 to 2016. The variation of the accident consequence is not always in accordance with that of the accident frequency and sometimes the volatility of the accident consequence is strong because of one accident with multiple fatalities. In this study, the vessel traffic accident frequency is selected as the representative index for the time window selection in the uncertainty analysis, which is one of the limitations of the work and should be studied further in the future.

5.2. The Epistemic Uncertainty of Selecting One Year of Data as a Basis

In the process of time window selection, one year of vessel traffic accident data is selected as a basis to calculate the confidence interval and to split the uncertainty time series of the vessel traffic accident frequency. As there is no a priori knowledge of selecting one year of data as a basis, this choice will introduce epistemic uncertainties. In order to discuss the possible effects of selecting one year of data as a basis on the time window selection, two years or three years of data are taken as the basis for comparative purposes. According to Equation (1), the confidence intervals of the vessel traffic accident frequency for every two years from the years 2001 to 2016 can be estimated for the confidence value 0.95 and can be arranged to form the uncertain time series, which is shown in Figure 5a. Similarly, the uncertain time series can be formed based on the confidence intervals calculated by every three years of the accident data from the years 2002 to 2016, which is shown in Figure 5b. In Figure 5a,b accident frequencies are represented by diamond icons and are connected by a line, while the limits of the confidence interval are shown and connected by dotted lines.
From the comparison of the uncertainty time series in Figure 2 and Figure 5, we can find that the longer the time interval of data selected as the calculation basis, the lower the volatility of the uncertain time series. According to Section 3, the uncertain time series in Figure 5a can be split into two segmentations, which are the years 2001–2006 and 2007–2016. The latest segmentation, 2007–2016, is considered as the statistical time window. Similarly, the uncertain time series in Figure 5b can also be split into two segmentations, which are the years 2002–2007 and 2008–2016. The latest segmentation, 2008–2016, is taken as the statistical time window. In Section 4, the segmentation, 2006–2016, is taken as the statistical time window when one year of vessel traffic accident data is selected as a basis in the process of time window selection. By comparison, the length of the time window selected by taking one year of data as a basis is longest. This means that more vessel traffic accident data can be included, which are useful for statistical analysis and uncertainty quantification.

5.3. Underreporting of Vessel Traffic Accidents

The level of quality in accident data has an important impact on vessel traffic risk analysis. However, it has been argued that a certain number of vessel traffic accidents may be unreported [30]. Although the underreporting of vessel traffic accidents is an important factor for the quantification of the actual vessel traffic risk level, there are few studies on this issue [31]. The underreporting of vessel traffic accidents is not considered in the process of uncertainty analysis in this study because the assumption of the underreporting rate will introduce epistemic uncertainties. The rate of underreporting can be defined as the ratio of the unreported accidents to the true number of accidents [31]. The possible effects of the underreporting of vessel traffic accidents on the time window selection are discussed below.
According to the research [32], the percentage of accidents, which are missing from the records, varies from database to database and the average number of unreported accidents makes up roughly 50% of all accidents. In addition, the underreporting rate of the United Kingdom’s maritime accident databases is estimated at 11% to 61% in the period from 2005 to 2009. Regardless of the degree of underreporting, the available data in this study will be complemented by additional data. When the rate of underreporting is assumed to be 50%, the number of vessel traffic accidents in Table 1 will be doubled. Similarly, the accident data will be complemented when the underreporting rate ranges from 11% to 61%. In such cases, the number of vessel traffic accidents is no longer an exact value but an interval of possible values.
Considering the underreporting of vessel traffic accidents, two uncertain time series of the vessel traffic accident frequency can be formed. The first uncertain time series is established when the rate of underreporting is 50%, which is shown in Figure 6a, whereas the second uncertain time series is formed when the rate of underreporting ranges from 11% to 61%, which is shown in Figure 6b. In Figure 6a, the accident frequencies for each year 2000–2016 are represented by diamond icons and are connected by a line. As the accident frequency is represented by the interval of possible values in Figure 6b, the upper and lower limits of the accident frequency are represented by square icons and circle icons, and are connected by lines, respectively. The limits of the confidence interval are shown and connected by dotted lines in Figure 6a,b.
By comparison, the uncertain time series in Figure 6a is similar to the uncertain time series in Figure 2. According to Section 3, the uncertain time series in Figure 6a is split into four segmentations, which are the years 2000–2001, 2002–2004, 2005, and 2006–2016. The latest segmentation, 2006–2016, is considered as the statistical time window, which is the same as the result of time window selection in Figure 2. Thus, no effects of the underreporting of vessel traffic accidents on the time window selection have been found when the underreporting rate is assumed to be an exact value. Using the sliding window approach described in Section 3 to split the uncertain time series in Figure 6b, we find that there is always an intersection between the interval of the vessel traffic accident frequency in the next year and the confidence interval of the former segmentation. In other words, the algorithm for time window selection proposed in this study may not work well in the case that the rate of underreporting is assumed to be an interval of possible values.

6. Conclusions

Uncertainty analysis is necessary when assessing the vessel traffic risk. It can be used to investigate the reliability of the risk assessment result, which is the basis for vessel traffic risk management. According to the uncertainty classification of the vessel traffic accident frequency and consequence, the Poisson distribution and the triangular distribution are selected for the uncertainty quantification. In addition, the algorithm for appropriate time window selection is used to make reasonable measurements of the uncertainties. The vessel traffic accident data for the years 2000–2016 from the United Kingdom’s marine accident investigation branch are used for the case study. It is worthy of mention that there are several simplifications and limitations in this study. First of all, the epistemic uncertainty of selecting the Poisson distribution is not considered in the process of quantifying aleatory uncertainty. Secondly, the triangular distribution is selected for the epistemic uncertainty quantification for simplification. In addition, the vessel traffic accident frequency is selected as the representative index for the time window selection in the uncertainty analysis for simplification. Afterwards, one year of vessel traffic accident data is selected as a basis to calculate the confidence interval and to split the uncertainty time series of the vessel traffic accident frequency for simplification. In addition, the underreporting of vessel traffic accidents is not considered. Finally, the algorithm for time window selection may not work well in cases that vessel traffic accident data are scarce. These issues are worth further investigation both from the theoretical and practical points of view.

Author Contributions

M.S. conceived the idea, carried out the literature review and contributed analysis tools. M.S. and Z.Z. collected and processed the data, and contributed in writing the final version of the manuscript.

Funding

This research was funded by [National Natural Science Foundation of China] grant number [51509031].

Acknowledgments

This work was supported by the National Natural Science Foundation of China (No. 51509031).

Conflicts of Interest

The authors declare no conflict of interest. Funding sponsors had no role in the design of the study, in the collection, analyses, or interpretation of data, in the writing of the manuscript, and in the decision to publish the results.

References

  1. International Maritime Organization (IMO). Revised Guidelines for Formal Safety Assessment (FSA) for Use in the IMO Rule-Making Process. 2013. Available online: http://research.dnv.com/skj/IMO/MSC-MEPC%202_Circ%2012%20FSA%20Guidelines%20Rev%20III.pdf (accessed on 2 April 2018).
  2. Endrina, N.; Rasero, J.C.; Konovessis, D. Risk analysis for RoPax vessels: A case of study for the Strait of Gibraltar. Ocean Eng. 2018, 151, 141–151. [Google Scholar] [CrossRef]
  3. Duijm, N.J. Recommendations on the use and design of risk matrices. Saf. Sci. 2015, 76, 21–31. [Google Scholar] [CrossRef] [Green Version]
  4. Aven, T. Improving risk characterisations in practical situations by highlighting knowledge aspects, with applications to risk matrices. Reliab. Eng. Syst. Saf. 2017, 167, 42–48. [Google Scholar] [CrossRef]
  5. Goerlandt, F.; Reniers, G. On the assessment of uncertainty in risk diagrams. Saf. Sci. 2016, 84, 67–77. [Google Scholar] [CrossRef]
  6. Li, S.; Meng, Q.; Qu, X. An overview of maritime waterway quantitative risk assessment models. Risk Anal. 2012, 32, 496–512. [Google Scholar] [CrossRef] [PubMed]
  7. Goerlandt, F.; Montewka, J. Maritime transportation risk analysis: Review and analysis in light of some foundational issues. Reliab. Eng. Syst. Saf. 2015, 138, 115–134. [Google Scholar] [CrossRef]
  8. Lim, G.J.; Cho, J.; Bora, S.; Biobaku, T.; Parsaei, H. Models and computational algorithms for maritime risk analysis: A review. Ann. Oper. Res. 2018, 265, 1–22. [Google Scholar] [CrossRef]
  9. Fernandes, R.; Braunschweig, F.; Lourenco, F.; Neves, R. Combining operational models and data into a dynamic vessel risk assessment tool for coastal regions. Ocean Sci. 2016, 12, 285–317. [Google Scholar] [CrossRef]
  10. Dong, Y.; Frangopol, D.M. Probabilistic ship collision risk and sustainability assessment considering risk attitudes. Struct. Saf. 2015, 53, 75–84. [Google Scholar] [CrossRef]
  11. Goerlandt, F.; Kujala, P. On the reliability and validity of ship-ship collision risk analysis in light of different perspectives on risk. Saf. Sci. 2014, 62, 348–365. [Google Scholar] [CrossRef]
  12. Montewka, J.; Goerlandt, F.; Kujala, P. On a systematic perspective on risk for formal safety assessment (FSA). Reliab. Eng. Syst. Saf. 2014, 127, 77–85. [Google Scholar] [CrossRef]
  13. Sormunen, O.V.E.; Goerlandt, F.; Häkkinen, J.; Posti, A.; Hänninen, M.; Montewka, J.; Ståhlberg, K.; Kujala, P. Uncertainty in maritime risk analysis: Extended case study on chemical tanker collisions. P. I. Mech. Eng. M-J. Eng. 2015, 229, 303–320. [Google Scholar] [CrossRef]
  14. Merrick, J.R.W.; Van Dorp, R. Speaking the truth in maritime risk assessment. Risk Anal. 2006, 26, 223–237. [Google Scholar] [CrossRef] [PubMed]
  15. Baraldi, P.; Zio, E. A combined Monte Carlo and possibilistic approach to uncertainty propagation. Risk Anal. 2008, 28, 1309–1325. [Google Scholar] [CrossRef] [PubMed]
  16. Zhao, J.; Lv, J. Comparing prediction methods for maritime accidents. Transp. Plan. Technol. 2016, 39, 813–825. [Google Scholar] [CrossRef]
  17. International Maritime Organization (IMO). Formal Safety Assessment: FSA-Cruise Ships. 2008. Available online: http://www.safedor.org/resources/MSC_85-INF-2.pdf (accessed on 2 April 2018).
  18. European Maritime Safety Agency (EMSA). Risk Acceptance Criteria and Risk Based Damage Stability, Final Report, Part 2: Formal Safety Assessment. 2015. Available online: http://emsa.europa.eu/publications/technical-reports-studies-and-plans.html (accessed on 10 February 2018).
  19. Sankararaman, S.; Mahadevan, S. Separating the contributions of variability and parameter uncertainty in probability distributions. Reliab. Eng. Syst. Saf. 2013, 112, 187–199. [Google Scholar] [CrossRef]
  20. Talavera, A.; Aguasca, R.; Galvan, B.; Cacereno, A. Application of Dempster-Shafer theory for the quantification and propagation of uncertainty caused by the use of AIS data. Reliab. Eng. Syst. Saf. 2013, 111, 95–105. [Google Scholar] [CrossRef]
  21. Rohmer, J.; Baudrit, C. The use of the possibility theory to investigate the epistemic uncertainties within scenario-based earthquake risk assessments. Nat. Hazards 2011, 56, 613–632. [Google Scholar] [CrossRef]
  22. Fang, T.T.; Lahdelma, R. Optimization of combined heat and power production with heat storage based on sliding time window method. Appl. Energy 2016, 162, 723–732. [Google Scholar] [CrossRef]
  23. Haapasaari, P.; Helle, I.; Lehikoinen, A.; Lappalainen, J.; Kuikka, S. A proactive approach for maritime safety policy making for the Gulf of Finland: Seeking best practices. Mar. Policy 2015, 60, 107–118. [Google Scholar] [CrossRef]
  24. Yu, Y.F.; Zhu, Y.L.; Li, S.J.; Wan, D.S. Time series outlier detection based on sliding window prediction. Math. Probl. Eng. 2014, 2014, 1–14. [Google Scholar] [CrossRef]
  25. Krishnamoorthy, K.; Peng, J.; Zhang, D. Modified large sample confidence intervals for Poisson distributions: Ratio, weighted average, and product of means. Commun. Stat.-Theory Methods 2016, 45, 83–97. [Google Scholar] [CrossRef]
  26. Andre, J.C.S.; Lopes, D.R. On the use of possibility theory in uncertainty analysis of life cycle inventory. Int. J. Life Cycle Assess. 2012, 17, 350–361. [Google Scholar] [CrossRef]
  27. Wang, W.; Liu, G.; Liu, D. Chebyshev similarity match between uncertain time series. Math. Probl. Eng. 2015, 5, 1–13. [Google Scholar] [CrossRef]
  28. Marine Accident Investigation Branch (MAIB). MAIB Annual Report 2016. Available online: https://www.gov.uk/government/publications/maib-annual-report-2016 (accessed on 23 January 2018).
  29. Wang, S.; Huang, G.H.; Baetz, B.W.; Huang, W. Probabilistic inference coupled with possibilistic reasoning for robust estimation of hydrologic parameters and piecewise characterization of interactive uncertainties. J. Hydrometeorol. 2016, 17, 1243–1260. [Google Scholar] [CrossRef]
  30. Sormunen, O.V.; Hänninen, M.; Kujala, P. Marine traffic, accidents, and underreporting in the Baltic Sea. Sci. J.-Marit. Univ. Szczec. 2016, 46, 163–177. [Google Scholar] [CrossRef]
  31. Psarros, G.; Skjong, R.; Eide, M.S. Under-reporting of maritime accidents. Accid. Anal. Prev. 2010, 42, 619–625. [Google Scholar] [CrossRef] [PubMed]
  32. Hassel, M.; Asbjørnslett, B.E.; Hole, L.P. Underreporting of maritime accidents to vessel accident databases. Accid. Anal. Prev. 2011, 43, 2053–2063. [Google Scholar] [CrossRef] [PubMed]
Figure 1. Flowchart for splitting uncertain time series.
Algorithms 11 00060 g001
Figure 2. Uncertain time series of the vessel traffic accident frequency.
Algorithms 11 00060 g002
Figure 3. The risk matrix of the vessel traffic risk.
Algorithms 11 00060 g003
Figure 4. Uncertain time series of fatalities per accident.
Algorithms 11 00060 g004
Figure 5. (a) Uncertain time series calculated by every two years of accident data; (b) Uncertain time series calculated by every three years of accident data.
Algorithms 11 00060 g005
Figure 6. (a) Uncertain time series when the rate of underreporting is 50%; (b) Uncertain time series when the rate of underreporting ranges from 11% to 61%.
Algorithms 11 00060 g006
Table 1. Vessel traffic accident data.
Year200020012002200320042005200620072008
Number of vessels105010471210134314061443148015181578
Number of vessel traffic accidents139139129146144197130116131
Number of fatalities484748504938384646
Year20092010201120122013201420152016
Number of vessels15641520152114501392136113851365
Number of vessel traffic accidents128141115133122120118107
Number of fatalities3836352619212321

