Article

Effects of Dietary and Fecal Microbial Transplant Treatments on Fecal Characteristics, Metabolites, and Microbiota of Adult Cats Treated with Metronidazole

by
Sara E. Martini
1,
Patrícia M. Oba
1,
Jan S. Suchodolski
2 and
Kelly S. Swanson
1,3,4,*
1
Department of Animal Sciences, University of Illinois Urbana-Champaign, Urbana, IL 61801, USA
2
Gastrointestinal Laboratory, Department of Small Animal Clinical Sciences, Texas A&M University, College Station, TX 77843, USA
3
Division of Nutritional Sciences, University of Illinois Urbana-Champaign, Urbana, IL 61801, USA
4
Department of Veterinary Clinical Medicine, University of Illinois Urbana-Champaign, Urbana, IL 61801, USA
*
Author to whom correspondence should be addressed.
Submission received: 2 June 2025 / Revised: 12 July 2025 / Accepted: 24 July 2025 / Published: 29 July 2025

Abstract

Antibiotics may be used for gastrointestinal enteropathies but research has demonstrated significant microbiota dysmetabolism, fermentation pattern alterations, and prolonged dysbiosis following treatment. The objective of this study was to determine how dietary fiber or fecal microbial transplant (FMT) treatments impacted the fecal characteristics, metabolite concentrations, and microbiota populations of cats treated with metronidazole. Twenty-five healthy adult cats (6.75 ± 1.20 yr) were fed a commercial kibble diet for 2 wk, administered metronidazole (20 mg/kg BW BID) for 2 wk, then monitored for 4 wk. Cats were allotted to one of three interventions (diet, diet + beet pulp, diet + FMT) for 1 wk, interventions ceased, then recovery was monitored for 4 wk. Fresh fecal samples were collected at the end of each phase and at the mid-points of recovery. As anticipated, metronidazole increased fecal scores and moisture (p < 0.05), reduced fecal bacterial alpha diversity (p < 0.0001), and reduced fecal metabolite concentrations. Few treatment effects were detected, with antibiotic recovery contributing to many of the results observed. Dysbiosis was persistent throughout the study, with 4/25 cats still demonstrating mild dysbiosis after 9 wk. Overall, dietary or FMT treatments may aid in accelerated antibiotic recovery in cats but further research is needed to refine treatments for greater efficacy.

1. Introduction

Focus on the gastrointestinal (GI) microbiome has increased within the last several years, due to its well-known relationships with and roles in host metabolism. In healthy individuals, the GI microbiome has a wide variety of functions in maintaining host GI homeostasis, synthesis of metabolites [i.e., short-chain fatty acids (SCFA), secondary bile acids (BA)] and is involved in gut barrier function. The composition of the microbiome can influence its ability to serve in these roles and when imbalanced, can be referred to as dysbiosis. Mostly defined by a reduction in overall microbial diversity, loss of beneficial bacteria, and an increase in pathobionts and alteration of GI metabolism, dysbiosis is prevalent in many forms of GI disease and has been suggested to play a role in GI disease progression [1,2,3,4,5,6,7]. In more recent years, analysis of the GI microbiome using quantitative polymerase chain reaction (qPCR) analysis has demonstrated common and negatively associated shifts in microbial abundances in cats with chronic enteropathies (CE). Discussed in Sung et al. [7], abundances of Escherichia coli and Streptococcus increase while Bacteroides, Bifidobacterium, Faecalibacterium, Peptacetobacter (Clostridium) hiranonis, and Turicibacter decrease during dysbiosis in cats with CE. While not necessarily an indication of CE or GI diseases, dysbiosis is considered to be a primary contributor to antibiotic-associated GI signs in cats [8].
Clinical signs often vary between forms of CE but can present as weight loss, vomiting, hyporexia, and diarrhea over a prolonged (≥3-wk duration) period of time, and are often diagnosed through elimination of extra-intestinal diseases [7,9,10,11,12]. Treatment of CE can range but common methods include steroid/immunosuppressive therapies, dietary treatment, or antibiotic treatment. While antibiotics continue to be a crucial treatment in veterinary medicine, the type of antibiotics prescribed is traditionally based on published guidelines (i.e., case presentation, clinical signs) and mechanistic classification (bacteriostatic or bactericidal). In a recent analysis [13] reported that 72% (1724 total prescriptions) of antibiotics prescribed to dogs and cats at the time of study were bactericidal agents and either penicillins (691/1724) or fluoroquinolones (574/1724). Of the antibiotics prescribed to cats, urinary (23.3%), GI (21.6%), and respiratory (13.1%) tracts were among the most common targets for treatment [13]. Despite high efficacy in reducing microbial diversity, previous studies have associated antibiotic use with profound and prolonged imbalances to the fecal microbiome and metabolome of humans and animals, which can increase the risk of developing antibiotic-induced dysbiosis, relapse for bacterial infections and/or development of antibiotic resistance [14,15,16,17,18,19,20,21,22].
As an alternative treatment, the incorporation of functional dietary ingredients (i.e., dietary fiber or “biotics” such as pre-, pro- and post-biotics) or alterations to diet composition (i.e., protein, fat, or fiber content) may be considered for nutrition-based interventions. The International Scientific Association for Probiotics and Prebiotics have defined each of these “biotics”. Prebiotics are substrates that are selectively utilized by host microorganisms conferring a health benefit [23], whereas probiotics are live microorganisms that, when administered in adequate amounts, confer a health benefit on the host [24]. More recently defined are postbiotics, which are preparations of inanimate microorganisms and/or their components that confer a health benefit on the host [25]. Commonly used to beneficially modulate the GI microbiota, the literature regarding the benefits observed through functional ingredient inclusion are conflicting, suggesting highly individualized responses, with some of the reported differences more emphasized within target populations (i.e., animals with bacterial infection, gastroenteritis, diarrhea or constipation) [26,27]. Mostly studied in dogs with CE, evidence supporting the use of nutrition or diet-based interventions suggests that these interventions may be useful in animals with food-responsive enteropathies [28,29,30]. It should be noted that there is very limited research using dietary intervention in cats with CE but of the studies available, elimination or hydrolyzed diets have evidence supporting resolution of GI signs and/or improvements to clinical markers [9,11,31,32].
Gaining traction for use in severe cases of GI disease, the application of fecal microbial transplant (FMT) procedures is based around the transfer of microbiota collected from a healthy donor and provided to a diseased patient as an alternative to drug-based treatments and is presently used in human medicine [33]. Currently, there are no standards or methods for performing FMT in small animals and many aspects (i.e., donor selection, preparation and administration techniques) should be considered prior to and during treatment [34,35]. FMT research is greatly limited in clinically ill dogs with even less available research in cats [36,37,38,39,40,41,42]. Overall conclusions from those studies have suggested quicker recovery, with major limitations involving different disease phenotypes and the lack of consistent preparation and handling techniques.
Research is limited in cats treated with antibiotics as well as overall research comparing different intervention strategies, specifically dietary interventions compared to FMT administration, throughout recovery. In the current study, the objective was to determine how fiber supplementation or FMT treatment affected the fecal characteristics, metabolite concentrations, and microbiota populations of adult cats treated with metronidazole. Given that literature regarding FMT administration suggests quick recovery, we hypothesized that cats allotted to FMT administration would recover quicker than cats supplemented with fiber, with control-fed cats demonstrating the slowest recovery to fecal microbiota and metabolite concentrations. While FMT can promote rapid microbiome colonization and stabilization, inclusion of dietary fibers has also been shown to promote microbial growth and metabolite production, thereby supporting a potentially more homeostatic and healthier microbiome.

2. Materials and Methods

2.1. Animals, Diet, and Experimental Design

Twenty-five healthy domestic shorthair adult cats [mean age = 6.75 ± 1.20 yr; mean body weight (BW) = 4.12 ± 0.66 kg] were used in a longitudinal completely randomized study. All cats were housed in an environmentally controlled facility at the University of Illinois Urbana-Champaign. Cats were group-housed, except for feeding times when all cats were individually housed to measure food offered and refused to calculate intake, in addition to days when fresh fecal samples were collected to adequately measure individualized outcomes. Cats were socialized at least twice per week, which provided them with the ability to socialize with humans and other cats.
Cats had free access to fresh water at all times and were fed twice daily (8 am; 3 pm) at a rate to maintain BW at the beginning of the study. Cats were fed a commercial extruded dry diet (Purina Cat Chow; Nestlé Purina PetCare Company, St. Louis, MO, USA) formulated to meet all nutrient recommendations provided by the Association of American Feed Control Officials (AAFCO) for adult cats at maintenance [43]. Food offered and refused was measured each day to calculate intake and any observations of vomiting or negative reactions were recorded.
The study was 13 wk in length (Figure 1) and began with a 2-wk baseline where all cats consumed the basal diet only. After baseline, cats received metronidazole (Metronidazole Compounded Oil Liquid Chicken Flavored; Chewy, Inc., Boston, MA, USA) at a dosage of 20 mg/kg orally twice daily (at meal times) for 2 wk. Recovery was monitored for 4 wk, then cats were allotted to 1 of 3 interventions [diet only (CTRL); diet + beet pulp (FIB); diet + FMT (FMT)] for 1 wk. Interventions ceased and recovery was monitored for 4 wk. Cats were weighed and body condition scores were assessed using a 9-point scale [44] once a week prior to the morning feeding throughout the study. At d 0, 14, 28, 42, 49, 63, and 77, overnight fasted blood samples and fresh fecal samples (within 15 min of defecation) were collected.
During intervention (d 43–49), beet pulp was top-dressed on the basal diet and was supplemented to increase total dietary fiber (TDF) consumption up to 10% TDF [on a dry matter (DM) basis]. The amount of fiber supplemented was calculated based on individual intakes (range: 0.900–1.198 g beet pulp/d). FMT capsules were orally administered prior to food offering to ensure treatment was administered and tolerated. To increase palatability and acceptance of beet pulp supplementation, 5 mL of a bone-broth topper (Nulo FreeStyle Grain-Free Home-Style Chicken Bone Broth Dog & Cat Topper; Nulo Pet Food, Austin, TX, USA) was applied to the food. Broth was added to the diets of all cats to avoid any treatment-based confounders. All interventions were well tolerated and no adverse reactions were recorded.
Preparation of FMT Capsules
Prior to the study, fecal matter was collected from one 5-yr-old, healthy spayed female cat consuming a mix of dry and wet foods formulated to meet the needs of an adult cat at maintenance [43]. The donor had no known health conditions or intestinal parasites (i.e., worms), had not received antibiotics within the past two yr, and was not actively on medications. All donor samples were collected and screened using qPCR techniques from Texas A&M University, measuring the abundance of total bacteria and target bacterial taxa (Bacteroides, Blautia, Bifidobacterium, E. coli, Faecalibacterium, Fusobacterium, P. hiranonis, Streptococcus, and Turicibacter), and calculating the dysbiosis index (DI) according to Sung et al. [7] (Supplementary Table S1). Naturally voided fecal samples were collected, and cleaned of any litter, hair and foreign material prior to lyophilization. Fecal powder was encapsulated in size 4 capsules and shipped on dry ice to the University of Illinois Urbana-Champaign. Samples were stored at −20 °C until time of FMT treatment.

2.2. Chemical Analyses of the Diet

Diets were subsampled and ground through a 2 mm screen using a Wiley mill (model 4, Thomas Scientific, Swedesboro, NJ, USA). Procedures from the Association of Official Analytic Chemists (AOAC) were used to determine DM and ash [45], with organic matter being calculated. Crude protein content was calculated from Leco total N values (TruMac N, Leco Corporation, St. Joseph, MI, USA) [46]. Total lipid content was determined using acid hydrolysis and extraction methods facilitated by ANKOM Technology equipment (Hydrolysis System, XT15 Extractor, and RD Dryer; Macedon, NY, USA). Total dietary fiber content was measured using methods according to Prosky et al. [46]. Gross energy was determined using an oxygen bomb calorimeter (model 6200, Parr Instruments, Moline, IL, USA). The analyzed chemical composition of the experimental diet is reported in Supplementary Table S2.

2.3. Blood Sample Collections and Analysis

On d 0, 14, 28, 42, 49, 63, and 77, overnight fasted blood samples were collected via jugular or cephalic venipuncture. To collect blood, cats were sedated for at least 30 min with a mix of dexmedetomidine (Dexdomitor; 0.02 mg/kg BW; Zoetis, Parsippany-Troy Hills, NJ, USA) and butorphanol tartrate (Torbugesic; 0.4 mg/kg BW; Zoetis, Parsippany-Troy Hills, NJ, USA). After samples were collected, the reversal agent, atipamezole hydrochloride (Antisedan; 0.2 mg/kg BW; Zoetis, Parsippany-Troy Hills, NJ, USA), was administered. Blood was collected into serum tubes containing a clot activator and gel for serum separation (BD Vacutainer SST Tubes #367988, Becton Dickinson, Franklin Lakes, NJ, USA) for serum metabolite concentrations and into whole blood tubes containing K2EDTA additive (BD Microtainer Tubes #363706; Becton Dickinson) for complete blood count (CBC). Blood for serum isolation was centrifuged 1800× g at 4 °C for 10 min (Beckman CS-6R Centrifuge; Beckman Coulter Inc., Brea, CA, USA). Serum was then submitted to the University of Illinois Veterinary Medicine Diagnostics Laboratory for serum chemistry analysis. Samples in K2EDTA tubes were cooled (but not frozen) and submitted to the University of Illinois Veterinary Medicine Diagnostics Laboratory for CBC analysis.

2.4. Fecal Scoring and Sample Collection

On d 0, 14, 28, 42, 49, 63, and 77, fresh fecal samples were collected for measurement of pH, DM content, microbiota populations, and SCFA, branched-chain fatty acid (BCFA), phenol, indole, and ammonia concentrations. Fecal scores were recorded based on the following scale: 1 = hard, dry pellets, small hard mass; 2 = hard, formed, dry stool; remains firm and soft; 3 = soft, formed, and moist stool, retains shape; 4 = soft, unformed stool, assumes the shape of container; and 5 = watery, liquid that can be poured. Fecal pH was measured immediately using an AP10 pH meter (Denver Instrument, Bohemia, NY, USA) with a Beckman Electrode (Beckman Instruments Inc., Fullerton, CA, USA). After pH was measured, an aliquot was collected for DM determination in accordance with AOAC [46] using a 105 °C oven. An aliquot for phenol and indole measurement was frozen at −20 °C until analysis. An aliquot collected for SCFA, BCFA, and ammonia analyses was diluted in a 1:1 ratio (w/v) of feces: 2 N HCl and frozen at −20 °C until analysis. Other aliquots were collected into sterile cryogenic vials (Corning Inc., Corning, NY, USA), immediately frozen in dry ice, and stored at −80 °C until analysis for microbiota.

2.5. Fecal SCFA, BCFA, Ammonia, Phenol, and Indole Analysis

Fecal SCFA and BCFA concentrations were determined by gas chromatography according to Erwin et al. [47] using a gas chromatograph (Hewlett-Packard 5890A series II, Palo Alto, CA, USA) and a glass column (180 cm × 4 mm i.d.) packed with 10% SP-1200/1% H3PO4 on 80/100 + mesh Chromosorb WAW (Supelco Inc., Bellefonte, PA, USA). Nitrogen was the carrier with a flow rate of 75 mL/min. Oven, detector, and injector temperatures were 125 °C, 175 °C, and 180 °C, respectively. Fecal ammonia concentrations were determined according to the method of Chaney and Marbach [48]. Fecal phenol and indole concentrations were determined using gas chromatography according to the methods described by Flickinger et al. [49].

2.6. Fecal DNA Extraction and MiSeq Illumina Sequencing for 16S Amplicons

Fecal bacteria identification and abundances were determined with two different methods. First, fecal bacterial DNA used for 16S rRNA sequencing was extracted from an aliquot using the DNeasy PowerLyzer PowerSoil Kit (MoBio Laboratories, Carlsbad, CA, USA) according to the manufacturer’s protocol. Samples underwent bead beating using a vortex, followed by further centrifugation to purify DNA, then quantified using a Qubit 3.0 Fluorometer (Life Technologies, Grand Island, NY, USA). DNA quality was determined using an E-Gel Power Snap Electrophoresis Device (Invitrogen, Waltham, MA, USA) on E-Gel EX 1% agarose gels. Concentration of extracted DNA was quantified using a Qubit 3.0 Fluorometer (Life Technologies) and then submitted to the Roy J. Carver Biotechnology Center at the University of Illinois for Illumina sequencing with 16S rRNA gene amplicons that were generated using a Fluidigm Access Array (Fluidigm Corporation, South San Francisco, CA, USA) in combination with Roche High Fidelity Fast Start Kit (Roche, Indianapolis, IN, USA). The primers 515F (5′-GTGCCAGCMGCCGCGGTAA-3′) and 806R (5′-GGACTACHVGGGTWTCTAAT-3′) that target a 252 bp-fragment of the V4 region of the 16S rRNA gene were used for amplification (primers synthesized by IDT Corp., Coralville, IA, USA) [47]. CS1 forward tags and CS2 reverse tags were added according to the Fluidigm protocol. The quality of the amplicons was assessed using a Fragment Analyzer (Advanced Analytics, Ames, IA, USA) to confirm amplicon regions and sizes. A DNA pool was generated by combining equimolar amounts of the amplicons from each sample. The pooled samples were then size-selected on a 2% agarose E-gel (Life Technologies) and extracted using a Qiagen gel purification kit (Qiagen, Valencia, CA, USA). Cleaned size-selected pooled products were run on an Agilent Bioanalyzer to confirm the appropriate profile and average size. Illumina sequencing was then performed on a MiSeq using v3 reagents (Illumina Inc., San Diego, CA, USA) at the Roy J. Carver Biotechnology Center at the University of Illinois.

2.7. QIIME2 Bioinformatics Analysis

Illumina 16S rRNA gene amplicon sequencing produced a total of 7,467,400 sequences, with an average of 42,670 sequences per sample. Forward reads were trimmed using the FASTX-Toolkit (version 0.0.14), and sequences were analyzed using QIIME 2.0 version 2024.5 [50]. Raw sequence amplicons were imported into the QIIME2 package and analyzed by the DADA2 pipeline for quality control (QC value ≥ 20) [51]. A total of 6,389,020 reads were retained after quality control, with an average of 36,508 reads (range = 21,418 to 47,333) per sample. Samples were then rarefied to 21,418 reads. On average, 58.67% of features and 100% of the samples were retained after rarefaction. Subsequent samples were assigned to taxonomic groups with the SILVA database (SILVA 138 99% OTU from 515F/806R region of sequences, with the QIIME2 classifier trained on 515F/806R V4 region of 16S) [52,53,54]. The rarefied samples were used for alpha and beta diversity analyses. Principal coordinates analysis was performed using weighted and unweighted unique fraction metric (UniFrac) distances [55].

2.8. qPCR and DI Analysis

The second method used for quantifying bacterial abundances was qPCR analysis of select bacterial taxa and was performed with specific primers targeting Bacteroides, Blautia, Bifidobacterium, E. coli, Faecalibacterium, Fusobacterium, P. hiranonis, Streptococcus, Turicibacter, and universal bacteria as described in Sung et al. [7]. Briefly, the conditions for qPCR were as follows: initial denaturation at 98 °C for 2 min, then 35 cycles with denaturation at 98 °C for 3 s, and annealing for 3 s. Melt curve analysis was performed to validate the specific generation of the qPCR product using these conditions: 60 to 90 °C with an increase of 0.5 °C for 5 s. Each reaction was run in duplicate. The qPCR data were expressed as the log amount of DNA (fg) for each particular bacterial group/10 ng of isolated total DNA as reported previously [56,57]. The degree of dysbiosis is represented as a single numerical value that measures the closeness of a taxa compared to the mean abundances derived from healthy and diseased populations and is calculated by an Euclidean distance model, as detailed in Sung et al. [7]. Using this DI system, a score less than zero is considered healthy and “normal”, while any score greater than > 1 denotes extreme dysbiosis. A DI of 0–1 represents an equivocal outcome.

2.9. Statistical Analysis

All data were analyzed using the Mixed Models procedure of SAS version 9.4 (SAS Institute Inc., Cary, NC, USA), with treatment considered a fixed effect and cat a random effect. Reported pooled standard errors of the mean were determined according to the Mixed Models procedure of SAS and accounted for the differences in allotted group size. Data were tested for normality using the UNIVARIATE procedure of SAS. If data did not meet normality criteria, a logarithmic transformation was applied. If transformation failed, data were analyzed using npa1rway procedures and Wilcoxson statistics were used to determine significance. To determine the effect of metronidazole (d 0 vs. d 14), data were analyzed to compare pre- and post-administration conditions. To determine dietary effects (d 14 vs. d 28–77), data were analyzed as repeated measures, with the same model parameters as above, and with identical normality and transformation methods described above. Change from d 14 differences due to treatment, time, and treatment*time were determined using a Fisher-protected least significant difference with a Tukey adjustment to control for experiment-wise error. To determine statistical significance, a probability of p < 0.05 was accepted with trends considered at p < 0.10.

3. Results

3.1. Effects of Metronidazole Administration

All animals remained clinically healthy for the duration of the study. Metronidazole did not significantly affect food intake, BW, or body condition scores (Supplementary Table S3).
Few serum chemistry measures (Supplementary Table S4) and CBC values (Supplementary Table S5) were altered by metronidazole. All serum chemistry markers were within reference intervals, except for glucose and cholesterol concentrations, which were slightly higher than reference ranges for adult cats prior to metronidazole administration. Of the other serum chemistry measures, creatinine, blood urea nitrogen, albumin–globulin ratio, gamma-glutamyl transferase, and anion gap were lower (p < 0.05) after metronidazole administration. Following metronidazole, globulin, calcium, chloride, and alkaline phosphatase were higher (p < 0.05). CBC values were all within reference ranges for adult cats. Mean corpuscular hemoglobin and eosinophils (%) were reduced following metronidazole (p < 0.01), while all other counts were unaffected.
Fecal scores increased (p = 0.0004; looser stools) and fecal DM percentage decreased (p = 0.0003) following metronidazole administration, but fecal pH was not affected (Table 1). Of the fecal metabolites measured, SCFA (total, acetate, propionate, butyrate), BCFA (total, isobutyrate, isovalerate, valerate), total phenol/indole, and ammonia concentrations were reduced after metronidazole administration (p < 0.0001).
Metronidazole administration had a significant effect on fecal microbiota populations. Fecal DI and qPCR-based bacterial abundances were drastically altered with metronidazole (Table 2). The DI and fecal Bifidobacterium, E. coli, and Streptococcus abundances were increased (p < 0.0001), while fecal Bacteroides, Blautia, Faecalibacterium, P. hiranonis, and Turicibacter abundances were decreased (p < 0.0001) following metronidazole administration. Fecal total bacteria and Fusobacterium abundance were not affected by metronidazole.
Microbiota databased on 16S rRNA sequencing analysis also showed the drastic effects from metronidazole administration (Supplementary Table S6). At the phylum level, Bacteroidota, Fusobacteriota, and Proteobacteria relative abundances increased (p < 0.05), while Desulfobacterota relative abundance decreased (p = 0.0024) following metronidazole administration. Of the over 80 bacterial genera that were affected, fecal Bifidobacterium, Enterococcus, Lactobacillus, Pediococcus, Streptococcus, Escherichia-Shigella, and Sutterella relative abundances were increased (p < 0.0001) following metronidazole administration. In contrast, the relative abundances of fecal Bacteroides, Parabacteroides, Prevotella, Catenibacterium, [Ruminococcus]_gnavus_group, Blautia, Butyricicoccus, Faecalibacterium, Holdemanella, Lachnospiraceae unclassified, Megamonas, Megasphaera, Negativibacillus, Peptoclostridium, Peptococcus, Phascolarctobacterium, Subdoligranulum, Turicibacter, and Succinivibrio relative abundances were decreased (p < 0.05) following metronidazole administration.
Metronidazole administration had a strong influence on microbial diversity, with all bacterial alpha diversity measures [Shannon Diversity, Faith’s PD (phylogenetic diversity), and evenness] being reduced (p ≤ 0.0001) after antibiotic administration (Supplementary Table S7). Bacterial beta diversity measures, represented by unweighted and weighted principal coordinate analysis plots based on UniFrac distances demonstrated separate clustering of cats before and after antibiotic administration (p = 0.001; Supplementary Figure S1).

3.2. Food Intake, BW, and Body Condition Scores During Metronidazole Recovery

During metronidazole recovery, there were few differences observed in food intake and BW (Supplementary Table S8). Cats consuming CTRL or FIB had higher food intake than those dosed with FMT (p < 0.01). Additionally, BW was altered by treatment and time, with reductions observed in the days following antibiotic cessation in all treatment groups. Despite having greater food intake, cats consuming FIB had lost weight by the end of study, whereas animals consuming CTRL or dosed with FMT had greater BW. Despite the differences to food intake and BW, no significant changes were observed to body condition scores.

3.3. Serum Chemistry and CBC During Metronidazole Recovery

Many serum chemistry (Supplementary Table S9) and CBC (Supplementary Table S10) changes due to treatment or time were identified following metronidazole administration. Of the outcomes measured, only cholesterol, hemoglobin, mean corpuscular hemoglobin (g/dL), mean cell volume, and lymphocytes (%) were affected by a treatment*time interaction. Because all animals were considered healthy, these changes are not believed to have physiological relevance.

3.4. Fecal Characteristics and Metabolites During Metronidazole Recovery

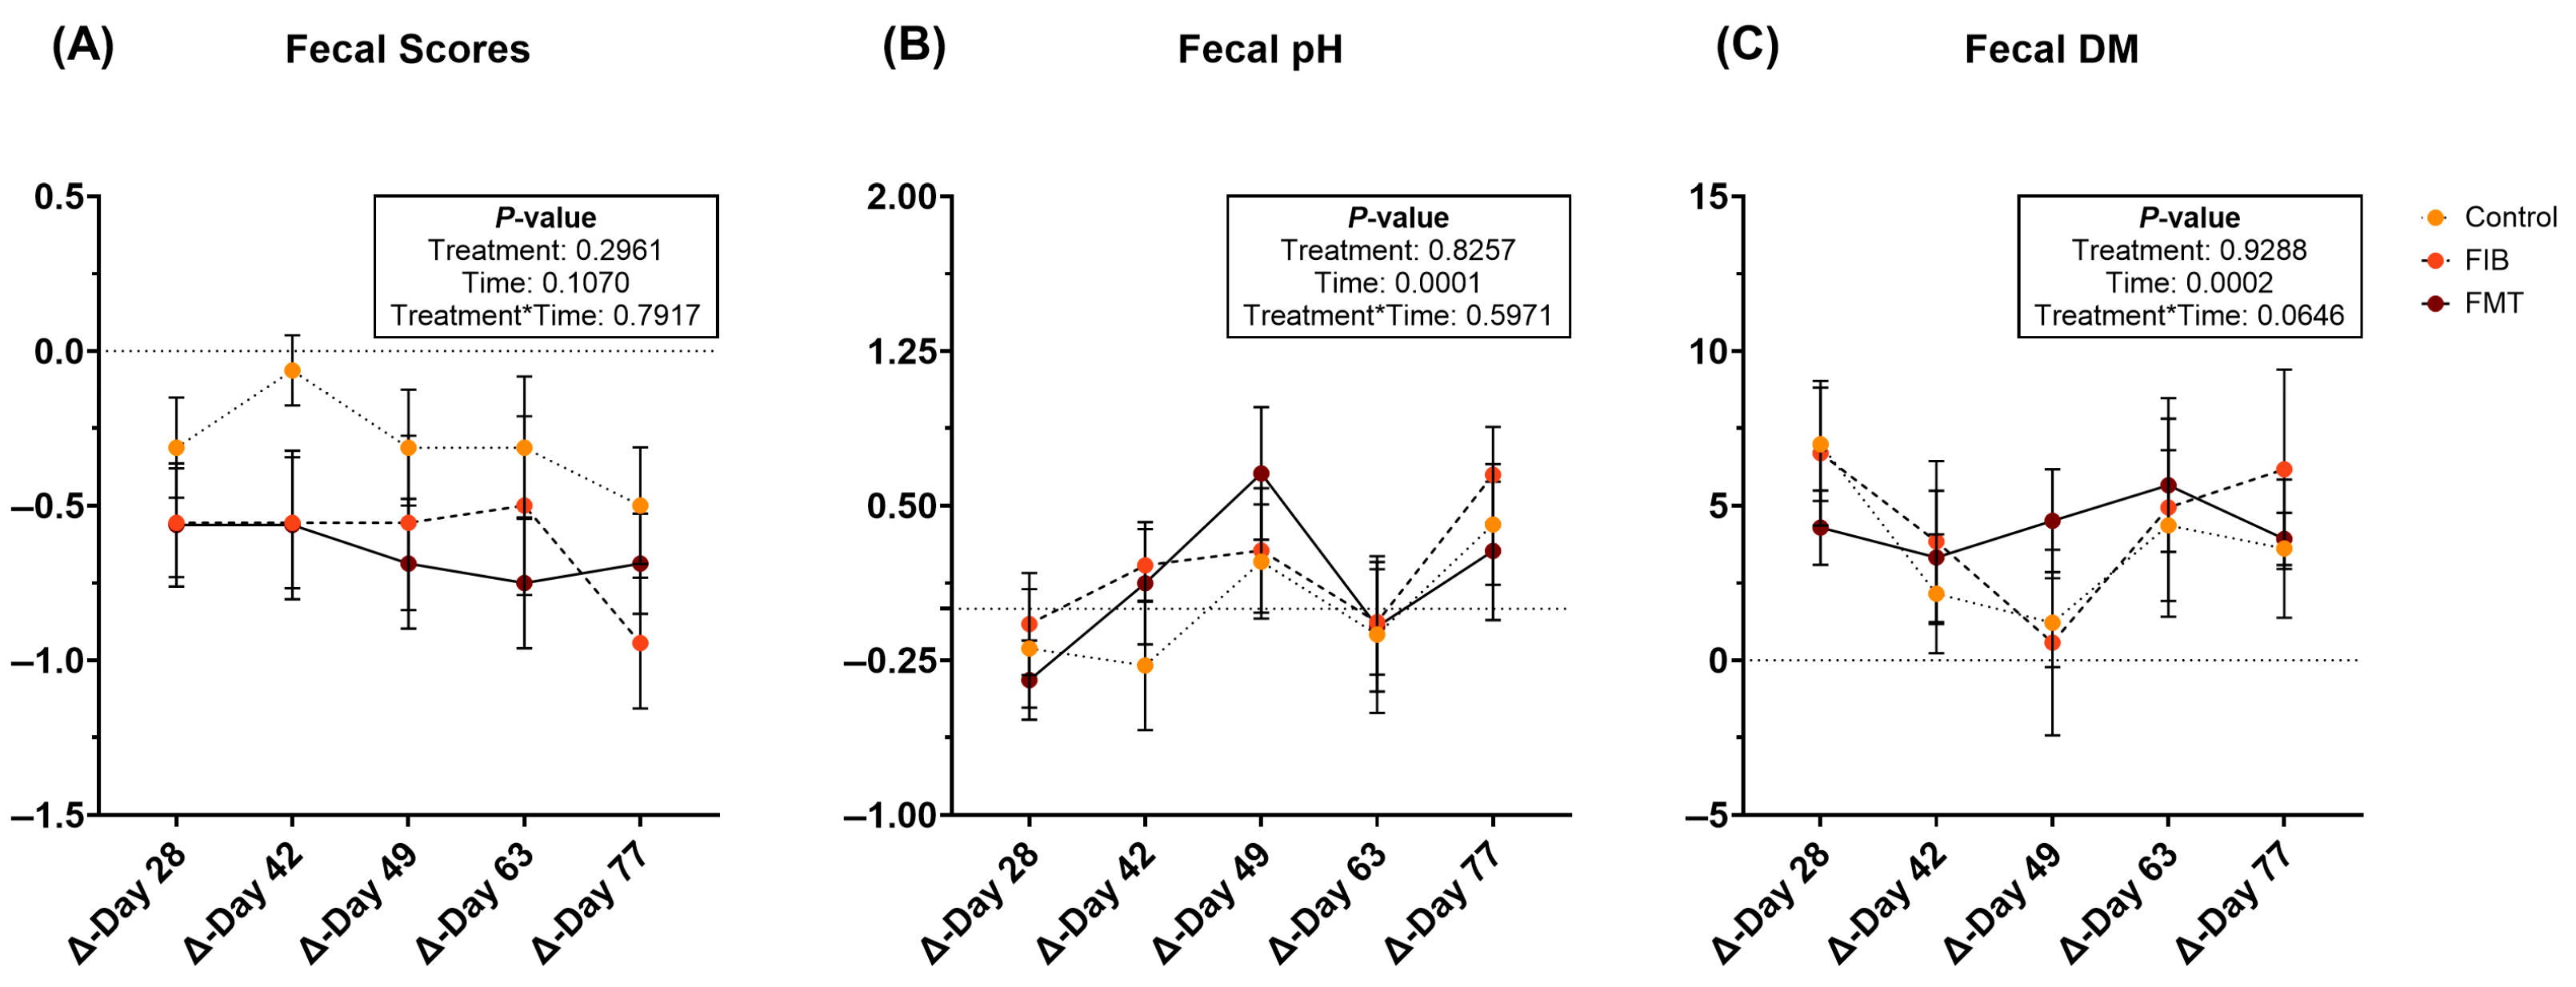
During metronidazole recovery, fecal scores were not affected (Figure 2A; Supplementary Table S11). Fecal pH increased (p = 0.0001; Figure 2B) over time in all treatment groups, while fecal DM varied throughout recovery. Fecal DM increased (less moisture; Figure 2C) in all animals in the days immediately following metronidazole cessation. However, fecal DM initially decreased (p < 0.01; higher stool moisture) but increased in the four wk following intervention.
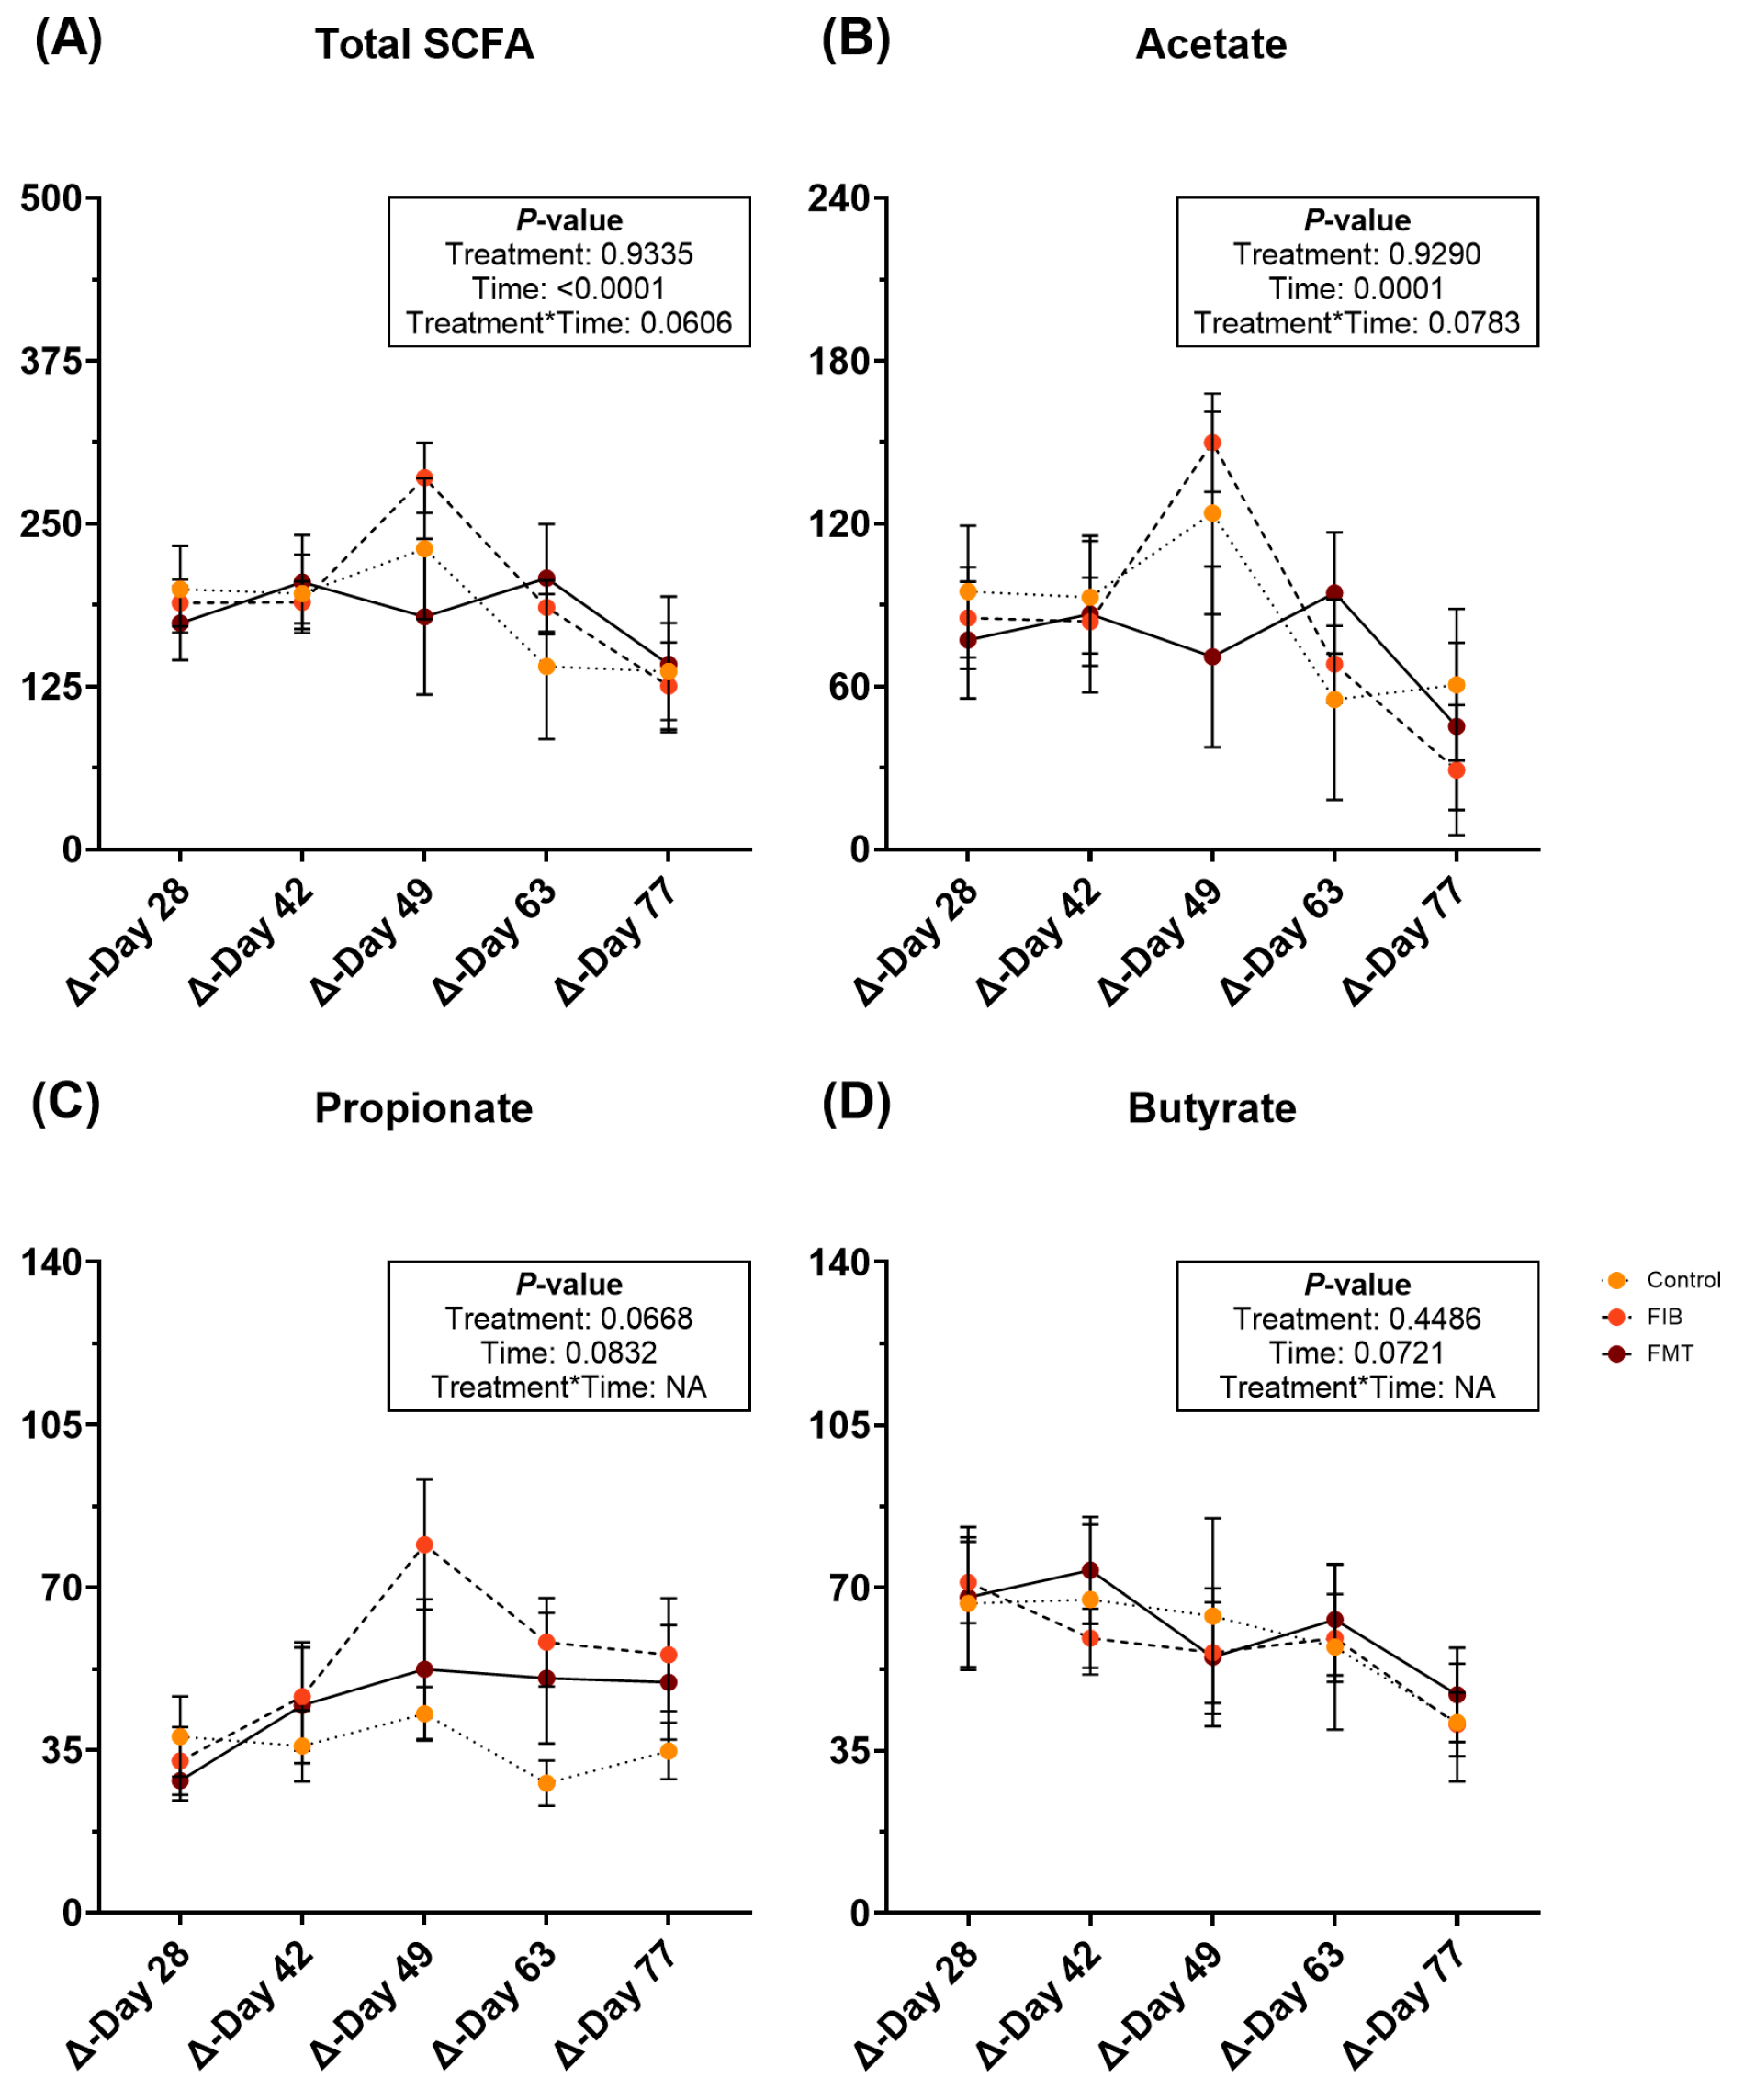
Fecal metabolite changes are represented in Supplementary Table S11 and Figure 3. After intervention, fecal total SCFA (Figure 3A) and acetate (Figure 3B) concentrations were increased (p ≤ 0.0001) over time, but were similar to post-metronidazole (d 14) concentrations by the end of study. Fecal propionate (Figure 3C) and butyrate (Figure 3D) increased following metronidazole cessation and remained increased for the remainder of recovery. Fecal total BCFA, isobutyrate, isovalerate, valerate, and total phenol/indole concentrations increased (p < 0.05) with time (Supplementary Table S11).

3.5. Microbial Abundance and Diversity During Metronidazole Recovery

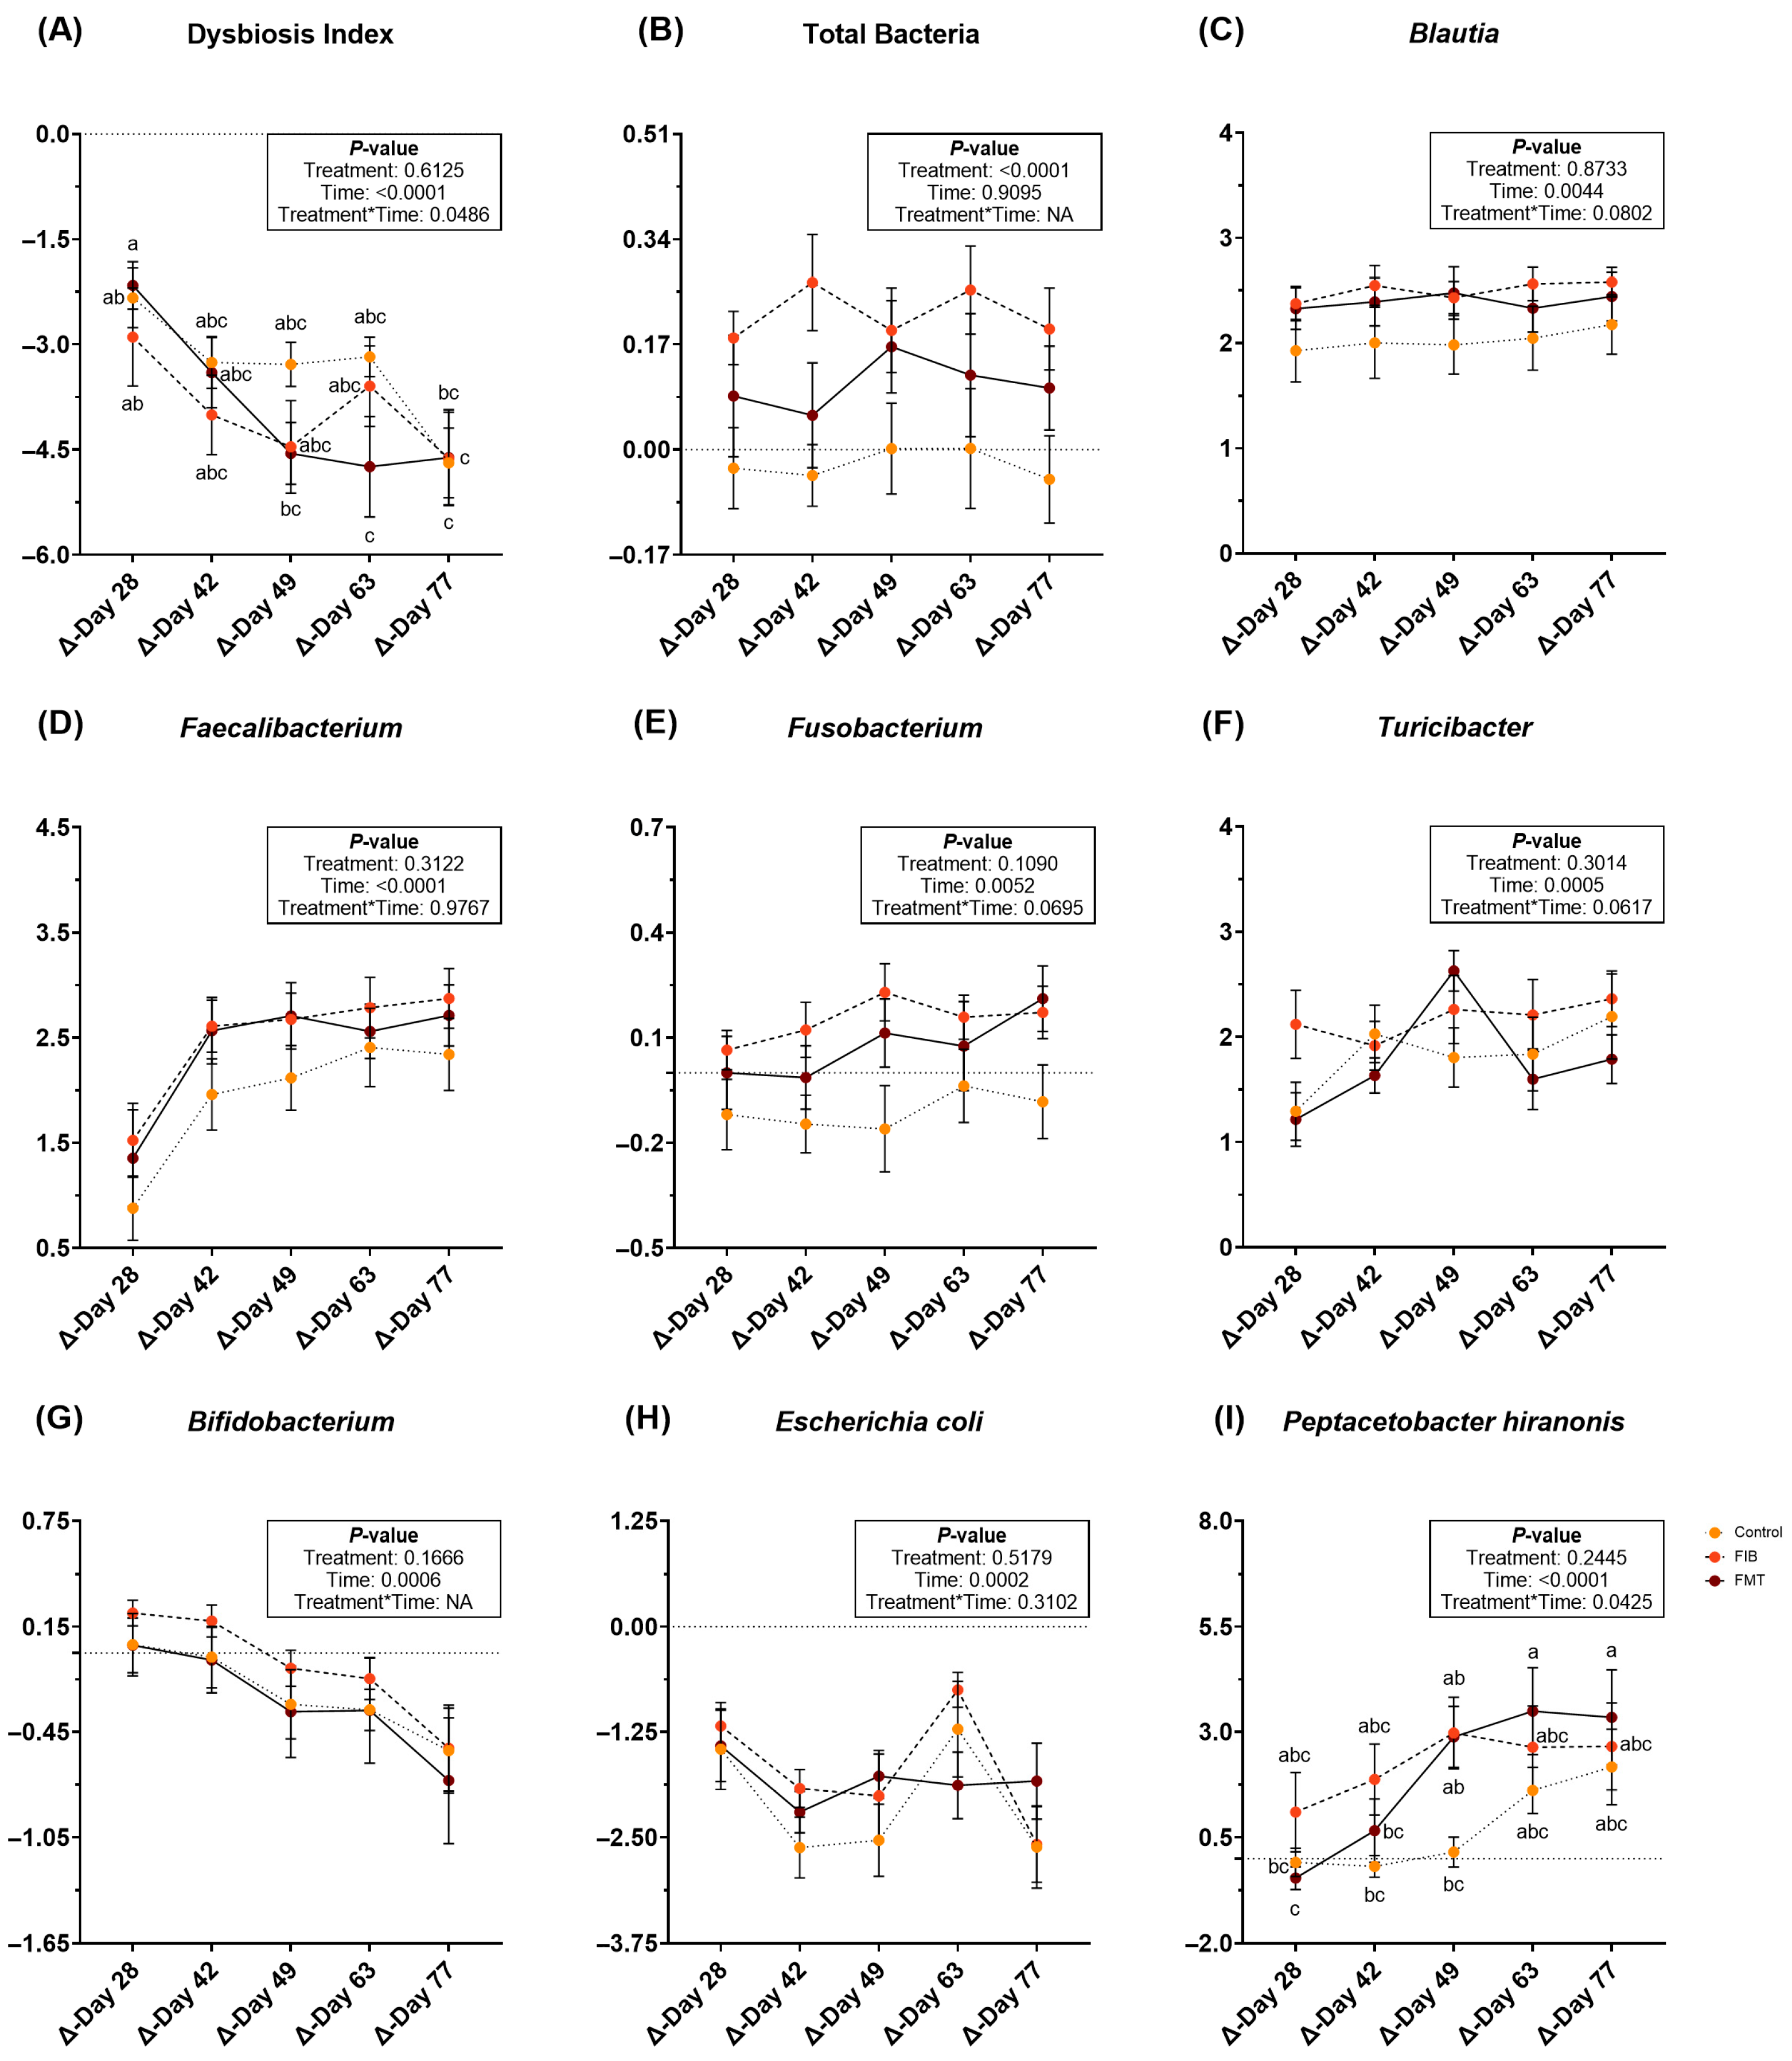
During metronidazole recovery, DI, qPCR data, and sequence data demonstrated several differences to the fecal microbiota populations. Following metronidazole cessation, a significant treatment*time interaction was observed for DI (p < 0.05; Figure 4; Supplementary Table S12). All DI decreased over time (Figure 4A), but there were slight differences among treatments. Change to total bacterial abundance was greater (p < 0.0001; Figure 4B) in animals allotted to FIB, followed by FMT, and with little change to CTRL cats. Blautia, Faecalibacterium, Fusobacterium and Turicibacter abundances increased (p < 0.01; Figure 4C–F) during recovery, whereas Bifidobacterium (Figure 4G) and E. coli (Figure 4H) abundances decreased (p = 0.0006) during recovery. A significant treatment*time interaction was noted for P. hiranonis abundance (p < 0.05; Figure 4I). While P. hiranonis abundance increased over time in all cats, there were slight differences among groups. Bacteroides and Streptococcus abundances were not affected by treatment or time, but did increase following metronidazole cessation (Supplementary Table S12).
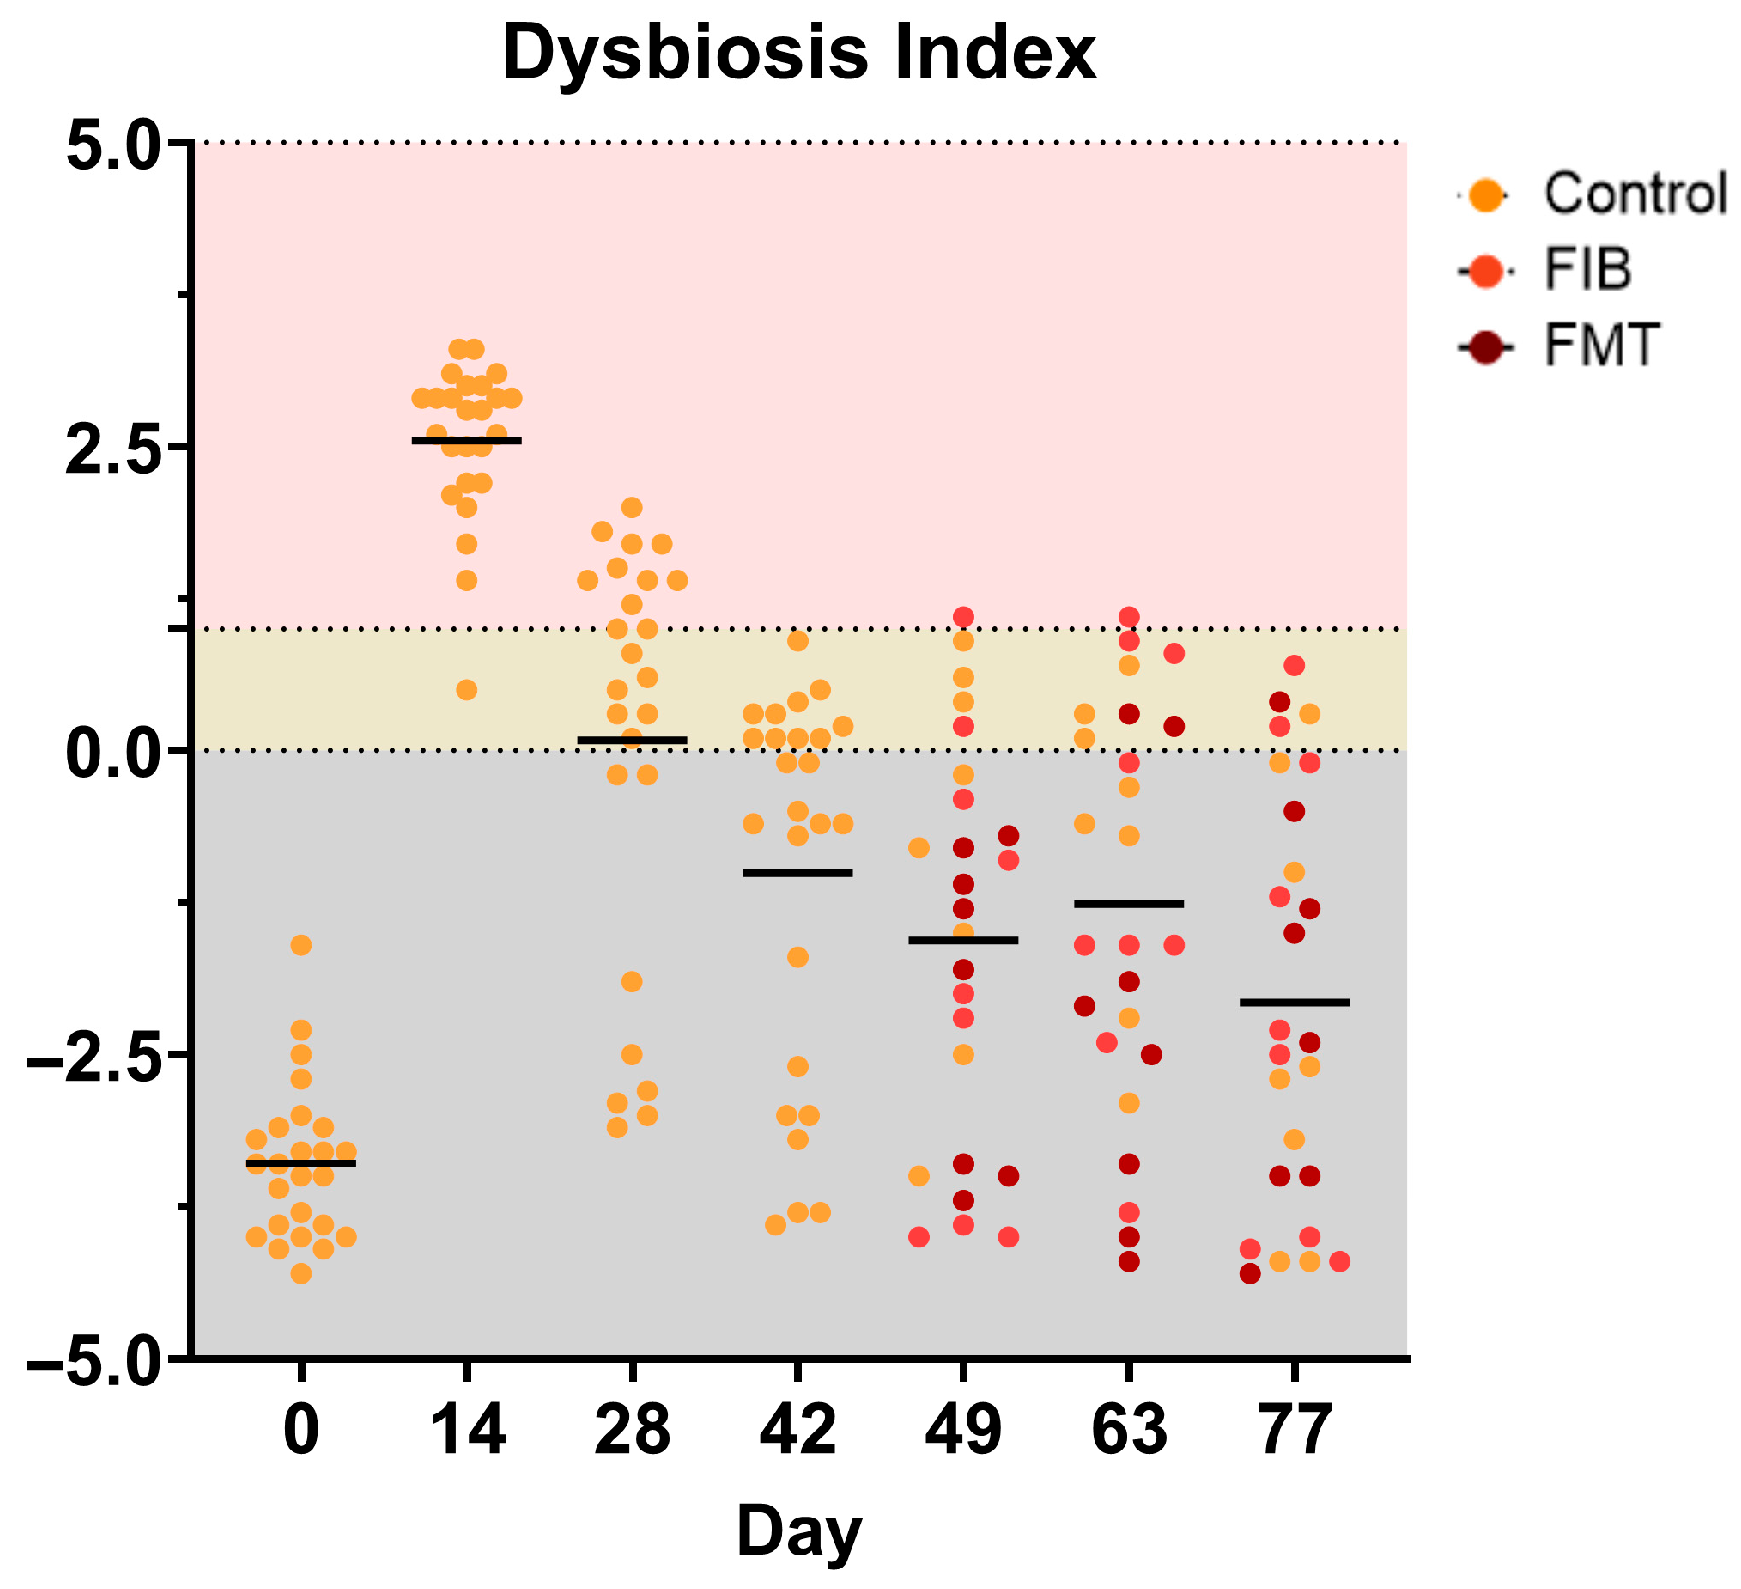
A visual representation of individual DIs is presented in Figure 5 and specific taxa that were measured outside of the reference intervals (E. coli, P. hiranonis. Streptococcus, Turicibacter) are presented in Supplementary Figure S2, respectively. Interestingly, FMT treatment at d 49 was the only intervention to normalize DI. The effect appeared to be short-term in a couple of cats, however, as it negatively shifted by d 63 in 2/8 FMT-dosed cats and d 77 in 1/8 FMT-dosed cats (Figure 5). Additionally, highly individualized responses were observed in E. coli, P. hiranonis, Streptococcus, and Turicibacter, with abundances falling outside of established reference intervals across various time points (Supplementary Figure S2).
During metronidazole recovery, sequence data highlighted several bacterial phyla and genera that were affected by treatment and time (Supplementary Table S13). On a phyla level, the relative abundances of Bacteroidota and Fusobacteriota decreased (p < 0.05) and Firmicutes abundances increased (p < 0.05) following metronidazole administration. At the phyla level, Proteobacteria abundance was influenced by dietary treatment and had greater (p < 0.05) reductions in cats dosed with FMT.
Overall, recovery from metronidazole administration affected the relative abundances of over 30 bacterial genera. Relative abundances of Lachnoclostridium and Lachnospiraceae unclassified decreased (p < 0.05) over time. In contrast, the relative abundances of several other genera increased (p < 0.05), including Parvibacter, Clostridia_UCG-014, [Eubacterium]_brachy_group, [Ruminococcus]_torques_group, Blautia, Candidatus_Soleaferrea, CHKCI001, Clostridia_UCG-014, Erysipelatoclostridium, Faecalibacterium, Holdemanella, Lachnospiraceae uncultured, Lachnospiraceae_UCG-009, Negativibacillus, Oscillibacter, Oscillospiraceae uncultured, Peptoclostridium, Peptococcus, Ruminococcaceae uncultured, Sarcina, and Subdoligranulum. Influences of dietary treatment were observed in over 20 bacterial genera. Cats consuming CTRL had less (p < 0.01) changes to the relative abundances of Bifidobacterium and Enterobacteriaceae unclassified, greater reductions (p < 0.0001) to relative abundances of Allisonella, Proteus, and Succinivibrio, lower (p < 0.01) Faecalitalea relative abundances, and increased (p < 0.05) relative abundances of UCG-009. Relative abundances of Fusobacterium and [Eubacterium]_coprostanoligenes_group were higher (p < 0.05) in cats allotted to and consuming CTRL or FIB. Cats allotted to and consuming FIB had lower (p < 0.05) Enterobacteriaceae unclassified, Odoribacter, [Ruminococcus]_torques_group relative abundances and higher (p < 0.05) relative abundances of Campylobacter, Allisonella, and Succinovibrio. Cats allotted to FIB or dosed with FMT had higher (p < 0.05) Candidatus_Soleaferrea and Faecalitalea relative abundances. Cats allotted to or dosed with FMT had higher (p < 0.05) relative abundances of Erysipelatoclostridium and Succinivibrio, greater reduction in Bifidobacterium relative abundance after intervention, and less (p < 0.01) changes (i.e., more stable) to Fusobacterium and Proteus relative abundances. Lastly, cats dosed with FMT had greater (p < 0.05) [Ruminococcus]_torques_group and [Eubacterium]_brachy_group relative abundances.
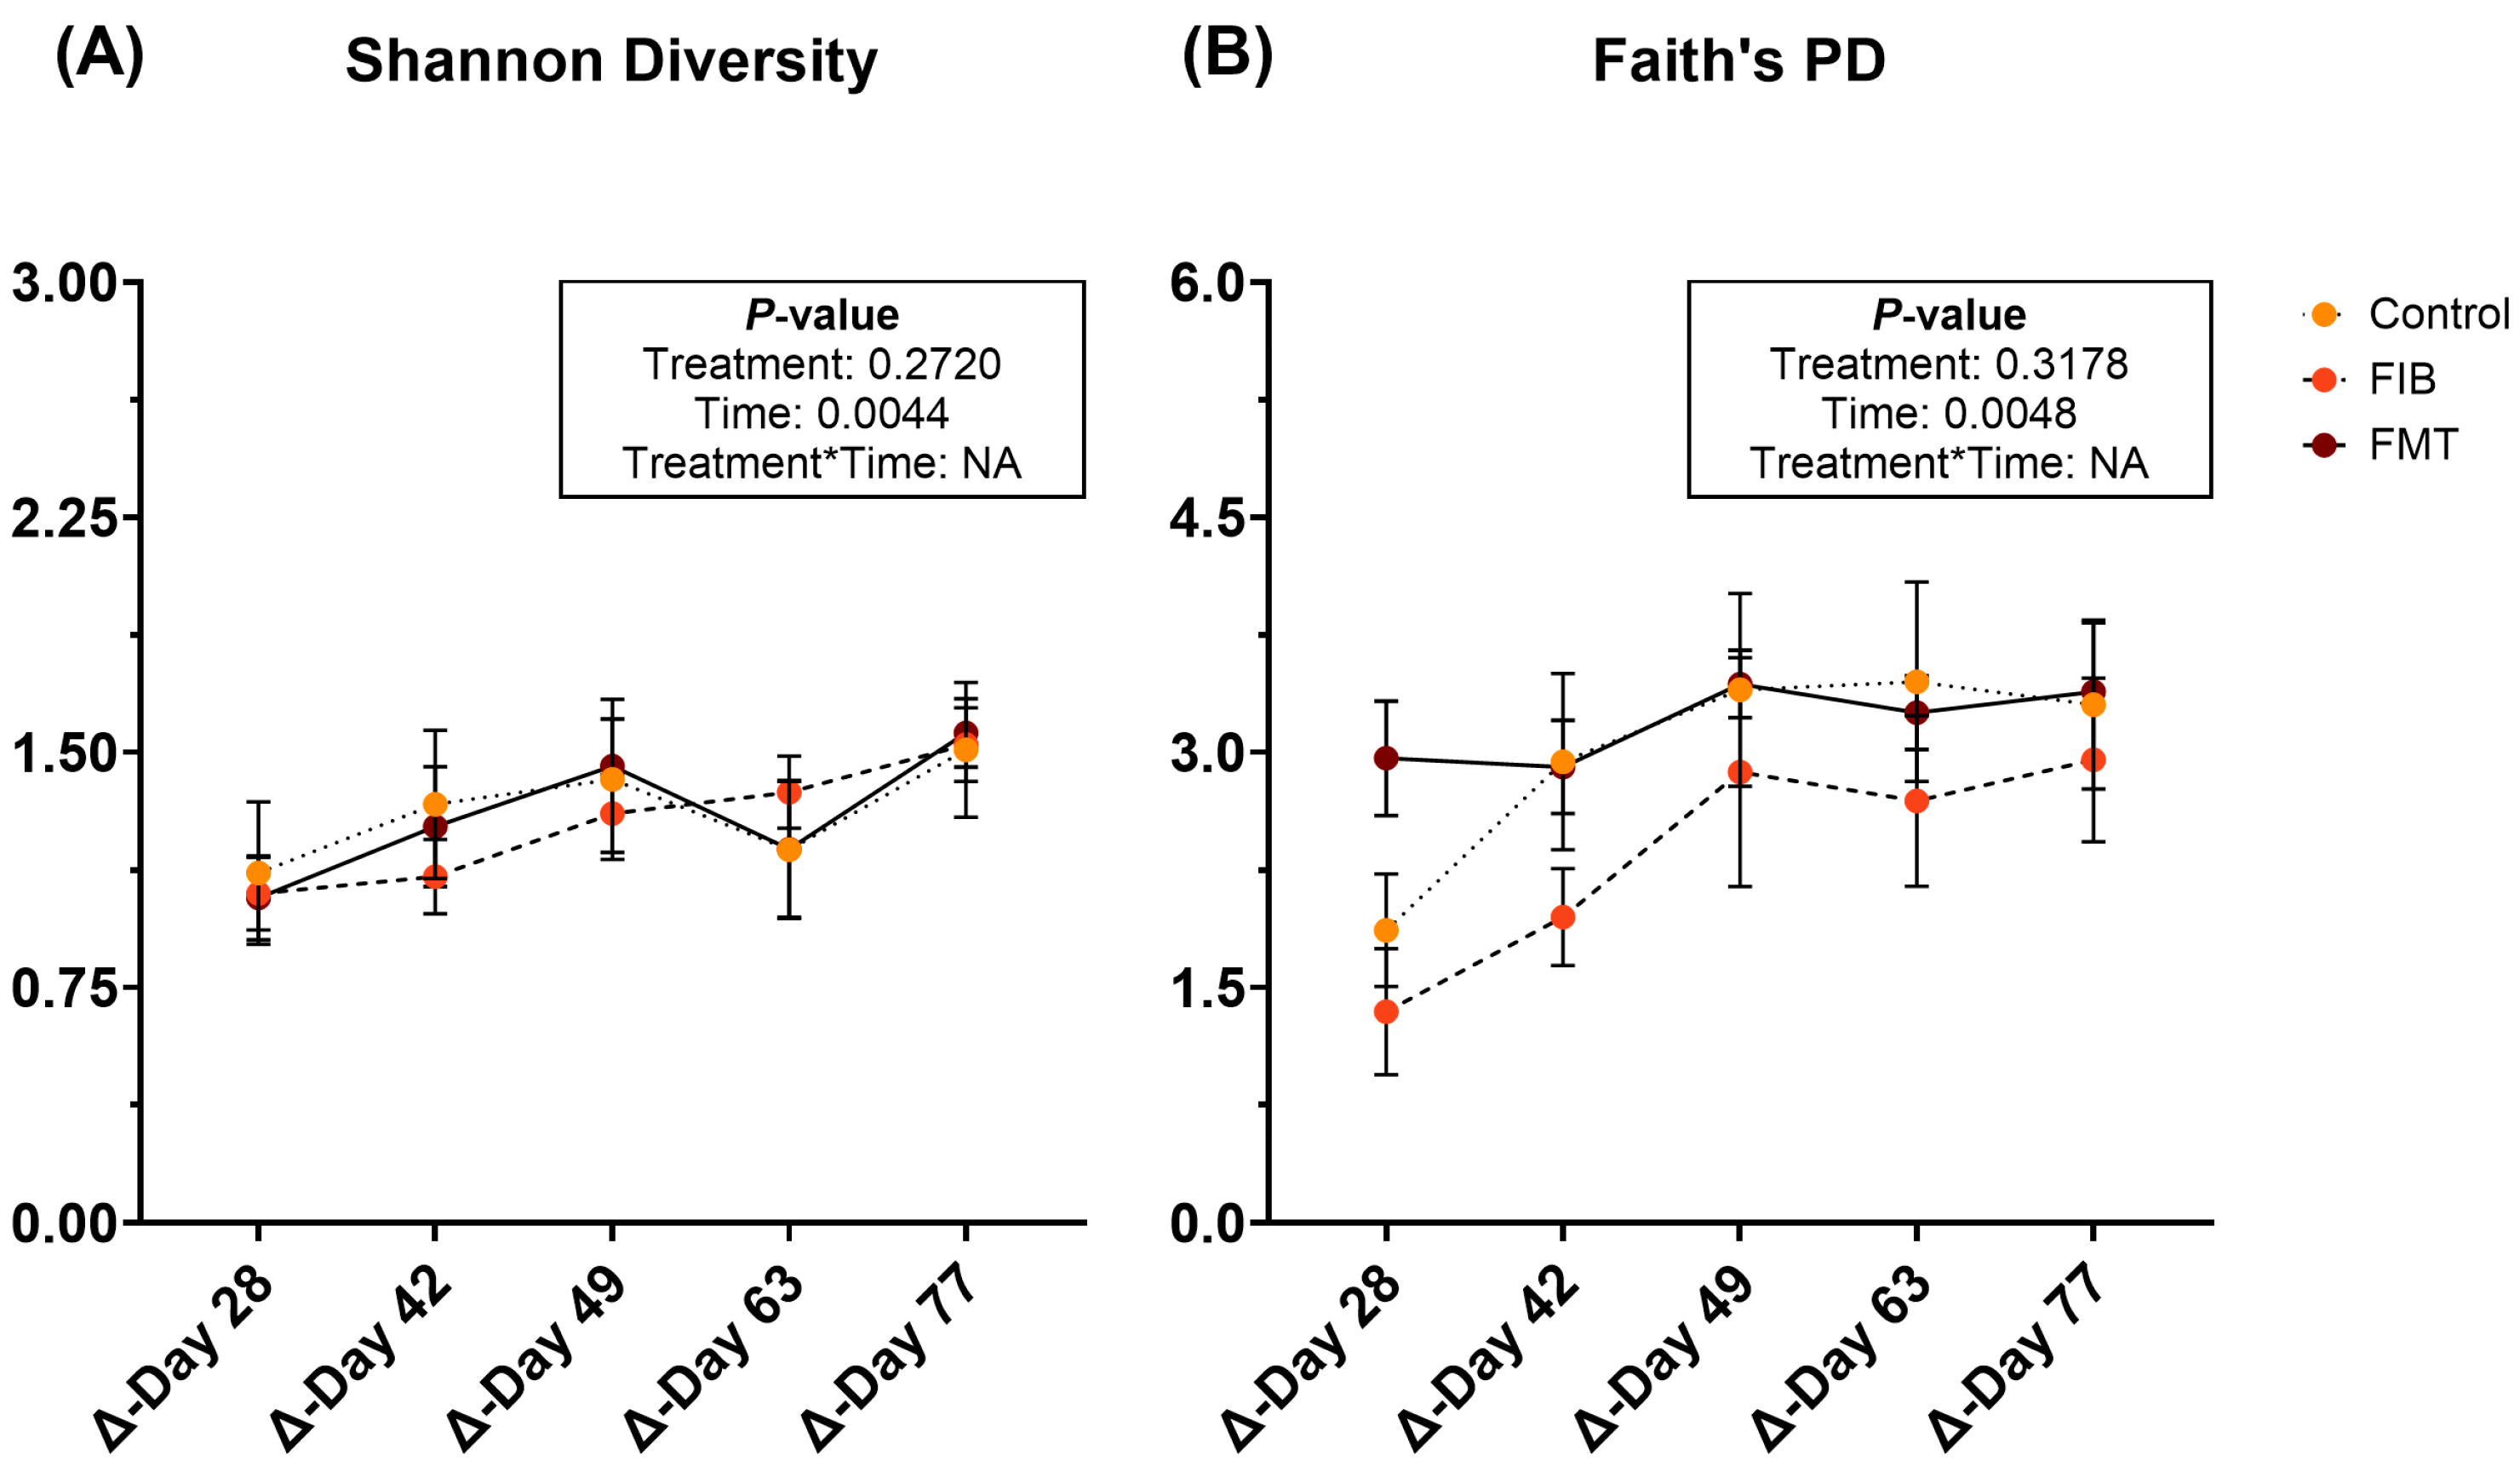
Diversity parameters were evaluated to compare d 14 to all time points and are represented in Figure 6 and Supplementary Table S14. Shannon diversity (Figure 6A) and Faith’s PD (Figure 6B) were influenced by time, being increased (p < 0.01) following metronidazole administration. However, neither of these returned to initial values by the end of recovery and no significant differences were observed with evenness.
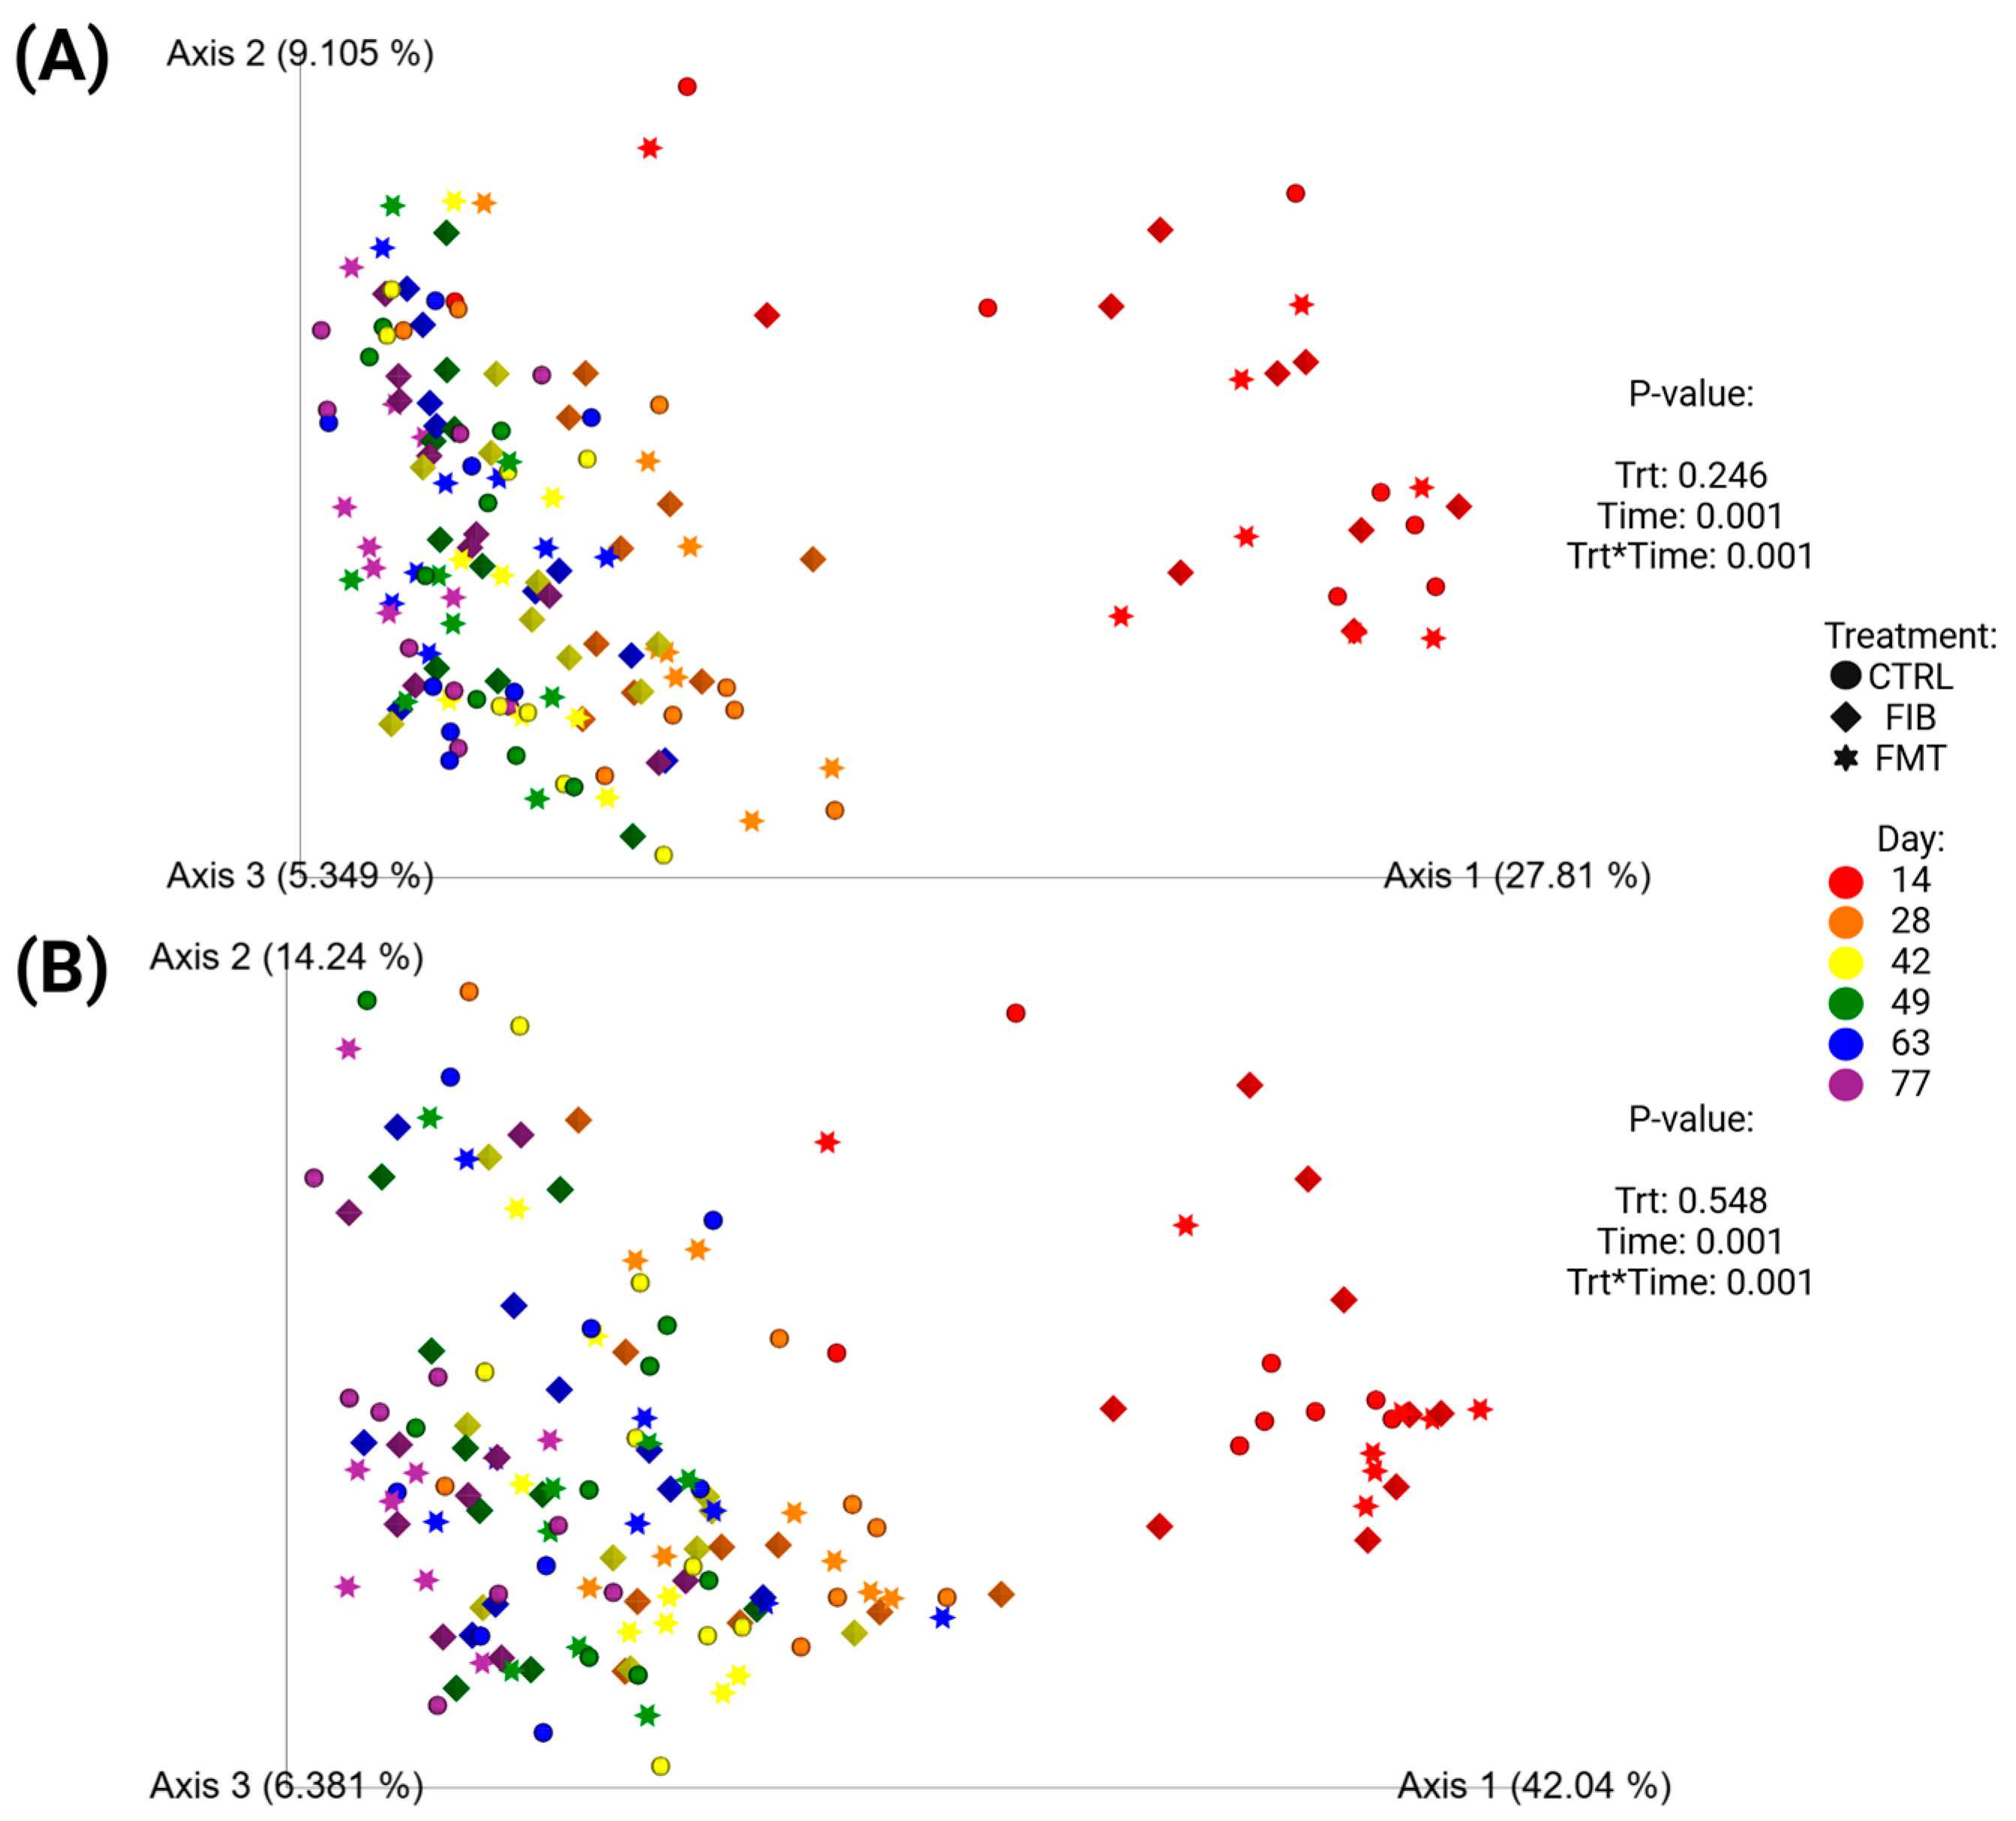
Unweighted (Figure 7A) and weighted (Figure 7B) beta diversity plots demonstrated how microbiota populations shifted following metronidazole administration (Figure 7; d 14 vs. d 28–77) and across all time points (Supplementary Figure S3; d 0–77). To exclusively compare communities after metronidazole, Figure 7 demonstrated significant separation between samples collected immediately after metronidazole (d 14) and the samples collected during recovery. To compare the initial baseline measures taken at d 0, Supplementary Figure S3 demonstrated similar diversity profiles between d 0 and d 77, with similar clustering observed in d 14 samples, shifting away from other time points. Neither analytical method, with or without baseline measures, were influenced by dietary treatment.

4. Discussion

Bactericidal antibiotics, such as metronidazole, are widely used in cases of GI disease or chronic enteropathies (i.e., antibiotic-responsive or steroid-responsive enteropathies) and function to inhibit bacterial growth, interfere with bacterial DNA or protein synthesis, and reduce bacterial metabolism. As previously mentioned, these are commonly used as a treatment during GI distress but may lead to several undesired health effects such as loose stools, reduced appetite, negative shifts to fecal microbiome and alterations to microbial metabolism [5,7,58,59,60,61]. In the current study, fecal scores were increased (looser stools) and bacterial abundances and metabolites were altered, but food intake and BW were not affected.
In addition to the changes observed to individual bacterial abundances and several microbial-derived metabolites, overall dysbiosis may be prolonged with antibiotic usage, which will continue to disrupt host and microbial metabolism, and can lead to slower recovery [8,18,20,21]. In a previous study conducted by Belchik et al. [22], 24 cats were administered metronidazole (20 mg/kg BW twice daily) and 83% (20/24) of cats were reported to have high dysbiosis values up to 4 wk post-metronidazole administration, highlighting the persistent influence of metronidazole in the weeks following cessation. When interpreting the dysbiosis results, evaluating the individual variability is important as the individual values demonstrate a widespread and differing degree of dysbiosis. Dysbiosis was prevalent in all animals on d 14, with 32% (8/25) of cats recovering to normal DI ranges in as early as two wk (d 28) following metronidazole cessation. While the population as a whole declined over time, 16% (4/25) of cats indicated a mild to moderate shift in the overall diversity after 9 wk post-metronidazole administration, demonstrating a prolonged metronidazole influence on fecal microbial communities, further agreeing with previous results.
Sung et al. [7] provided evidence supporting common taxonomic shifts in animals with CE, which were identical to those of the current study. Increased Bifidobacterium, E. coli, and Streptococcus abundances and reduced P. hiranonis abundance and overall diversity were observed after metronidazole administration. The abundances of lactic acid bacteria, such as Bifidobacterium, Lactobacillus, and Enterococcus, were increased following antibiotic administration, is known to be elevated in cases of GI disease, and can permit the overgrowth of other lactic acid bacteria (i.e., Streptococcus) [62,63]. In the present study, these lactic acid bacteria were increased following metronidazole but were near baseline measures by the end of study so no sustained overgrowth was present, as otherwise observed in chronic GI diseases. Similarly observed by Sung et al. [64], DI and E. coli abundance were increased while P. hiranonis abundance was reduced in cats exposed to antibiotics (amoxicillin-clavulanic acid or cefovecin).
Concentrations of fecal BA are greatly affected by antibiotic use, with primary BA concentrations being increased and secondary BA concentrations being decreased [4,22,63,65,66]. Used to aid in digestion and absorption by the host, primary BA are first synthesized by the host and are mostly (~90–95%) reabsorbed and recycled but any that escape absorption are later exposed to bacteria for further metabolism into secondary BA [67,68,69]. Many commensal bacteria, including members of the Bacteroides, Bifidobacterium, Enterococcus, Lactobacillus and Peptacetobacter (Clostridium) genera, are capable of deconjugating primary BA (cholic acid, chenodeoxycholic acid) as a first step in biotransformation into secondary BA (e.g., lithocholic acid, deoxycholic acid) [69,70]. In dogs and cats, this secondary conversion is thought to be performed exclusively by P. hiranonis via enzymes produced in the bai gene [71]. P. hiranonis was significantly reduced and lower than reference intervals in 40% (10/25) of cats at the end of the current study, which has been observed in previous studies in cats with CE or antibiotic treatment [7,22,64]. Given its importance in BA conversion, these antibiotic- or disease-induced reductions in P. hiranonis are thought to be detrimental.
Beet pulp, which is a widely used fiber by the pet food industry for commercial formulations, was selected as the fiber supplement in the present study. Derived from sugar beet processing, beet pulp contains favorable fractions of cellulose, hemicelluloses, and pectin [72,73]. The mixture of these fibers provides a range of benefits, including fecal bulking and fermentation potential (i.e., ability to be utilized by microbes). Analyzed during an in vitro fermentation assay, beet pulp was approximately 92.8% organic matter, 63.0% TDF (DM) (17.2% soluble, 45.8% insoluble), and 7.5% crude protein (DM) [74]. Using inoculum collected from healthy dogs, results demonstrated that beet pulp fermentation promoted the production of SCFA (acetate > propionate > butyrate) and microbiota populations of bifidobacteria and lactobacilli when compared with less fermentable fibers (i.e., coconut endosperm fiber, pelletized cellulose). Fibers with mixed fractions (insoluble and soluble components) have been shown to beneficially promote SCFA concentrations in canines [73,75,76,77,78]. Fiber utilization is less studied in cats and is likely due to their carnivorous nature; however, many commercially available feline diets have moderate dietary fiber and carbohydrate inclusions. Even with all cats consuming the same commercial diet in the current study, the addition of beet pulp (up to 10% TDF, DM) tended to increase the fecal concentrations of SCFA (total SCFA, acetate, propionate) following the 7 d intervention. While these effects were not sustained after supplementation (except propionate), these results suggest that beet pulp supplementation was successful in increasing SCFA production.
The use of FMT can be effective in canine patients with GI distress but there is limited research in cats. Because the data can be difficult to compare across species, more research in cats is necessary. Two individual case reports and one study utilizing 46 client-owned cats have been published on FMT administration in cats with chronic colitis or chronic digestive issues (i.e., vomiting, diarrhea and/or constipation). Of the case studies, FMT treatment was successful in resolving vomiting and diarrhea in a six yr old cat [36] and chronic ulcerative colitis in a 10 yr old cat [79]. Rojas et al. [80] evaluated FMT efficacy in 46 cats with clinical signs of vomiting, diarrhea, constipation, or a combination thereof when dosed with daily with FMT capsules. Those results demonstrated highly individualized responses and were influenced largely by clinical signs, diet consumption (i.e., dry, wet or raw food diets), and if there was previous antibiotic exposure. Previous antibiotic exposure ultimately influenced animal FMT response in the present study. Additionally, a recent mouse study demonstrated that diet composition (i.e., high-fat, low-fiber Western-style diet vs. low-fat, high-fiber standard chow diet) was the predominant influencer in rapid microbial recovery following antibiotics, despite administration of FMT treatments [81], suggesting a strong influence of macronutrient profiles on GI microbiota resilience. Because several limitations existed in those studies, including owner bias in clinical reporting, diet variation, and lack of longer-term observations, more research is necessary to refine treatments and improve the likelihood of successful recovery.
In the present study, diet was controlled and observation followed metronidazole (9 wk total) and FMT intervention (4 wk total). FMT dosing decreased DI and increased abundances of Bacteroides, P. hiranonis, and Turicibacter compared with control cats; however, few of these results were sustained for the last 4 wk of study. After FMT dosing ceased, Bacteroides and Turicibacter did not demonstrate sustained increases, whereas DI was reduced to near-baseline levels. During antibiotic administration, weight loss was previously reported by Belchik et al. [22], but that was not observed in the present study. Studies quantifying weight changes in dogs or cats receiving FMT are limited. In nursing pigs, FMT led to increased weight gain and reduced mortality compared to control pigs administered a mock-transplant including sterile saline and glycerol [82], suggesting a potential improvement in host metabolism. While nutrient digestibility was not measured in the current study, improvements to BW through FMT dosing could be of interest for future studies.
The present study has many strengths and limitations. Strengths included the high frequency of fecal and blood sample collections, in addition to continual observation of behavioral characteristics. The longitudinal analysis provided adequate timing for assessment of potential treatment, time, and treatment*time interactions to determine relevant conclusions. Metronidazole was administered in a high dose for 2 wk (20 mg/kg BW twice daily) and was successful in replicating clinical guidelines in veterinary practices [83,84]. For the samples collected, many clinically relevant physiologic and microbiota-based measurements permitted sufficient comparisons of pre- and post-metronidazole effects, as well as any differences attributable to treatments. Additionally, two techniques were used to assess fecal microbiota (i.e., 16S rRNA sequencing; qPCR), which allowed for a more comprehensive, yet targeted, approach to understanding shifts in the microbiota.
On the other hand, there were many limitations. First and foremost, the animals tested were healthy. Additionally, the majority of the cats enrolled (23/25) had previous exposure to metronidazole. Although repeated use of antibiotics is not uncommon in veterinary practice, as relapse infections or distress can occur, this could have influenced the results observed in the current study. While metronidazole-induced results were comparable to our previous study [22], the rate of recovery or potential resiliency from prior exposure could have contributed to the results observed. Future studies utilizing clinically symptomatic patients, or strict exclusion criteria based on antibiotic exposure, are warranted to determine the efficacy of the specialized intervention strategies. Another limitation may include the timing, duration, and frequency of dietary or FMT interventions. Dietary trials often last for several weeks and FMT administration dose frequency can vary based on clinical presentation or mode of delivery. Also, the dosage at which fiber was supplemented (0.9–1.198 g per day extra; 10% TDF) may have not been enough to induce significant changes. Twice-daily interventions for one week may not have been enough time to allow for gradual and sustained microbial changes for long-term observations. FMT can be very advantageous as a rapid treatment; however, the lack of standardized guidelines can limit the applicability of treatment plans applied in the current study to clinical settings. Lastly, a few of the cats were unable to return to baseline measures (i.e., P. hiranonis abundance, DI) after 9 wk. In the future, longer studies may be recommended so that full recovery from metronidazole treatment may be possible.

5. Conclusions

In summary, metronidazole administration was effective in disrupting the GI microbiota and fecal metabolites of healthy adult cats, as demonstrated by increased dysbiosis index, altered microbial abundances measured via 16S rRNA sequencing and targeted qPCR analysis, reduced bacterial alpha diversity measures, and reduced fermentative metabolite concentrations in fecal samples. Many of the results discussed were attributed to recovery following metronidazole administration and microbial recovery. Of the effects observed through dietary intervention, fiber supplementation promoted higher fecal SCFA concentrations, FMT treatment continuously reduced DI, and both interventions increased the abundance of beneficial bacterial taxa (i.e., Fusobacterium, P. hiranonis). Minimal differences were observed in other outcome variables, however. Bacterial diversity measures demonstrated rapid recovery, with most cats returning to baseline levels in as early as 2 wk after metronidazole cessation. While more research is necessary in cats, our results provide foundational information that may be applied to clinical situations where strategies for managing microbial recovery are needed.

Supplementary Materials

The following supporting information can be downloaded at: https://www.mdpi.com/article/10.3390/pets2030027/s1, Supplementary Table S1: General characteristics of feline FMT donor; Supplementary Table S2: Analyzed chemical composition of the experimental diet; Effects of metronidazole administration on food intake, body weight, and body condition score (Supplementary Table S3), serum chemistry measures (Supplementary Table S4), complete blood cell count (Supplementary Table S5), fecal bacterial phyla and genera relative abundances (% of sequences; Supplementary Table S6), and fecal alpha diversity measures (Supplementary Table S7). Changes to dietary intake, body weight, and body condition score (Supplementary Table S8), serum chemistry measures (Supplementary Table S9), complete blood cell count (Supplementary Table S10), fecal characteristics and metabolite concentrations (Supplementary Table S11), fecal dysbiosis index and bacterial abundance (log DNA/gram feces; Supplementary Table S12), fecal bacterial phyla and genera relative abundances (% of sequences; Supplementary Table S13), and fecal alpha diversity measures (Supplementary Table S14); Supplementary Figure S1: Unweighted (A) and weighted (B) principal coordinate analysis plots based on UniFrac distances of healthy adult cats before (ABX-) and after (ABX+) metronidazole administration; Supplementary Figure S2: Abundances of fecal bacterial taxa (log DNA/g feces) of healthy adult cats before (d 0), during (d 14), and after metronidazole administration (d 28-77); Supplementary Figure S3: Unweighted (A) and weighted (B) principal coordinate analysis plots based on UniFrac distances of healthy adult cats eating the baseline diet before (d 0) and after (d 14-77) metronidazole administration.

Author Contributions

Conceptualization, S.E.M. and K.S.S.; data curation, S.E.M. and P.M.O.; formal analysis, S.E.M. and P.M.O.; investigation, S.E.M.; methodology, S.E.M. and K.S.S.; resources, J.S.S. and K.S.S.; supervision, K.S.S.; visualization, S.E.M.; writing—original draft preparation, S.E.M.; writing—review and editing, S.E.M., J.S.S. and K.S.S. All authors have read and agreed to the published version of the manuscript.

Funding

This research received no external funding.

Institutional Review Board Statement

The animal study protocol was approved by the University of Illinois Institutional Animal Care and Use Committee (protocol #24124; date of approval: 08/19/2024).

Informed Consent Statement

Not applicable.

Data Availability Statement

All sequence data used for analysis are available at the NCBI sequence read archive (https://www.ncbi.nlm.nih.gov/sra) under submission SUB15342556 for BioProject PRJNA1268450. Additional data is available at reasonable request to authors.

Acknowledgments

Sincere gratitude is expressed for the additional help with animal handling and sample collections provided by members of the University of Illinois Urbana-Champaign Comparative Nutrition and Nutrigenomics lab, including Shukun (Connie) Liang, Christina Vogel, Tsai-Ling (Christine) Wang, Milan Broughton, and Elizabeth (Lizzy) Geary. Additional gratitude is given to the Texas A&M University Gastrointestinal Laboratory for their insight and technical contributions to this research.

Conflicts of Interest

J.S.S. is an employee of the Gastrointestinal Laboratory at Texas A&M University, which provides assays for intestinal function and microbiota analysis on a fee-for-service basis. The remaining authors declare no conflicts of interest.

Abbreviations

The following abbreviations are used in this manuscript:
GIGastrointestinal
SCFAShort-chain fatty acids
BABile acids
CEChronic enteropathies
qPCRQuantitative polymerase chain reaction
FIBFiber supplement (beet pulp)
FMTFecal microbial transplant
TDFTotal dietary fiber
DMDry matter
DIDysbiosis index
BCFABranched-chain fatty acids

References

  1. Suchodolski, J.S.; Dowd, S.E.; Wilke, V.; Steiner, J.M.; Jergens, A.E. 16S rRNA gene pyrosequencing reveals bacterial dysbiosis in the duodenum of dogs with idiopathic inflammatory bowel disease. PLoS ONE 2012, 7, e39333. [Google Scholar] [CrossRef]
  2. Minamoto, Y.; Otoni, C.C.; Steelman, S.M.; Büyükleblebici, O.; Steiner, J.M.; Jergens, A.E.; Suchodolski, J.S. Alteration of the fecal microbiota and serum metabolite profiles in dogs with idiopathic inflammatory bowel disease. Gut Microbes 2015, 6, 33–47. [Google Scholar] [CrossRef] [PubMed]
  3. Redfern, A.; Suchodolski, J.; Jergens, A. Role of the gastrointestinal microbiota in small animal health and disease. Vet. Rec. 2017, 181, 370. [Google Scholar] [CrossRef] [PubMed]
  4. Guard, B.C.; Honneffer, J.B.; Jergens, A.E.; Jonika, M.M.; Toresson, L.; Lawrence, Y.A.; Webb, C.B.; Hill, S.; Lidbury, J.A.; Steiner, J.M.; et al. Longitudinal assessment of microbial dysbiosis, fecal unconjugated bile acid concentrations, and disease activity in dogs with steroid-responsive chronic inflammatory enteropathy. J. Vet. Intern. Med. 2019, 33, 1295–1305. [Google Scholar] [CrossRef]
  5. Marsilio, S.; Pilla, R.; Sarawichitr, B.; Chow, B.; Hill, S.L.; Ackermann, M.R.; Estep, J.S.; Lidbury, J.A.; Steiner, J.M.; Suchodolski, J.S. Characterization of the fecal microbiome in cats with inflammatory bowel disease or alimentary small cell lymphoma. Nature 2019, 9, 19208. [Google Scholar] [CrossRef]
  6. Humphreys, C. Textbook of Natural Medicine, 5th ed.; Churchill Livingstone: London, UK, 2020; pp. 166–177. [Google Scholar] [CrossRef]
  7. Sung, C.-H.; Marsilio, S.; Chow, B.; Zornow, K.A.; Slovak, J.E.; Pilla, R.; Lidbury, J.A.; Steiner, J.M.; Park, S.Y.; Hong, M.-P.; et al. A dysbiosis index to evaluate healthy cats and cats with chronic enteropathies. J. Feline Med. Surg. 2022, 24, e1–e12. [Google Scholar] [CrossRef]
  8. Whittemore, J.C.; Stokes, J.E.; Laia, N.L.; Price, J.M.; Suchodolski, J.S. Short and long-term effects of a synbiotic on clinical signs, the fecal microbiome, and metabolomic profiles in healthy research cats receiving clindamycin: A randomized, controlled trial. PeerJ 2018, 6, e5130. [Google Scholar] [CrossRef]
  9. Jergens, A.E.; Crandell, J.M.; Evans, R.; Ackerman, M.; Miles, K.G.; Wang, C. A clinical index for disease activity in cats with chronic enteropathy. J. Vet. Intern. Med. 2010, 24, 1027–1033. [Google Scholar] [CrossRef]
  10. Dandrieux, J.R.S.; Mansfield, C.S. Chronic Enteropathy in Canines: Prevalence, Impact and Management Strategies. Vet. Med. 2019, 10, 203–214. [Google Scholar] [CrossRef]
  11. Makielski, K.; Cullen, J.; O’Connor, A.; Jergens, A.E. Narrative review of therapies for chronic enteropathies in dogs and cats. J. Vet. Intern. Med. 2019, 33, 11–22. [Google Scholar] [CrossRef] [PubMed]
  12. Allenspach, K.; Mochel, J.P. Current diagnostics for chronic enteropathies in dogs. Vet. Clin. Pathol. 2022, 50, 18–28. [Google Scholar] [CrossRef] [PubMed]
  13. Robbins, S.N.; Goggs, R.; Kraus-Malett, S.; Goodman, L. Effect of institutional antimicrobial stewardship guidelines on prescription of critically important antimicrobials for dogs and cats. J. Vet. Intern. Med. 2024, 38, 1706–1717. [Google Scholar] [CrossRef]
  14. Dethlefsen, L.; Huse, S.; Sogin, M.L.; Relman, D.A. The pervasive effects of an antibiotic on the human gut microbiota, as revealed by deep 16S rRNA sequencing. PLoS Biol. 2008, 6, e280. [Google Scholar] [CrossRef]
  15. Suchodolski, J.S.; Camacho, J.; Steiner, J.M. Analysis of bacterial diversity in the canine duodenum, jejunum, ileum, and colon by comparative 16S rRNA gene analysis. FEMS Microbiol. Ecol. 2009, 66, 567–578. [Google Scholar] [CrossRef]
  16. De La Cochetière, M.F.; Montassier, E.; Hardouin, J.B.; Carton, T.; Le Vacon, F.; Durand, T.; Lalande, V.; Petit, J.C.; Potel, G.; Beaugerie, L. Human intestinal microbiota gene risk factors for antibiotic-associated diarrhea: Perspectives for prevention. Risk factors for antibiotic-associated diarrhea. Microb. Ecol. 2010, 59, 830–837. [Google Scholar] [CrossRef] [PubMed]
  17. Jakobsson, H.E.; Jernberg, C.; Andersson, A.F.; Sjolund-Karlsson, M.; Jansson, J.K.; Engstrand, L. Short-term antibiotic treatment has differing long-term impacts on the human throat and gut microbiome. PLoS ONE 2010, 5, e9836. [Google Scholar] [CrossRef]
  18. Ungaro, R.; Bernstein, C.N.; Gearry, R.; Hviid, A.; Kolho, K.-L.; Kronman, M.P.; Shaw, S.; Van Kruinigen, H.; Colombel, J.-F.; Atreja, A. Antibiotics associated with increased risk of new-onset Crohn’s disease but not ulcerative colitis: A meta-analysis. Am. J. Gastroenterol. 2014, 109, 1728–1738. [Google Scholar] [CrossRef]
  19. Suchodolski, J.S. Diagnosis and interpretation of intestinal dysbiosis in dogs and cats. Vet. J. 2016, 215, 30–37. [Google Scholar] [CrossRef]
  20. Schmidt, V.M.; Pinchbeck, G.; McIntyre, K.M.; Nuttall, T.; McEwan, N.; Dawson, S.; Williams, N.J. Routine antibiotic therapy in dogs increases the detection of antimicrobial-resistant faecal Escherichia coli. J. Antimicrob. Chemother. 2018, 73, 3305–3316. [Google Scholar] [CrossRef]
  21. Stavroulaki, E.M.; Suchodolski, J.S.; Pilla, R.; Fosgate, G.T.; Sung, C.-H.; Lidbury, J.A.; Steiner, J.M.; Xenoulis, P.G. Short- and long-term effects of amoxicillin/clavulanic acid or doxycycline on the gastrointestinal microbiome of growing cats. PLoS ONE 2021, 16, e0253031. [Google Scholar] [CrossRef] [PubMed]
  22. Belchik, S.E.; Oba, P.M.; Lin, C.-Y.; Swanson, K.S. Effects of a veterinary gastrointestinal diet on fecal characteristics, metabolites, and microbiota concentrations of adult cats treated with metronidazole. J. Anim. Sci. 2024, 102, skae274. [Google Scholar] [CrossRef] [PubMed]
  23. Gibson, G.R.; Hutkins, R.; Sanders, M.S.; Prescott, S.L.; Reimer, R.A.; Salminen, S.J.; Scott, K.; Stanton, C.; Swanson, K.S.; Cani, P.D.; et al. The International Scientific Association for Probiotics and Prebiotics (ISAPP) consensus statement on the definition and scope of prebiotics. Nat. Rev. Gastroenterol. Hepatol. 2017, 14, 491–502. [Google Scholar] [CrossRef]
  24. Hill, C.; Guarner, F.; Reid, G.; Gibson, G.R.; Merenstein, D.J.; Pot, B.; Morelli, L.; Canani, R.B.; Flint, H.J.; Salminen, S.; et al. The International Scientific Association for Probiotics and Prebiotics (ISAPP) consensus statement on the scope and appropriate use of the term probiotic. Nat. Rev. Gastroenterol. Hepatol. 2014, 11, 506–514. [Google Scholar] [CrossRef] [PubMed]
  25. Salminen, S.; Colado, M.C.; Endo, A.; Hill, C.; Lebeer, S.; Quigley, E.M.M.; Sanders, M.E.; Shamir, R.; Swann, J.R.; Szajewska, H.; et al. The International Scientific Association of Probiotics and Prebiotics (ISAPP) consensus statement on the definition and scope of postbiotics. Nat. Rev. Gastroenterol. Hepatol. 2021, 18, 649–667. [Google Scholar] [CrossRef] [PubMed]
  26. Schmitz, S.S. Evidence-based use of biotics in the management of gastrointestinal disorders in dogs and cats. Vet. Rec. 2024, 195, 26–32. [Google Scholar] [CrossRef]
  27. Wilson, S.M.; Swanson, K.S. The influence of “biotics” on the gut microbiome of dogs and cats. Vet. Rec. 2024, 195, 2–12. [Google Scholar] [CrossRef]
  28. Wang, S.; Martins, R.; Sullivan, M.C.; Friedman, E.S.; Misic, A.M.; El-Fahmawi, A.; De Martinis, E.C.P.; O’Brien, K.; Chen, Y.; Bradley, C.; et al. Diet-Induced Remission in Chronic Enteropathy Is Associated with Altered Microbial Community Structure and Synthesis of Secondary Bile Acids. Microbiome 2019, 7, 126. [Google Scholar] [CrossRef]
  29. Galler, A.I.; Suchodolski, J.S.; Steiner, J.M.; Sung, C.-H.; Hittmair, K.M.; Ritcher, B.; Burgener, I.A. Microbial dysbiosis and fecal metabolomic perturbations in Yorkshire Terriers with chronic enteropathy. Sci. Rep. 2022, 12, 12977. [Google Scholar] [CrossRef]
  30. Fritsch, J.; Garces, L.; Quintero, M.A.; Pignac-Kobinger, J.; Santander, A.M.; Fernández, I.; Ban, Y.J.; Kwon, D.; Phillips, M.C.; Knight, K.; et al. Low-Fat, High-Fiber Diet Reduces Markers of Inflammation and Dysbiosis and Improves Quality of Life in Patients with Ulcerative Colitis. Clin. Gastroenterol. Hepatol. 2021, 19, 1189–1199.e30. [Google Scholar] [CrossRef]
  31. Guilford, W.G.; Jones, B.R.; Markwell, P.J.; Arthur, D.G.; Collett, M.G.; Harte, J.G. Food sensitivity in cats with chronic idiopathic gastrointestinal problems. J. Vet. Intern. Med. 2001, 15, 7–13. [Google Scholar] [CrossRef]
  32. Waly, N.E.; Biourge, V.; Day, M.J.; Stokes, C.R.; Harvey, A.; Bailey, M.; Gruffydd-Jones, T.J. Use of a hydrolysed soya isolate-based diet in the management of chronic idiopathic inflammatory bowel disease and dietary hypersensitivity in cats. Assuit Vet. Med. J. 2010, 56, 158–169. [Google Scholar] [CrossRef]
  33. Niederwerder, M.C. Fecal microbiota transplantation as a tool to treat and reduce susceptibility to disease in animals. Vet. Immunol. Immunopathol. 2018, 206, 65–72. [Google Scholar] [CrossRef]
  34. Chaitman, J.; Jergens, A.E.; Gaschen, F.; Garcia-Mazcorro, J.F.; Marks, S.L.; Marroquin-Cardona, A.G.; Richter, K.; Rossi, G.; Suchodolski, J.S.; Weese, J.S. Commentary on key aspects of fecal microbiota transplantation in small animal practice. Vet. Med. 2016, 7, 71–74. [Google Scholar] [CrossRef]
  35. Winston, J.A.; Suchodolski, J.S.; Gaschen, F.; Busch, K.; Marsilio, S.; Costa, M.C.; Chaitman, J.; Coffey, E.L.; Dandrieux, J.R.S.; Gal, A.; et al. Clinical Guidelines for Fecal Microbiota Transplantation in Companion Animals. Adv. Small Anim. Care 2024, 5, 79–107. [Google Scholar] [CrossRef]
  36. Weese, J.S.; Costa, M.C.; Webb, J.A. Preliminary clinical and microbiome assessment of stool transplantation in the dog and the cat [abstract]. J. Vet. Intern. Med. 2013, 27, 604–756. [Google Scholar] [CrossRef]
  37. Murphy, T.; Chaitman, J.; Han, E. Use of fecal transplant in eight dogs with refractory Clostridium perfringens associated diarrhea [abstract]. J. Vet. Intern. Med. 2014, 28, 976–1134. [Google Scholar] [CrossRef]
  38. Pereira, G.Q.; Gomes, L.A.; Santos, I.S.; Alfieri, A.F.; Weese, J.S.; Costa, M.C. Fecal microbiota transplantation in puppies with canine parvovirus infection. J. Vet. Intern. Med. 2018, 32, 707–711. [Google Scholar] [CrossRef]
  39. Chaitman, J.; Ziese, A.; Pilla, R.; Minamoto, Y.; Blake, A.B.; Guard, B.C.; Isaiah, A.; Lidbury, J.A.; Steiner, J.M.; Unterer, S.; et al. Fecal microbial and metabolic profiles in dogs receiving either fecal microbiota transplantation or oral metronidazole. Front. Vet. Sci. 2020, 7, 192. [Google Scholar] [CrossRef]
  40. Chaitman, J.; Gaschen, F. Fecal Microbiota Transplantation in Dogs. Vet. Clin. North Am. Small Anim. Pract. 2021, 51, 219–233. [Google Scholar] [CrossRef]
  41. Toresson, L.; Spillman, T.; Pilla, R.; Ludvigsson, U.; Hellgren, J.; Olmedal, G.; Suchodolski, J.S. Clinical Effects of Faecal Microbiota Transplantation as Adjunctive Therapy in Dogs with Chronic Enteropathies-A Retrospective Case Series of 41 Dogs. Vet. Sci. 2023, 10, 271. [Google Scholar] [CrossRef]
  42. Hanifeh, M.; Scarsella, E.; Rojas, C.A.; Ganz, H.H.; Huhtinen, M.; Laine, T.; Spillmann, T. Oral Fecal Microbiota Transplantation in Dogs with Tylosin-Responsive Enteropathy-A Proof-of-Concept Study. Vet. Sci. 2024, 11, 439. [Google Scholar] [CrossRef]
  43. Association of American Feed Control Officials (AAFCO). Official Publication 2022; Association of American Feed Control Officials: Oxford, IN, USA, 2022. [Google Scholar]
  44. Laflamme, D.P. Development and validation of a body condition score system for dogs: A clinical tool. Canine Pract. 1997, 22, 10–15. [Google Scholar]
  45. Association of Official Analytical Chemists (AOAC). Official Methods of Analysis, 17th ed.; Association of Official Analytical Chemists (AOAC): Gaithersburg, MD, USA, 2006. [Google Scholar]
  46. Prosky, L.; Asp, N.G.; Schweizer, T.F.; DeVries, J.W.; Furda, I. Determination of insoluble and soluble dietary fiber in foods and food products: Collaborative study. J. Assoc. Off. Anal. Chem. 1992, 75, 360–367. [Google Scholar] [CrossRef]
  47. Erwin, E.S.; Marco, G.J.; Emery, E.M. Volatile fatty acid analyses of blood and rumen fluid by gas chromatography. J. Dairy Sci. 1961, 44, 1768–1771. [Google Scholar] [CrossRef]
  48. Chaney, A.L.; Marbach, E.P. Modified reagents for determination of urea and ammonia. Clin. Chem. 1962, 8, 130–132. [Google Scholar] [CrossRef]
  49. Flickinger, E.A.; Schreijen, E.; Patil, A.R.; Hussein, H.S.; Grieshop, C.M.; Merchen, N.R.; Fahey, G.C., Jr. Nutrient digestibilities, microbial populations, and protein catabolites as affected by fructan supplementation of dog diets. J. Anim. Sci. 2003, 81, 2008–2018. [Google Scholar] [CrossRef]
  50. Caporaso, J.G.; Lauber, C.L.; Walters, W.A.; Berg-Lyons, D.; Huntley, J.; Fierer, N.; Owens, S.M.; Betley, J.; Fraser, L.; Bauer, M.; et al. Ultra-high-throughput microbial community analysis on the Illumina HiSeq and MiSeq platforms. ISME J. 2012, 6, 1621–1624. [Google Scholar] [CrossRef]
  51. Callahan, B.J.; McMurdie, P.J.; Rosen, M.J.; Han, A.W.; Johnson, A.J.; Holmes, S.P. DADA2: High-resolution sample inference from Illumina amplicon data. Nat. Methods 2016, 13, 581–583. [Google Scholar] [CrossRef]
  52. Quast, C.; Pruesse, E.; Yilmaz, P.; Gerken, J.; Schweer, T.; Yarza, P.; Peplies, J.; Glockner, F.O. The SILVA ribosomal RNA gene database project: Improved data processing and web-based tools. Nucleic Acids Res. 2013, 41, 590–596. [Google Scholar] [CrossRef]
  53. Bokulich, N.A.; Kaehler, B.D.; Rideout, J.R.; Dillon, M.; Bolyen, E.; Knight, R.; Huttley, G.A.; Caporaso, J.G. Optimizing taxonomic classification of marker-gene amplicon sequences with QIIME 2′s q2-feature-classifier plugin. Microbiome 2018, 6, 90. [Google Scholar] [CrossRef]
  54. Robeson, M.S.; O’Rourke, D.R.; Kaehler, B.D.; Ziemski, M.; Dillon, M.R.; Foster, J.T.; Bokulich, N.A. RESCRIPt: Reproducible sequence taxonomy reference database management. PLoS Comput. Biol. 2021, 17, e1009581. [Google Scholar] [CrossRef]
  55. Lozupone, C.; Knight, R. UniFrac: A new phylogenetic method for comparing microbial communities. Appl. Environ. Microbiol. 2005, 71, 8228–8235. [Google Scholar] [CrossRef]
  56. Suchodolski, J.S.; Markel, M.E.; Garcia-Mazcorro, J.F.; Unterer, S.; Heilmann, R.M.; Dowd, S.E.; Kachroo, P.; Ivanov, I.; Minamoto, Y.; Dillman, E.M.; et al. The fecal microbiome in dogs with acute diarrhea and idiopathic inflammatory bowel disease. PLoS ONE 2012, 7, e51907. [Google Scholar] [CrossRef]
  57. Panasevich, M.R.; Kerr, K.R.; Dilger, R.N.; Fahey, G.C., Jr.; Guérin-Deremaux, L.; Lynch, G.L.; Wils, D.; Suchodolski, J.S.; Steiner, J.M.; Dowd, S.E.; et al. Modulation of the faecal microbiome of healthy adult dogs by inclusion of potato fibre in the diet. Br. J. Nutr. 2015, 113, 125–133. [Google Scholar] [CrossRef]
  58. Minamoto, Y.; Hooda, S.; Swanson, K.S.; Suchodolski, J.S. Feline gastrointestinal microbiota. Anim. Health Res. Rev. 2012, 13, 64–77. [Google Scholar] [CrossRef]
  59. Marsilio, S.; Chow, B.; Hill, S.L.; Ackermann, M.R.; Estep, J.S.; Sarawichitr, B.; Pilla, R.; Lidbury, J.A.; Steiner, J.M.; Suchodolski, J.S. Untargeted metabolomic analysis in cats with naturally occurring inflammatory bowel disease and alimentary small cell lymphoma. Sci. Rep. 2021, 11, 9198. [Google Scholar] [CrossRef]
  60. Marsilio, S.; Freiche, V.; Johnson, E.; Leo, C.; Langerak, A.W.; Peters, I.; Ackermann, M.R. ACVIM consensus statement guidelines on diagnosing and distinguishing low-grade neoplastic from inflammatory lymphocytic chronic enteropathies in cats. J. Vet. Intern. Med. 2023, 37, 794–816. [Google Scholar] [CrossRef]
  61. Sung, C.-H.; Pilla, R.; Marsilio, S.; Chow, B.; Zornow, K.A.; Slovak, J.E.; Lidbury, J.A.; Steiner, J.M.; Hill, S.L.; Suchodolski, J.S. Fecal Concentrations of Long-Chain Fatty Acids, Sterols, and Unconjugated Bile Acids in Cats with Chronic Enteropathy. Animals 2023, 13, 2753. [Google Scholar] [CrossRef]
  62. Blake, A.B.; Guard, B.C.; Honneffer, J.B.; Lidbury, J.A.; Steiner, J.M.; Suchodolski, J.S. Altered microbiota, fecal lactate, and fecal bile acids in dogs with gastrointestinal disease. PLoS ONE 2019, 14, e0224454. [Google Scholar] [CrossRef]
  63. Pilla, R.; Suchodolski, J.S. The role of the canine gut microbiome and metabolome in health and gastrointestinal disease. Front. Vet. Sci. 2020, 6, 498. [Google Scholar] [CrossRef]
  64. Sung, C.-H.; Marsilio, S.; Pilla, R.; Wu, Y.-A.; Cavasin, J.P.; Hong, M.-P.; Suchodolski, J.S. Temporal variability of the dominant fecal microbiota in healthy adult cats. Vet. Sci. 2024, 11, 31. [Google Scholar] [CrossRef]
  65. Belchik, S.E.; Oba, P.M.; Wyss, R.; Asare, P.T.; Vidal, S.; Miao, Y.; Adesokan, Y.; Suchodolski, J.S.; Swanson, K.S. Effects of a milk oligosaccharide biosimilar on fecal characteristics, microbiota, and bile acid, calprotectin, and immunoglobulin concentrations of healthy adult dogs treated with metronidazole. J. Anim. Sci. 2023, 101, skad011. [Google Scholar] [CrossRef] [PubMed]
  66. Belchik, S.E.; Oba, P.M.; Lin, C.-Y.; Swanson, K.S. Effects of a veterinary gastrointestinal low-fat diet on fecal characteristics, metabolites, and microbiota concentrations of adult dogs treated with metronidazole. J. Anim. Sci. 2024, 102, skae297. [Google Scholar] [CrossRef]
  67. Ridlon, J.M.; Kang, D.-J.; Hylemon, P.B. Bile salt transformations by human intestinal bacteria. J. Lipid Res. 2006, 47, 241–259. [Google Scholar] [CrossRef]
  68. Ridlon, J.M.; Harris, S.C.; Bhowmik, S.; Kang, D.-J.; Hylemon, P.B. Consequences of bile salt biotransformations by intestinal bacteria. Gut Microbes 2016, 7, 22–39. [Google Scholar] [CrossRef]
  69. Cai, J.; Rimal, B.; Jiang, C.; Chiang, J.L.; Patterson, A.D. Bile acid metabolism and signaling, the microbiota, and metabolic disease. Pharmacol. Ther. 2022, 237, 108238. [Google Scholar] [CrossRef]
  70. Song, Z.; Cai, Y.; Lao, X.; Wang, X.; Lin, C.; Cui, Y.; Kalavagunta, P.K.; Liao, J.; Jin, L.; Shang, J.; et al. Taxonomic profiling and populational patterns of bacterial bile salt hydrolase (BSH) genes based on worldwide human gut microbiome. Microbiome 2019, 7, 9. [Google Scholar] [CrossRef]
  71. Correa Lopes, B.; Chen, C.-C.; Sung, C.-H.; Ishii, P.E.; Medina, L.F.D.C.; Gaschen, F.P.; Suchodolski, J.S.; Pilla, R. Correlation between Peptacetobacter hiranonis, the baiCD Gene, and Secondary Bile Acids in Dogs. Animals 2024, 14, 216. [Google Scholar] [CrossRef]
  72. Fahey, G.C.; Merchen, N.R.; Corbin, J.E.; Hamilton, A.K.; Serbe, K.A.; Lewise, S.M.; Hirakawa, D.A. Dietary fiber for dogs: I. Effects of beet pulp on nutrient intake, digestibility, metabolizable energy, and digesta mean retention time. J. Anim. Sci. 1990, 68, 4221–4228. [Google Scholar] [CrossRef] [PubMed]
  73. de Godoy, M.R.C.; Kerr, K.R.; Fahey, G.C. Alternative dietary fiber sources in companion animal nutrition. Nutrients 2013, 5, 3099–3117. [Google Scholar] [CrossRef] [PubMed]
  74. de Godoy, M.R.C.; Mitsuhashi, Y.; Bauer, L.L.; Fahey, G.C.; Buff, P.R.; Swanson, K.S. In vitro fermentation characteristics of novel fibers, coconut endosperm fiber and chicory pulp, using canine fecal inoculum. J. Anim. Sci. 2015, 93, 370–376. [Google Scholar] [CrossRef]
  75. Detweiler, K.B.; He, F.; Mangian, H.F.; Davenport, G.M.; de Godoy, M.R.C. Effects of high inclusion of soybean hulls on apparent total tract macronutrient digestibility, fecal quality, and fecal fermentative end-product concentrations in extruded diets of adult dogs. J. Anim. Sci. 2015, 97, 1027–1035. [Google Scholar] [CrossRef]
  76. De Souza Nogueira, J.P.; He, F.; Mangian, H.F.; Oba, P.M.; de Godoy, M.R.C. Dietary supplementation of a fiber-prebiotic and saccharin-eugenol blend in extruded diets fed to dogs. J. Anim. Sci. 2019, 97, 4519–4531. [Google Scholar] [CrossRef]
  77. Finet, S.; He, F.; Clark, L.V.; de Godoy, M.R.C. Functional properties of miscanthus fiber and prebiotic blends in extruded canine diets. J. Anim. Sci. 2019, 100, skac078. [Google Scholar] [CrossRef]
  78. Nybroe, S.; Horsman, P.B.; Krag, K.; Hosbjerg, T.G.; Stenberg, K.; Khakimov, B.; Baymler, J.; Bjornvad, C.R.; Kieler, I.N. Alterations in Healthy Adult Canine Faecal Microbiome and Selected Metabolites as a Result of Feeding a Commercial Complete Synbiotic Diet with Enterococcus faecium NCIMB 10415. Animals 2022, 13, 144. [Google Scholar] [CrossRef]
  79. Furmanski, S.; Mor, T. First Case Report of Fecal Microbiota Transplantation in a Cat in Israel. Isr. J. Vet. Med. 2017, 72, 35–41. [Google Scholar]
  80. Rojas, C.A.; Entrolezo, Z.; Jarett, J.K.; Jospin, G.; Kingsbury, D.D.; Martin, A.; Eisen, J.A.; Ganz, H.H. Microbiome Responses to Fecal Microbial Transplantation in Cats with Chronic Digestive Issues. Vet. Sci. 2023, 10, 561. [Google Scholar] [CrossRef]
  81. Kennedy, M.S.; Freiburger, A.; Cooper, M.; Beilsmith, K.; St George, M.L.; Kalski, M.; Cham, C.; Guzzetta, A.; Ng, S.C.; Chan, F.K.; et al. Diet outperforms microbial transplant to drive microbiome recover in mice. Nature 2025, 642, 747–755. [Google Scholar] [CrossRef]
  82. Niederwerder, M.C.; Constance, L.A.; Rowland, R.R.R.; Abbas, W.; Fernando, S.C.; Potter, M.L.; Sheahan, M.A.; Burkey, T.E.; Hesse, R.A.; Cino-Ozuna, A.G. Fecal Microbiota Transplantation Is Associated with Reduced Morbidity and Mortality in Porcine Circovirus Associated Disease. Front. Microbiol. 2018, 9, 1631. [Google Scholar] [CrossRef]
  83. Mercer, M.A. (Ed.) Nitroimidazoles use in animals. In Merck Veterinary Manual; Merck & Co., Inc.: Rahway, NJ, USA, 2022. [Google Scholar]
  84. Tangtrongsup, S.; Scorza, V. Update on the Diagnosis and Management of Giardia spp. Infections in Dogs and Cats. Top. Companion Anim. Med. 2010, 25, 155–162. [Google Scholar] [CrossRef]
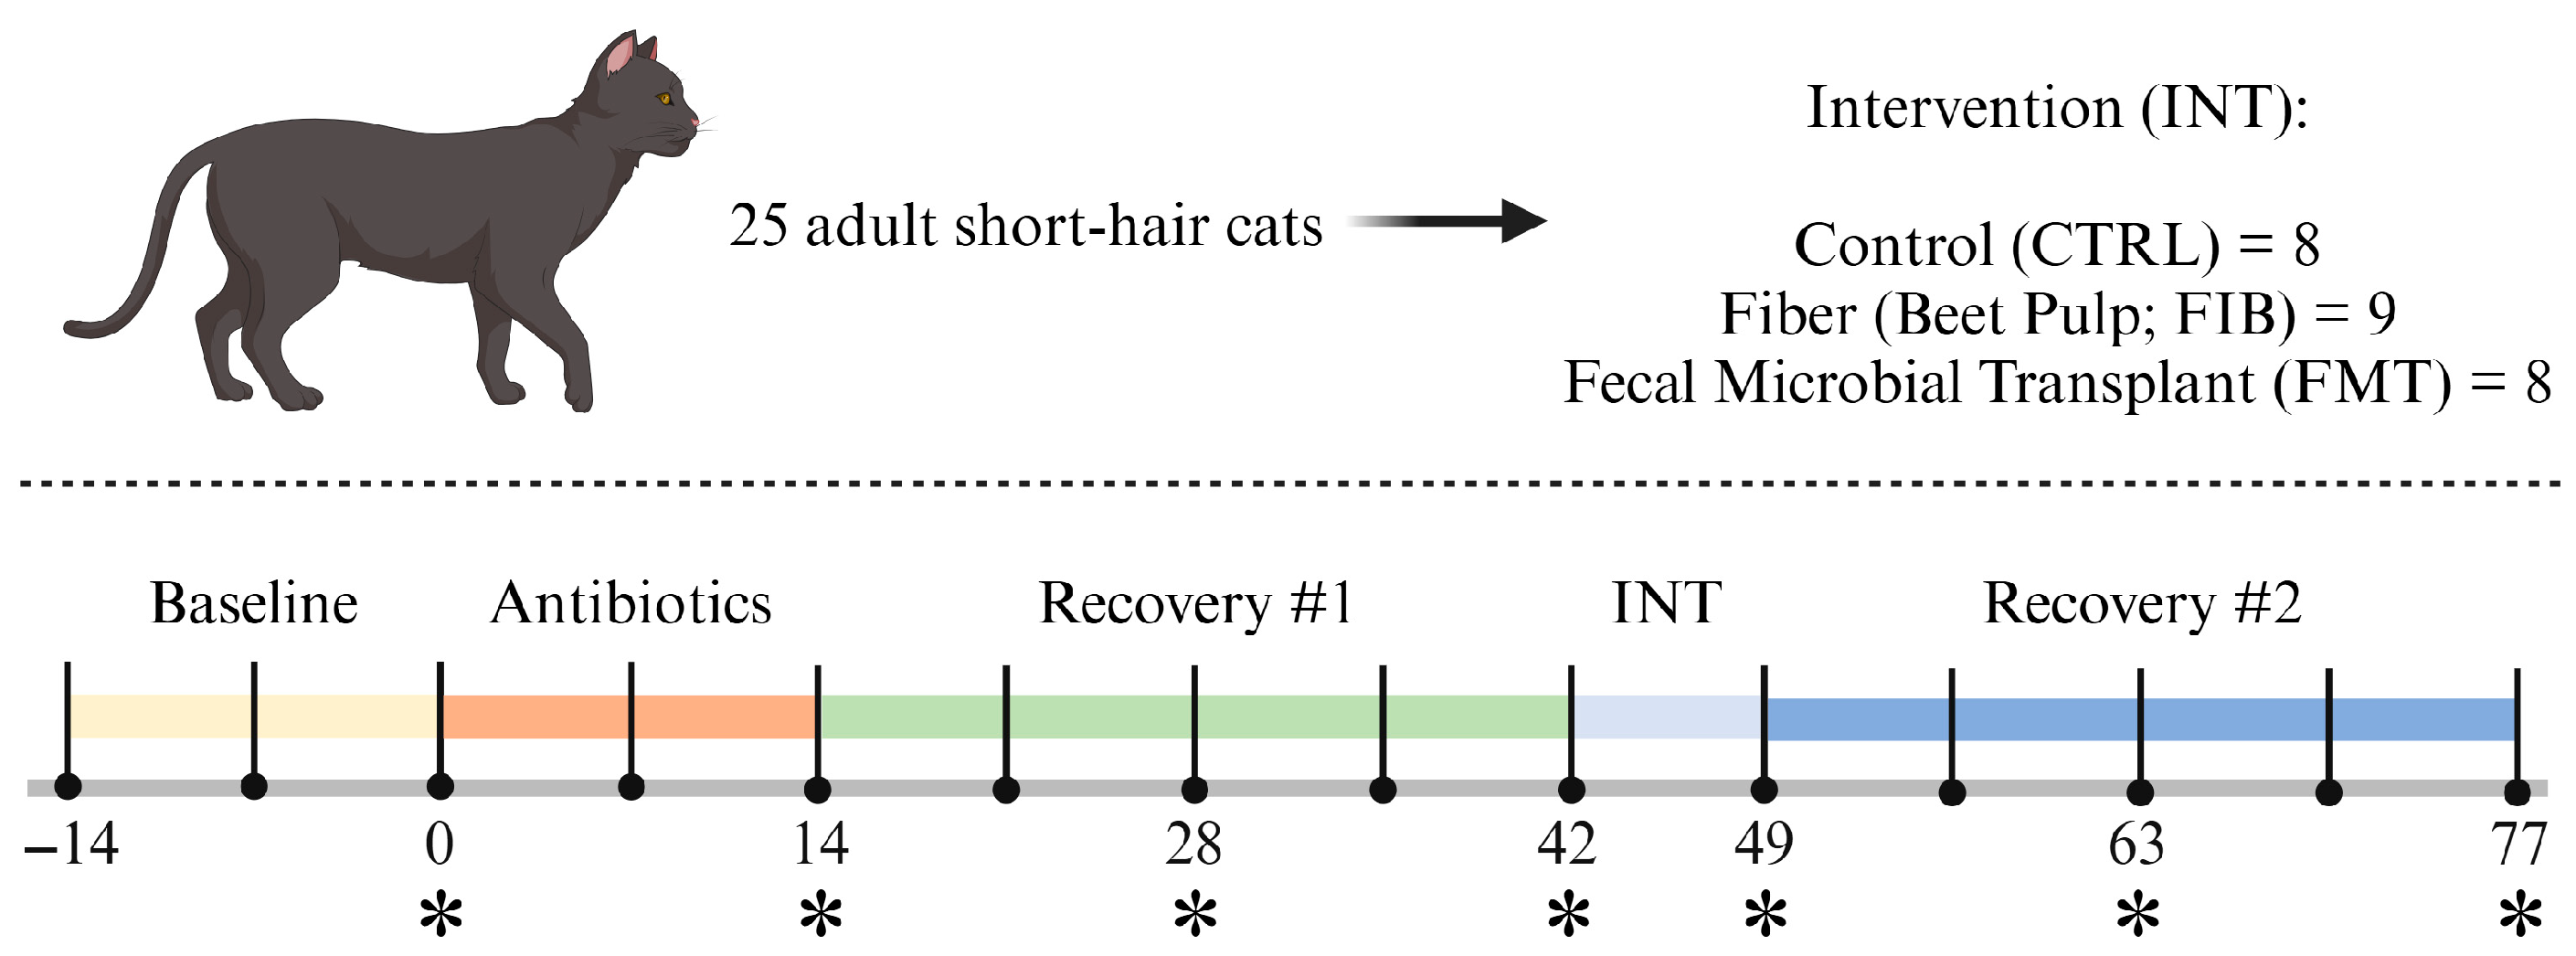
Figure 1. Experimental timeline. Fresh fecal and fasted blood samples were collected at timepoints denoted with an asterisk (*).
Pets 02 00027 g001
Figure 2. Changes to fecal characteristics [fecal scores (A), pH values (B), and DM percentages (C)] of healthy adult cats recovering from metronidazole administration (d 14 vs. d 28–77). Intervention (CTRL, FIB, or FMT) was exclusively provided from d 43–49. Data are presented as change from antibiotic administration (d 14) least square means ± SEM.
Pets 02 00027 g002
Figure 3. Changes to fecal SCFA concentrations [total SCFA (A), acetate (B), propionate (C), and butyrate (D)] (μmol/g, DM) of healthy adult cats recovering from metronidazole administration (d 14 vs. d 28–77). Intervention (CTRL, FIB, or FMT) was exclusively provided from d 43–49. Data are presented as change from antibiotic administration (d 14) least square means ± SEM.
Pets 02 00027 g003
Figure 4. Changes to fecal dysbiosis index (A) and bacterial abundances (BI; log DNA/gram feces) of healthy adult cats recovering from metronidazole administration (d 14 vs. d 28–77). Intervention (CTRL, FIB, or FMT) was exclusively provided from d 43–49. Data are presented as change from antibiotic administration (d 14) least square means ± SEM. abc Mean values within a row with unlike superscript letters differ using parametric analysis (p < 0.05).
Pets 02 00027 g004
Figure 5. Dysbiosis index values of healthy adult cats before (d 0), during (d 14), and after metronidazole administration (d 28–77). A score less than zero (gray area) is considered healthy and “normal,” whereas a score of one and higher (pink) denotes extreme dysbiosis. A DI ranging from zero to one (yellow) is indicative of a mild-to-moderate shift in the overall diversity. The top figure represents all cats within each time point whereas the bottom figure separates cats within allotment (left to right within time point: CTRL, FIB, FMT).
Pets 02 00027 g005
Figure 6. Changes to fecal alpha diversity [Shannon Diversity (A), Faith’s PD (B)] measures of healthy adult cats recovering from metronidazole administration (d 14 vs. d 28–77). Intervention (CTRL, FIB, or FMT) was exclusively provided from d 43–49. Data are presented as change from antibiotic administration (d 14) least square means ± SEM.
Pets 02 00027 g006
Figure 7. Unweighted (A) and weighted (B) principal coordinate analysis plots based on UniFrac distances of healthy adult cats recovering from metronidazole administration (d 14 vs. d 28–77). Intervention (CTRL, FIB, or FMT) was exclusively provided from d 43–49. Intervention (CTRL, FIB, or FMT) was exclusively provided from d 43–49.
Pets 02 00027 g007
Table 1. Effects of metronidazole administration on the fecal characteristics and metabolite concentrations of healthy adult cats (d 0 vs. d 14).
ItemABX− 1ABX+SEM 2p-Value
Fecal characteristics
    Fecal score 32.92 y3.44 z0.1000.0004
    Fecal pH5.745.750.1020.8996
    Fecal dry matter (DM), %32.67 a27.23 b1.0440.0003
Fecal metabolites, μmol/g, DM
    Total SCFA 4430.29 a197.42 b22.844<0.0001
    Acetate291.96 a176.47 b14.7650.0003
    Propionate104.02 a13.55 b5.905<0.0001
    Butyrate64.30 z7.40 y4.110<0.0001
    Total BCFA 416.75 z0.89 y0.911<0.0001
    Isobutyrate4.70 z0.26 y0.272<0.0001
    Isovalerate7.65 z0.44 y0.416<0.0001
    Valerate4.40 z0.20 y0.251<0.0001
    Ammonia135.02 a57.23 b7.018<0.0001
    Total phenol/indole 41.75 z0.03 y0.139<0.0001
    Total phenols1.00 z0.03 y0.099<0.0001
    4-Methylphenol1.00 z0.03 y0.099<0.0001
    4-Ethylphenol0.000.000.0001.0000
    Indole0.75 z0.00 y0.045<0.0001
1 ABX− = samples collected from cats prior to antibiotic administration (d 0); ABX+ = samples collected after receiving metronidazole (20 mg/kg body weight twice daily) for two wk (d 14); 2 SEM = pooled standard errors of the means; 3 Fecal scores: 1 = hard, dry pellets, small hard mass; 2 = hard, formed, dry stool; remains firm and soft; 3 = soft, formed, and moist stool, retains shape; 4 = soft, unformed stool, assumes shape of container; and 5 = watery, liquid that can be poured; 4 Total SCFA = acetate + propionate + butyrate; total BCFA = isobutyrate + isovalerate + valerate; total phenol/indole = 4-methylphenol + 4-ethylphenol + indole; ab Mean values within a row with unlike superscript letters differ using parametric analysis (p < 0.05); yz Mean values within a row with unlike superscript letters differ using non-parametric analysis (p < 0.05).
Table 2. Effects of metronidazole administration on the fecal dysbiosis index and bacterial abundances (log DNA/gram feces) of healthy adult cats (d 0 vs. d 14).
ItemABX− 1ABX+SEM 2p-Value
Dysbiosis index−3.40 b2.55 a0.128<0.0001
Total bacteria10.8510.820.0340.5051
Bacteroides6.65 a5.38 b0.104<0.0001
Blautia10.22 z8.00 y0.090<0.0001
Bifidobacterium6.50 y7.54 z0.164<0.0001
E. coli4.10 y6.66 z0.157<0.0001
Faecalibacterium6.85 z4.35 y0.123<0.0001
Fusobacterium7.407.430.0460.4530
P. hiranonis5.88 z1.36 y0.265<0.0001
Streptococcus2.78 b5.16 a0.249<0.0001
Turicibacter6.58 a4.42 b0.126<0.0001
1 ABX− = samples collected from cats prior to antibiotic administration (d 0); ABX+ = samples collected after receiving metronidazole (20 mg/kg body weight twice daily) for two wk (d 14); 2 SEM = pooled standard errors of the means; ab Mean values within a row with unlike superscript letters differ using parametric analysis (p < 0.05); yz Mean values within a row with unlike superscript letters differ using non-parametric analysis (p < 0.05).
Disclaimer/Publisher’s Note: The statements, opinions and data contained in all publications are solely those of the individual author(s) and contributor(s) and not of MDPI and/or the editor(s). MDPI and/or the editor(s) disclaim responsibility for any injury to people or property resulting from any ideas, methods, instructions or products referred to in the content.