Abstract
In the context of increasing digitization, integrating ICT technologies, artificial intelligence, and remote working is altering residential mobility patterns and housing preferences. This study examines the housing market’s impact, focusing on how residential affordability affects residential choices, using a case study of the Metropolitan City of Florence. The analysis employs a methodology centered on the Debt-to-Income Ratio (DTI), which cross-references real estate market values (source: Agenzia delle Entrate and leading real estate portals) with household income brackets to identify affordable areas. The results reveal a clear divide: households with incomes below EUR 26,000 per year (representing about 69% of the population) are excluded from the central urban property market. This evidence confirms regional and national trends, emphasizing a growing mismatch between housing costs and disposable incomes. The study concludes that affordability is a technical–financial parameter and a valuable tool for supporting inclusive urban planning. Its application facilitates the orientation of effective public policies and the identification of socially sustainable housing solutions.
1. Introduction
The technologies of ICT (Information and Communication Technology), digital innovation, artificial intelligence (AI), and e-commerce are impacting the way we live and work, reducing the need for physical proximity to a city [1]. According to Ponti [2], these technologies have redefined the paradigm of our communicative interactions and opened new perspectives and opportunities. Residential mobility—defined as the frequency and patterns with which individuals and families change their place of residence—is a process that can potentially increase due to the ongoing digital transition, influencing market dynamics, housing accessibility, and urban development strategies. This digital transition encompasses various dimensions of human society, beginning with the professional sphere and extending to administrative, commercial, social, and even private domains. Digital technologies are leveraged to make activities associated with these dimensions more efficient, simple, and accessible. In a society undergoing digital transition, the number of functions and services performed through computer networks and digital devices increases, thereby changing habits, working methods, and the use of leisure time [3].
With the rise in remote work in many advanced economies [4], the choice of where to live takes on new dimensions. Historically, residential mobility patterns followed a trajectory toward major urban centers, where individuals traditionally conducted their work activities. However, this trend has slowed down and, in some cases, even reversed. According to Wong, Kourtit, and Nijkamp [5], the digitization of work has likely reshaped the appeal of compact, high-density urban locations, influencing preferences for urban and rural living and shaping the future structure of cities”. The COVID-19 pandemic has accelerated these transitions. In the wake of the health crisis, teleworking has gained greater acceptance and become increasingly common. Remote work—at least part of the week—has become the norm for many. These shifts have redefined the perceived value of various locations, prompting individuals to consider relocating from urban centers to peripheral or rural areas when they find rural living more appealing and rewarding.
Surveys on residential mobility currently underway in Italy [6] have highlighted that many workers who experienced full-time remote work—mainly employees in the service sector—and whose companies have expressed the intention to continue this arrangement even after the pandemic (potentially affecting more than 15 million workers in Italy, according to ISTAT, 2021 [7]) reveal a significant impact on residential patterns. Twenty-one percent of the survey sample responded that remote working has led, or will lead, to a move back to their place of origin, primarily in central and southern Italy—a trend often referred to as “south working.” In this context, the data are more significant among residents of provincial capitals (28%), especially in large cities (30%), compared to non-capital municipalities, where the phenomenon accounts for only 9% of cases. These data suggest a growing willingness to choose where to live independently of the location of one’s workplace [8]; all of this relates to the increasingly widespread ambition among individuals to achieve adequate states of well-being. It is now a commonly shared view that individual well-being is linked to the ability to create—or choose—an environment that allows people to realize their potential and fully enjoy their fundamental rights [9,10,11,12]. In particular, the choice of where to live and the search for a place that can meet one’s needs (search for housing quality [8,9]) is a complex and multidimensional process [13].
Among the numerous dimensions that influence this process, three distinct aspects can be identified, each pertaining to different considerations:
- The quality of the territorial context and the morphological characteristics of the dwelling (objective factors), along with aspects such as pollution, availability of green spaces, and the presence of healthcare facilities, influence how attractive a place is.
- Subjective perceptions of a particular place, which emphasize aspects such as emotional attachment, routines, and personal connections.
- The housing market, particularly regarding the impact of housing costs, significantly influences contemporary urban societies. Housing expenses constitute the largest component of household budgets and, along with income, dictate the level of resources available for consumption [14].
The definition of housing quality (or housing well-being, or “liveability”) must consider three fundamental aspects:
- Aspects related to the territory (objective well-being), including, for example, the availability of local services, the level of accessibility to various urban opportunities, the presence of environmental issues, and the perception of safety, etc. [15];
- Aspects related to personal perceptions of subjective well-being, encompassing both cognitive judgments regarding life satisfaction and affective evaluations involving moods and emotions [16];
- Aspects related to the housing market and, consequently, the economic sustainability of the dwelling.
This multidimensional interpretation is consistent with contemporary frameworks for evaluating overall quality in architectural and urban projects, wherein technical, functional, and experiential factors are assimilated into comprehensive evaluation models [17].
This contribution focuses on the third aspect. Housing prices in Europe have risen steadily since 2013, with significant increases from 2015 to 2022. Rental costs also grew by 18% from 2010 to 2022 [18].
Affordability in housing is one of the main challenges that European cities have faced for some time in their pursuit of social cohesion. Although there is still no single definition, the European Commission defines Affordable Housing (AH) as «generally understood as social housing, affordable rental housing, and affordable home ownership, provided to eligible households whose needs are not met by the market—i.e., those belonging to the first three quintiles of the population» [19]. AH within the European Union is characterized by a wide diversity of national housing conditions, concepts, and policies among member states. Different approaches are implemented regarding types of ownership, suppliers, beneficiaries, and financing methods. While AH may take various forms depending on national and local conditions, two main types can be identified: “rented social housing”, which are rented homes owned by local authorities and managed directly or through specified agents, and “intermediate affordable housing” for sale or rent, at rates higher than social rents but below market rates [20]. Specifically concerning Italy, the situation presents critical aspects: on average, around 40% of an individual’s total annual income is allocated to housing costs. Cities with the highest housing cost-to-income ratios include Venice (53.6%), Florence (52.2%), Naples (47.1%), Bologna (44.7%), Rome (44.2%), and Milan (43.6%) [21]. Disproportionate housing expenses relative to income can lead to a reduced standard of living for households, while low housing costs can alleviate the economic strain on low- to middle-income families. Thus, it is evident that housing quality also depends on its price—or, using the widely adopted term in international literature, its affordability [22].
Based on the above, this contribution aims to illustrate some results related to the Project of Significant National Interest referred to in the Call for Proposals no. 1409 of 14 September 2022 (PRIN 2022 PNRR) approved by the Ministry of University and Research (MUR) with D.D. no. 1235 of 1 August 2023 and admitted for funding with D.D. no. 1378 of 1 September 2023, ERC SH—Social Sciences and Humanities, main ERC subfield SH7_7 Cities; urban, regional and rural studies entitled “Housing mobility and digital transition. Evaluation tools and technologies for understanding current and future people’s living needs, supporting territorial governance and regeneration processes,” and which therefore results among the Research projects funded by the European Union under the Next Generation EU.
This contribution fits within the broader field of studies on housing accessibility, specifically affordability. The first objective of this paper is to provide a literature review on housing affordability while offering an overview of the current situation at both the European and national (Italian) levels. The second objective is to examine the critical evaluative element for understanding affordability: the Debt-To-Income Ratio, which indicates housing debt relative to income. Focusing on the Metropolitan City of Florence as the area of investigation, the paper presents the results of an in-depth market analysis conducted through consultation of the Revenue Agency’s database, which encompasses all property sales and rental prices. This analysis produces a detailed mapping of residential property values, providing more granularity than the data from the OMI (Osservatorio del Mercato Immobiliare). The third objective, again with reference to the Metropolitan City of Florence, is to analyze household income levels to assess housing affordability across the metropolitan area by applying the Debt-To-Income Ratio, identifying the most accessible locations within the real estate market.
This study aims to provide data that, when compared to consolidated information on the vitality of the property purchase and sale market—reflected by the IMI (Indice dei Mercati Immobiliari), created by the Agenzia delle Entrate to evaluate the property market using metrics like transaction counts, average property sizes, and geographical distribution of purchases and sales—can yield valuable insights and practical guidelines for urban policies and initiatives designed to enhance housing accessibility, covering public, social, and subsidized housing options. Grasping market dynamics is, indeed, a fundamental and requisite step for any endeavour related to territorial development. It becomes evident that territorial governance, which encompasses land use and protection, urban regeneration, and aspects of energy policy and housing access, must invariably consider the frequently heterogeneous and localized economic structures of the territories wherein such governance is implemented.
2. Materials and Methods
2.1. Literary Review: Housing Affordability in the European and Italian Contexts
To date, the inaccessibility of housing constitutes a significant issue within the European market. Housing costs are rising increasingly across Europe, evidenced by an upward trend in the housing price index in most European nations [18]. This trend is particularly pronounced in urban areas, where approximately two-thirds of the European population resides. Evaluating housing needs typically entails consideration of three distinct dimensions:
- Formal adequacy;
- Affordability;
- Overcrowding [23].
Among these three dimensions, affordability is currently the most widespread problem in Europe, and data support this [18,24,25]. Affordability refers to the economic capacity to bear the costs of purchasing or renting a home. Therefore, to understand the situation within the European context, it is necessary to analyze data on property values and average annual citizen incomes—key indicators that define affordability. Between 2010 and the first quarter of 2024, house prices in Europe rose significantly, with the largest increases observed in Estonia (+223%), Hungary (+207%), and Lithuania (+170%), while slight decreases were recorded in Italy (−8%) and Cyprus (−1.2%). Rental costs have also increased across the EU, with rises in 25 countries. The highest increases were seen in Estonia (+201%), Lithuania (+174%), and Ireland (+104%). These trends are partly attributed to the growth of short-term rentals, which have removed homes and apartments from the traditional housing market [26].
From a market perspective, several factors impede the development of affordable housing, with urbanization being the most apparent. As cities increasingly become hubs of economic growth, they draw in a larger pool of skilled workers. Consequently, housing prices in urban locales—already high—continue to escalate, often outstripping household disposable income and worsening the issue of housing affordability [27]. Over time, access to housing has become more challenging, especially in areas where non-residents, usually tourists, have created new and escalating demands for housing [28]. This trend has also led to the decline of services aimed at permanent residents, which have been substituted with those focusing on tourists. It is evident that this process—along with the shift in certain urban functions to outlying areas—has on one hand, revitalized parts of the cities’ economic and commercial landscapes, while on the other, has driven residents to relocate away from central zones to find a better balance between the quality and cost of housing.
As mentioned earlier, income levels significantly influence access to housing. Increasing concern surrounds housing affordability, exemplified by a recent OECD report [27] (p. 4) which states, “over the last twenty years, rising housing prices in most OECD countries have led households to devote an increasingly large portion of their budgets to housing.”.
Housing costs are generally recognized as the most significant expense in household budgets [29] (p. 159), with low-income households dedicating an even larger share of their income to these costs [30]. Housing expenses continue to create a notable financial strain relative to income, with housing struggles often tied to household poverty and influenced by labor market trends. The economic backdrop to these challenges is characterized by low growth, affecting incomes and diminishing household purchasing power. On one side, an increase in demand, especially from individuals willing to pay premium prices, has escalated costs in rental and purchasing markets over the long term. In 22 EU countries, the burden of housing costs has been more pronounced in urban areas compared to rural regions, with only 5 exceptions. The most extreme differences are observed in Denmark (12.9 percentage points—23.3% in cities versus 10.4% in rural areas) and Malta (12.1 percentage points—5.5% in the towns versus 17.6% in rural areas).
Italy’s housing affordability crisis ranks among its most pressing social and territorial issues within the European context. Securing and maintaining homeownership is increasingly challenging, particularly for vulnerable groups. Italian families are encountering heightened difficulties in obtaining loans for home purchases, a situation exacerbated by rising interest rates, escalating management and maintenance expenses, and real estate depreciation in several regions. ISTAT data reveals that in the third quarter of 2024, housing prices rose an average of +3.9% compared to the same quarter the previous year, with new housing costs soaring by +8.8% versus existing homes at +2.8% [24].
This inflationary trend unfolds within a broader economic landscape marked by sluggish employment growth and ongoing income stagnation, compounding the challenge of managing housing-related expenses. Italy continues to exhibit a structural gap compared to European standards in terms of employment rates and labor market participation [31].
The average disposable income of households has increased only marginally over the past ten years and, in real terms, remains below the European Union average. This imbalance between stagnant incomes and rising living costs is fueling housing exclusion, particularly among younger generations: according to the 58th CENSIS Report, 40.5% of young people aged 18 to 34 still live with their parents, one of the highest percentages in Europe. This situation is not merely a cultural choice; it largely reflects the economic impossibility of independently affording housing expenses in a real estate market that does not provide enough affordable solutions [32]. Additionally, the widespread growth of short-term rentals for tourism purposes, particularly in artistic cities such as Florence, Rome, Venice, Naples, and Milan, exacerbates the issue. In some central areas, the share of housing units allocated for this purpose has exceeded 5%, reducing the availability of homes for permanent residents. This phenomenon direly impacts young people, students, and precarious workers, who are already disadvantaged in the rental market. The Censis- Federproprietà Report (2024) [33] notes that over 44% of Italians view short-term rentals as a cause of rising prices and the loss of livability in the most tourist-oriented neighborhoods. Furthermore, a fundamental issue is the limited availability of public housing. In Italy, only 3.5% of the housing stock is dedicated to Public Residential Housing, a share significantly lower than in countries such as Austria (23%) and the Netherlands (32%). This shortage highlights the lack of adequate housing policies, leaving many families to contend with a private housing market that is increasingly exclusive and expensive [34]. The overall picture reveals a serious difficulty in accessing housing in Italy. While this issue is also present in other European countries, it is exacerbated in Italy by low incomes, weak public policies, the growth of tourism in cities, and a mismatch between housing supply and demand.
2.2. Methods: Debt-to-Income Ratio (DTI)
The Debt-to-Income Ratio (DTI) serves as a crucial metric for evaluating the financial viability of a real estate purchase. It measures the share of a household’s net monthly income that goes towards housing-related debts, including mortgage payments, insurance, and property taxes. To calculate the DTI, sum these monthly expenses, divide by the net monthly income, and multiply the result by 100 to express it as a percentage [35].
The mathematical formula is as follows:
DTI = (Monthly debt/Net monthly income) × 100
Regarding housing affordability, the Debt-to-Income Ratio (DTI) is a key indicator for evaluating households’ genuine ability to achieve homeownership without jeopardizing their overall financial stability. A DTI between 30% and 35% in European residential markets is frequently regarded as the benchmark threshold for a sustainable mortgage. However, many conventional loans permit DTIs of up to 45%, and in certain instances, even up to 50%, if the borrower possesses compensating factors, such as savings that cover at least six months of housing expenses [36].
Beyond its application in individual assessments, the DTI is increasingly utilized at the macroeconomic level to regulate housing markets. The OECD, for example, employs it as a key indicator for analyzing housing affordability in urban settings, as it helps identify socioeconomic vulnerability and informs public policies to enhance equity in housing access [37]. In this regard, the DTI serves not only as a technical–financial instrument but also as a structural parameter for assessing housing justice and the social resilience of regions.
In the Brick-by-Brick report by the OECD (2021) [37], the cases of Sweden and Canada are analyzed as examples of the application of DTI in a macroprudential context. In Sweden, in response to the rapid increase in housing prices, an additional annual amortization requirement of 1% was introduced in 2018 for mortgages with a DTI above 4.5 (indicating that the borrower’s total debt exceeds 4.5 times their net annual income). The measure aimed to limit household over-indebtedness and cool down the market. Similarly, in Canada, Loan-to-Value (LTV) limits were tightened, and debt service ratio calculation criteria were revised, imposing more conservative interest rate assumptions and restricting access to public mortgage insurance for high-risk loans.
In both cases, the measures had a stabilizing effect, especially in cities like Vancouver and Toronto, which were facing intense housing price pressures. Another relevant case study comes from the Arab Monetary Fund (2022), which examined the impact of DTI thresholds in ten countries in the region from 2014 to 2020 [38]. The study revealed that introducing or tightening DTI limits, particularly through lowering the maximum allowed threshold, resulted in an average reduction of 2.17% in consumer credit growth within just one quarter after the intervention. The effect was more pronounced when the measure was not pre-announced, thereby preventing opportunistic behavior by borrowers.
The analysis revealed considerable differences in DTI thresholds across the examined countries: in Oman, for instance, the limit is 60%, while in Iraq it falls to 12.5%. This disparity reflects distinct risk appetites and the stabilization strategies employed by their respective monetary authorities. These examples illustrate DTI’s adaptability and efficiency as a regulatory tool that can curb over-indebtedness and temper speculative behavior in real estate markets while minimally affecting aggregate demand or the financial system’s stability.
2.3. Methodological Proposal
The proposed method is structured in three phases, creating an integrated model for evaluating housing affordability by location. The first phase comprises territorial subdivisions based on OMI (Osservatorio del Mercato Immobiliare—Real Estate Market Observatory) boundaries, along with identifying additional subzones that exhibit significant property value differences. This methodology involves gathering property market data from the Italian Revenue Agency (Agenzia delle Entrate) website, concentrating on residential properties in average condition. Due to OMI data limitations in reflecting actual price dynamics, it was essential to enhance the dataset with primary information sources. These sources include the following:
- Declared real estate transaction values (2022–2024), accessed through the software on the Agenzia delle Entrate website [39];
- Asking prices from major online real estate platforms, adjusted downward by 10%;
- Geospatial analysis of transaction data over distances ranging from 100 to 500 m [40].
The data collected were used in accordance with the Italian estimation discipline, which stipulates comparison as the cardinal principle of estimation, and further refined through QGIS software version 3.38.2 to establish new, more precise subzones (OMI subzones). This mapping enhances the spatial resolution of housing market analysis.
The second phase entails categorizing the resident population of each municipality in the metropolitan area into seven income brackets:
- From EUR 0 to EUR 10,000;
- From EUR 10,001 to EUR 15,000;
- From EUR 15,001 to EUR 26,000;
- From EUR 26,001 to EUR 55,000;
- From EUR 55,001 to EUR 75,000;
- From EUR 75,001 to EUR 120,000;
- Over EUR 120,000.
The population count in each bracket was computed at the municipal level, aligning with the territorial segmentation set in Phase 1.
The final phase assesses the economic sustainability of housing access by calculating a Debt-to-Income (DTI) ratio for each income bracket within the subzones, comparing median housing values against available income levels. This approach enables an examination of the financial feasibility of homeownership across different population segments.
In this analysis, the DTI was computed under standardized assumptions to ensure compatibility across all subzones. Specifically, the following factors were taken into account:
- A standard residential unit size of 80 square metres;
- The average property value per square metre (EUR) for each OMI subzone (as identified in Phase 1);
- A mortgage covering 80% of the property’s total value [41];
- A fixed annual interest rate of 4% for a 25-year loan term.
Monthly mortgage payments were estimated using standard amortization formulas and compared to the average net monthly income within each income bracket. A threshold of 30% was established as the benchmark for housing affordability, aligning with widely accepted standards in housing and financial literature.
Based on the calculated DTI values, subzones were classified as follows:
- Affordable, if DTI ≤ 30%;
- Not affordable, if DTI > 30%.
This classification allowed for the creation of thematic maps using GIS software version 3.38.2, which visually represent housing accessibility throughout the metropolitan area. These maps highlight affordability for low- and middle-income groups, offering valuable insights for urban planning and housing policy development.
Furthermore, this methodology has supported the generation of thematic maps that depict housing accessibility across the region, particularly focusing on affordability for low- and middle-income households.
3. Case Study and Results
3.1. Case Study: The Metropolitan Area of Florence
The methodology delineated in this study was implemented in the Florence Metropolitan Area, renowned for its significant disparities in housing costs and income distribution across its municipalities. This area encompasses 41 municipalities with a cumulative population exceeding 1 million residents [42]. The city of Florence, functioning as the metropolitan core, attracts a substantial portion of economic activities and tourism, exerting considerable pressure on the real estate market. This phenomenon is particularly pronounced in the historical center, where the proliferation of tourist rentals has curtailed the housing options available to residents. While the municipalities located on the periphery generally exhibit lower housing costs, they frequently confront challenges such as reduced average incomes, diminished housing density, and restricted access to public services and infrastructure. This internal diversity renders the Florence area a particularly salient case study for evaluating the efficacy of a territorial approach to analyzing housing affordability.
This context was selected due to the availability of comprehensive and recent data about both income [43] and real estate [40] These data facilitate meticulous analysis at both the municipal and sub-municipal levels. The aim is to investigate how the relationship between income and property value varies spatially and how this relationship can inform the development of more equitable and targeted housing policies.
3.2. Analysis of the Uniform Micro-Areas of the Real Estate Market
A preliminary analysis of values in the central area of Florence (OMI zone B5—Historic Center) reveals a significant difference between the average OMI values and the declared property values within smaller territorial limits (like 200 m). According to the OMI database, market values for standard-conditioned residential properties range from EUR 3600 to EUR 4900 per square metre. In contrast, declared transaction values exhibit a broader range, from EUR 3500/m2 to EUR 7600/m2 across various zones. Consequently, the historic center of Florence, as defined by the OMI database, which includes Piazza della Signoria, the Duomo, Pitti, and San Niccolò within a single perimeter, was further divided into four subzones: B5.2 Signoria, B5.1 Duomo, B5.4 Pitti, and B5.3 San Niccolò.
Through this process, the territory is divided into OMI subzones. An example is provided below for the historic center of Florence, where the fragmentation is evident (Figure 1).
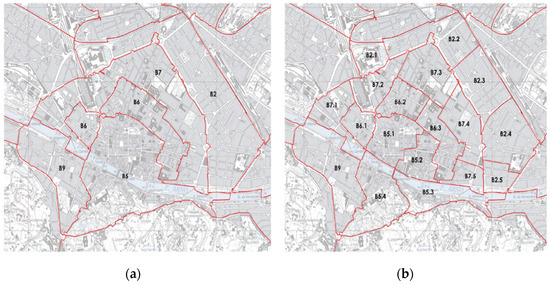
Figure 1.
(a) Territorial subdivision of Florence’s historic center according to OMI; (b) further division of OMI zones following a comprehensive analysis of real estate values. Following the previously mentioned methodology, a mapping of real estate values is established for each municipality in the Province of Florence. The colour scheme clearly and instantly highlights trends in the real estate market: darker regions indicate higher property values, whereas lighter green areas represent lower values. Below is the map that shows property values based on the gathered data (Figure 2).
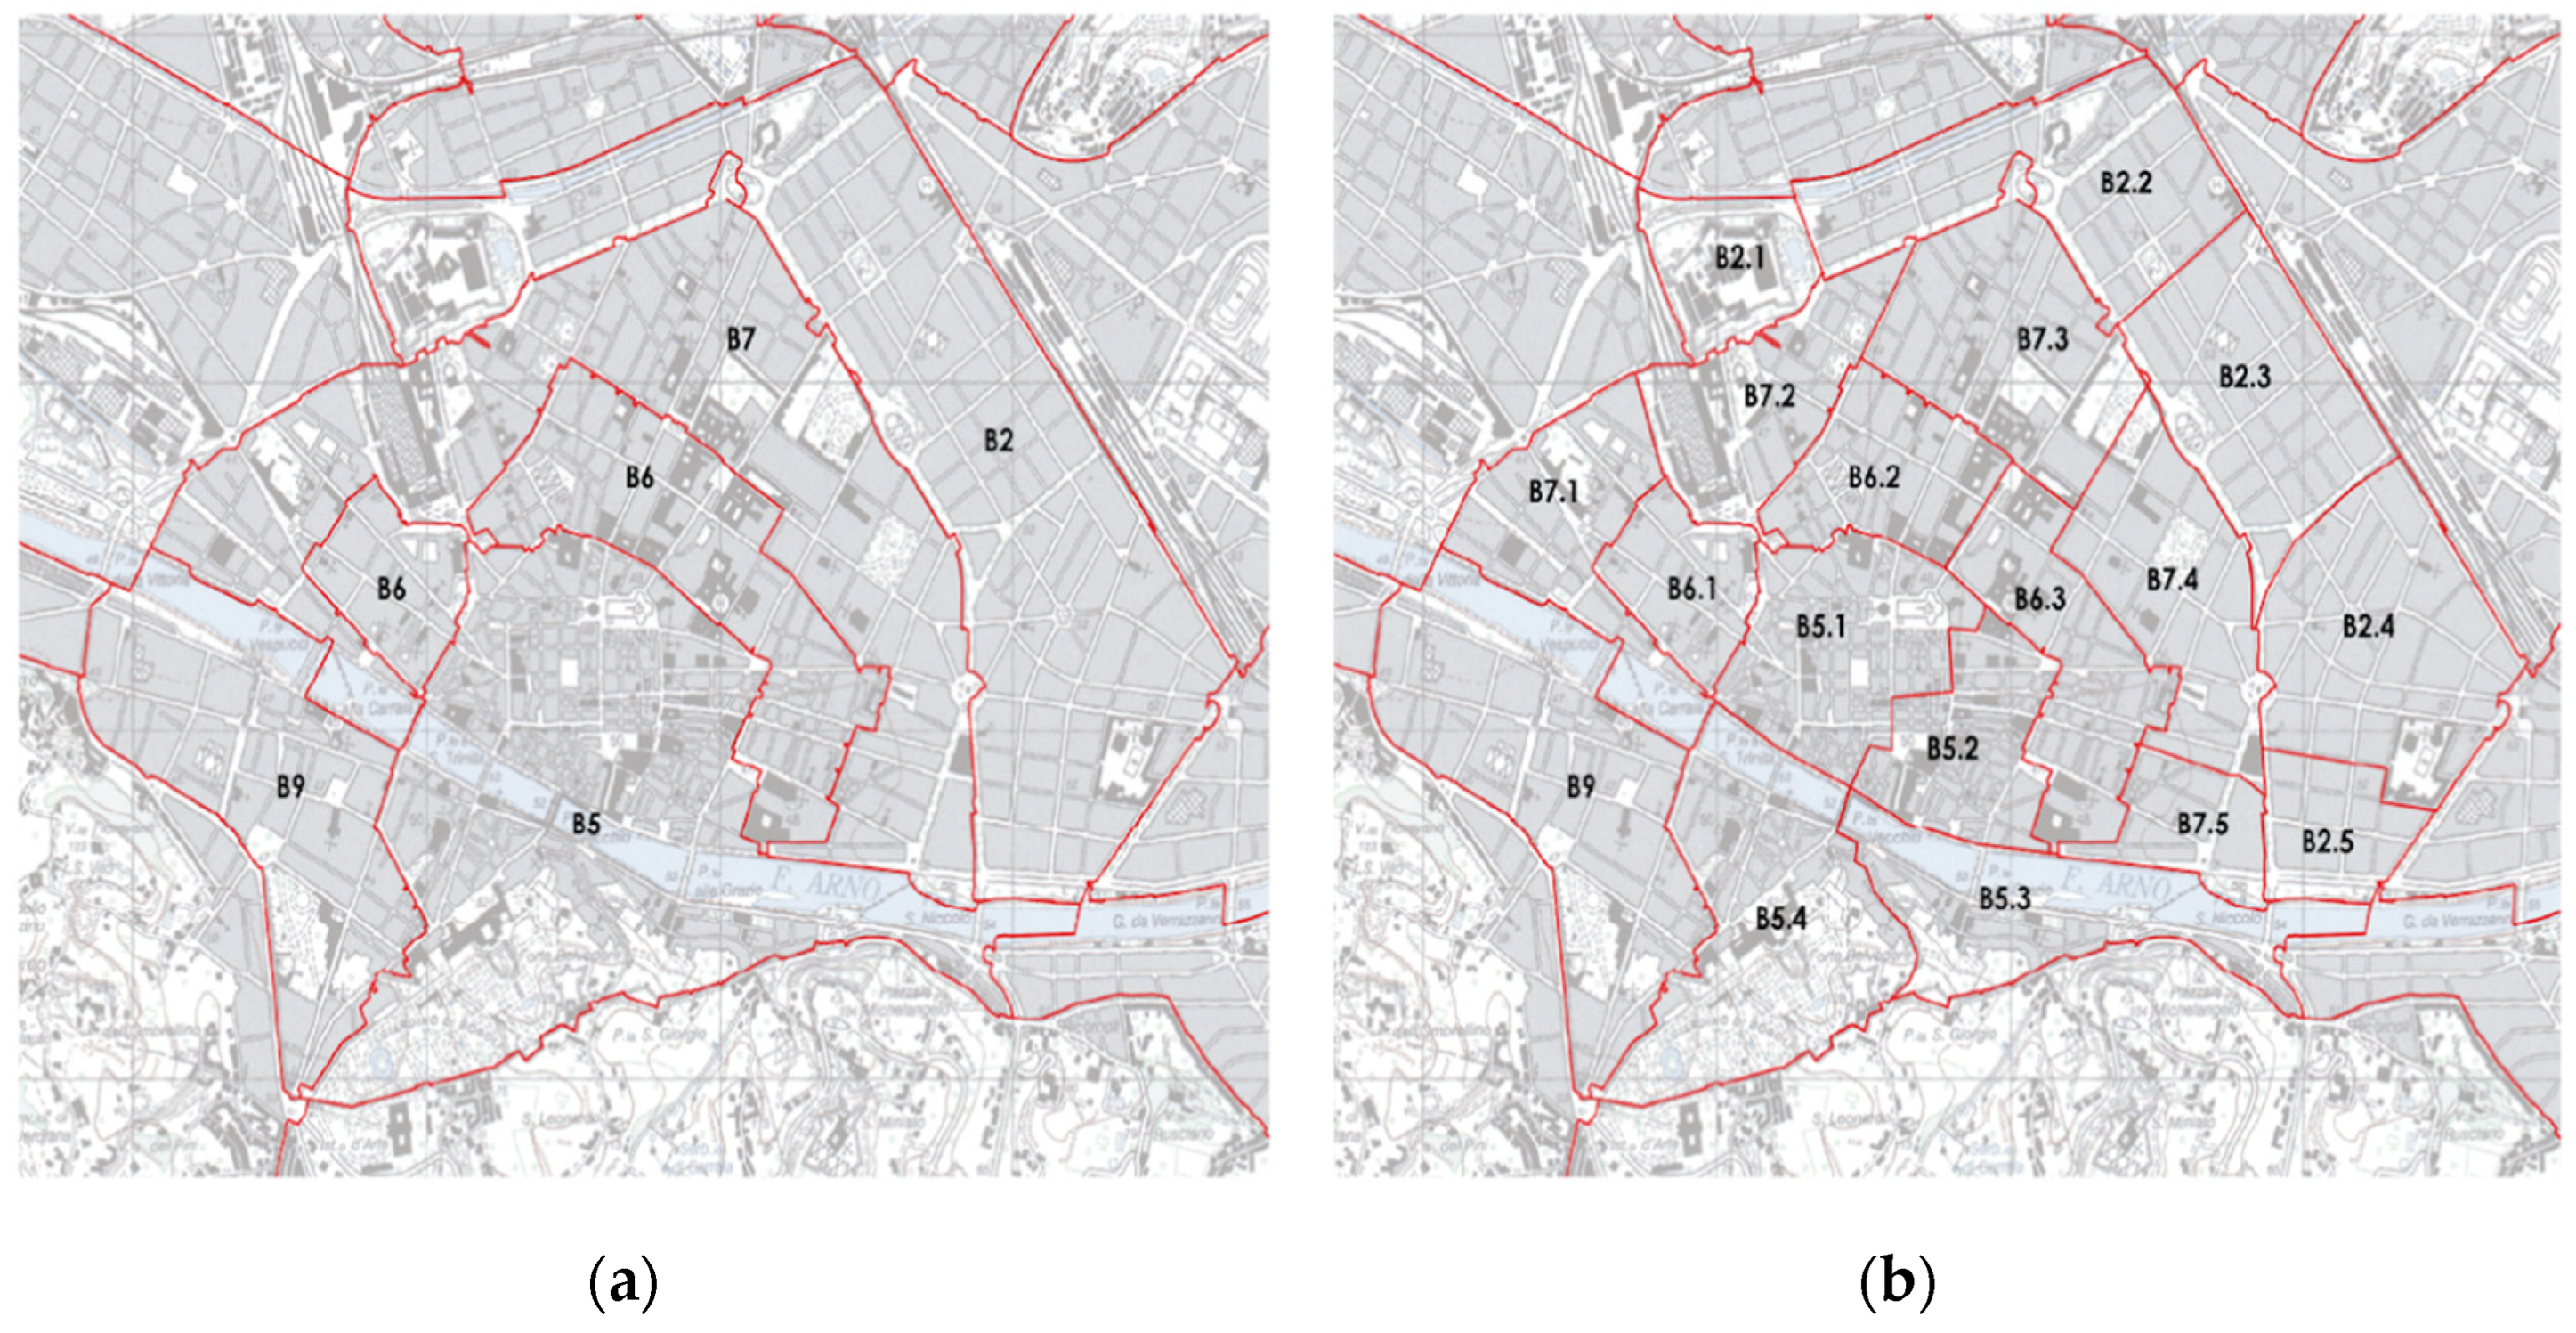
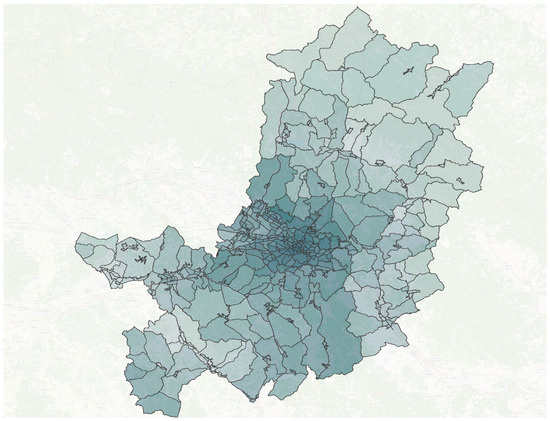
Figure 2.
Mapping of real estate values in the Province of Florence, ranging from dark green (high market value) to light green (low market value).
Figure 2.
Mapping of real estate values in the Province of Florence, ranging from dark green (high market value) to light green (low market value).

The areas with the highest market values are concentrated within the urban belt of Florence and its immediate surroundings. As we move further from the urban centre, values decrease, especially to the northeast and northwest, toward the Mugello and Upper Valdarno regions, as well as to the south and southwest, in areas farther from the Florence metropolitan area, and in some western regions toward Valdelsa.
3.3. Income Analysis
As previously outlined in Section 2.3, the second phase involves analyzing income distribution among the resident population. The data were obtained from the official source, MEF (Ministry of Economy and Finance), concerning the most recent available period (year 2022) [43].
The table below (Table 1) illustrates the distribution of citizens across various income brackets within the municipalities of the province of Florence.

Table 1.
Income in the Province of Florence. Source: Ministry of Economy and Finance (MEF).
For each income bracket, we identify the number of taxpayers. This report reveals a notable income disparity favoring the low- to middle-income brackets, particularly in the outer and rural regions of Florence Province. The municipalities of Florence, Sesto Fiorentino, Scandicci, and Bagno a Ripoli exhibit higher income levels, boasting middle-high annual averages exceeding EUR 26,000. However, within the Florence area, significant income disparities persist. On one side are individuals earning very high incomes—over EUR 55,000 annually (26,962 taxpayers); on the other, some earn extremely low incomes, even below EUR 10,000 per year, with some being long-term residents or living in public housing. This indicates a polarized income distribution, signifying the presence of both high-spending households and economically vulnerable individuals. By calculating the average percentages within each category, we determine that the income distribution in Florence Province is as follows:
- EUR 0 to EUR 10,000 annually—22%;
- EUR 10,001 to EUR 15,000 annually—12%;
- EUR 15,001 to EUR 26,000 annually—35%;
- EUR 26,001 to EUR 55,000 annually—26%;
- EUR 55,001 to EUR 75,000 annually—2%;
- EUR 75,001 to EUR 120,000 annually—2%;
- Over EUR 120,000 annually—1%.
As a result, the population of the Province of Florence primarily falls within the lower-middle income range. About 69% of residents earn less than EUR 26,000 each year, indicating that the area experiences challenging economic conditions.
3.4. Debt-to-Income Ratio: A Measure of Affordability
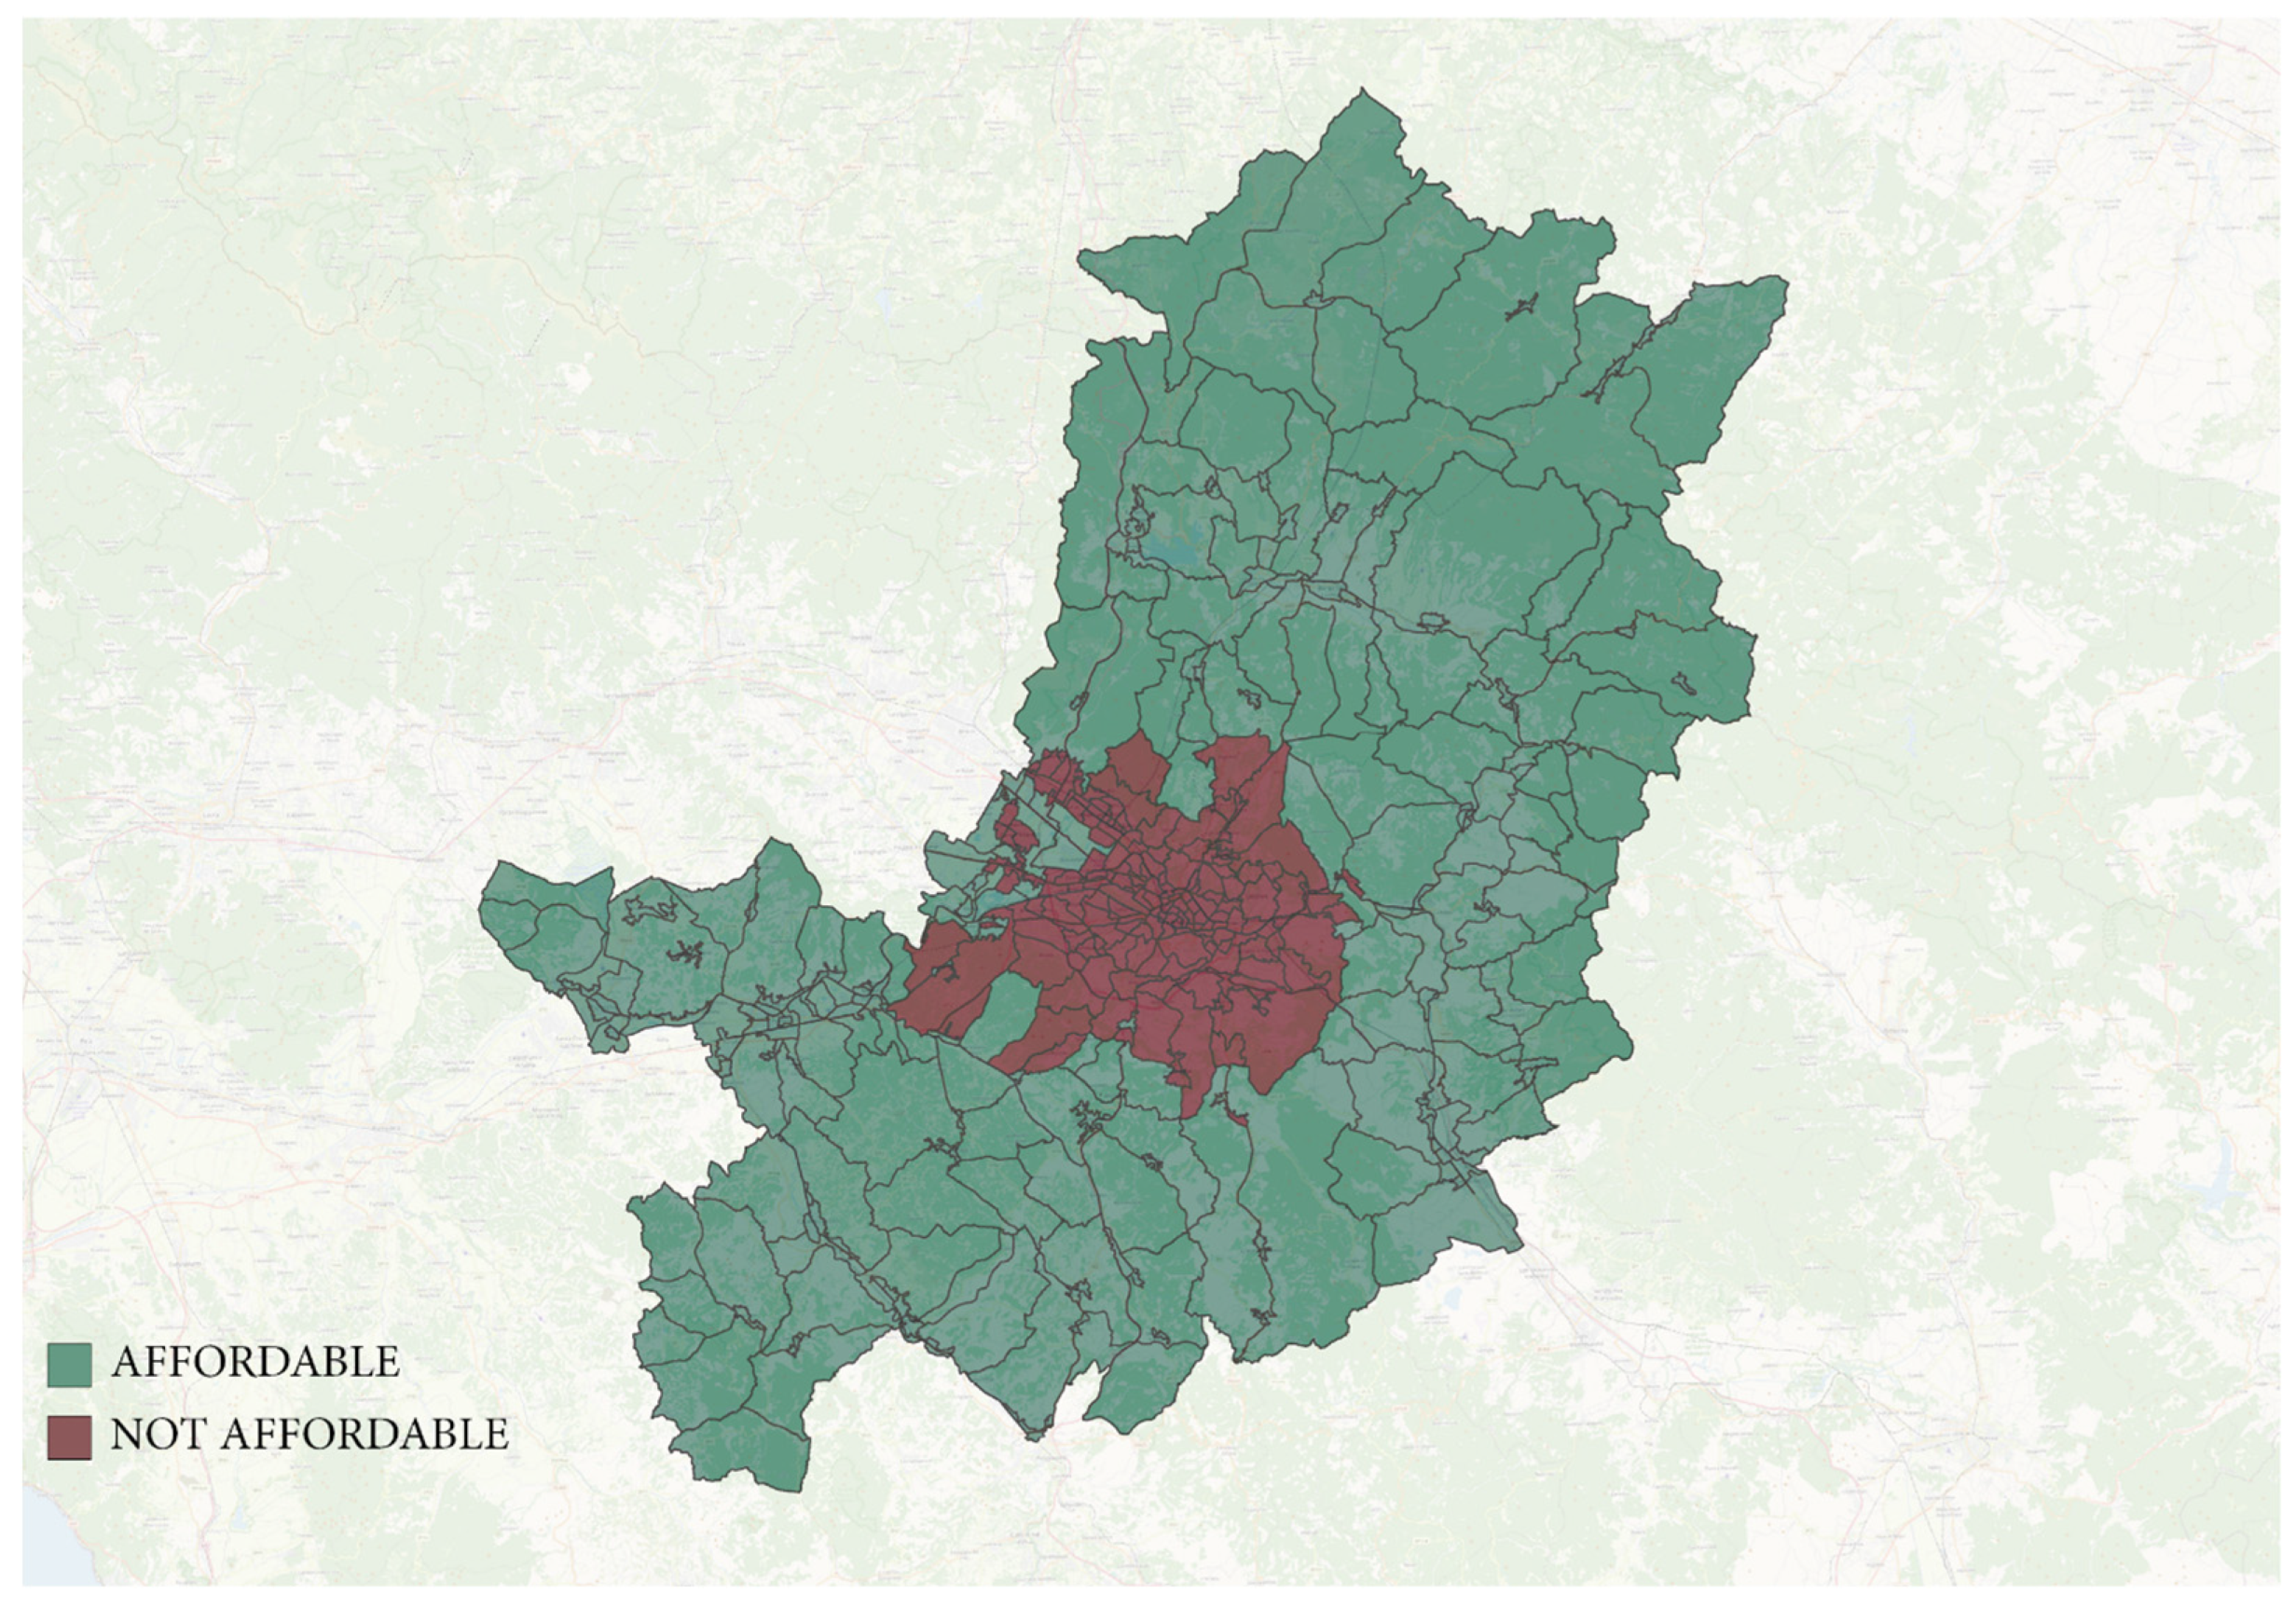
This section outlines the findings of the affordability assessment conducted using the Debt-to-Income (DTI) ratio, as discussed in the methodology (Section 2.3). The analysis contrasts housing expenses—based on average property values in OMI subzones—with the average incomes of each bracket to determine the financial viability of acquiring a standard housing unit in the Florence metropolitan area. Utilizing the 30% DTI benchmark, the study discerns which income groups can afford housing under sustainable financial circumstances in each subzone. The results reveal significant spatial and social inequalities: while certain subzones are fairly affordable for middle-income households, others—especially in central urban regions—remain beyond the reach of even higher-income families.
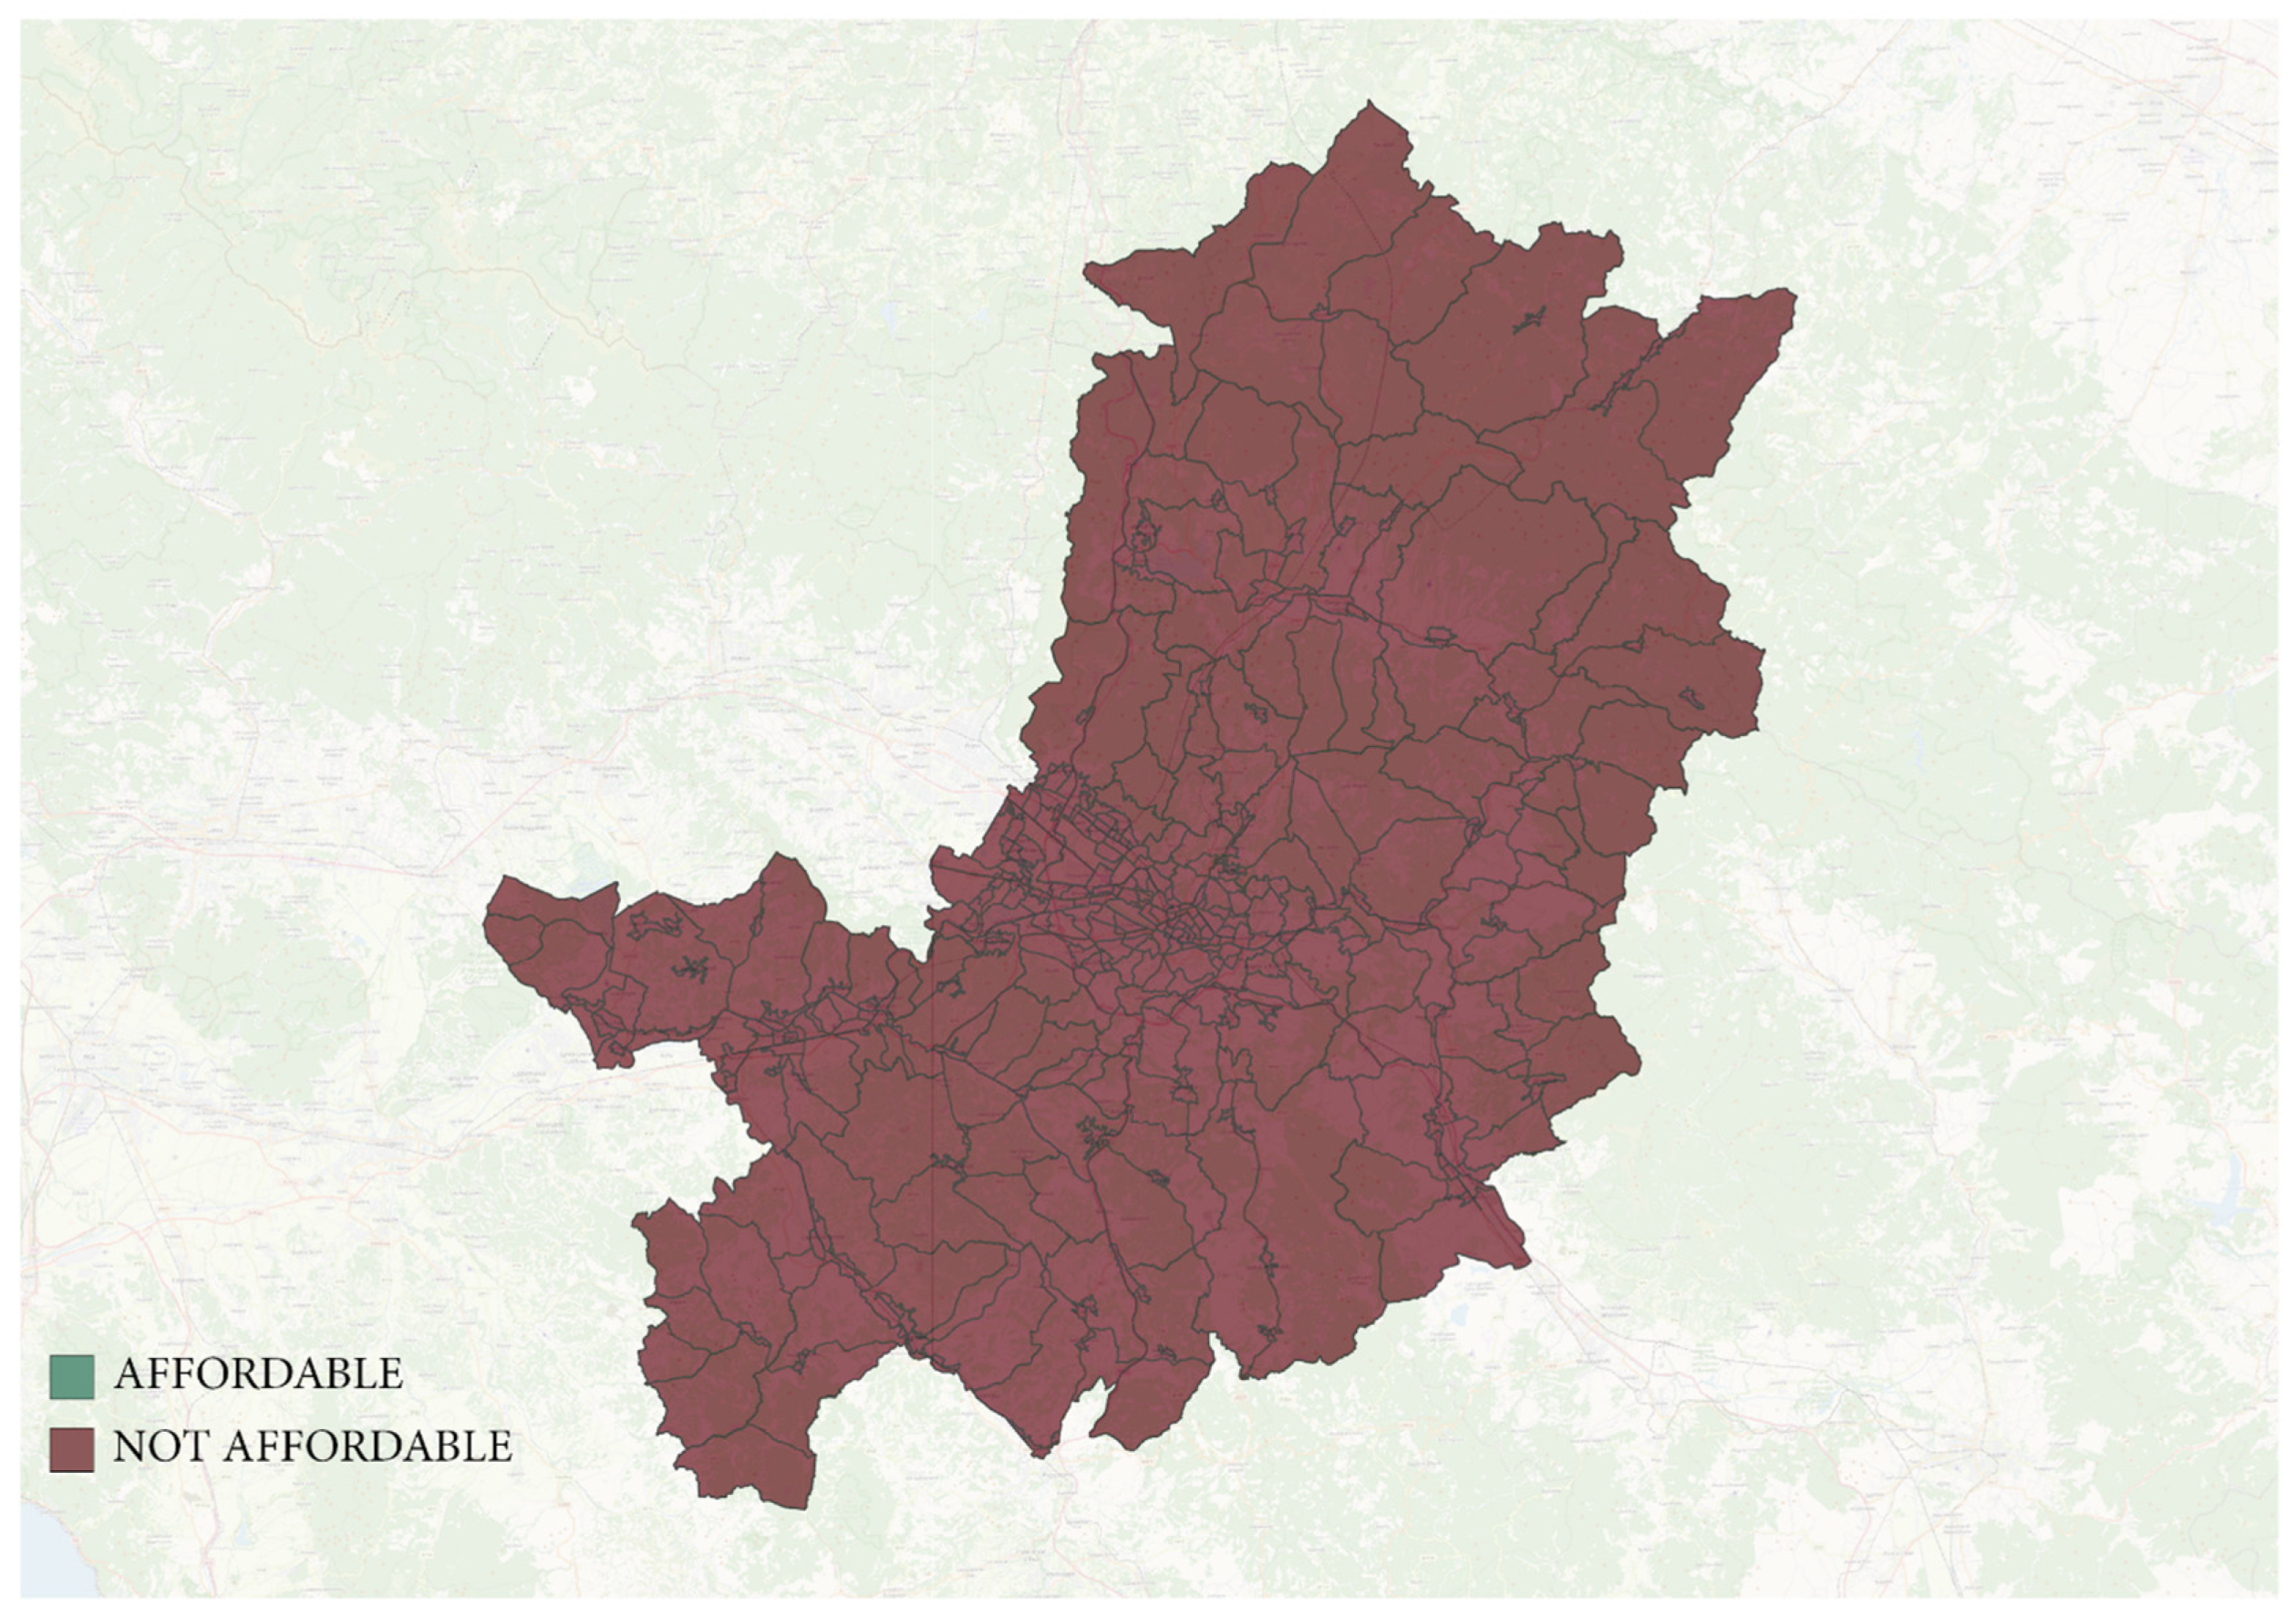
The analysis indicates that affordability challenges are most significant for lower-income groups (brackets 1–3), particularly in high-value areas such as the historic center of Florence and nearby districts with robust tourism and rental demand. In contrast, more remote or rural municipalities tend to have better affordability, albeit often accompanied by limited access to services and job opportunities. These results are illustrated through thematic maps (Figure 3, Figure 4, Figure 5, Figure 6 and Figure 7), which categorize zones as either affordable (DTI ≤ 30%) or unaffordable (DTI > 30%) for every income group. The cartographic depiction distinctly outlines regions experiencing severe housing stress, offering a valuable resource for policymakers aiming to prioritize housing, transportation, and social service interventions.

Figure 3.
Accessibility for the EUR 0 to EUR 10,000 per year bracket.
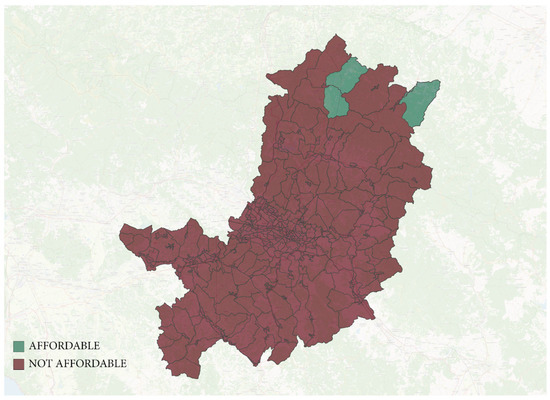
Figure 4.
Accessibility for the EUR 10,001 to EUR 15,000 per year bracket.
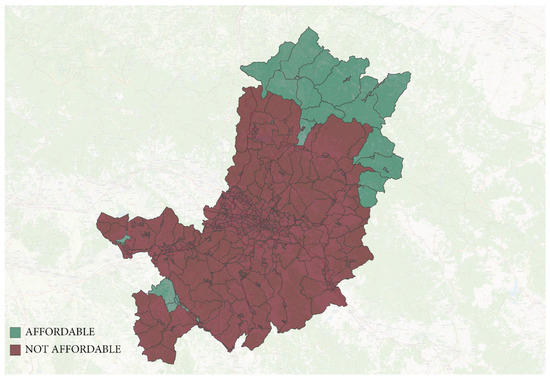
Figure 5.
Accessibility for the EUR 15,001 to EUR 26,000 per year bracket.

Figure 6.
Accessibility for the EUR 26,001 to EUR 55,000 per year bracket.

Figure 7.
Accessibility for the EUR 55,001 to EUR 75,000 per year bracket.
The maps illustrate the near-total inaccessibility of the urban centre for low to middle-income individuals. For those in the low-income bracket, with yearly earnings below EUR 15,000, the housing market is completely out of reach throughout the province. As income rises—specifically in the EUR 15,001 to EUR 26,000 range—rural and peripheral locations in the province’s northeast and southwest (including Mugello, Valdarno, and portions of Chianti) become more reachable. However, urban and semi-urban areas still largely remain unaffordable. For middle-income earners, those making between EUR 26,000 and EUR 55,000 each year, much of the province opens; yet, the real estate market in Florence’s urban centre stays unattainable.
4. Discussion
- The findings from the experimental phase, which encompassed the seven income brackets discussed in Section 3.2, underscore a significant lack of affordability in Florence’s urban centre. Specifically:
- The lowest income groups (EUR 0 to EUR 15,000/year) are completely excluded from homeownership throughout the entire area;
- The middle-income group (EUR 26,001 to EUR 55,000/year) demonstrates wider affordability but still encounters limited access to Florence’s urban centre.
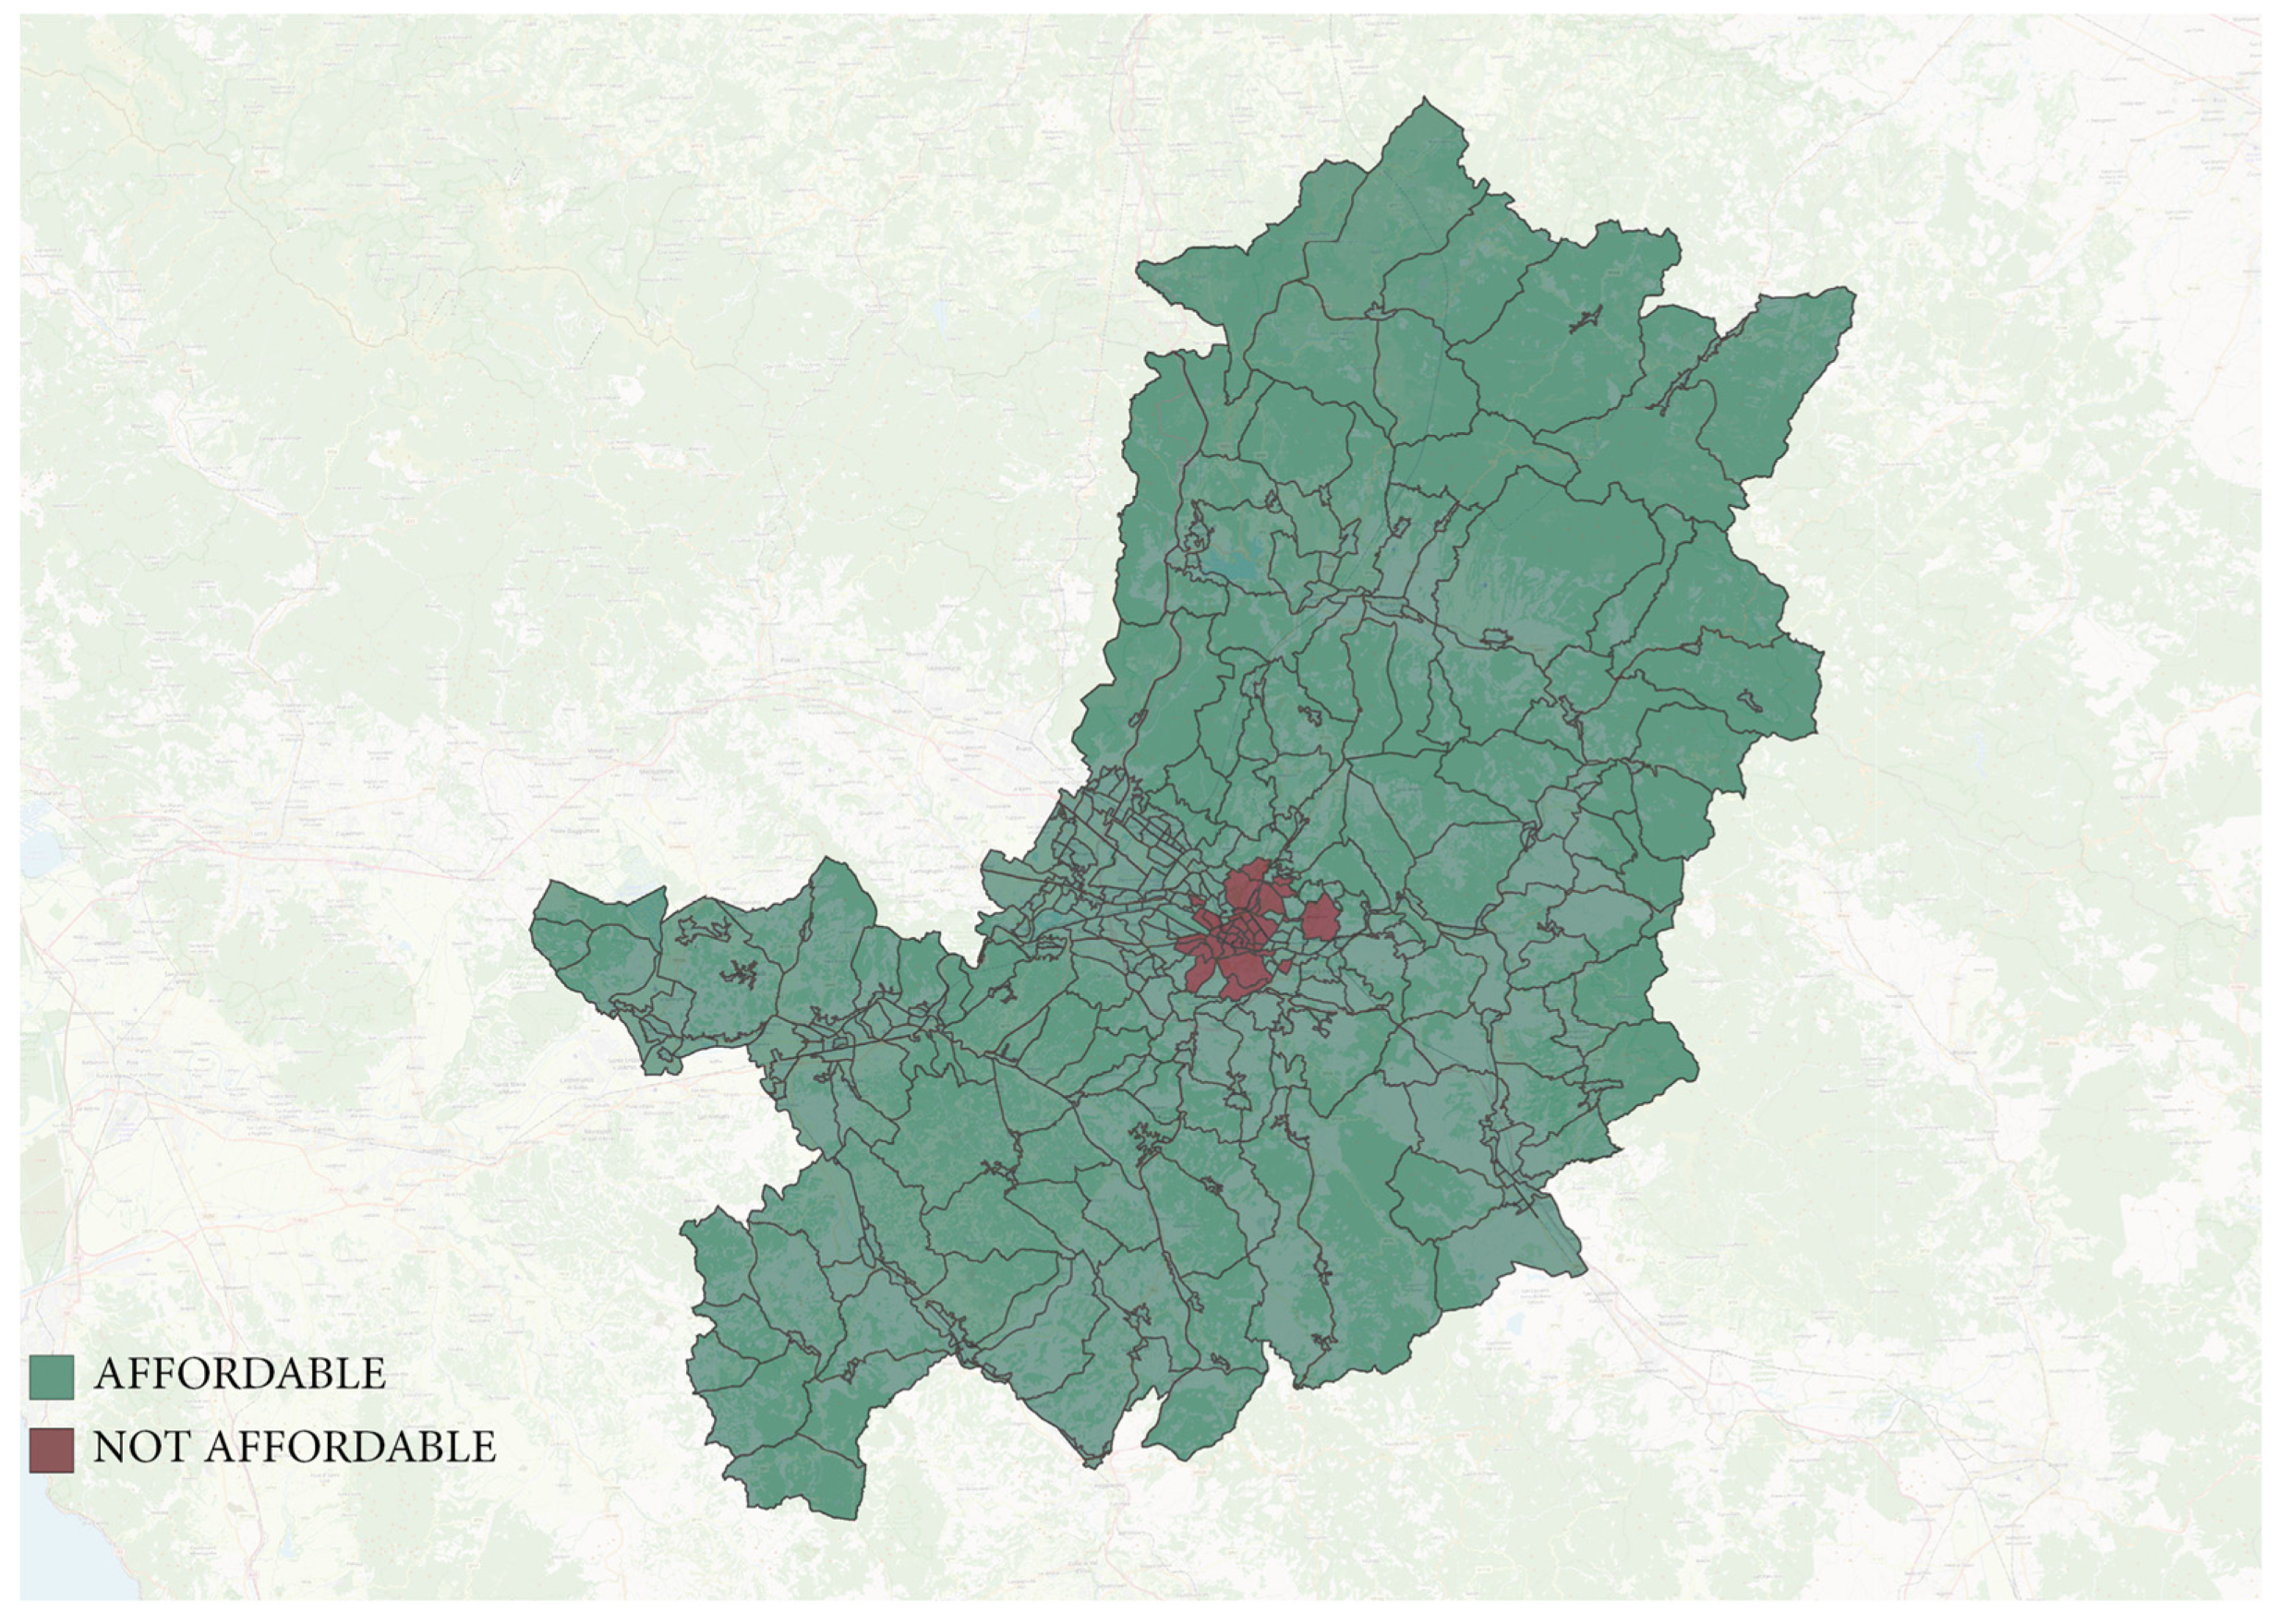
Therefore, regarding residential mobility, the study suggests that the majority of residents—those with low to middle incomes (69%)—are effectively excluded from the housing market in the provincial capital based on the results. The Debt-To-Income Ratio consistently exceeds 30% in these areas, making housing economically unsustainable (Figure 8).
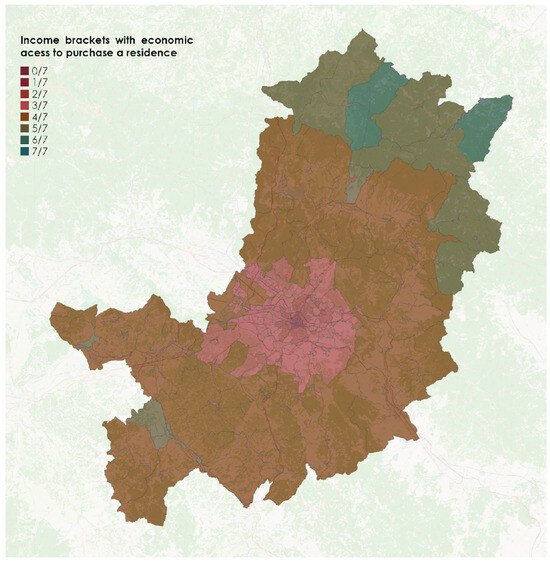
Figure 8.
Summary of affordable/not-affordable areas.
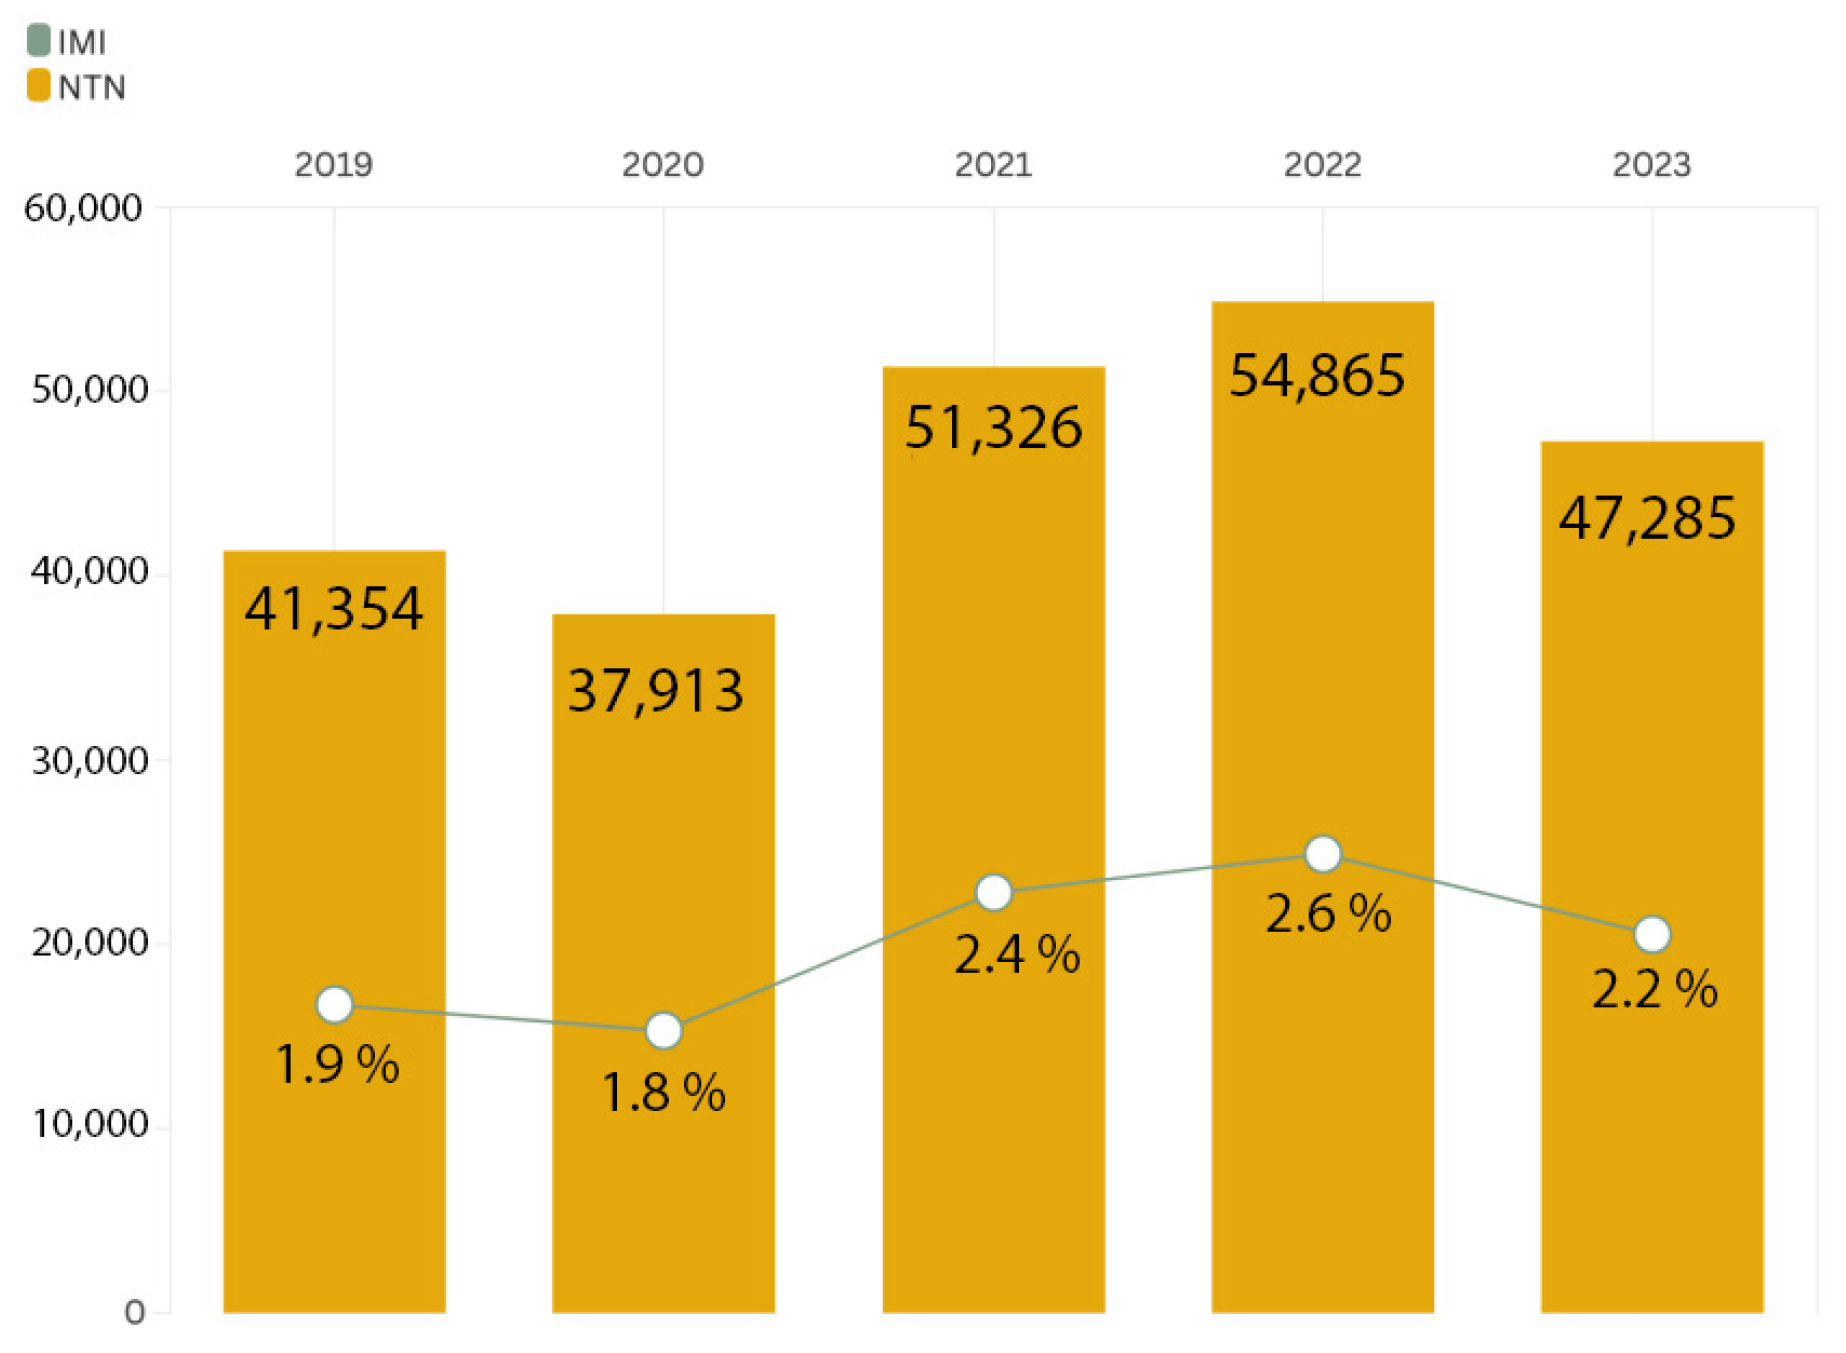
The findings align with the general trend in the Tuscany property sales market, as indicated by the Number of Normalized Transactions (NTN) and the Real Estate Market Intensity Index (IMI). The 2024 report from the Region of Tuscany reveals a total decline of 7571 transactions between 2022 and 2023, alongside a 0.4% reduction in the IMI (Figure 9) [44]. These statistics highlight a deceleration in the real estate sales market, which corresponds with this study’s observations of waning affordability for low- to middle-income families.
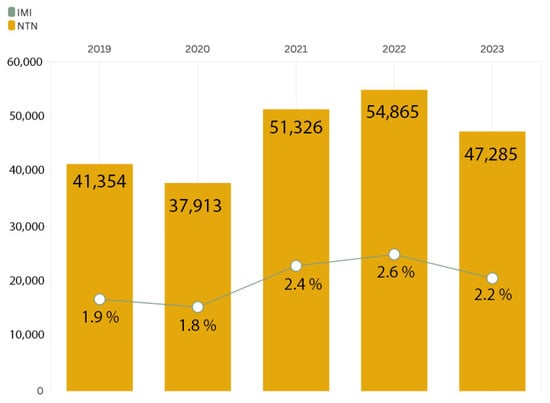
Figure 9.
Net real estate transactions and market intensity in Tuscany from 2019 to 2013 [44].
5. Conclusions
The Debt-to-Income Ratio (DTI) tool facilitates an analytical assessment of residential affordability, contributing to identifying areas exhibiting significant constraints in purchasing power. The findings substantiate the near-complete inaccessibility of the homeownership market for low- to middle-income groups, who constitute 69% of the population in the Province of Florence. The correlation with prevailing trends in the residential real estate market further reinforces the observation of a deceleration and potential uncertainty in regions where housing supply is less inclusive.
Housing costs that are disproportionately high relative to income can significantly diminish household living standards. In contrast, more affordable housing costs can alleviate the financial burden that low- to middle-income families face. Consequently, the quality of housing is also influenced by its price—or, as commonly referred to in international literature, its affordability [13]. In this context, affordability emerges as an indicator of sustainability and a crucial instrument for fostering equitable and inclusive urban policies. By overlaying housing market accessibility, as investigated in this study, with other objective and subjective dimensions of well-being, one can obtain a practical and immediate representation of which income groups have access to quality living conditions. This methodology may provide a beneficial framework for identifying the most attractive residential environments and, consequently, for projecting trends related to residential mobility.
This research’s spatialized affordability evaluation provides insights for local governments and policymakers. It serves as a decision-making tool to guide public investments in social housing, prioritize urban regeneration, and design inclusive housing policies [45,46,47]. Additionally, the cartographic output highlights key exclusion zones, helping to monitor the social impact of real estate dynamics and informing fiscal incentives or regulatory changes.
Future research developments may involve broadening the model to include other metropolitan areas for comparative purposes, adding rental housing data to represent a broader range of residential access, and incorporating further indicators like service access, environmental quality, and public transport.
Author Contributions
Conceptualization, F.B., O.C., F.F., M.P. and D.M.; methodology, F.B., O.C., F.F., M.P. and D.M.; software, F.B., O.C., F.F., M.P. and D.M.; validation, F.B., O.C., F.F., M.P. and D.M.; formal analysis, F.B., O.C., F.F., M.P. and D.M.; investigation, F.B., O.C., F.F., M.P. and D.M.; resources, F.B., O.C., F.F., M.P. and D.M.; data curation, F.B., O.C., F.F., M.P. and D.M.; writing—original draft preparation, F.B., O.C., F.F., M.P. and D.M.; writing—review and editing, F.B., O.C., F.F., M.P. and D.M.; visualization, F.B., O.C., F.F., M.P. and D.M.; supervision, F.B., O.C. and F.F.; project administration, F.B., O.C. and F.F.; funding acquisition, F.B., O.C. and F.F. All authors have read and agreed to the published version of the manuscript.
Funding
Research projects funded by the European Union under the Next Generation EU. Financed by Ministry of University and Research (MUR) with D.D. no. 1378 of 1 September 2023. Project of Significant National Interest Call for Proposals no. 1409 of 14-9-2022 (PRIN 2022 PNRR).
Institutional Review Board Statement
Not applicable.
Informed Consent Statement
Not applicable.
Data Availability Statement
Data are available upon request from the authors.
Conflicts of Interest
The authors declare no conflicts of interest.
References
- Qin, X.; Zhen, F.; Zhu, S.-J. Centralisation or decentralisation? Impacts of information channels on residential mobility in the information era. Habitat. Int. 2016, 53, 360–368. [Google Scholar] [CrossRef]
- Ponti, G. L’innovazione digitale, le tecnologie ICT e l’intelligenza artificiale. Focus Enea Energ. Ambiente Innov. 2023, 2, 118–120. [Google Scholar]
- OECD. How’s Life in the Digital Age? Opportunities and Risks of the Digital Transformation for People’s Well-Being; OECD Publishing: Paris, France, 2019; Available online: https://www.oecd.org/en/publications/how-s-life-in-the-digital-age_9789264311800-en.html (accessed on 15 April 2025).
- Luca, D.; Özgüzel, C.; Wei, Z. The new geography of remote jobs in Europe. Reg. Stud. 2025, 59, 2352526. [Google Scholar] [CrossRef]
- Wong, P.H.; Kourtit, K.; Nijkamp, P. The teleworking paradox: The geography of residential mobility of workers in pandemic times. Ann. Reg. Sci. 2025, 74, 39. [Google Scholar] [CrossRef]
- Gabetti Property Solutions. Smart Working e Nuove Esigenze Abitative. 2021.Gabetti Property Solutions—Ufficio Studi. (2021, Primo Trimestre). Smart Working e Nuove Esigenze Abitative [Report Q1 2021]. Gabetti Property Solutions. Available online: https://www.gabettigroup.com/report/smart-working-e-nuove-esigenze-abitative/ (accessed on 26 March 2025).
- Istituto Nazionale di Statistica. (2024, 10 Gennaio). Occupazione, Retribuzioni e Costo del Lavoro Dipendenti Privati. Anno 2021. Available online: https://www.istat.it/comunicato-stampa/occupazione-retribuzioni-e-costo-del-lavoro-dipendenti-privati-anno-2021/ (accessed on 15 April 2025).
- Jansen, T.; Ascani, A.; Faggian, A.; Palma, A. Remote work and location preferences: A study of post-pandemic trends in Italy. Ann. Reg. Sci. 2024, 73, 897–944. [Google Scholar] [CrossRef]
- World Bank Group. The Changing Nature of Work. In The Human Capital Project; World Bank: Washington, DC, USA, 2019. [Google Scholar]
- International Labour Organization. The Centenary Declaration for the Future of Work. 2019. Available online: https://www.ilo.org/resource/ilc/108/ilo-centenary-declaration-future-work (accessed on 15 April 2025).
- Āzena, L.; Keiss, S. Specifics of territorial marketing strategy planning. Eur. Integr. Stud. 2009, 162–168. [Google Scholar]
- United Nations. Trasformare il Nostro Mondo: L’Agenda 2030 Per lo Sviluppo Sostenibile; UN: New York, NY, USA, 2015; Available online: https://unric.org/ (accessed on 15 April 2025).
- Palvarini, P. Qualità abitativa e vivibilità urbana. Quad. Sociol. 2010, 52, 31–51. [Google Scholar] [CrossRef]
- Poggio, T. La casa come area di welfare. Polis 2005, 19, 279–305. [Google Scholar]
- Kearns, A.; Parkinson, M. The significance of neighbourhood. Urban Stud. 2001, 38, 2103–2110. [Google Scholar] [CrossRef]
- Okulicz-Kozaryn, A.; Valente, R.R. Livability and subjective Well-Being across European cities. Appl. Res. Qual. Life 2018, 14, 197–220. [Google Scholar] [CrossRef]
- Fattinnanzi, E.; Acampa, G.; Forte, F.; Rocca, F. The overall quality assessment in an architecture project. J. SIEV—Valori Valutazioni 2018, 21, 3–14. [Google Scholar]
- Eurostat. Housing in Europe, Interactive Publication. 2023. Available online: https://ec.europa.eu/eurostat/ (accessed on 15 April 2025).
- European Commission. Housing Affordability and Sustainability in the EU: Analytical Report; European Construction Sector Observatory: Brussels, Belgium, 2019. [Google Scholar]
- Forte, F. Architectural quality and evaluation: A reading in the European framework. J. SIEV—Valori Valutazioni 2019, 23, 37–45. [Google Scholar]
- Ufficio Studi Avalon. Housing Affordability: Analisi Storica e Trend Futuro Nel Contesto Italiano; Avalon Consulting: Milan, Italy, 2023. [Google Scholar]
- Hancock, K.E. Can Pay? Won’t Pay? or Economic Principles of Affordability. Urban Stud. 1993, 30, 127–145. [Google Scholar] [CrossRef]
- Bogdon, A.S.; Can, A. Indicators of local housing affordability: Comparative and spatial approaches. Real. Estate Econ. 1997, 25, 43–80. [Google Scholar] [CrossRef]
- ISTAT. Migrazioni Interne e Internazionali Della Popolazione Residente Anni 2022–2023. 2024. Available online: https://www.istat.it/it/files/2024/05/Migrazioni-interne-e-internazionali-della-popolazione-residente.pdf. (accessed on 15 April 2025).
- European Construction Sector Observatory (ECSO). Accessibilità Finanziaria e Sostenibilità Degli Alloggi nell’UE: Rapporto Analitico; Commissione Europea: Bruxelles, Belgium.
- Eurostat. House Prices and Rents Rose Between Q4 2023 and Q1 2024; Eurostat News. Available online: https://ec.europa.eu/eurostat/web/products-eurostat-news/w/ddn-20240705-1 (accessed on 5 July 2024).
- OECD. Building for a Better Tomorrow: Policies to Make Housing More Affordable. In Employment, Labour and Social Affairs Policy Briefs; OECD Publishing: Paris, France, 2021. [Google Scholar]
- Gabor, D.; Kohl, S. The Financialisation of Housing in Europe: ‘My Home is an Asset Class’; The Greens/EFA: Brussels, Belgium, 2022. [Google Scholar]
- Stone, M.E. What is housing affordability? The case for the residual income approach. Hous. Policy Debate 2006, 17, 151–184. [Google Scholar] [CrossRef]
- Pittini, A. Housing Affordability in the EU: Current Situation and Recent Trends; CECODHAS European Social Housing Observatory: Brussels, Belgium, 2012. [Google Scholar]
- ISTAT. Goal 8—Lavoro Dignitoso e Crescita Economica; Istituto Nazionale di Statistica: Rome, Italy, 2025; Available online: https://www.istat.it/wp-content/uploads/2025/04/Goal8.pdf (accessed on 15 April 2025).
- CENSIS. 58° Rapporto Sulla Situazione Sociale del PAESE/2024; Centro Studi Investimenti Sociali: Rome, Italy, 2024; Available online: https://www.censis.it/sites/default/files/downloads/Sintesi%20Fenomenologico%202024.pdf (accessed on 15 April 2025).
- Federproprietà–Censis. Agenda 2024–2030: La Transizione Abitativa: La Casa Possibile. Terzo Rapporto, p. 53. 2024. Available online: https://www.censis.it/sites/default/files/downloads/3%C2%B0%20RAPPORTO%20FEDERPROPRIET%C3%80-CENSIS.pdf (accessed on 15 April 2025).
- Housing Europe. The State of Housing in Europe 2023; Housing Europe Observatory: Brussels, Belgium, 2023; Available online: https://www.housingeurope.eu/the-state-of-the-housing-in-europe-2023/ (accessed on 15 April 2025).
- Consumer Financial Protection Bureau. What Is a Debt-to-Income Ratio? 2022. Available online: https://www.consumerfinance.gov/ask-cfpb/what-is-a-debt-to-income-ratio-en-1791/ (accessed on 15 April 2025).
- Bankrate. What is a Debt-to-Income Ratio for a Mortgage? 2025. Available online: https://www.bankrate.com/mortgages/why-debt-to-income-matters-in-mortgages/ (accessed on 15 April 2025).
- OECD. Brick by Brick: Building Better Housing Policies; OECD Publishing: Paris, France, 2021. [Google Scholar]
- Obeid, R. The Role of the Loan-to-Value and the Debt-to-Income Ratios in Reducing the Systemic Risk Arising from Household Credit and Asset Bubbles; Arab Monetary Fund: Abu Dhabi, United Arab Emirates, 2022. [Google Scholar]
- Agenzia delle Entrate. Quotazioni Immobiliari—Banche Dati Per Gli Intermediari; Osservatorio del Mercato Immobiliare (OMI): Rome, Italy, 2025. Available online: https://www.agenziaentrate.gov.it/portale/schede/fabbricatiterreni/omi/banche-dati/quotazioni-immobiliari-intermediari (accessed on 15 April 2025).
- Agenzia delle Entrate. Consultazione dei Valori Immobiliari Dichiarati; Osservatorio del Mercato Immobiliare (OMI): Rome, Italy, 2025. Available online: https://www.agenziaentrate.gov.it/portale/schede/fabbricatiterreni/omi/consultazione-valori-immobiliari-dichiarati (accessed on 15 April 2025).
- Banca d’Italia. Il Mutuo per la Casa in Parole Semplici; Banca d’Italia: Rome, Italy, 2012; Available online: https://www.bancaditalia.it/pubblicazioni/guide-bi/guida-mutuo/index.html (accessed on 15 April 2025).
- Città Metropolitana di Firenze. Il Nuovo Ente. Available online: https://www.cittametropolitana.fi.it/il-nuovo-ente/ (accessed on 15 April 2025).
- Ministero dell’Economia e delle Finanze (MEF). Dichiarazioni dei Redditi Delle Persone Fisiche Per Comune—Anno D’imposta 2022; Dipartimento delle Finanze: Rome, Italy, 2024. Available online: https://www1.finanze.gov.it/finanze/analisi_stat/public/index.php?opendata=yes (accessed on 15 April 2025).
- Regione, Toscana. Abitare in Toscana—Anno 2024. In Tredicesimo Rapporto Sulla Condizione Abitativa; Osservatorio Sociale Regionale: Firenze, Italy, 2024; Available online: https://www.regione.toscana.it/documents/10180/13844663/Abitare+in+Toscana_2024.pdf (accessed on 15 April 2025).
- Battisti, F.; Guarini, M.R.; Chiovitti, A. The assessment of real estate initiatives to be included in the socially-responsible funds. Sustainability 2017, 9, 973. [Google Scholar] [CrossRef]
- Battisti, F. SDGs and ESG Criteria in Housing: Defining Local Evaluation Criteria and Indicators for Verifying Project Sustainability Using Florence Metropolitan Area as a Case Study. Sustainability 2023, 15, 9372. [Google Scholar] [CrossRef]
- Battisti, F.; Campo, O. The Assessment of Density Bonus in Building Renovation Interventions. The Case of the City of Florence in Italy. Land 2021, 10, 1391. [Google Scholar] [CrossRef]


Disclaimer/Publisher’s Note: The statements, opinions and data contained in all publications are solely those of the individual author(s) and contributor(s) and not of MDPI and/or the editor(s). MDPI and/or the editor(s) disclaim responsibility for any injury to people or property resulting from any ideas, methods, instructions or products referred to in the content. |
© 2025 by the authors. Licensee MDPI, Basel, Switzerland. This article is an open access article distributed under the terms and conditions of the Creative Commons Attribution (CC BY) license (https://creativecommons.org/licenses/by/4.0/).