Abstract
The rapid urbanization of contemporary cities represents one of the most complex challenges of the 21st century, with profound implications for the environmental, social, and economic sustainability of territories. In this context, urban regeneration emerges as a strategic approach to territorial transformation. The complexity of urban dynamics requires the adoption of innovative paradigms and systemic approaches capable of guiding decision-making processes toward eco-sustainable and resilient solutions. This research develops advanced decision support tools for urban regeneration, using the city of Potenza (Italy) as a case study. The main objective is to identify key indicators to evaluate the effectiveness of urban regeneration interventions in advance (ex-ante). The methodology develops a composite economic-financial risk index capable of providing an accurate picture of existing conditions while adapting to the territorial specificities of the analyzed area. This index, which uses the Analytic Hierarchy Process (AHP) technique to integrate elementary economic-financial indicators in order to assess the sustainability level of urban redevelopment projects, is able to synthesize complex economic variables into a single parameter of immediate comprehension, strategically guiding investments toward a sustainable urban development model. The analysis of results highlights a peculiar territorial configuration: semi-central areas present the greatest criticalities, while there is a progressive decrease in risk both toward the central core and toward peripheral and extra-urban areas. The study represents a significant methodological contribution to future urban regeneration initiatives at the local level, promoting an integrated vision of sustainable urban development for the benefit of current and future generations.
1. Introduction
“We don’t inherit the earth from our ancestors, we borrow it from our children.”—Chief Seattle
This Native American aphorism resonates with extraordinary relevance today in the face of the inexorable advance of uncontrolled urbanization and the progressive depletion of soil. This precious and non-renewable resource is endangered by urban development that often lacks planning and long-term vision.
The transformation of natural lands into urbanized areas represents not only a loss of fertile soil for food production but also compromises the territory’s capacity to absorb rainwater, increasing hydrogeological risk and reducing green spaces essential for the population’s wellbeing [1]. This awareness should direct us toward more sustainable development models based on the regeneration of existing structures rather than indiscriminate expansion [2]. Only through an approach that respects the territory and its resources can we honor the “loan” we have received and guarantee future generations the possibility of enjoying a healthy and livable environment. The challenge is urgent and requires a paradigm shift in the approach to urban development, moving from a logic of consumption to one of conservation and enhancement of the existing building heritage. The phenomenon of uncontrolled urbanization, better known as urban sprawl—the disorderly urban diffusion or expansion in periurban areas characterized by low-density and extremely fragmented buildings—represents one of the most critical challenges of our time, with increasingly evident repercussions on environmental sustainability and quality of life in cities [3]. The so-called “land consumption”, or the transformation of natural or agricultural land into urbanized areas, proceeds at alarming rates, irreversibly altering ecosystem balances [4]. From the annual environmental survey conducted by ISPRA (Higher Institute for Environmental Protection and Research), it emerges that, for the year 2024 in Italy, 21,578 square kilometers are occupied by concrete, asphalt, and other artificial coverings, which is 7.16% of the national territory, a continuously growing trend [5]. In response to this critical issue, evidenced by the analyzed data, urban regeneration emerges as a key strategy for more sustainable development. This approach focuses on the recovery and redevelopment of existing building heritage, favoring the reuse of abandoned or degraded areas instead of consuming new land. Therefore, it is of primary importance that public administrations promote forward-looking urban policies, incentivizing the redevelopment of existing structures [6]. However, the intrinsic complexity of urban regeneration interventions, and more generally of territorial transformations, requires the adoption of appropriate methodologies capable of efficiently supporting the management of the entire process, guaranteeing the interests of both public administrations and private investors. Multiple critical issues can emerge from the difficulty in obtaining homogeneous data at different territorial scales to the need to contextualize interventions considering the peculiarities of the territory, to the inseparable interconnection between environmental and socio-economic aspects. Given this premise, in an era where uncontrolled urbanization and land consumption threaten the integrity of our planet, this research aims to provide a decision-support tool for the implementation of urban redevelopment projects with specific regard to economic aspects. Intended for public administrations and private investors, the model aims to evaluate the economic-financial risk index of urban regeneration interventions through a system of key economic, technical-urban, and socio-demographic indicators. Defined through the AHP technique, this index stems from the aggregation of multiple indicators, both qualitative and quantitative, carefully selected to comprehensively represent each category of real estate risk related to the territorial dimension considered. This approach allows for determining the convenience and feasibility of urban redevelopment projects in specific territorial contexts, thereby supporting the decision-making process of the stakeholders involved. This methodology finds application in the case study of the city of Potenza, an urban reality that, while maintaining a predominantly monocentric footprint, reveals a progressive tendency toward dispersion in its marginal areas. Data for 2024 highlight an emblematic situation: consumed land amounts to 22,627 hectares, representing 3.46% of the total administrative area, with a per capita impact of 645.27 square meters per inhabitant [7]. The work is articulated as follows: the second section deepens the concept of urban sustainability, outlining its historical evolution, as well as examining the notions of “soil” and “land use”. The multiple factors contributing to land consumption are also analyzed, along with analytical approaches aimed at countering this phenomenon. Finally, the scientific literature on sustainability indicators is analyzed. The third section outlines the proposed methodological framework, illustrating the process of constructing the composite indicator. The fourth section offers a critical reflection on the results achieved. The fifth and final section follows with the conclusions.
2. Literature Review
Sustainability is an inherently complex concept subject to different interpretations, which has undergone centuries of intellectual and cultural evolution. Its complexity emerges already at the linguistic level, where different translations and semantic nuances enrich, but at the same time complicate, the understanding of the term. In its traditional meaning, sustainability highlights the relationship between economic activities, environmental protection, and biodiversity conservation [8]. The origin of the word reveals an interesting cultural genealogy: from the Latin “sustento”, meaning “to sustain”, which suggests a concept of maintenance and support over time, highlighting the need to preserve resources to ensure their availability to future generations; to the English term “sustainable” emphasizing temporal continuity; to the French term emphasizing durability; to the term used in Latin America, “buen vivir” (The term “buen vivir” does not represent a linguistic variant of the word “sustainability,” but rather constitutes an autonomous concept that embodies an epistemological and political alternative to the Western model of development. This concept is not a translation of the term “sustainability”, but rather an alternative cultural articulation that emphasizes quality of life over economic growth. “Buen vivir” proposes a model of community living in harmony with nature, in opposition to individualism and the paradigm of unlimited growth, representing one of the alternative visions to the Western concept of sustainable development), which expresses a holistic vision that privileges the quality of life over mere economic growth. The first reflections concerning the concept of sustainability emerged in England between the 17th and 18th centuries, when growing industrialization imposed a more conscious management of forest resources. This period marked the beginning of a forward-looking approach to natural heritage management, subsequently enriched by the contribution of eminent thinkers of the industrial era. Figures such as Adam Smith, David Ricardo, and John Stuart Mill helped shape a broader vision of sustainability, integrating economic and social considerations. Beyond theorizing the free market, Smith recognized the importance of the balanced management of natural resources. Ricardo deepened the distributive aspects of international trade, while Mill elaborated on the concept of social utility. Thomas Robert Malthus, with his analysis of the relationship between demographics and resources, completed the theoretical framework that still influences our approach to sustainability today [9]. However, the modern conception of sustainability—understood as a balance between economic, social, and environmental needs, with attention to future generations—emerged only in the second half of the twentieth century, thanks to the progressive transformation of economic thought. A decisive turning point came with the publication of the Club of Rome Report (1972) [10], which, for the first time, emphasized the physical limits to economic growth on a finite planet. This intellectual heritage has laid the foundations for the current conception of sustainability: a dynamic balance between economic prosperity, social equity, and environmental protection, oriented toward guaranteeing future generations the same opportunities we enjoy today. The evolution of the concept of sustainability reflects a growing awareness of the complexity of interactions that characterize our world, highlighting the interweaving of bioclimatic, physical, territorial, political, productive, economic, and anthropic elements within a dynamic and interconnected system [11]. To manage this complexity, it has become necessary to identify main categories to evaluate and manage sustainability in a more complete and articulated manner. In this regard, a fundamental contribution came in 1994 from British entrepreneur and economist John Elkington, who introduced a broader vision of the concept of sustainability. Through the expression “Triple Bottom Line” (TBL), Elkington emphasized that the sustainability of businesses cannot be measured exclusively in terms of profit but must necessarily take into account the social and environmental impacts resulting from business activities [12]. This innovative vision, which has become a central paradigm in the debate on sustainable development, has redefined the parameters for evaluating corporate sustainability, extending well beyond the business sphere surpassing the mere consideration of profit to embrace social and environmental dimensions as well.
The tripartition of sustainability into environmental, social, and economic dimensions—the so-called “three pillars”—found fertile ground in the academic world, particularly following the publication of the Brundtland Report in 1987 [13]. Since then, their interpretation and practical application have taken on different nuances in various national contexts and in different schools of thought, generating a rich landscape of methodological and interpretative approaches. This variety of perspectives, far from being a limitation, reflects the dynamic and multifaceted nature of sustainability, confirming the need for a flexible and contextualized approach in its implementation. The multidimensional conception of sustainability, as outlined, finds a perfect exemplification in the analysis of land use, a fundamental resource that embodies the interconnection between the three pillars of sustainable development. Soil, in fact, is configured as a crucial element in which environmental, social, and economic interests converge and intersect [14]. As recognized by the European Commission, soil represents an irreplaceable strategic resource. Its importance is manifested in multiple aspects: it is a primary source of sustenance through the production of food and biomass, provides essential raw materials, and constitutes a fundamental element of the landscape and collective heritage [15]. Its nature is the result of a delicate balance between human intervention and the complex chemical and physical processes that continuously shape it. It is sufficient to consider that after the oceans, soil represents the largest carbon reservoir on the planet, thus playing a crucial role in maintaining the global ecosystem balance. It represents the cardinal principle, placed at the center of the transformations that affect its use in agricultural, urban, and natural contexts. Specifically, soil transformations follow different cycles, passing from less “artificial” states (such as natural or agricultural environments) to more “artificial” and permanent conditions typical of the urban context. The latter includes a wide range of interventions, from civil buildings to transport infrastructures, from industrial areas to service networks [16,17]. In this context, the European Environmental Agency developed the so-called “triangle of transitions”, capable of classifying possible land transformations according to two main criteria: (i) homogeneity: transformations can be homologous or non-homologous based on their mutual affinity; (ii) permanence: modifications can be permanent or transitory, depending on the effort needed to restore the original state. In this regard, the conversion of an urban area into an agricultural or natural zone (non-homologous transformation) is rarely feasible, given the complexity of renaturalization processes. In contrast, transitions between agricultural and natural use are characterized as homologous and transitory, ensuring greater protection of the environment and biodiversity while respecting the productive needs of agriculture [18]. The European Parliament Directive 2007/2/EC offers a structured interpretation of territory through the concept of land use, defining it as a classification based on the functional dimension and socioeconomic purpose, both present and future. This classification identifies six main functions: residential, industrial, commercial, agricultural, forestry, and recreational. Each function entails a different degree of impact on the natural surface, determined by the specific morphology of the urban intervention. In particular, residential, industrial, and commercial uses represent the most incisive transformations: they not only require a greater extension of the natural surface but simultaneously introduce significant criticalities in the urban fabric, linked to the reduction of soil permeability and albedo of the affected areas [19]. Therefore, it becomes essential to distinguish the concept of “land use” from that of “land cover”. While the latter describes the actual biophysical state of the land, land use represents the tangible result of the interaction between human activity and territory, revealing how humans shape and employ the land for their needs [20]. This distinction highlights the complex dialogue between anthropic needs and the protection of the natural characteristics of the territory. Therefore, in such circumstances, territorial management assumes a fundamental role aimed at containing the progressive transformation of natural land for anthropic purposes [21]. The objective is to guide territorial policies through the preparation of plans and projects toward the recovery of existing assets, favoring redevelopment, densification, and natural restoration in line with the principles of sustainable urban development. The phenomenon of land consumption finds its roots in the fundamental needs of human beings; human activities aimed at satisfying primary, secondary, and collective needs have an inevitable impact on the environment, particularly on the reduction of natural surfaces. The concept of land consumption, according to the definition of ISPRA (Higher Institute for Environmental Protection and Research), refers to the transformation of a natural area into an artificial one [22]. This process is closely linked to the use of territory as each mode of use directly influences biodiversity, vulnerability to natural disasters, ecosystem services, pollution, and the quality of life as a whole. Substantially, every land use exerts an environmental impact of varying intensity [23]. Soil sealing represents the most severe form of soil deterioration, as it irreparably compromises its vital functions. This process consists of the permanent covering of land with artificial materials such as asphalt or cement, constituting the main threat to European soils [24,25]. Land consumption manifests concretely in the expansion of built-up areas, infrastructure, quarries, landfills, construction sites, paved surfaces, permanent greenhouses, port and airport structures, impermeable sports facilities, and photovoltaic panel installations. It should be noted that even urban densification, when it involves new artificial coverings, represents a form of land consumption [26]. In the analysis of land consumption in urban areas, a central role is occupied by the phenomenon of “sprawl”—urban expansion characterized by low-density settlements but with high soil sealing. Despite this phenomenon, having been at the center of attention of both policy makers and the international scientific community for years, it continues to generate a lively interdisciplinary debate, lending itself to different interpretations. Over the years, various scholars have attempted to define and quantify urban sprawl, simply understanding it as “the amount of land converted to urban use”. However, the term has progressively assumed such a broad connotation that it has become, as some scholars observe, an “umbrella term” with an increasingly blurred meaning [27]. Indeed, the concept of sprawl encompasses a wide range of urban forms, from the building continuum of the peripheries to urban dispersion and fragmentation, making its definition, according to some experts, a veritable “methodological quagmire”, characterized by the absence of a precise definition [28]. In Italy, the phenomenon has stimulated the interest of scholars from various disciplines. These range from Samonà’s contributions to the “urbanized countryside” [29]—a concept later taken up by Muscarà [30]—to the studies by Piccinato, Quilici, and Tafuri on the “city territory” [31] to Indovina’s analyses of the “diffuse city” [32]. A particularly significant line of research, both nationally and internationally, has focused on analyzing the social, economic, and environmental costs of sprawl. Emblematic is the work of Young and Willmott, who coined the term “new Town blues” to describe a form of social alienation caused by the difficulty of accessing services and urban structures in cities characterized by low population density [33]. The complexity of the land consumption phenomenon has required the development of diversified analytical approaches capable of examining every facet. As with sustainability studies, both elementary indicators and synthetic indices are used in this field, allowing for monitoring of the phenomenon at different territorial scales [34]. The analysis of national literature, particularly studies conducted by ISPRA, has made it possible to identify a set of key indicators, with specific regard to environmental aspects, to assess the advancement of natural area sealing. Social aspects are mainly considered through the analysis of demographic dynamics, such as population density and changes over time. Differently, the economic dimension is examined by studying the distribution of real estate values in the municipal territory to understand whether the local real estate market tends to expand towards peripheral natural areas or concentrate in the urban center [35,36]. Analyses are conducted on different scales: national, regional, provincial, and municipal. Increasing importance is attributed to the economic quantification of ecosystem services. However, not all indicators are available at the sub-municipal level, sometimes limiting the possibility of comparisons between different territorial scales [37]. Regarding the construction of synthetic indices, there are no methodologies specifically developed for this purpose. Typically, indices are developed through simple mathematical operations of elementary indicators, in which a fundamental element turns out to be the spatial component of the data: without it, much information on land consumption could not be analyzed, as it is crucial to understand how each indicator is distributed across the territory [38]. The analysis of tools and evaluative approaches that regulate urban dynamics of land consumption in their environmental, social, and economic aspects reveals some significant criticalities. First, current indicator systems tend to focus on single aspects of the phenomenon, mainly the environmental one, neglecting the interconnections between different factors that contribute to the sealing of territory [39,40]. There is a lack of a systemic approach that, through the integration of various evaluative techniques and cartographic tools, could offer a complete vision of the phenomenon. As often happens in studies on sustainable development, the environmental dimension dominates the analysis. Social aspects are reduced to mere demographic analyses, while economic aspects—which represent the main driver of soil sealing and uncontrolled urban expansion—are often neglected. Therefore, the search for effective indicators to measure sustainable development represents a fundamental challenge in the contemporary scientific landscape. As highlighted by Giangiacomo Bravo, the evolution of tools for measuring land consumption starts from the criticism of the United Nations Human Development Index (HDI), considered insufficient due to the lack of an environmental dimension. To fill this gap, various solutions have been proposed, including the Human Sustainable Development Index (HSDI) [41]. Concurrently, Yixin Zhang and Zhijie Wu have developed the Environmental Human Index (EHI), which combines the HDI with the Environmental Performance Index (EPI) and is able to evaluate socio-ecological sustainability in an integrated manner [42]. Kenneth Button emphasizes how the complexity of urban ecosystems requires a multidimensional approach to sustainability assessment. Cities, as dynamic nodes of economic, social, and political networks, need sophisticated monitoring systems that operate on different spatial scales [43]. In this regard, Didem Dizdaroglu has proposed the development of micro-level indicators to evaluate the sustainability of residential developments, considering three fundamental dimensions: the natural environment, the built environment, and the socioeconomic environment [44]. Flavio Comim and Tadashi Hirai have introduced the methodology of partially ordered sets to evaluate sustainable human development indicators, highlighting the need to avoid arbitrary choices in the selection of variables [45]. In the application field, Rubina Canesi has examined how sustainable urban planning requires more refined evaluation tools, especially in marginal areas. The current economic context, marked by the pandemic and the Ukrainian conflict, has highlighted the fragility of some previous programmatic choices. To respond to these challenges, the author proposes the use of the Analytic Hierarchy Process (AHP) model, which integrates Urban Sustainability Indicators (USIs) to evaluate the degree of sustainability of urban projects [46]. The convergence of approaches and methodologies, as emerged from the set of analyzed studies, highlights the need for an integrated vision of sustainability, which simultaneously considers the environmental, social, and economic aspects of urban development, supporting more informed and effective policy decisions.
3. Methodology
The sustainability assessment of urban interventions represents a fundamental element in the processes of regeneration and transformation of cities. This necessity manifests itself both at the macro-urban level, such as cities or neighborhoods, and at the more specific micro-urban level, such as individual streets or cadastral parcels [37]. The international scientific literature clearly highlights the urgency of developing advanced decision support tools to effectively guide urban regeneration processes. In this context, the present research aims to identify and validate a system of key indicators capable of measuring and preventively (ex-ante) evaluating the effectiveness of urban regeneration interventions. The study intends to provide operational guidelines and practical tools for all stakeholders involved in regeneration processes. For public administrations, the proposed system becomes a tool to identify critical areas that require priority interventions. For private investors, it represents a method to identify the most suitable areas for their investments based on the desired risk/return profile. In summary, the methodology offers a complete informational framework of the examined urban area, highlighting both the criticalities and the potentialities present in the territory at the time of evaluation. Breaking down the urban dimension into three main components: (i) Economic-Financial, (ii) Environmental, and (iii) Social, the study focuses on defining a synthetic risk index for the Economic-Financial component only related to the analyzed territorial context. The developed methodology distinguishes itself by its ability to isolate the specific effects of the economic component while recognizing the intrinsic connection with environmental and social dimensions, which, in an integrated vision of sustainability, would require similar in-depth analyses through dedicated indices.
The methodological process is articulated in the following sequential steps:
- step.1.
- Breakdown of the urban dimension into three main components (Economic-Financial, Environmental, and Social).
- step.2.
- Definition of the methods for determining the risk of the Economic-Financial component.
- step.3.
- Selection of the territorial investigation unit.
- step.4.
- Identification of the initial set of elementary indicators that configure the structure of the AHP (Analytic Hierarchy Process).
- step.5.
- Collection of necessary data.
- step.6.
- Normalization and correlation analysis between indicators.
- step.7.
- Determination of indicator and criteria weights.
- step.8.
- Calculation of the composite risk index.
- step.9.
- Composition of risk intensity ranges.
- step.10.
- Development of the georeferenced map for an intuitive visualization of results.
3.1. Breakdown of the Urban Dimension into the Three Main Components
The sustainability paradigm traditionally articulates three dimensions—economic, environmental, and social—commonly defined as the “three pillars”. The conceptual tripartition of the urban dimension into the three main components, (i) Economic-Financial, (ii) Environmental, and (iii) Social, finds a perfect exemplification in the analysis of urban land use, a field in which the three components intertwine in a system of complex and interdependent relationships. The present research adopts a methodological approach focused exclusively on the Economic-Financial dimension, strategically isolating it from the other components to allow for a more in-depth analysis. Through this analytical delimitation, the study elaborates a synthetic risk index capable of precisely quantifying the Economic-Financial vulnerability of the examined territorial unit.
The composite indicator, therefore, represents a tool capable of condensing complex economic variables into a unitary parameter of immediate interpretation. Such measurement offers public decision-makers and territorial stakeholders an objective reference to evaluate the sustainability of land use policies from the perspective of economic and financial balances.
3.2. Definition of the Methods for Determining the Risk of the Economic-Financial Component
The evaluation of the Economic-Financial component is accomplished through an accurate analysis of real estate investment risk. Therefore, it is essential to define the factors that contribute to determining risk conditions in the real estate sector. With reference to a generic real estate investment aimed at urban transformation, whether implemented by public administrations or private investors, it is possible to identify three main risk components:
- I.
- Market Risk (RM) = Represents the risk deriving from supply and demand conditions present in the reference real estate market at the time of evaluation. It takes into account the set of factors linked to the economic dynamics of the real estate sector, directly influencing investment opportunities and their potential profitability.
- II.
- Technical-Urban Risk (RTU) = Pertains to the specific intrinsic characteristics of the real estate asset and extrinsic characteristics of the relevant territorial area. It contemplates the structural, infrastructural, and urban aspects that characterize both the properties themselves and the territorial-environmental context in which they are inserted.
- III.
- Socio-Economic Risk (RSE) = Concerns the demographic and social characteristics of the territorial context in which the investment is located. It considers the economic solidity and solvency capacity of future users, understood as residents of the territorial unit under investigation.
The overall investment risk is defined by the sum of the three types of risk:
Rindex = RM + RTU + RSE
It is fundamental to understand to what extent and with what weight these risk components influence the overall risk of real estate investment:
where,
Rindex = wM·RM + wTU·RTU + wSE·RSE
= weight relative to market risk;
= weight relative to technical-urban risk;
= weight relative to socio-economic risk.
The main advantage of the proposed model lies in the possibility of modulating the value of weights wi, thus allowing the generation of a diversified range of scenarios. This methodological versatility makes it possible to precisely identify the scenario that offers the optimal balance between risks and returns, facilitating more informed and strategically advantageous investment decisions.
The composite risk index of such a conception includes all factors that contribute to defining the riskiness of the investment based on its specific characteristics and the real estate market in which it is inserted. The index refers to a generic intervention in which all the characteristics necessary for defining the various types of risk considered are known. The evaluation is carried out ex-ante with respect to the chosen unit of investigation. The objective of the index is to provide a faithful picture of the existing conditions at the time of evaluation that can contribute to the formation of investment risk, thus based on the peculiarities of the territorial context included in the urban perimeter of the territorial unit under examination.
3.3. Selection of the Territorial Investigation Unit
To effectively evaluate the Economic-Financial component of urban redevelopment interventions with low natural land consumption—such as recovery, enhancement, and restoration of abandoned buildings or underutilized areas—it is essential to identify an optimal territorial unit of investigation.
To this end, the research adopts as a reference the zoning developed by the Real Estate Market Observatory (OMI) of the Revenue Agency. This information system, widely recognized in professional and academic fields, divides the municipal territory into homogeneous zones based on economic and socio-environmental conditions, providing semi-annual quotations of real estate values by type and state of conservation.
Specifically for the case study, with reference to the territorial configuration outlined by the existing OMI in the first half of 2024, the municipal territory of the city of Potenza extends over four OMI bands (Figure 1: central, semi-central, peripheral, extra-urban) which are in turn divided respectively into 2 central zones (B1, B2), 3 semi-central zones (C1, C2, C3), 5 peripheral zones (D1, D2, D3, D4, D5) as well as one extra-urban zone (R), as shown in Figure 2.
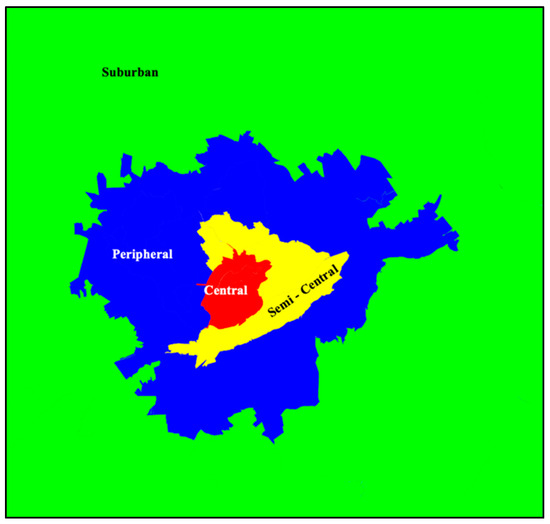
Figure 1.
Perimeter of the four OMI bands of the municipal territory of Potenza.
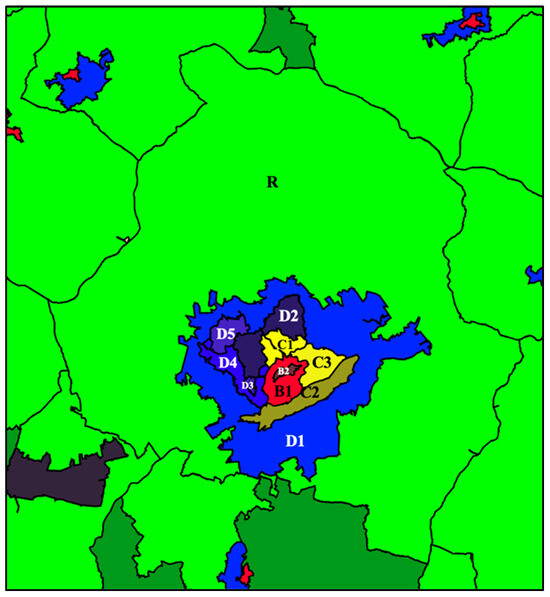
Figure 2.
Subdivision of the municipal territory of Potenza into 11 IMO zones.
The elaborated composite index will allow a preliminary multidimensional evaluation for each OMI zone of Potenza, capable of highlighting urban characteristics, market dynamics, and the economic solidity of potential users, in order to determine the risk profile in urban regeneration investments for both private investors and public administration.
3.4. Identification of the Initial Set of Elementary Indicators That Configure the Structure of the AHP (Analytic Hierarchy Process)
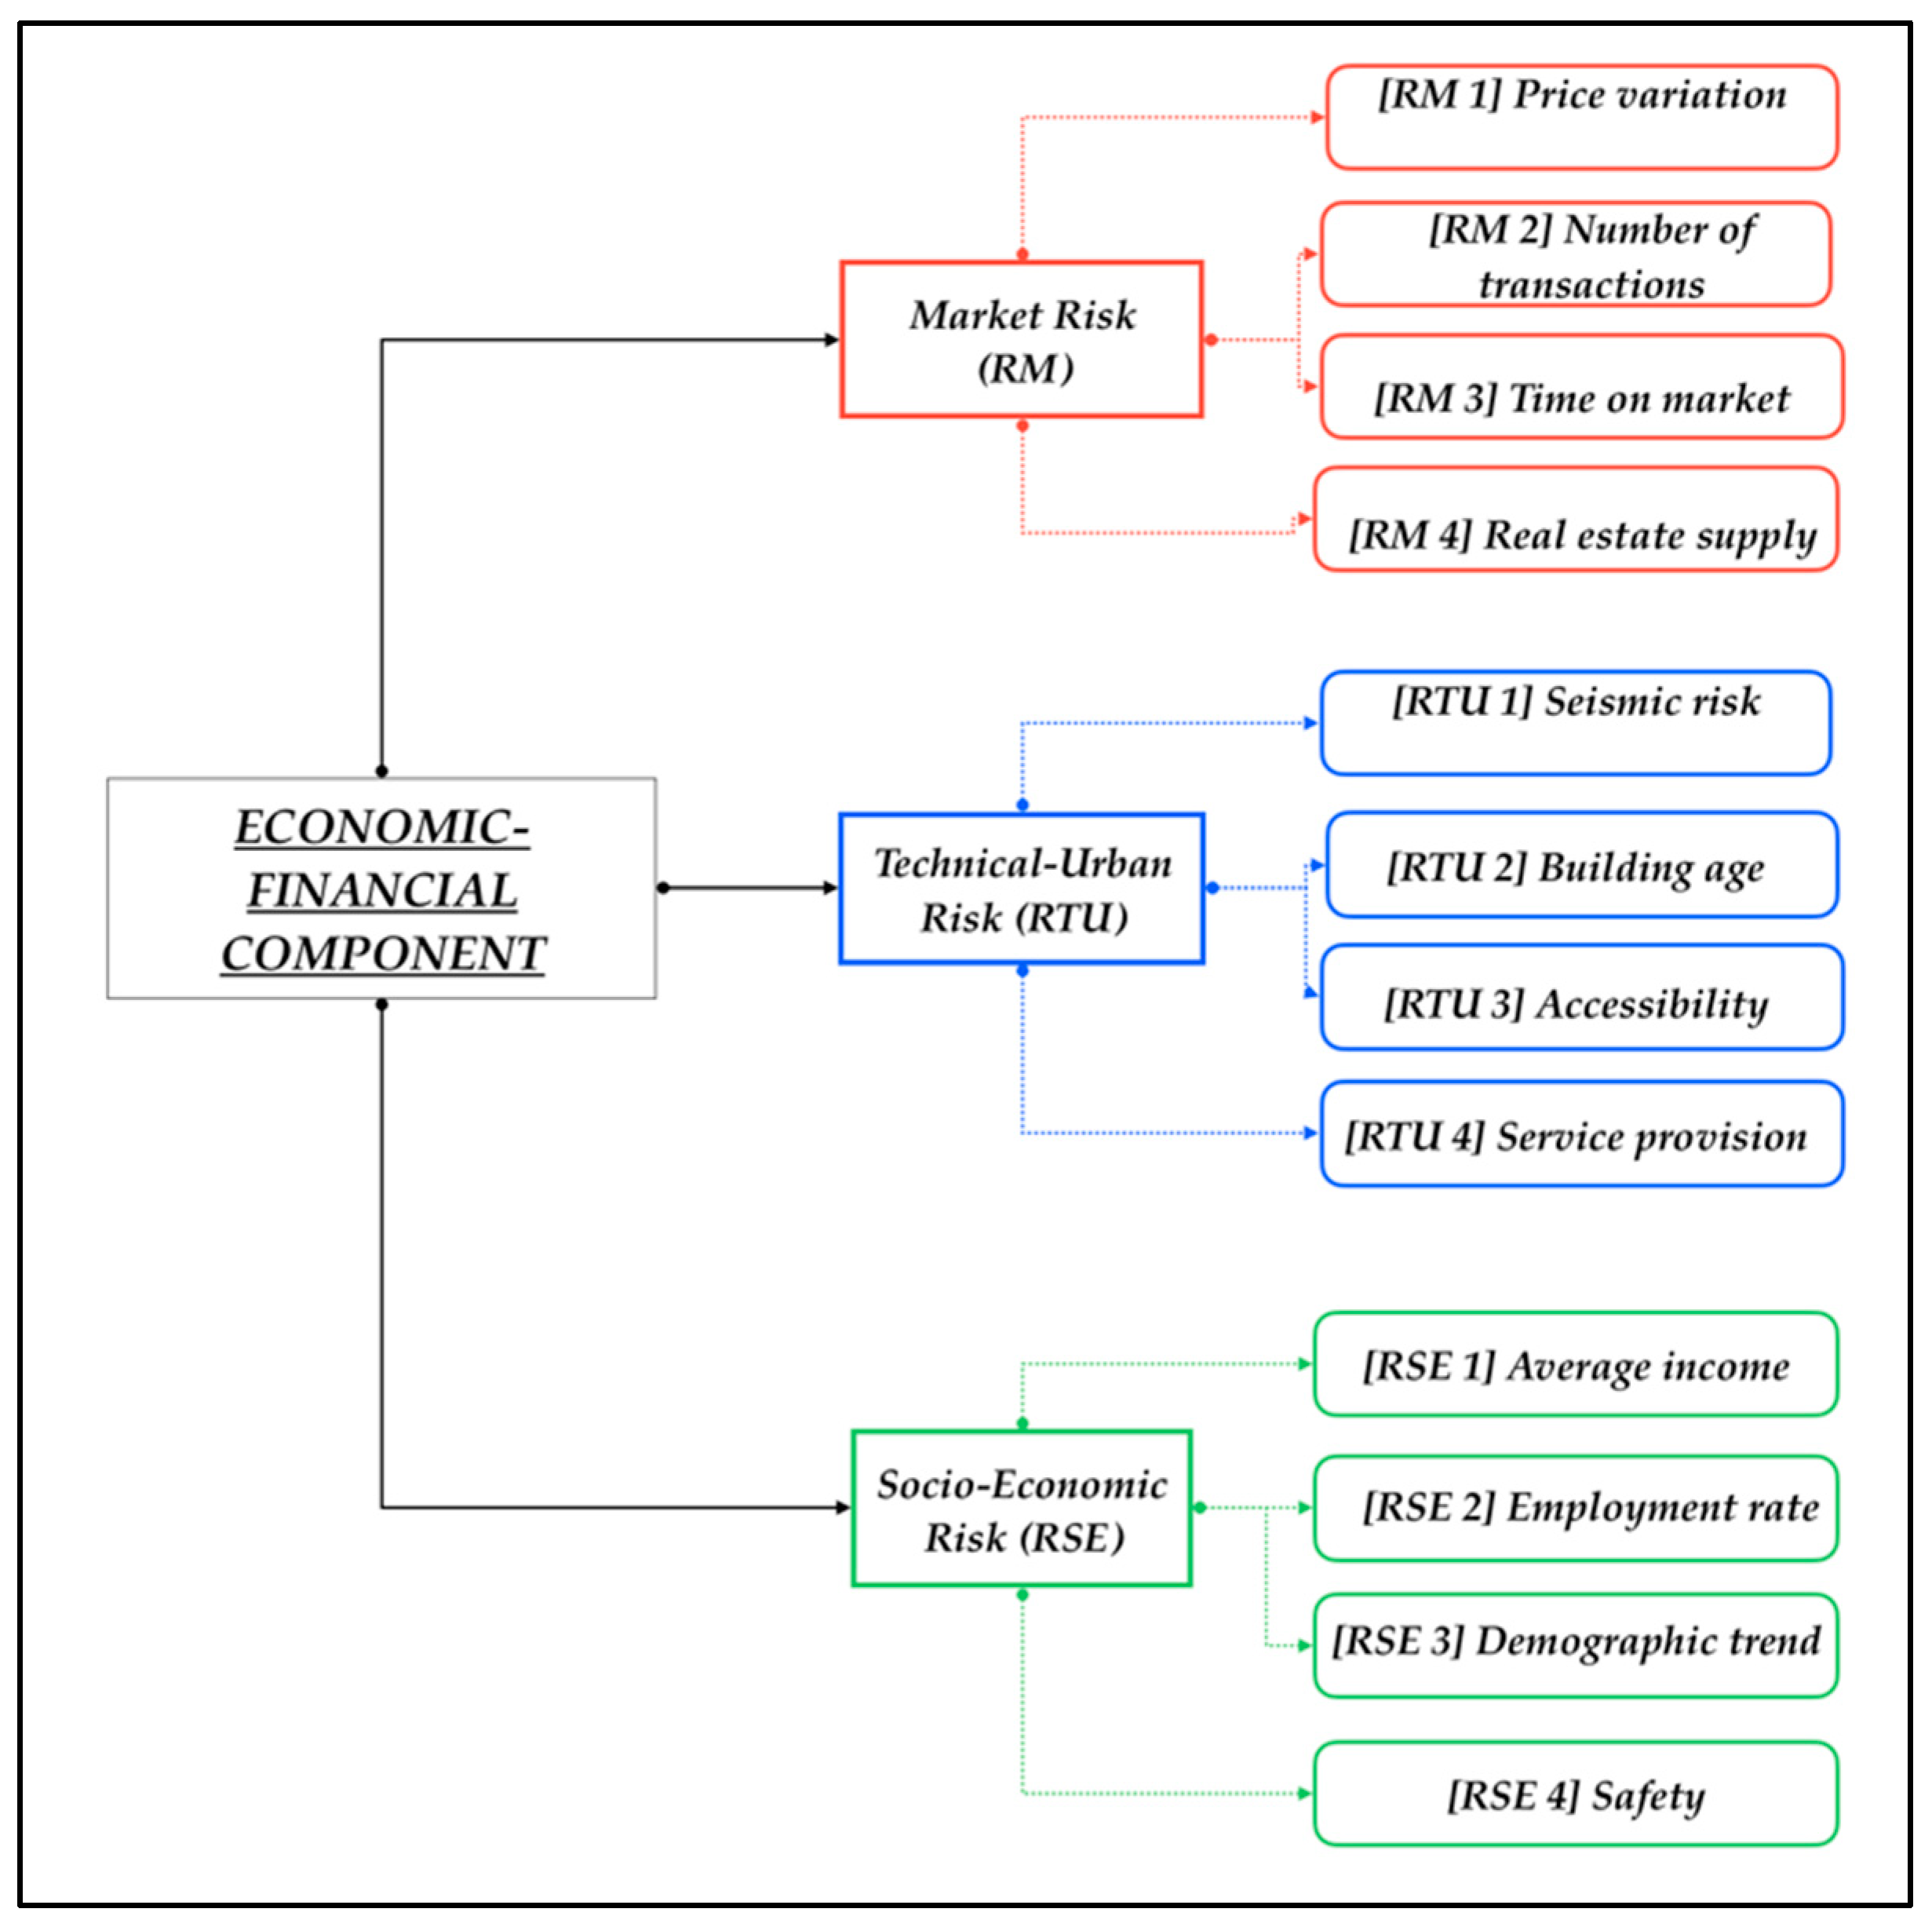
The composite risk index for the evaluation of the Economic-Financial component represents a collection of essential data and information for analyzing various types of real estate risks concerning urban recovery and redevelopment interventions in relation to the chosen territorial scale. This index results from the aggregation of multiple indicators, both qualitative and quantitative, carefully selected to comprehensively represent each category of real estate risk related to the territorial dimension under consideration. In this perspective, the analysis of real estate dynamics is essential in order to identify the most suitable indicators to fully outline the different types of risk being evaluated. The examination of real estate dynamics present in the local market of the i-th OMI zone is therefore conducted through the identification of an initial set of indicators aimed at segmenting the areas of Potenza by integrating the informational content of the three selected criteria. The initial set of indicators consists of a total of 12 elements, equally distributed among the three reference criteria: four for Market Risk (RM), four for Technical-Urban Risk (RTU), and four for Socio-Economic Risk (RSE).
The indicators related to the criteria are structured as follows:
- I.
- Market Risk Criterion (RM):
- -
- [RM1] Price variation: percentage change in prices over the last 12 months.
- -
- [RM2] Number of transactions: the ratio between the number of transactions and real estate stock.
- -
- [RM3] Time on market: number of months properties remain on the market.
- -
- [RM4] Real estate supply: percentage incidence of properties for sale on the total real estate stock.
- II.
- Technical-Urban Risk Criterion (RTU):
- -
- [RTU1] Seismic risk: seismic classification of the considered area (1 = high probability of a strong earthquake, 2 = strong earthquakes are possible, 3 = strong earthquakes are less likely, 4 = very low probability of an earthquake).
- -
- [RTU2] Building age: percentage of buildings older than 40 years.
- -
- [RTU3] Accessibility: accessibility index (4 = accessible and nearby; 3 = accessible but distant; 2 = inaccessible but nearby; 1 = inaccessible and distant) to services (railway stations, airports, highways, ports).
- -
- [RTU4] Service provision: density of primary services (health, educational, commercial, administrative, recreational) per square kilometer.
- III.
- Socio-Economic Risk Criterion (RSE):
- -
- [RSE1] Average income: the ratio between local average income and city average income.
- -
- [RSE2] Employment rate: percentage incidence of employed individuals in the active population.
- -
- [RSE3] Demographic trend: percentage change in population over the last five years.
- -
- [RSE4] Safety: number of crimes per hundred thousand inhabitants.
The hierarchical structures, including the criteria and related indicators (sub-criteria), are illustrated in the synoptic chart shown in Figure 3.
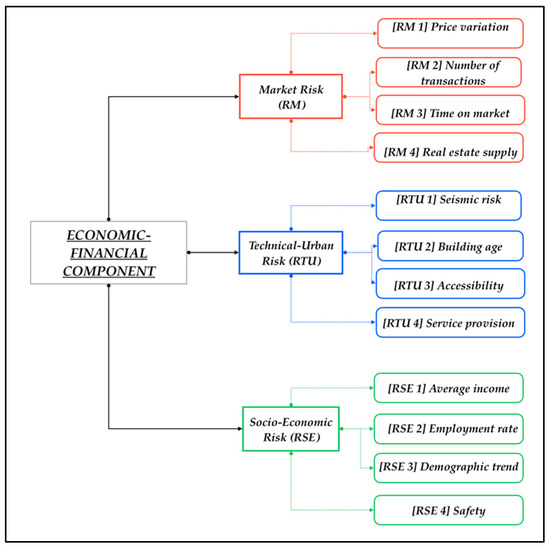
Figure 3.
Initial set of elementary indicators identified to represent the three risk criteria and structured according to AHP hierarchical orders.
The composite risk index for each OMI zone of the municipality of Potenza is calculated using a formula that methodically combines all previously defined risk indicators. The formula is articulated as a factorial product of the weighted sum of indicators related to the risk criteria considered. In detail, for each risk criterion (Market Risk, Technical-Urban Risk, Socio-Economic Risk), a weighted sum of the related sub-criteria (specific indicators) is calculated, each multiplied by its relative weight within the criterion. Subsequently, each weighted sum is multiplied by the overall weight attributed to the respective risk criterion within the global evaluation. The values thus obtained are combined through a factorial product, generating the composite risk index for the specific OMI zone. This operation must be systematically repeated for each of the OMI zones present in the municipal territory of Potenza, thus allowing for a complete and differentiated mapping of real estate risk across the entire municipal territory. This methodology allows for synthesizing in a single numerical value the complex interaction between various risk factors, taking into account both their individual relevance (through the weights of sub-criteria) and the relative importance of each macro-category of risk (through the weights of criteria).
The composite risk index for each OMI zone can be represented through the following equation:
where,
= composite risk index for the i-th OMI zone.
= index related to the three risk criteria (Market Risk, Technical-Urban Risk, Socio-Economic Risk).
= index related to the four sub-criteria (indicators) for each criterion.
= relative weight of indicator k within criterion j.
= k indicator value of criterion j for the i-th OMI zone.
= overall weight given to criterion j.
It is essential to assign a specific weight to each indicator k within criterion j since indicators within the same criterion can influence the overall risk to varying degrees. In the case of the Market Risk criterion (RM), for example, in certain OMI zones, the “price variation” indicator might have a more significant impact compared to the “selling time” indicator. The assignment of weights would, therefore, allow for calibrating the relative importance of each indicator based on the specific characteristics of the territorial area being analyzed, making the index more representative of reality.
3.5. Collection of Necessary Data
In this phase, data related to each indicator for the different OMI zones of the territorial unit under investigation were collected, specifying the sources used for constructing the initial set. Additionally, for each indicator, the “direction of influence” (+, −) was defined, which determines its relationship with risk, that is, whether higher values correspond to a higher or lower investment risk. The details can be consulted in Table 1 and Table 2 shown below.

Table 1.
Summary of the indicator.
Table 2.
Summary of the detailed data of the indicators.
3.6. Normalization and Correlation Analysis Between Indicators
The data sample consisting of multiple real estate risk indicators, both qualitative and quantitative, inherently presents a heterogeneity of units of measurement that hinders direct comparison and aggregation of data into a synthetic risk index. Normalization is therefore configured as an essential methodological phase aimed at converting all collected data into a uniform and coherent measurement scale, an essential prerequisite for any subsequent comparative analysis and aggregation process. In the case under examination, the normalization methodology adopted is the Min–Max technique, applied taking due consideration of the specific “direction of influence” (+, −) of each indicator on the overall risk of real estate investment, thus ensuring the interpretative coherence of the evaluation model. The normalized indicators are reported below in Table 3.
Table 3.
Normalization of the indicators.
At this point, to avoid redundancies in the data, it was necessary to proceed with an accurate correlation analysis aimed at identifying any overlaps between the indicators. The analysis was conducted using both Pearson’s correlation coefficient (parametric) and Spearman’s (non-parametric), the results of which are reported in Table 4 and Table 5, respectively.
Table 4.
Pearson’s correlation matrix.
Table 5.
Spearman’s correlation matrix.
Several significant correlations emerge from the examination of the correlation matrices. A high correlation was found between Average Income (RSE1) and Employment Rate (RSE2), with a correlation coefficient |r| equal to 0.96. Another strong correlation is recorded between Accessibility (RTU3) and Service Provision (RTU4), with a correlation coefficient |r| equal to 0.74. A medium-high negative correlation is also highlighted between Building Age (RTU2) and Service Provision (RTU4), with a correlation coefficient |r| equal to −0.61, as well as a medium-high correlation between Accessibility (RTU3) and Average Income (RSE1), with a correlation coefficient |r| equal to 0.69. No significant correlation was detected for Seismic Risk (RTU1), Demographic Trend (RSE3), and Safety (RSE4). In order to eliminate redundancy and build a more truthful and robust index, variables that showed high correlations (particularly those above |±0.90|) with other variables already considered more representative were excluded, as were those that remained constant across all analyzed OMI zones, thus reducing the discriminating capacity of the model. Therefore, it was decided to exclude the Employment Rate (RSE2) as it strongly correlates with Average Income (RSE1). The indicators Demographic Trend (RSE3), Safety (RSE4), and Seismic Risk (RTU1) were also eliminated as they remain constant for all OMI zones of the municipal territory under analysis. Despite their correlation, it was chosen to maintain both Accessibility (RTU3) and Service Provision (RTU4), as they represent different aspects of risk. Therefore, the final indicators selected following the correlation analysis are RM1 (Price Variation), RM2 (Number of Transactions), RM3 (Selling Time), RM4 (Real Estate Supply), RTU2 (Building Age), RTU3 (Accessibility), RTU4 (Service Provision), and RSE1 (Average Income).
3.7. Determination of Indicator and Criteria Weights
Each real estate risk factor, represented by the set of indicators (sub-criteria), influences to a different extent the overall level of real estate risk in the territorial unit under investigation. This diversified incidence derives from the intrinsic relevance of each element, translated in mathematical terms through the attribution of a local weight. Consequently, it becomes necessary to construct pairwise comparison matrices, both for the indicators (sub-criteria) and for the risk criteria, in order to determine their relative importance expressed in terms of local weight/intensity. In this regard, a panel composed of six experts was consulted, including two technical specialists from public administration, two real estate professionals, as well as two university professors in the fields of urban planning and real estate appraisal and valuation, experts selected by virtue of their in-depth knowledge of the dynamics characterizing the territorial scale under examination. The formulation of preference judgments, subsequently converted into numerical values for each pairwise comparison matrix, was carried out using the Saaty scale [47] together with the SuperDecisions software V2.10.0, a methodology that allowed for the development of the following pairwise comparison matrices (Table 6, Table 7, Table 8, Table 9, Table 10, Table 11, Table 12, Table 13, Table 14 and Table 15):
Table 6.
Pairwise comparison matrix between the three main criteria.
Table 7.
Pairwise Comparison Matrix of Market Risk (RM) Subcriteria.
Table 8.
Pairwise Comparison Matrix of Technical Urban Risk (RTU) Subcriteria.
Table 9.
Pairwise Comparison Matrix of Socio-Economic Risk (RSE) Subcriteria: Since only RSE1 (Average Income) remains as a subcriterion of Socio-Economic Risk, its relative weight within the criterion is 1.
Table 10.
Calculation of weights related to the main criteria.
Table 11.
Calculation of weights related to sub-criteria Market risk.
Table 12.
Calculation of the weights related to the sub-criteria Technical Urban Risk.
Table 13.
Calculation of the weights related to the sub-criteria Socio-Economic Risk.
Table 14.
Determination of the composite risk index with respect to the eleven OMI zones in the municipality of Potenza.
Table 15.
Classification of intensity ranges of risk for different OMI zones.
Subsequently, specific weights were defined for each indicator k and for each criterion j, also verifying the goodness of the weight estimation performed in terms of measuring the consistency of the pairwise comparison matrices.
The consistency of the judgments expressed by the experts is rigorously verified by calculating the Consistency Index (CI), equal to the mathematical ratio between the maximum eigenvalue of the matrix (λmax) and the order (n) of the matrix itself, according to the formula:
CI = (λmax − n)/(n − 1)
This index allows for evaluating the degree of overall reliability of the decision-making process. A CI value close to zero indicates high consistency in comparative judgments while increasing values signal potential inconsistencies in the evaluation. The validity of the analysis is further confirmed through the calculation of the Consistency Ratio (CR), obtained from the ratio between the CI and a tabulated Random Index (RI), which must remain below the critical threshold of 0.1 in order to guarantee the reliability of the results. The above is schematically represented as follows (Table 10, Table 11, Table 12 and Table 13):
3.8. Calculation of the Composite Risk Index
Once the specific weights for each indicator k and for each criterion j have been determined through the Analytic Hierarchy Process (AHP), we proceed with the determination of the composite risk index—for each OMI zone of the municipality of Potenza—using formula number 3 reported in Section 3.4, capable of methodically combining all risk indicators (Table 14).
3.9. Composition of Risk Intensity Ranges
To determine the intensity intervals of the risk index in a scientifically demonstrable way, avoiding arbitrary evaluations, three distinct statistical methods were employed and compared. The eleven OMI zones of the municipality of Potenza were thus classified into five risk categories (high, medium-high, medium, medium-low, and low) through mathematically defined limits. The quantile method divides the data into groups with equal numbers of observations; the standard deviation method defines intervals using the mean and multiples of the standard deviation, while the Natural Breaks (Jenks) method minimizes intra-class variance and maximizes inter-class variance, naturally identifying points of discontinuity in the data distribution [48]. This multi-method approach ensures that the final classification is scientifically founded and robust, offering a reliable interpretation of the risk index intensity for the different OMI zones of Potenza. Comparing the results of the three methods, the final risk intensity ranges are (Table 15):
3.10. Development of the Georeferenced Map for an Intuitive Visualization of Results
The values of the composite risk index related to the evaluation of the Economic-Financial component, determined for each urban zone of the municipality of Potenza, were integrated into a georeferenced thematic map developed using a geographic information system (GIS). This cartographic representation methodology allows for the spatial visualization of Economic-Financial variables, enabling an immediate reading of the territorial distribution of risk through differentiated chromatic gradations, as illustrated in Figure 4.
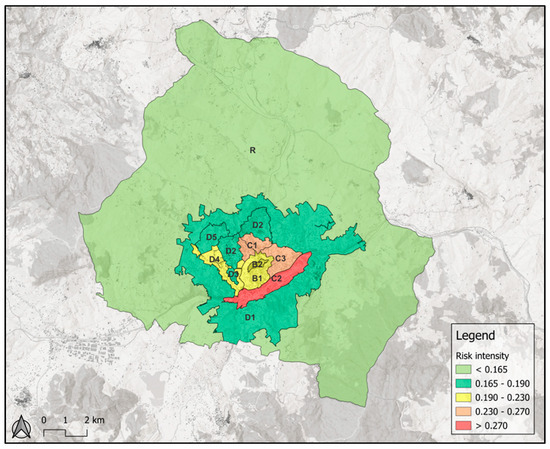
Figure 4.
Georeferenced map.
4. Results
Analysis of the Economic-Financial risk component distribution across the different urban zones of the municipality of Potenza reveals a complex picture that deserves in-depth interpretation to effectively guide urban regeneration strategies. The risk mapping outlines a territorial morphology in which semi-central zones emerge as the most problematic, while there is a progressive decrease in risk moving both toward the central core and toward peripheral and extra-urban areas. This non-random distribution reflects established urban dynamics and suggests precise considerations for private investors and public administrations. The semi-central zones (C1, C2, C3) exhibit the highest level of risk, with zone C2 reaching the peak composite index of 0.290. This phenomenon can be attributed to their nature as “border areas” between centrality and periphery. These urban areas suffer from a hybrid and incomplete identity characterized by an extremely heterogeneous building fabric in terms of era, construction quality, and real estate value. Their intermediate position puts them at a competitive disadvantage: they can claim neither the prestige and service provision of central areas nor the economic accessibility and design flexibility of peripheral zones. The instability of real estate demand in these areas, moreover, makes it particularly complex to estimate the economic return of urban regeneration interventions [49]. Moving toward the city center, the central zones (B1, B2) present moderate risk, the result of a balance between critical elements and opportunity factors. On the one hand, these areas involve significantly higher intervention costs as well as stringent conservation constraints; on the other hand, they offer the invaluable advantage of centrality [50]. Zone B2, coinciding with the oldest historical nucleus, shows a slightly higher risk compared to B1, likely due to the greater historical stratification and consequent complexity of recovery interventions. The peripheral zones (from D1 to D5) show a decreasing gradient of risk, configuring themselves as relatively favorable areas for urban regeneration investments. This internal variability within the peripheral system probably reflects substantial differences in terms of accessibility, infrastructure provision, and urbanization period. The competitive advantage of these areas lies in the more contained acquisition costs, greater availability of space, and fewer regulatory constraints. These conditions offer wider investment margins, reducing risk exposure [51]. The extra-urban zone (R) finally emerges as the area with the lowest risk (0.153), configuring itself as a privileged territory for urban transformation interventions. This data reflects the virtuous combination of low land values and maximum design freedom. The possibility of developing projects from scratch, without the constraints imposed by the need to dialogue with an established urban context, represents an undoubted operational and economic advantage.
5. Conclusions
In light of the results emerging from the analysis of the Economic-Financial risk component in the urban context of Potenza, it appears evident how urban regeneration represents an essential tool aimed at countering land consumption. The differentiated distribution of risk in the various urban zones offers a strategic opportunity to rethink territorial development in a sustainable key, privileging the recovery of existing structures over indiscriminate expansion. In this scenario, the composite risk index developed here is configured as a decision-making tool capable of orienting investments toward a sustainable urban development model that privileges the redevelopment of degraded semi-central and peripheral areas, maximizing the potential of the existing building heritage. Indeed, the proposed methodology, integrating economic-financial indicators, can effectively support both public administrations in developing forward-looking urban policies and private investors in evaluating the convenience and feasibility of interventions [52]. Private investors could preferably orient themselves toward the lower-risk zones (R, D5), which guarantee greater stability of economic return. Likewise, for public administrations, there emerges the need to concentrate resources and incentives precisely in high-risk zones (C1, C2, C3), where the market alone struggles to trigger virtuous dynamics of regeneration. This complementary distribution of public and private investments represents a concrete response to the imperative of limiting land consumption by directing private investments toward already urbanized peripheral areas rather than toward new expansions and concentrating public intervention on the redevelopment of problematic semi-central zones.
However, some limitations must be acknowledged. First, the dependence on official statistical sources implies a certain inertia in data updates and the inability to promptly capture emerging dynamics. Second, the index is focused solely on the economic-financial dimension: the environmental and social components of urban sustainability, although fundamental, have been isolated for methodological needs but represent natural future developments. Future implementations may include the adoption of predictive techniques (e.g., machine learning) capable of strengthening the system’s ability to support ex-ante simulations during strategic planning phases.
Author Contributions
Conceptualization, B.M., V.D.G. and F.T.; methodology, F.P.D.G.; software, F.P.D.G.; validation, F.P.D.G., D.T. and G.C.; formal analysis, F.P.D.G.; investigation, D.T.; resources, G.C.; data curation, F.P.D.G.; writing—original draft preparation, F.P.D.G.; writing—review and editing, D.T.; visualization, F.T.; supervision, F.T.; project administration, B.M.; funding acquisition, B.M. All authors have read and agreed to the published version of the manuscript.
Funding
The article is the result of research activities conducted with funding from the P.R.I.N. Project 2022: “INSPIRE Improving Nature-Smart Policies through Innovative Resilient Evaluations”, Grant number: 2022J7RWNF.
Institutional Review Board Statement
Not applicable.
Informed Consent Statement
Not applicable.
Data Availability Statement
Dataset available on request from the authors.
Conflicts of Interest
The authors declare no conflict of interest.
References
- Dixon, J.A.; Fallon, L.A. The concept of sustainability: Origins, extensions, and usefulness for policy. Soc. Nat. Resour. 1989, 2, 73–84. [Google Scholar] [CrossRef]
- Lozano, R. Envisioning sustainability three-dimensionally. J. Clean. Prod. 2008, 16, 1838–1846. [Google Scholar] [CrossRef]
- Romano, B.; Zullo, F.; Ciabò, S.; Fiorini, L.; Marucci, A. Il modello italiano di dispersione urbana: La sfida dello sprinkling. Sentieri Urbani 2016, 8, 15–22. [Google Scholar]
- Gardi, C.; Dall’Olio, N.; Salata, S. L’Insostenibile Consumo di Suolo; Edicom Edizioni: Monfalcone, Italy, 2013. [Google Scholar]
- ISPRA. Consumo di Suolo, Dinamiche Territoriali e Servizi Ecosistemici—Rapporto 2024. ISPRA. 2024. Available online: www.isprambiente.gov.it (accessed on 6 February 2025).
- Zeng, Y.; Maxwell, S.; Runting, R.K.; Venter, O.; Watson, J.E.; Carrasco, L.R. Environmental destruction not avoided with the Sustainable Development Goals. Nat. Sustain. 2020, 3, 795–798. [Google Scholar] [CrossRef]
- ARPA Basilicata. Il Consumo di Suolo in Basilicata—Report 2024; ARPA Basilicata: Matera, Italy, 2024. [Google Scholar]
- Spindler, E.A. The History of Sustainability the Origins and Effects of a Popular Concept. In Sustainability in Tourism; Springer Gabler: Wiesbaden, Germany, 2013; pp. 9–31. [Google Scholar]
- Ehrlich, P.R.; Ehrlich, A.H. The population bomb revisited. Electron. J. Sustain. Dev. 2009, 1, 63–71. [Google Scholar]
- Meadows, D.H.; Meadows, D.L.; Randers, J.; Behrens, W.W. The Limits to Growth: A Report for the Club of Rome’s Project on the Predicament of Mankind; Universe Books: New York, NY, USA, 1972. [Google Scholar]
- Yolles, M. Sustainability development: Part 2-exploring the dimensions of sustainability development. Int. J. Mark. Bus. Syst. 2018, 3, 257–275. [Google Scholar] [CrossRef]
- Elkington, J. Cannibals with forks: Triple bottom line of 21st century business john elkington. Environ. Qual. Manag. 1998, 8, 37–51. [Google Scholar] [CrossRef]
- Purvis, B.; Mao, Y.; Robinson, D. Three pillars of sustainability: In search of conceptual origins. Sustain. Sci. 2019, 14, 681–695. [Google Scholar] [CrossRef]
- Ferris, J.; Norman, C.; Sempik, J. People, land and sustainability: Community gardens and the social dimension of sustainable development. Soc. Policy Adm. 2001, 35, 559–568. [Google Scholar] [CrossRef]
- Commissione Europea. Report on Best Practices Forlimiting Soil Sealing and Mitigating Its Effects; Technical Report; European Comission: Brussels, Belgium, 2011; p. 227. [Google Scholar]
- Massimo, D.E.; Del Giudice, V.; Musolino, M.; De Paola, P.; Del Giudice, F.P. Green Building to Overcome Climate Change: The Support of Energy Simulation Programs in Gis Environment. In New Metropolitan Perspectives; Calabrò, F., Della Spina, L., Piñeira Mantiñán, M.J., Eds.; Lecture Notes in Networks and Systems Series; Springer: Cham, Switzerland, 2022; Volume 482, pp. 1–13. [Google Scholar]
- Massimo, D.E.; Del Giudice, V.; Musolino, M.; De Paola, P.; Del Giudice, F.P. Abio Ecological Prototype Green Building Toward Solution of Energy Crisis. In New Metropolitan Perspectives; Calabrò, F., Della Spina, L., Piñeira Mantiñán, M.J., Eds.; Lecture Notes in Networks and Systems Series; Springer: Cham, Switzerland, 2022; Volume 482, pp. 1–13. [Google Scholar]
- European Environmental Agency. 2006. Available online: https://www.eea.europa.eu/publications/eea_report_2006_10/eea_report_10_2006.pdf/view (accessed on 4 February 2025).
- Regolamento Regulation (EU) 2021/696 of the European Parliament. Available online: https://eur-lex.europa.eu/eli/reg/2021/696/oj?locale=it (accessed on 14 January 2025).
- Gardi, C. Urban Expansion, Land Cover and Soil Ecosystem Services; Taylor & Francis Group: New York, NY, USA, 2017; pp. 1–301. [Google Scholar]
- Mitcham, C. The concept of sustainable development: Its origins and ambivalence. Technol. Soc. 1995, 17, 311–326. [Google Scholar] [CrossRef]
- ISPRA. Il Consumo di Suolo. 2024. Available online: https://www.isprambiente.gov.it/it/attivita/suolo-e-territorio/suolo/il-consumo-di-suolo (accessed on 4 February 2025).
- Forte, F.; Del Giudice, V.; De Paola, P.; Del Giudice, F.P. Cultural Heritage Seismic Disasters: Assessment Methods and Damage Types. In Appraisal and Valuation; Morano, P., Oppio, A., Rosato, P., Sdino, L., Tajani, F., Eds.; Green Energy and Technology Series; Springer: Cham, Switzerland, 2021; pp. 163–175. [Google Scholar]
- Musolino, M.; Massimo, D.E.; Marino, C.; De Paola, P.; Errigo, R.; Malerba, A.; Del Giudice, F.P. Appraisal of energy saving in Green Buildings, supported by BIM new platforms. Valori Valutazioni 2023, 34, 89–115. [Google Scholar] [CrossRef]
- Del Giudice, V.; De Paola, P.; Morano, P.; Tajani, F.; Del Giudice, F.P.; Anelli, D. Depreciation of Residential Buildings and Maintenance Strategies in Urban Multicultural Contexts. In Values, Cities and Migrations; Napoli, G., Mondini, G., Oppio, A., Rosato, P., Barbaro, S., Eds.; Green Energy and Technology Series; Springer: Cham, Switzerland, 2023. [Google Scholar] [CrossRef]
- De Ruggiero, M.; Manganelli, B.; Marchianò, S.; Salvo, F.; Tavano, D. Comparative and Evaluative Economic Analysis of Ground Mounted Photovoltaic Plants. In Values and Functions for Future Cities; Mondini, G., Oppio, A., Stanghellini, S., Bottero, M., Abastante, F., Eds.; Green Energy and Technology Series; Springer International Publishing: Cham, Switzerland, 2020; pp. 181–199. ISBN 978-3-030-23784-4. [Google Scholar]
- Bencardino, M. Consumo di Suolo e Sprawl Ubano: Drivers e Politiche Di Contrasto. Boll. Della Soc. Geogr. Ital. Roma 2015, 8, 217–237. [Google Scholar]
- Audirac, I.; Shermyen, A.H.; Smith, E.M.T. Ideal Urban Form and Visions of the Good Life. Florida’s Growth Management Dilemma. J. Am. Plan. Assoc. 1990, 56, 470–482. [Google Scholar] [CrossRef]
- Samonà, G. L’Urbanistica e L’avvenire delle Città Negli Stati Europei; Laterza: Bari, Italy, 1959. [Google Scholar]
- Muscarà, C. La Geografia dello Sviluppo; Edizioni di Comunità: Milano, Italy, 1967. [Google Scholar]
- Piccinato, G.; Quilici, V.; Tafuri, M. La Città Territorio: Verso una Nuova Dimensione. Casabella Contin. 1962, 270, 16–25. [Google Scholar]
- Indovina, F. La Città Diffusa; Dipartimento di Analisi Economica e Sociale del Territorio, Istituto Universitario di Architettura: Venice, Italy, 1990. [Google Scholar]
- Young, M.D.; Wilmott, P. Family and Kinship in East London; Routledge and Kegan: Londra, UK, 1957. [Google Scholar]
- Sangiorgio, V.; Mangini, A.M.; Precchiazzi, I. A new index to evaluate the safety performance level of railway transportation systems. Saf. Sci. 2020, 131, 104921. [Google Scholar] [CrossRef]
- Del Giudice, V.; De Paola, P.; Morano, P.; Tajani, F.; Del Giudice, F.P. A Multidimensional Evaluation Approach for the Natural Parks Design. Appl. Sci. 2021, 11, 1767. [Google Scholar] [CrossRef]
- Morano, P.; Salvo, F.; De Ruggiero, M.; Tajani, F.; Tavano, D. Oligopsony Hypothesis in the Real Estate Market. Supply Fragmentation and Demand Reduction in the Economic Crisis. In Science of Valuations; Giuffrida, S., Trovato, M.R., Rosato, P., Fattinnanzi, E., Oppio, A., Chiodo, S., Eds.; Green Energy and Technology Series; Springer Nature: Cham, Switzerland, 2024; pp. 265–274. ISBN 978-3-031-53708-0. [Google Scholar]
- Guarini, M.R.; Sica, F.; Tajani, F.; Sabatelli, E.; Anelli, D. A Strategic Multidirectional Approach for Picking Indicator Systems of Sustainability in Urban Areas. Urban Sci. 2024, 8, 107. [Google Scholar] [CrossRef]
- De Paola, P.; Ferraro, M.; Manganelli, B.; Tajani, F.; Del Giudice, F.P. A model to define a real estate investment risk index for the administrative municipalities of Naples. Procedia Struct. Integr. 2024, 64, 1696–1703. [Google Scholar] [CrossRef]
- Salvo, F.; De Ruggiero, M.; Tavano, D.; De Paola, P.; Del Giudice, F.P. Analytical Implications of Mortgage Lending Value and Bottom Value. Buildings 2022, 12, 799. [Google Scholar] [CrossRef]
- Benvenuti, A.; Salvo, F.; Tavano, D. The Mortgage Lending Value (MLV): Proposal for a New Calculation Procedure. Aestimum 2024, 83, 21–31. [Google Scholar] [CrossRef]
- Bravo, G. The Human Sustainable Development Index: New calculations and a first critical analysis. Ecol. Indic. 2014, 37, 145–150. [Google Scholar] [CrossRef]
- Zhang, Y.; Wu, Z. Environmental performance and human development for sustainability: Towards to a new Environmental Human Index. Sci. Total Environ. 2022, 838, 156491. [Google Scholar] [CrossRef]
- Button, K. City management and urban environmental indicators. Ecol. Econ. 2002, 40, 217–233. [Google Scholar] [CrossRef]
- Dizdaroglu, D. Developing micro-level urban ecosystem indicators for sustainability assessment. Environ. Impact Assess. Rev. 2015, 54, 119–124. [Google Scholar] [CrossRef]
- Comim, F.; Hirai, T. Sustainability and Human Development Indicators: A Poset Analysis. Ecol. Econ. 2022, 198, 107470. [Google Scholar] [CrossRef]
- Canesi, R. A multicriteria approach to prioritize urban sustainable development projects [Un approccio multicriteri per il ranking di progetti urbani sostenibili]. Valori Valutazioni 2023, 33, 117–132. [Google Scholar] [CrossRef]
- Saaty, T.L. Decision making with the analytic hierarchy process. Int. J. Serv. Sci. 2008, 1, 83–98. [Google Scholar] [CrossRef]
- Chen, J.; Yang, S.T.; Li, H.W.; Zhang, B.; Lv, J.R. Research on Geographical Environment Unit Division Based on the Method of Natural Breaks (Jenks). Int. Arch. Photogramm. Remote Sens. Spatial Inf. Sci. 2013, 4, 47–50. [Google Scholar] [CrossRef]
- De Paola, P.; Previtera, S.; Manganelli, B.; Forte, F.; Del Giudice, F.P. Interpreting Housing Prices with a MultidisciplinaryApproach Based on Nature-Inspired Algorithms and Quantum Computing. Buildings 2023, 13, 1603. [Google Scholar] [CrossRef]
- Salvo, F.; De Ruggiero, M.; Tavano, D. Social Variables and Real Estate Values: The Case Study of the City of Cosenza. In Values, Cities and Migrations; Napoli, G., Mondini, G., Oppio, A., Rosato, P., Barbaro, S., Eds.; Green Energy and Technology Series; Springer International Publishing: Cham, Switzerland, 2023; pp. 173–186. ISBN 978-3-031-16925-0. [Google Scholar]
- Salvo, F.; De Ruggiero, M.; Tavano, D. Compensation Valuation Due to Hydraulic Constraints. In Computational Science and Its Applications—ICCSA 2021; Gervasi, O., Murgante, B., Misra, S., Garau, C., Blečić, I., Taniar, D., Apduhan, B.O., Rocha, A.M.A.C., Tarantino, E., Torre, C.M., Eds.; Lecture Notes in Computer Science Series; Springer International Publishing: Cham, Switzerland, 2021; Volume 12956, pp. 279–288. ISBN 978-3-030-87009-6. [Google Scholar]
- Salvo, F.; Romita, T.; De Ruggiero, M.; Tavano, D. Residential Tourism and Real Estate Appraisal: Turismo Residenziale e Valutazione Immobiliare. Valori Valutazioni 2020, 25, 53–58. [Google Scholar]


Disclaimer/Publisher’s Note: The statements, opinions and data contained in all publications are solely those of the individual author(s) and contributor(s) and not of MDPI and/or the editor(s). MDPI and/or the editor(s) disclaim responsibility for any injury to people or property resulting from any ideas, methods, instructions or products referred to in the content. |
© 2025 by the authors. Licensee MDPI, Basel, Switzerland. This article is an open access article distributed under the terms and conditions of the Creative Commons Attribution (CC BY) license (https://creativecommons.org/licenses/by/4.0/).