1. Introduction
Genetic selection and improved nutrition and management practices have transformed genotypic and phenotypic characteristics of the Holstein cow, with milk yield per cow being one of the most apparent phenotypic alterations [
1,
2,
3]. Multiple studies have investigated the impact of nutritional and other management practices on the milk yield and composition [
4,
5,
6,
7], but the lack of appropriate models has limited the ability to conduct direct comparisons that could assess distinct impacts of long-term genetic selection on milk composition. Thus, assessments of the impacts of selection on milk composition are forced to rely primarily on historical records and are subject to confounding by nutritional, management and environmental differences [
6,
8].
As part of a regional research effort focused on genetic selection, Dr. Charles Young initiated a breeding project at the University of Minnesota in 1964 designed to produce static, unselected Holsteins (UH) that continually represents US Holsteins in the mid-1960s and contemporary Holsteins (CH) that continually represent high-milk-yield US Holsteins [
9,
10,
11,
12]. Milk yield had been the primary focus of the project. Despite changes in the US selection indices, which have reduced the direct emphasis on milk yield, the milk yield of US Holsteins continues to increase [
2,
13]. Thus, while the milk yield of the UH cows has remained largely unchanged since the mid-1960s, the milk yield of the CH cows exceeds that of their UH herdmates by more than 4500 kg/305 d lactation [
3,
12]. Other phenotypic characteristics including reproductive function, endocrine and metabolite profiles and health disorders [
10,
11,
12], as well as genomic polymorphisms [
3], also differ between the UH and CH genotypes.
Heritability estimates indicate that milk fatty acid profiles could be altered through selection [
14,
15], but our previous investigation using a gas chromatographic evaluation of milk collected at weeks 1, 8 and 16 of lactation from UH and CH cows indicated little impact of prolonged selection on fatty acid composition [
16]. Although the analyzed samples were collected during early lactation, two of the three samples were collected after the most dynamic period of milk synthesis. In addition, triacylglycerols (TAGs) are the dominant lipid fraction (>98%) of milk [
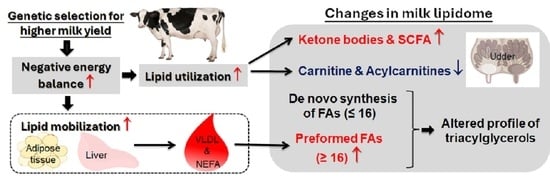
6], and the TAG content and composition were not examined in this initial evaluation. Thus, the results did not capture early alterations in milk composition as UH and CH cows adapt to the onset of lactation. These early adaptations include an increased feed intake, which increases the nutrient supply and alters rumen fermentation; mobilization of body tissues to supplement dietary inputs that are insufficient to meet the immediate increase in energy and nutrient demands of lactation; and homeorhetic alterations in tissue metabolism as substrates for milk synthesis are partitioned toward the mammary gland [
17]. These early lactation alterations can impact the amounts and proportions of individual fatty acids available for TAG synthesis [
4,
5,
6]. Selection for an increased milk yield therefore has the potential to affect the milk fatty acid content directly through genomic alterations and indirectly by altering rumen dynamics and by increasing the magnitude and duration of postpartum tissue mobilization.
As the dominant lipid fraction in milk, TAG content and composition are primary factors affecting the economic and nutritional value of milk [
6,
18,
19]. Milk TAGs contain de novo fatty acids synthesized within the mammary gland from short-chain carboxylic acids (mainly acetate and 3-hydroxybutyric acid) and preformed fatty acids absorbed from the blood stream [
4,
5,
6]. Preformed fatty acids are derived from dietary lipids, lipogenesis in the liver and adipose tissue and rumen fermentation where odd-chain fatty acids are produced by rumen microbes [
20]. More than 400 fatty acids have been identified in milk [
6,
21]. Esterification of these diverse fatty acids to the three hydroxyl groups of glycerol allows for tremendous structural variation and makes milk fat the most complex natural fat [
6,
21]. Investigators continue to examine factors that regulate milk fat synthesis [
22] and the impact of milk lipids on digestion and absorption [
23], seek to identify biomarkers to assess a cow’s physiological or metabolic disease status [
24] and investigate opportunities to develop breeding programs designed to alter the fatty acid content of bovine milk [
25].
Liquid chromatography–mass spectrometry (LC-MS)-based analysis has become a robust and versatile platform for characterizing compounds in multiple sample types including milk samples from different species, physiological statuses and physical conditions [
21,
26,
27,
28]). In this study, we conducted an LC-MS-based analysis of milk samples collected from UH and CH cows during the first 9 weeks of lactation to determine individual TAGs, fatty acids and short-chain carboxylic acids’ profiles. Our objective was to determine if 50 years of selection of US Holsteins has altered the profiles of these lipid metabolism-related molecules in milk during the dynamic transition period.
2. Materials and Methods
Chemicals and reagents. LC-MS-grade water, acetonitrile (ACN) and isopropanol (IPA) were purchased from Thermo Fisher Scientific (Houston, TX, USA); 2-hydrazinoquinoline (HQ) and triphenylphosphine (TPP) from Alfa Aesar (Ward Hill, MA, USA); 2,2′-dipyridyl disulfide (DPDS) from MP Biomedicals (Santa Ana, CA, USA); n-butanol, short-chain carboxylic acids, carnitine and acylcarnitines from Sigma-Aldrich (St. Louis, MO, USA); fatty acid standards from Nu-Chek-Prep (Elysian, MN, USA); and 1,2-13C2-palmitic acid from CDN Isotopes (Pointe-Claire, QC, Canada).
Animals, experimental design and sample collection. Multiparous UH and CH candidates for this study (14 cows/genotype) were housed in a tie-stall barn for at least 10 weeks prior to parturition, subjected to the same management procedures and exposed to the same environmental conditions. The UH and CH cows were fed the same pre- and postpartum diets throughout this study and cows in adjacent stalls shared a waterer. Diets were formulated as total mixed rations designed to meet the nutritional needs of contemporary Holsteins [
29] and cows were fed once daily. The diets were primarily composed of corn silage, grass hay, alfalfa hay and a grain mix. Per kilogram of dry matter, the energy and protein content of the prepartum and postpartum diets were 1.45 and 1.65 Mcal of net energy and 157 and 168 g crude protein, respectively. Cows were milked at approximately 12 h intervals in a double-5 herringbone parlor in the same barn and individual milk yields (kg/milking) recorded. Milk samples (30 mL) for component analyses were collected from proportional flow samplers every Tuesday night milking during the first 9 weeks of lactation. Aliquots were stored at −80 °C until subsequent processing for metabolite analysis or preserved with dichromate and shipped the next day (Minnesota Dairy Herd Improvement Association Laboratory; Zumbrota, MN) for determination of the macronutrient (protein, lactose and fat) content using infrared spectroscopy. The energy balance of each cow was determined according to the NRC (2001) [
29], as described by Carriquiry et al. (2009) [
30]. Liver [
31], tailhead adipose [
32] and mammary gland [
33] biopsies were collected 2 to 4 h after the morning milking on −14 ± 3, 3 ± 1, 14 ± 3 and 42 ± 3 days in milk (DIM). Each individual mammary quarter was only biopsied once during this study. The results from a transcript analysis of these tissue biopsies will be presented in subsequent work. Cows were observed daily for common subclinical and clinical signs of illness and injuries and treated if warranted. Animal care and experimental procedures were approved by the University of Minnesota Institutional Animal Care and Use Committee (1207B17664, approval date 18 July 2012).
LC-MS analysis of milk lipids. All frozen samples were analyzed within 6 months after the final samples were collected. To solubilize the neutral lipids, whole milk was vortexed at room temperature for 5 s before 5 µL of this homogenized milk was mixed with 245 µL of n-butanol and vortexed for another 5 sec. This vortexed mixture was centrifuged at 18,000×
g for 10 min to remove proteins and precipitates. The supernatant was transferred to an HPLC vial for the LC-MS analysis. To conduct the LC-MS analysis, 5 µL of an aliquot of the supernatant was injected into an Acquity ultra-performance liquid chromatography (UPLC) system (Waters, Milford, MA, USA) and components separated by a BEH C8 column (Waters) using a mobile-phase gradient: A: H
2O:ACN = 60:40 (
v/
v) containing 0.1% formic acid (
v/
v) and 10 mM ammonium acetate, and B: IPA:H
2O = 90:10 (
v/
v) containing 0.1% formic acid (
v/
v) and 10 mM ammonium acetate. The UPLC eluant was introduced into a Xevo-G2-S quadrupole time-of-flight mass spectrometer (QTOFMS, Waters) for accurate mass measurement and ion counting. The capillary voltage and cone voltage for electrospray ionization were set at 3 kV and 30 V for positive-mode detection, respectively. The source temperature and desolvation temperature were set at 120 °C and 350 °C, respectively. Nitrogen was used as the cone gas (50 L/h) and desolvation gas (600 L/h) and argon as the collision gas. For accurate mass measurement, the mass spectrometer was calibrated with sodium formate solution with a mass-to-charge ratio (
m/
z) of 50–1000 and monitored by the intermittent injection of the lock mass leucine enkephalin ([M + H]
+ =
m/
z 556.2771 and [M − H]
− =
m/
z 554.2615) in real time. Mass chromatograms and mass spectral data were acquired and processed by MassLynx
TM V4.2 software (Waters) in centroided format. Additional structural information was obtained from tandem MS (MSMS) fragmentation with collision energies ranging from 15 to 40 eV [
34].
LC-MS analysis of milk fatty acids. Milk lipids were hydrolyzed to release free fatty acids using a modified alkaline hydrolysis method [
35]. Briefly, 5 µL of milk sample was mixed with 200 µL of methanol containing 200 µM 1,2-
13C
2-palmitic acid as the internal standard and hydrolyzed by adding 35 µL of 40% potassium hydroxide (
w/
v). The mixture was incubated at 60 °C for 30 min and then neutralized by 60 µL of 2.5 M HCl and 200 µL of phosphate buffer (75 mM, pH = 7). After a 10 min centrifugation at 18,000×
g, the supernatant containing free fatty acids was collected and further derivatized for LC-MS analysis. To derivatize free fatty acids, 2 µL of sample or fatty acid standard was mixed with 100 µL of freshly prepared master reaction solution containing 1 mM DPDS, 1 mM TPP and 1 mM HQ in ACN. The mixture was incubated at 60 °C for 30 min and chilled on ice for 10 min. The reaction was terminated by mixing with 100 µL of H
2O. After a 10 min centrifugation at 18,000×
g, the supernatant was transferred into an HPLC vial. For LC-MS analysis, 5 µL of HQ-derivatized sample was injected into an Acquity UPLC system (Waters) and separated by a BEH C18 column (Waters, Milford, MA, USA) using a gradient ranging from water to 95% aqueous ACN containing 0.1% formic acid over a 10 min run.
LC-MS analysis of milk short-chain carboxylic acids. Milk samples were derivatized by HQ, without hydrolysis, for the LC-MS analysis of short-chain carboxylic acids [
36]. The derivatization procedure, LC gradient and the MS parameters are the same as the ones used for the LC-MS analysis of free fatty acids, except the mobile phase of A: H
2O containing 0.05% acetic acid (
v/
v) and 2 mM ammonium acetate and B: H
2O:ACN = 5:95 (
v/
v) containing 0.05% acetic acid (
v/
v) and 2 mM ammonium acetate.
Marker identification through multivariate data analysis. Chromatographic and spectral data from LC-MS analysis of milk samples were visualized in 2D plots using MZmine software V1 [
37] and deconvoluted by MarkerLynx
TM software V4.2 (Waters). A multivariate data matrix containing information on sample identity, ion identity (retention time and
m/
z) and ion abundance was generated through centroiding, deisotoping, filtering, peak recognition and integration. The intensity of each ion was calculated by normalizing the single ion counts versus the total ion counts in the whole chromatogram. The processed data matrix was further transformed by
Pareto scaling and analyzed by principal component analysis (PCA) and orthogonal partial least squares-discriminant analysis (OPLS-DA). Major latent variables in the data matrix were described in a scores scatter plot of a defined multivariate model. Potential metabolite markers for the UH and CH genotypes were identified by analyzing ions contributing to the separation of sample groups in an S-loading plot of the OPLS-DA model. After
Z score transformation, the concentrations or relative abundances of identified metabolite markers in the examined samples were presented in the heat maps generated by the R program V4.3.1 (
http://www.R-project.org (accessed on 21 February 2025)), and correlations among these metabolite markers were defined by hierarchical clustering analysis.
Marker characterization and quantification. The chemical identities of metabolite markers were determined by accurate mass measurement, elemental composition analysis, a database search, MSMS fragmentation and comparisons with authentic standards, if available. Database searches were performed using the Human Metabolome, Kyoto Encyclopedia of Genes and Genomes and Lipid Maps databases. Individual metabolite concentrations were determined by calculating the ratio between the peak area of metabolite and the peak area of internal standard and fitting with a standard curve using QuanLynxTM V4.2 software (Waters).
Statistical analysis. Of the 28 cows enrolled, 1 UH cow was removed due to metritis and 1 CH calved early. Their removal resulted in the removal of their potential pair-mates because their calving dates differed. Cows were paired (1 per genotype) by actual calving date and the interval between calvings was <21 d for each pair. Effects of genotype, week of lactation and their interaction on milk yield and component (as concentration or relative abundance) were analyzed by repeated measures using the PROC MIXED procedure of SAS V7.1. Week of lactation was the repeated effect with compound symmetry as the covariance structure. The correlation of mean energy balance during weeks 1 to 4 with milk oleic acid concentrations was determined using the PROC CORR procedure of SAS. Experimental values are reported as the mean ± standard error of the mean (SEM) and considered to differ when p < 0.05.
3. Results
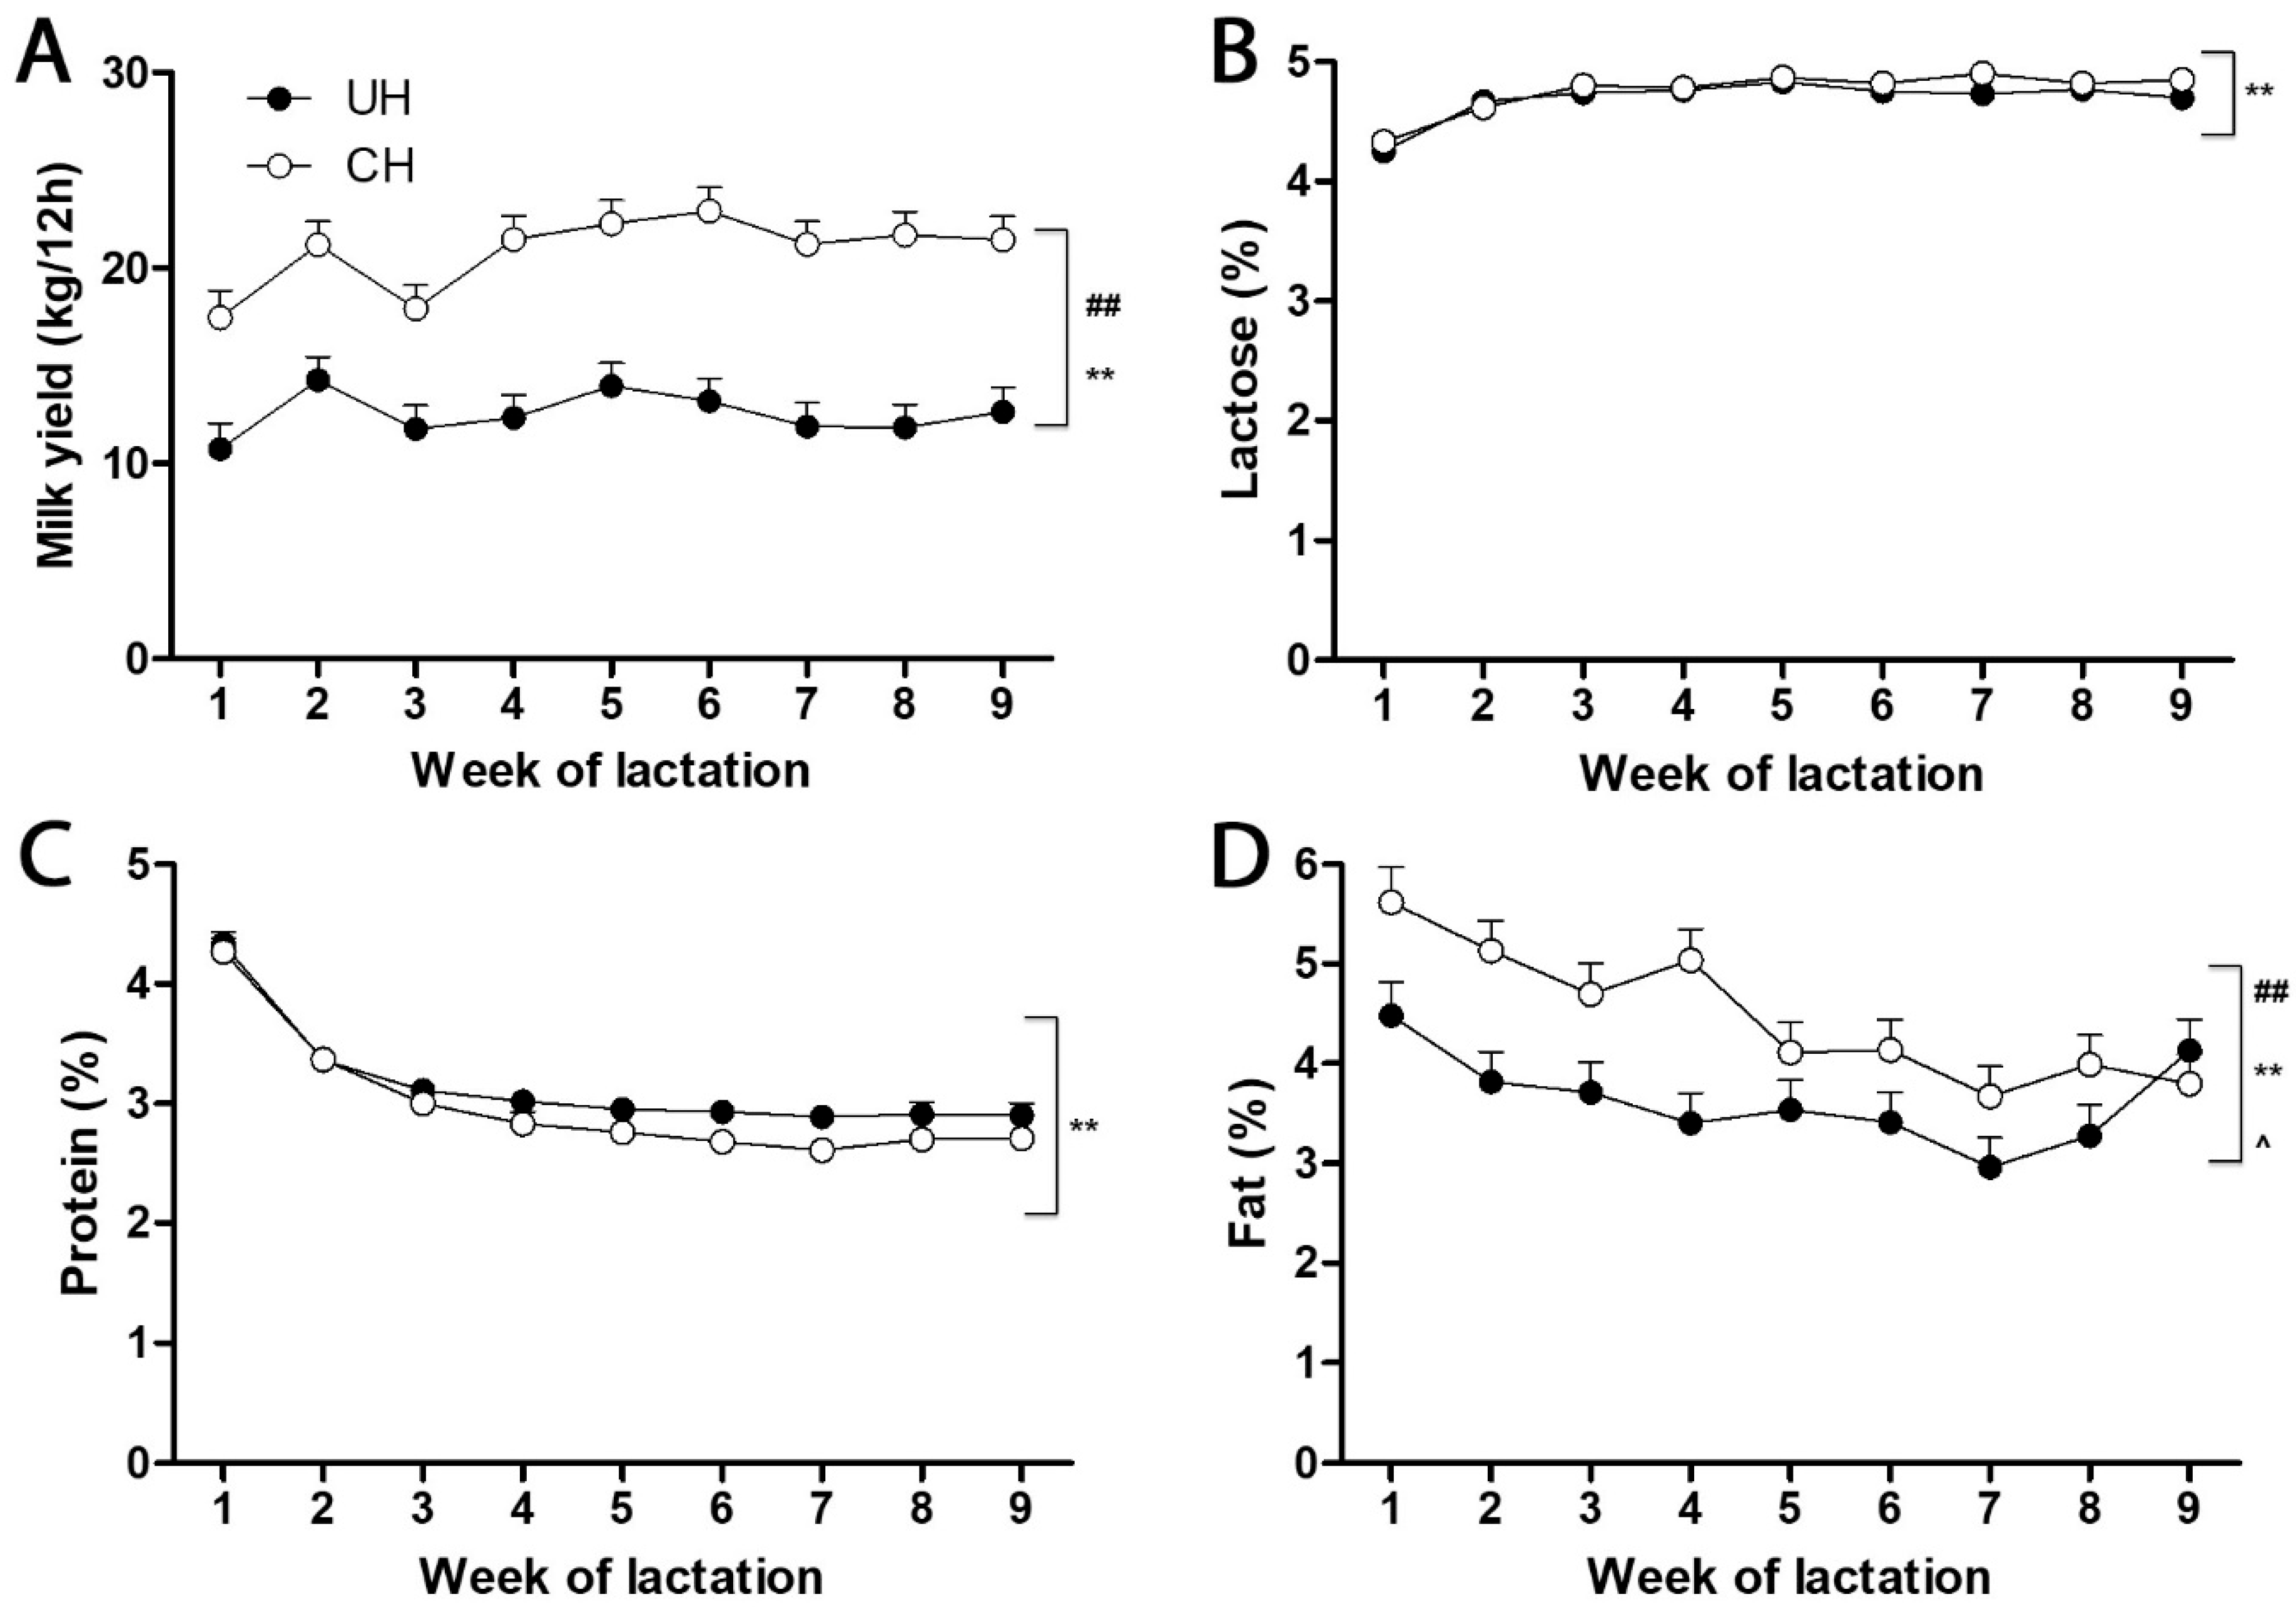
Feed intake, milk yield and macronutrient content and energy balance. Prepartum dry matter intake (DMI) did not differ between UH and CH cows (11.5 vs. 12.3 ± 0.77 kg/d) but UH cows consumed less than CH cows (17.2 vs. 21.6 ± 0.96 kg/d, respectively;
p < 0.01) during weeks 1 to 9 of lactation. The CH cows produced more milk than UH cows (
Figure 1A), and typical time-dependent alterations in milk yield and macronutrient content (
Figure 1B–D) occurred during this interval. Milk lactose and protein contents did not differ between UH and CH cows (
Figure 1B,C). In contrast, CH milk contained more fat than UH milk, but this difference decreased and milk fat contents became similar as lactation progressed (
Figure 1D). Although postpartum DMI increased in UH and CH cows, neither UH nor CH cows consumed enough to meet the additional demands of early lactation. The energy balances at week 1, 2, 3, 4, 5, 6, 7, 8 and 9 of lactation were −4.47, −2.71, −0.68, 1.28, 1.16, 1.36, 2.93, 2.05 and 3.98 Mcal net energy of per day (NEL/d), respectively, for UH cows, and −14.8, −11.8, −8.76, −6.95, −6.29, −5.92, −4.17, −4.55 and −2.33 Mcal NEL/d, respectively, for CH cows. This more severe negative energy balance of the CH cows was reflected in their greater loss of body weight (11 vs. 60 kg) and body condition score (0.1 vs. 1.0 units on a 5-point scale) from weeks l to 9 of lactation. No clinical signs of ketosis or other metabolic disorders were noted.
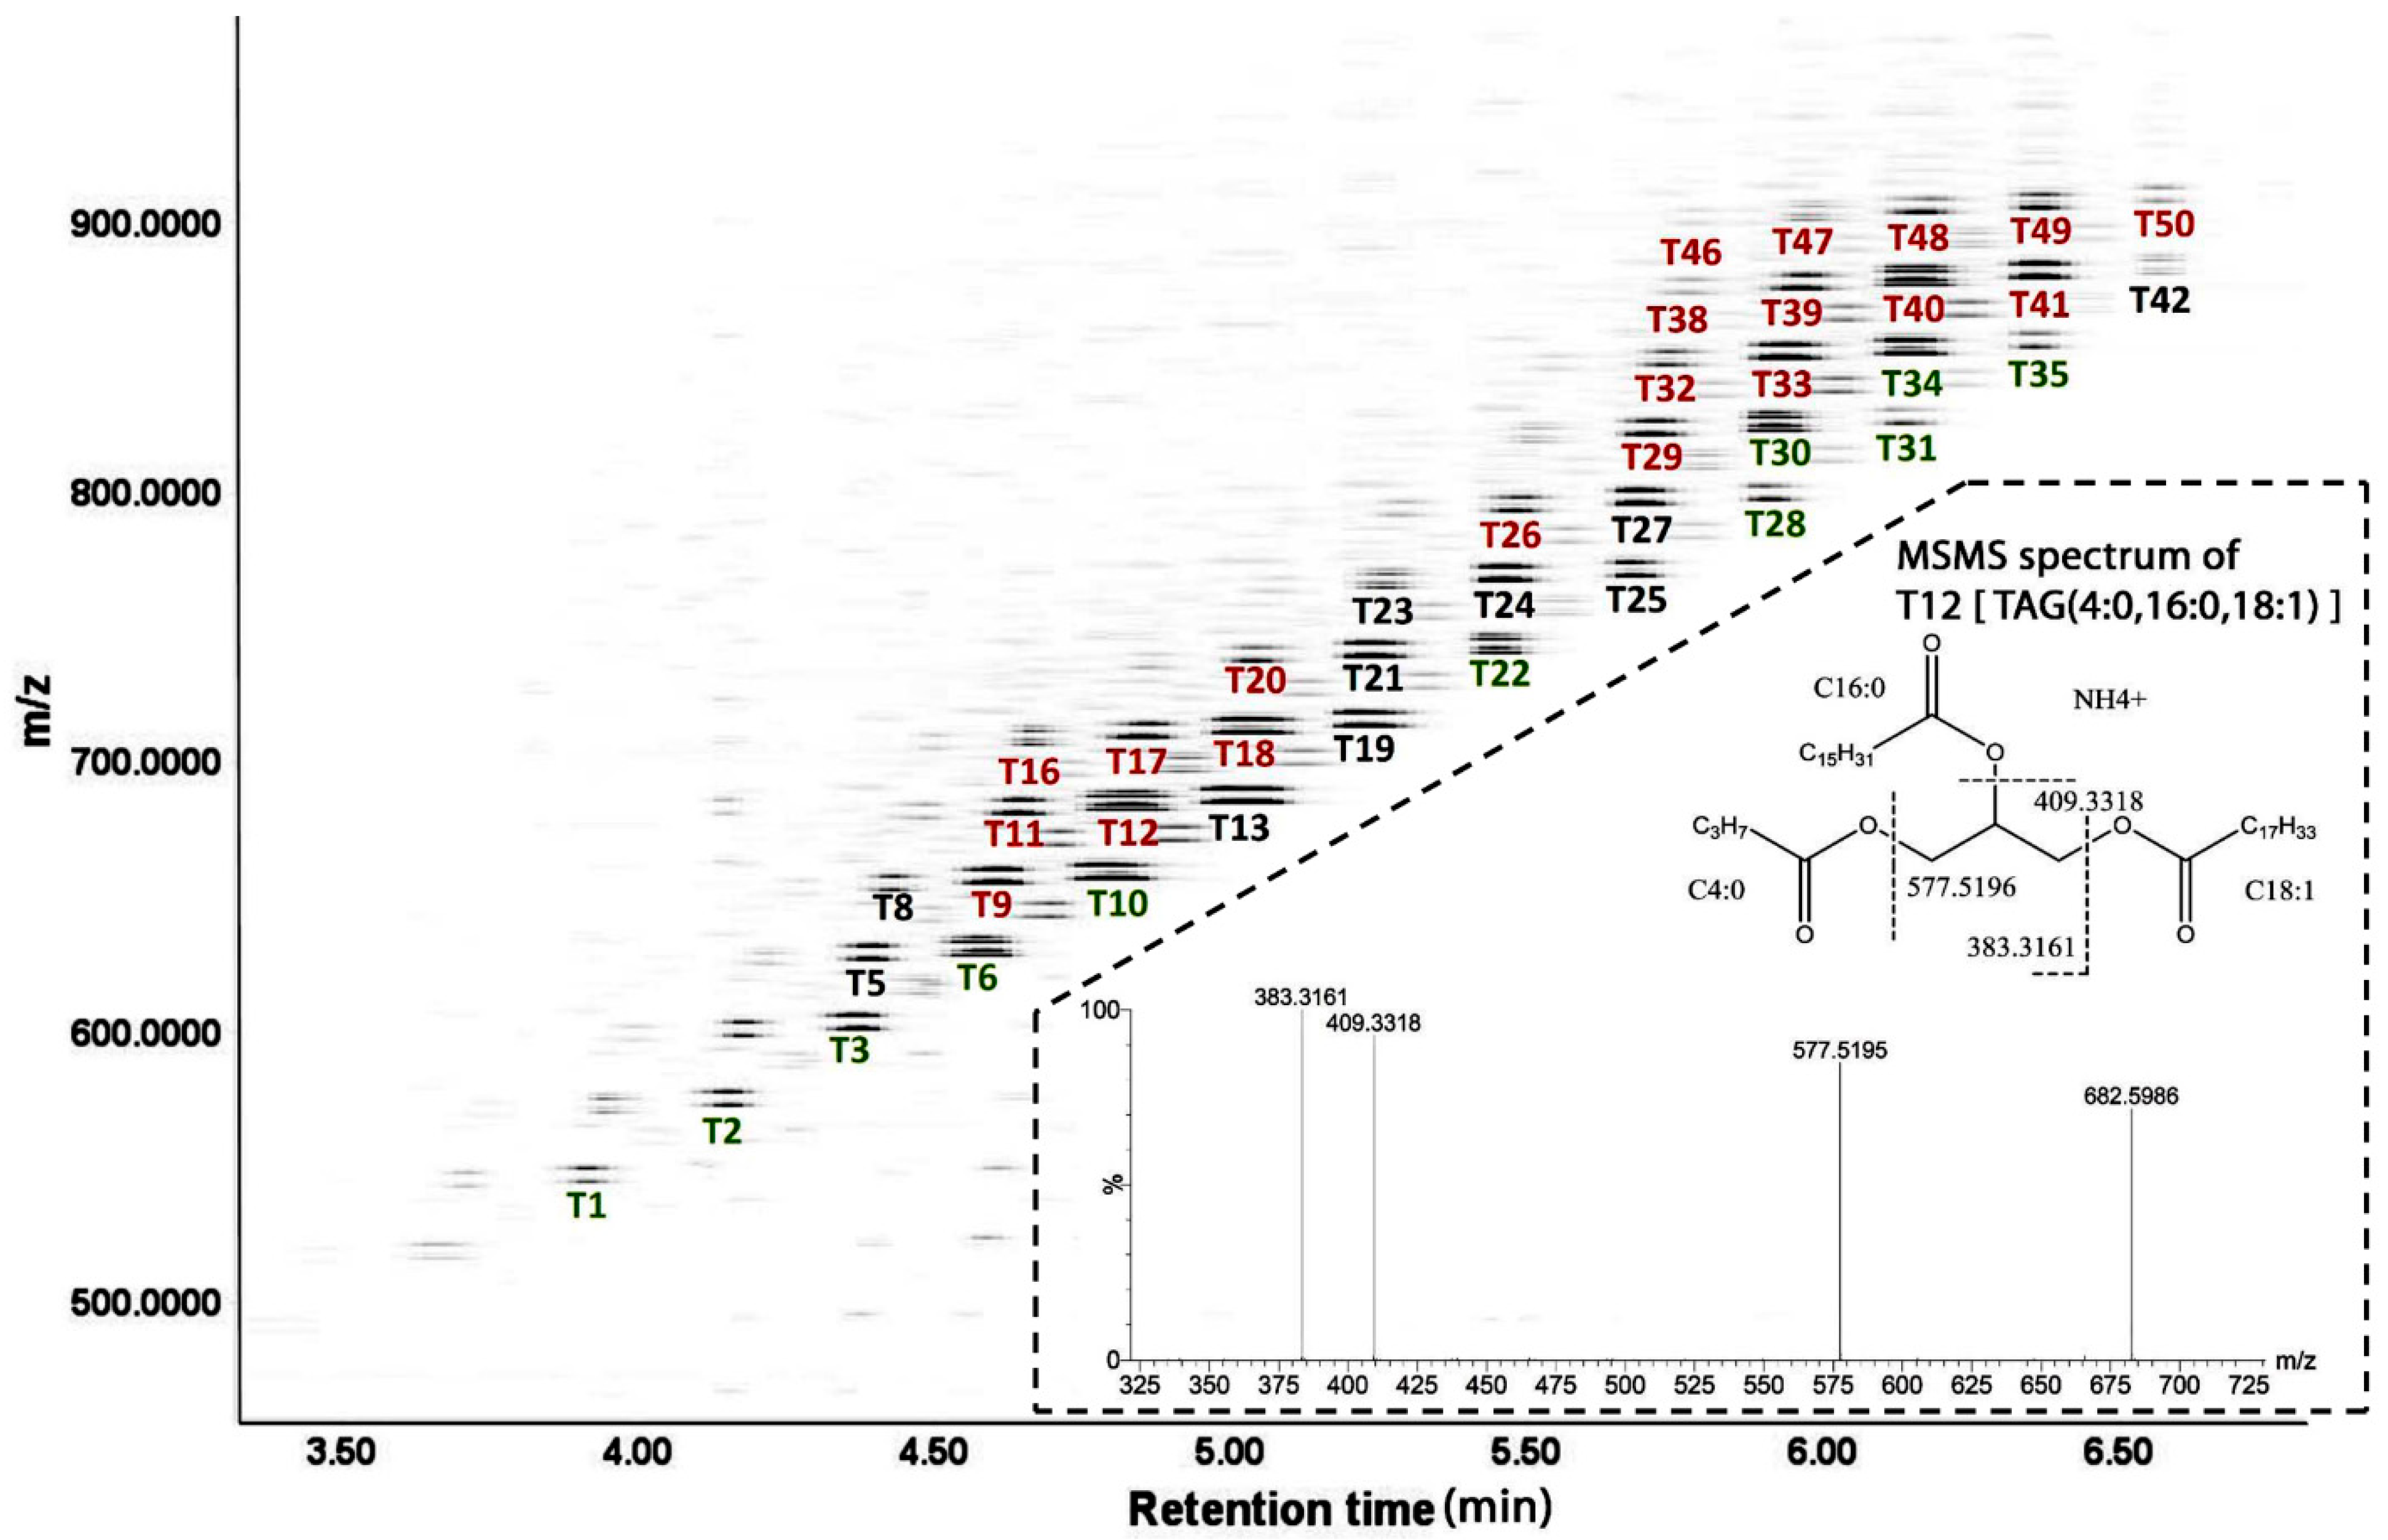
TAGs in UH and CH milk. The LC-MS-based lipidomic analysis of UH and CH milk detected hundreds of TAG species with different molecular weights, unsaturation levels and abundances (
Figure 2). As exemplified by the MSMS spectrum of T12 [TAG (4:0, 16:0, 18:1)] in the insert of
Figure 2, the fatty acid compositions of the 50 most abundant TAG species were determined based on the product ions from MSMS fragmentation (
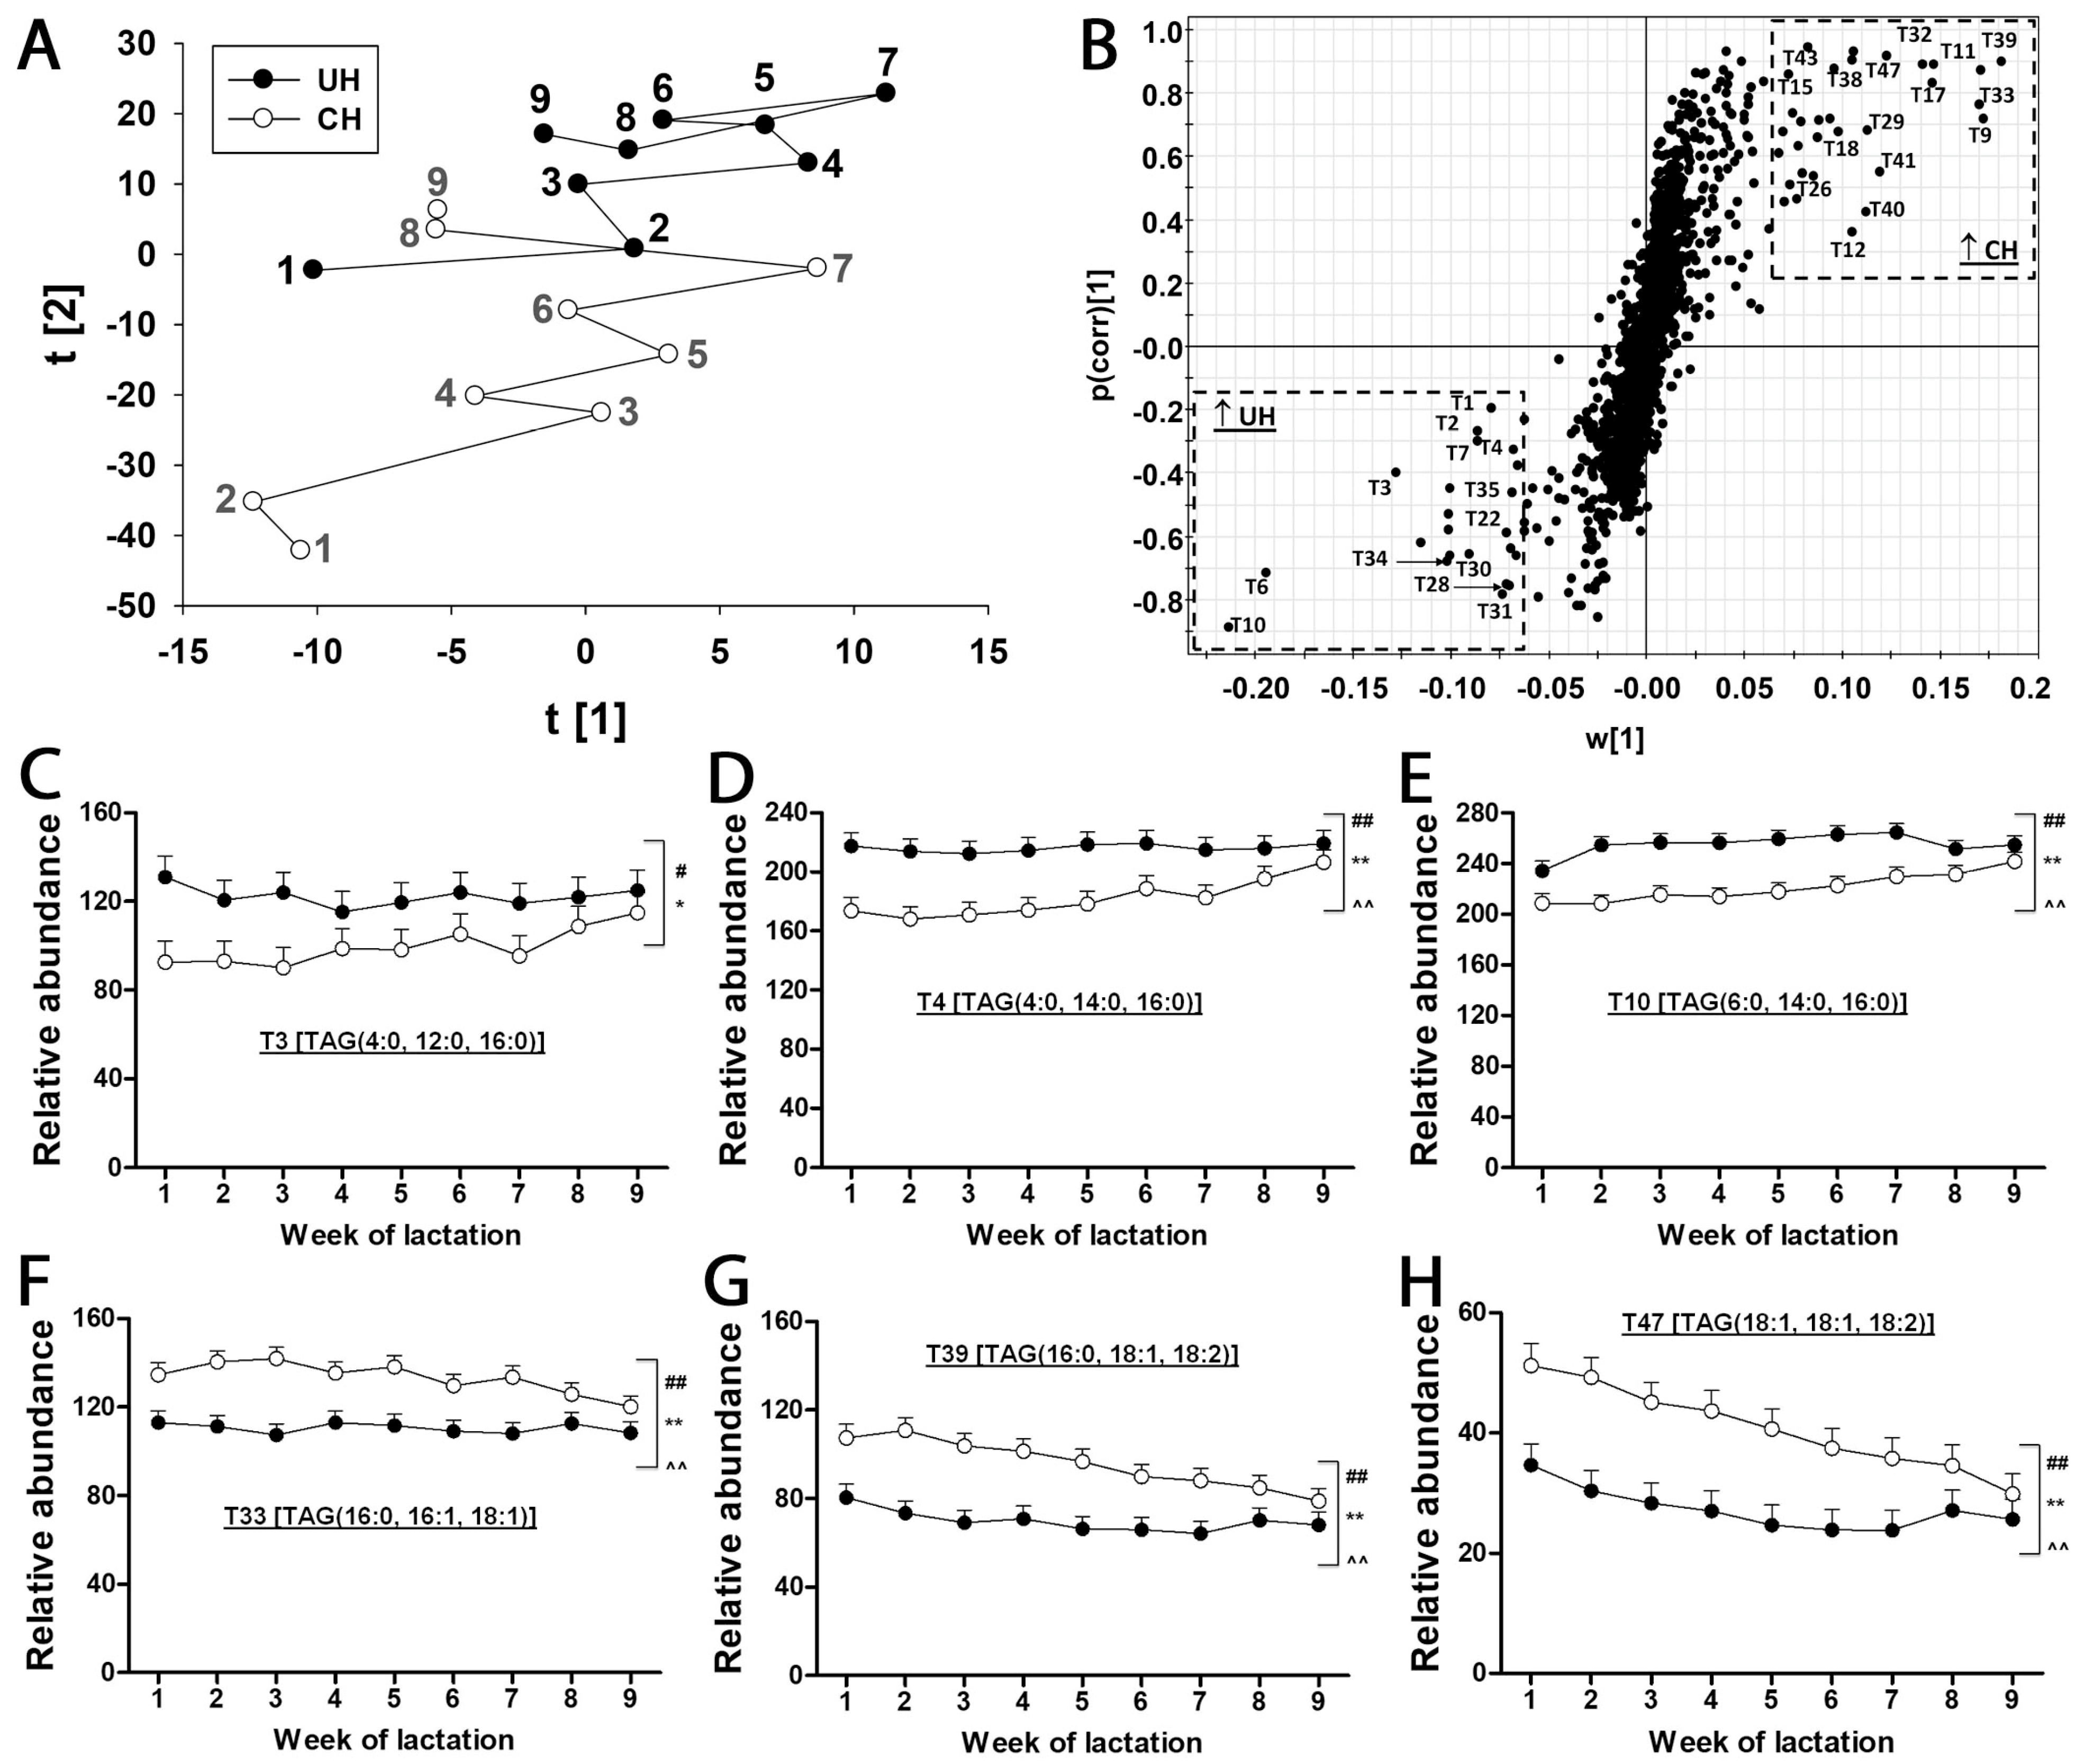
Table 1). The composition of milk lipids was defined by a PCA model, in which the distribution patterns of weekly samples reflect the differences between UH and CH milk and the kinetics of their compositional changes during the first 9 weeks of lactation (
Figure 3A). As indicated by the distances between weekly CH and UH means in the model, the differences between UH and CH in the first three weeks of lactation were much greater than the differences at week 9 of lactation (
Figure 3A). Moreover, the distances between week 1 and week 9 in the model indicate that the composition of CH milk underwent more dramatic changes than that of UH milk (
Figure 3A). The TAG markers more prevalent in either CH or UH milk were identified in the loading S-plot of an OPLS-DA model (
Figure 3B and
Table 1). Interestingly, all identified TAG markers of UH cows contain at least two fatty acids with aliphatic tails no longer than 16 (≤16) carbons (
Figure 3C–E and
Table 1), while all identified TAG markers of CH cows, except T9, contain at least two fatty acids with aliphatic tails no shorter than 16 (≥16) carbons (
Figure 3F–H and
Table 1). Furthermore, the relative abundances of these markers became more comparable between the two genotypes at week 9 of lactation (
Figure 3C–H), which is consistent with the pattern of sample distribution in the PCA model (
Figure 3A). In addition to genotype-dependent differences in the relative abundances and fatty acid compositions of milk TAGs, time (week of lactation) and genotype–time interactions also impacted the relative abundance of these identified TAG markers (
Figure 3C–H).
Fatty acid composition of UH and CH milk. To further characterize the genotype-dependent difference in the fatty acid composition of milk TAGs, the concentrations of fatty acids in hydrolyzed milk were determined by the LC-MS analysis of their hydrazide derivatives formed by the reactions with 2-hydrazinoquinoline (HQ), as shown by the MSMS spectrum of myristic acid (
Figure 4A). Using this method, 26 fatty acids with aliphatic chains ranging from 4 to 22 carbons (C4–C22) in milk were detected and quantified (
Figure 4B and
Table S1). The results from calculating the average concentrations of individual fatty acids in all 9 weeks of lactation showed that CH milk had higher concentrations of C16–18 fatty acids, except conjugated linoleic acid (CLA) and γ-linolenic acid (GLA), than UH milk (
Figure 4C,D and
Figure S1G–K), while the concentrations of C4–14 fatty acids were comparable between these genotypes (
Figure 4C and
Figure S1A–F). The mean energy balance during weeks 1 to 4 was highly correlated with C18:1 concentration. Overall correlations for weeks 1, 2, 3 and 4 were r = −0.44, −0.52, −0.58 and −0.64 (all
p < 0.01), respectively, and were similar within each genotype.
The average concentrations of docosapentaenoic acid (DPA) and docosahexaenoic acid (DHA), two ω-3 fatty acids, were lower in CH milk than in UH milk, even though the concentration of α-linolenic acid (ALA), their precursor, was greater in CH milk (
Figure 4D). The total fatty acid concentration was greater in CH milk than in UH milk (
Figure S1L), which is consistent with the fat contents in these milk samples (
Figure 1D). Interestingly, when these fatty acid concentrations were converted to their relative abundance (%) in the total sum of measured fatty acids, several of the C8 to C14 fatty acids, including caprylic acid (C8:0), lauric acid (C12:0) and myristic acid (C14:0), had greater relative abundances in UH than in CH milk (
Figure S1A–F) while the abundances of most C16 to C18 fatty acids, except palmitoleic acid (C16:1) and linoleic acid (C18:2), were comparable between UH and CH milk (
Figure S1G–L). The ratio of preformed vs. de novo FA, defined by (C17–C22)/(C4–C14), was relatively stable in UH milk but gradually decreased in CH milk (
Figure 4E). Moreover, the ratio of saturated fatty acids (SFAs) vs. unsaturated fatty acids (UFAs) was impacted by time and a genotype–time interaction, but not by genotype alone (
Figure 4F).
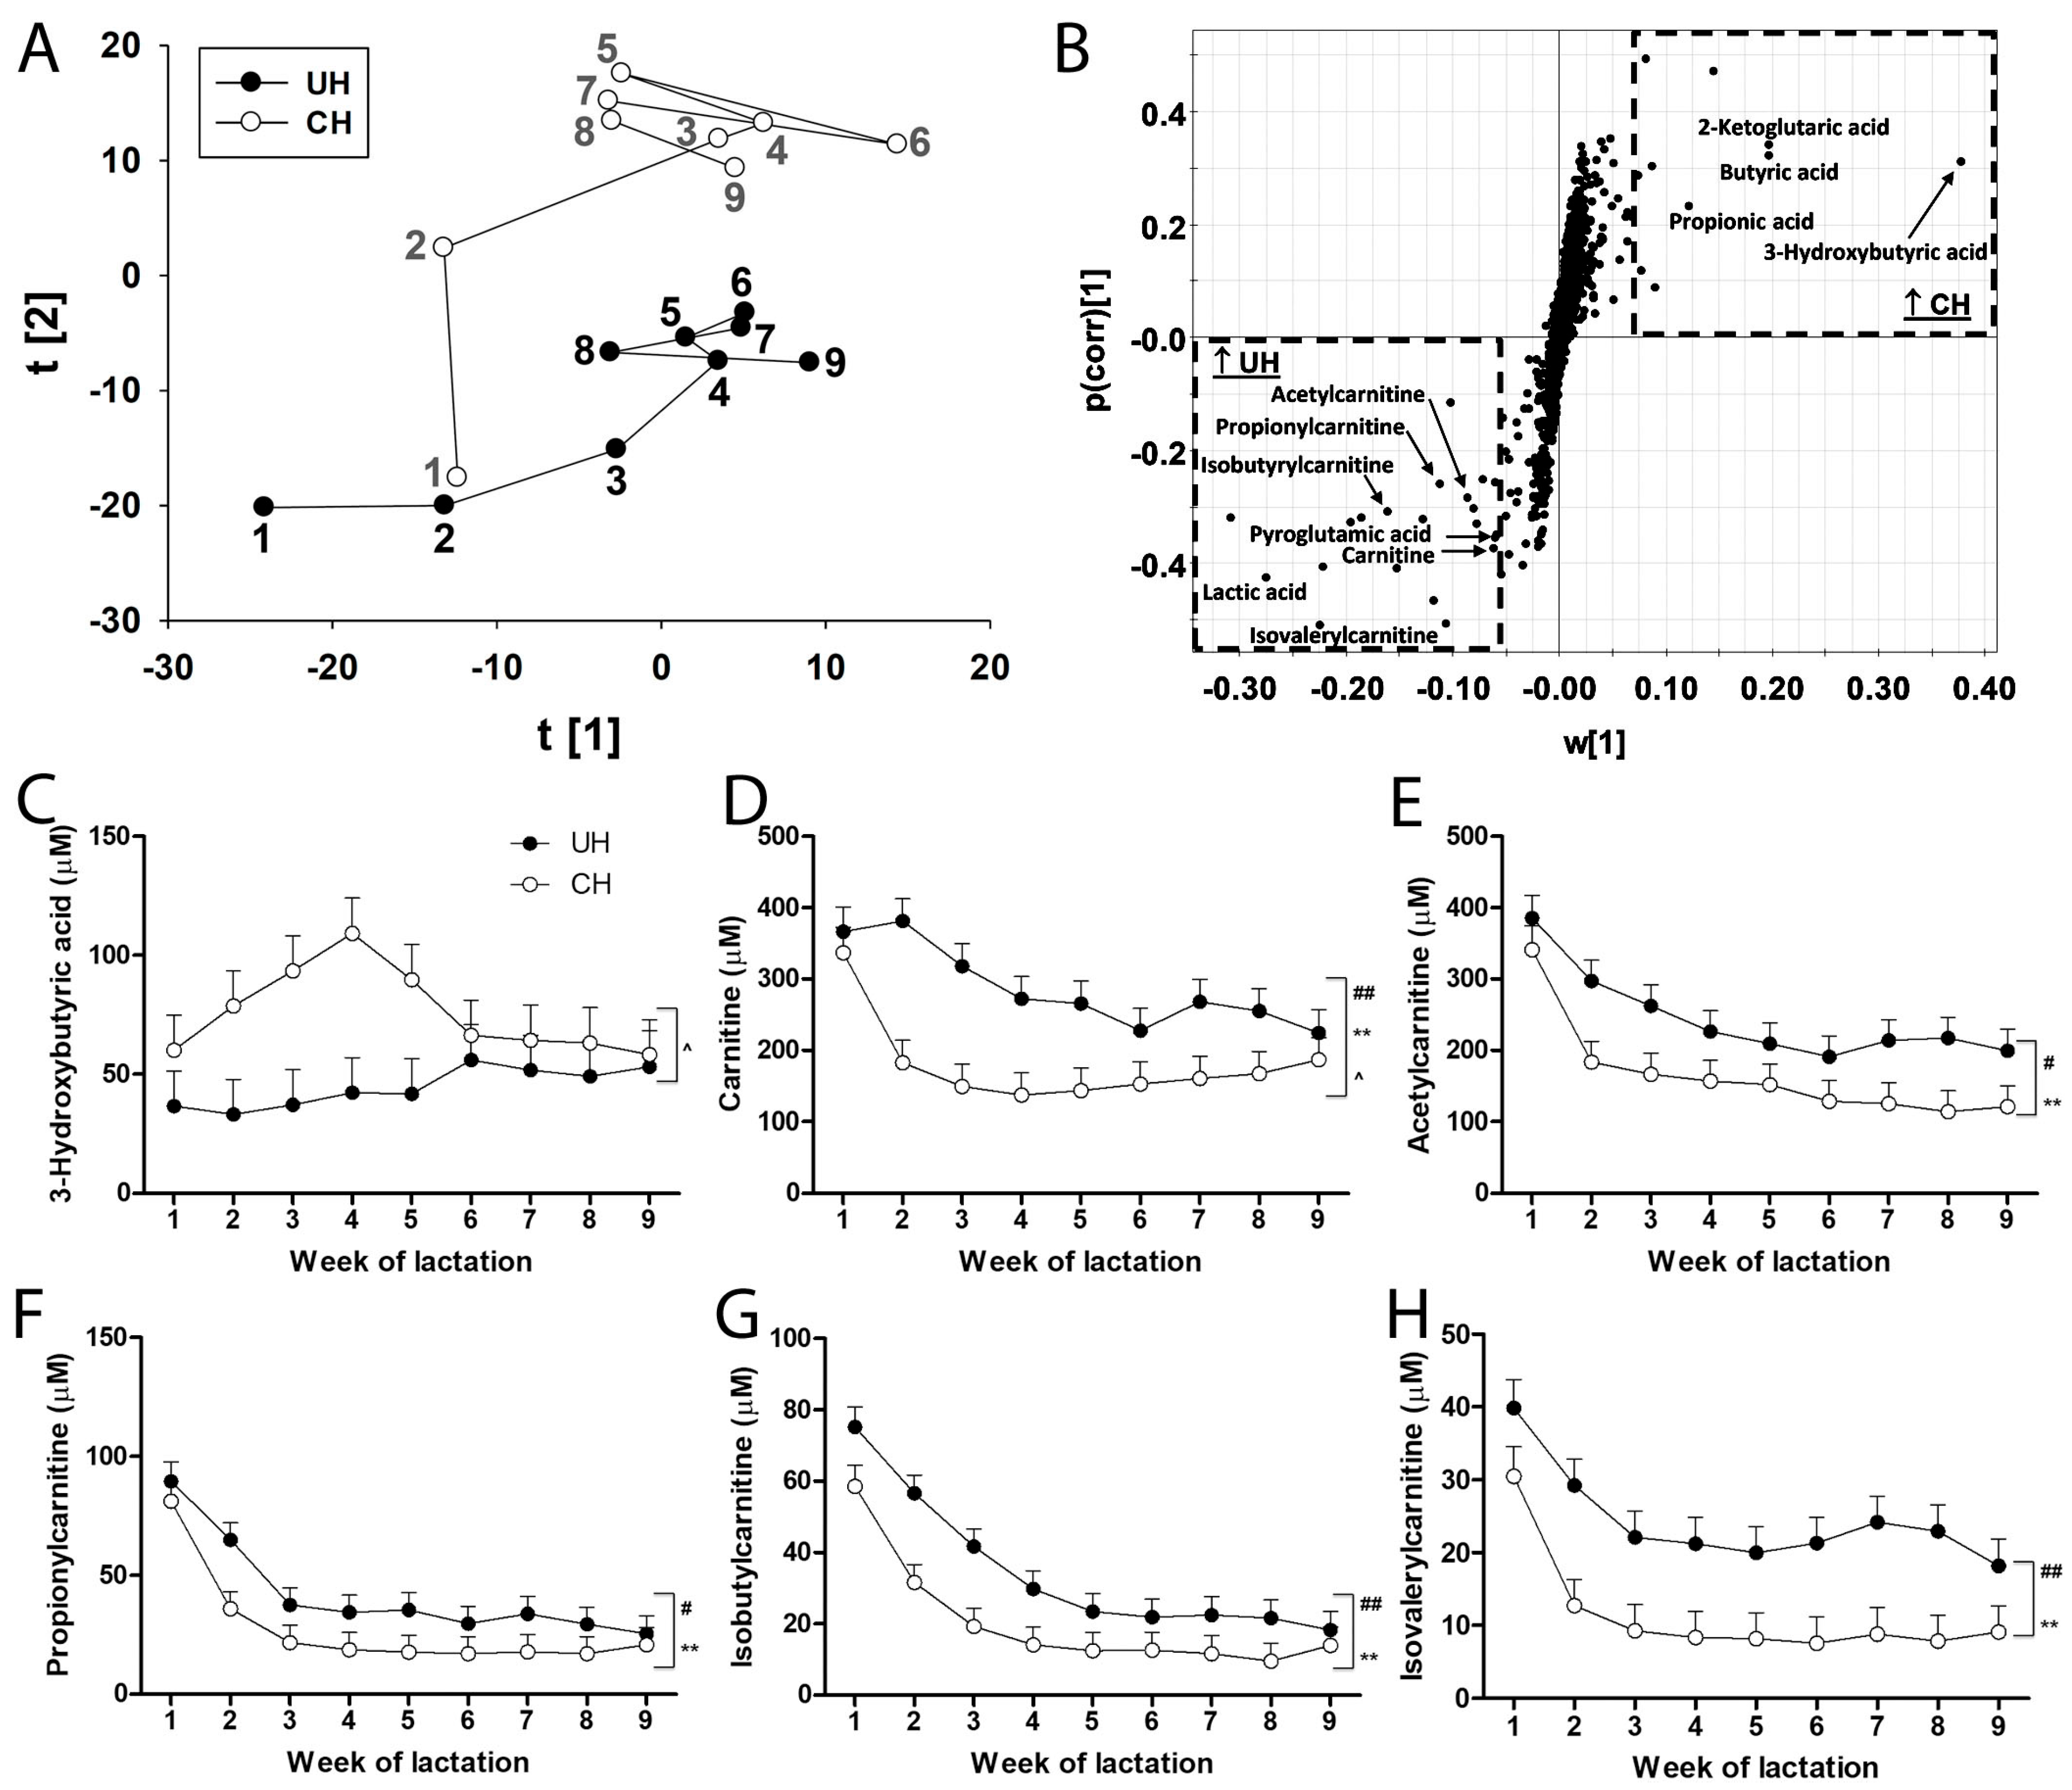
Short-chain carboxylic acids in UH and CH milk. Short-chain carboxylic acids are precursors in de novo fatty acid synthesis as well as metabolites in fatty acid oxidation and transport. Their profiles in UH and CH milk during the first 9 weeks of lactation were defined by LC-MS analysis and multivariate modeling. The distribution of weekly UH and CH samples in the score plot of a PCA model revealed genotype-dependent differences and time-dependent changes in short-chain carboxylic acids, especially during the first 3 weeks of lactation (
Figure 5A). Further analysis of the short-chain carboxylic acids contributing to the genotype-dependent separation in the loading S-plot of the OPLS-DA model identified butyric acid, propionic acid, 3-hydroxybutyric acid and 2-ketoglutaric acid as markers that were more prevalent in CH milk and carnitine, acetylcarnitine, propionylcarnitine, isobutyrylcarnitine, isovalerylcarnitine, pyroglutamic acid and lactic acid as markers that were more prevalent in UH milk (
Figure 5B).
There was an interaction between genotype and time on concentrations of 3-hydroxybutyric acid (
Figure 5C), carnitine (
Figure 5D) and butyric acid (
Figure S3A). These interactions were mainly due to the occurrence of transient (1 sample/cow, n = 4 cows) and persistent (>4 samples/cow, n = 2 cows) subclinical ketosis (milk 3-hydroxybutyric acid > 100 µM) in individual CH cows (
Figure S2). Removing the 2 CH cows with persistent subclinical ketosis from the analysis eliminated the genotype–time interaction on the concentration of 3-hydroxybutyric acid (
p values were 0.11, 0.10 and 0.18 for genotype, time and their interaction, respectively) and on the concentrations of carnitine and butyric acid, but did not alter the effects of genotype or time on carnitine and 4 acylcarnitines. Even though UH milk consistently contained more of these carnitine metabolites than CH milk, concentrations of these components in both genotypes continually decreased from weeks 1 to 4 and became relatively stable thereafter (
Figure 5D–H). Moreover, concentrations of lactic acid in UH milk were greater than in CH milk (
Figure S3B).
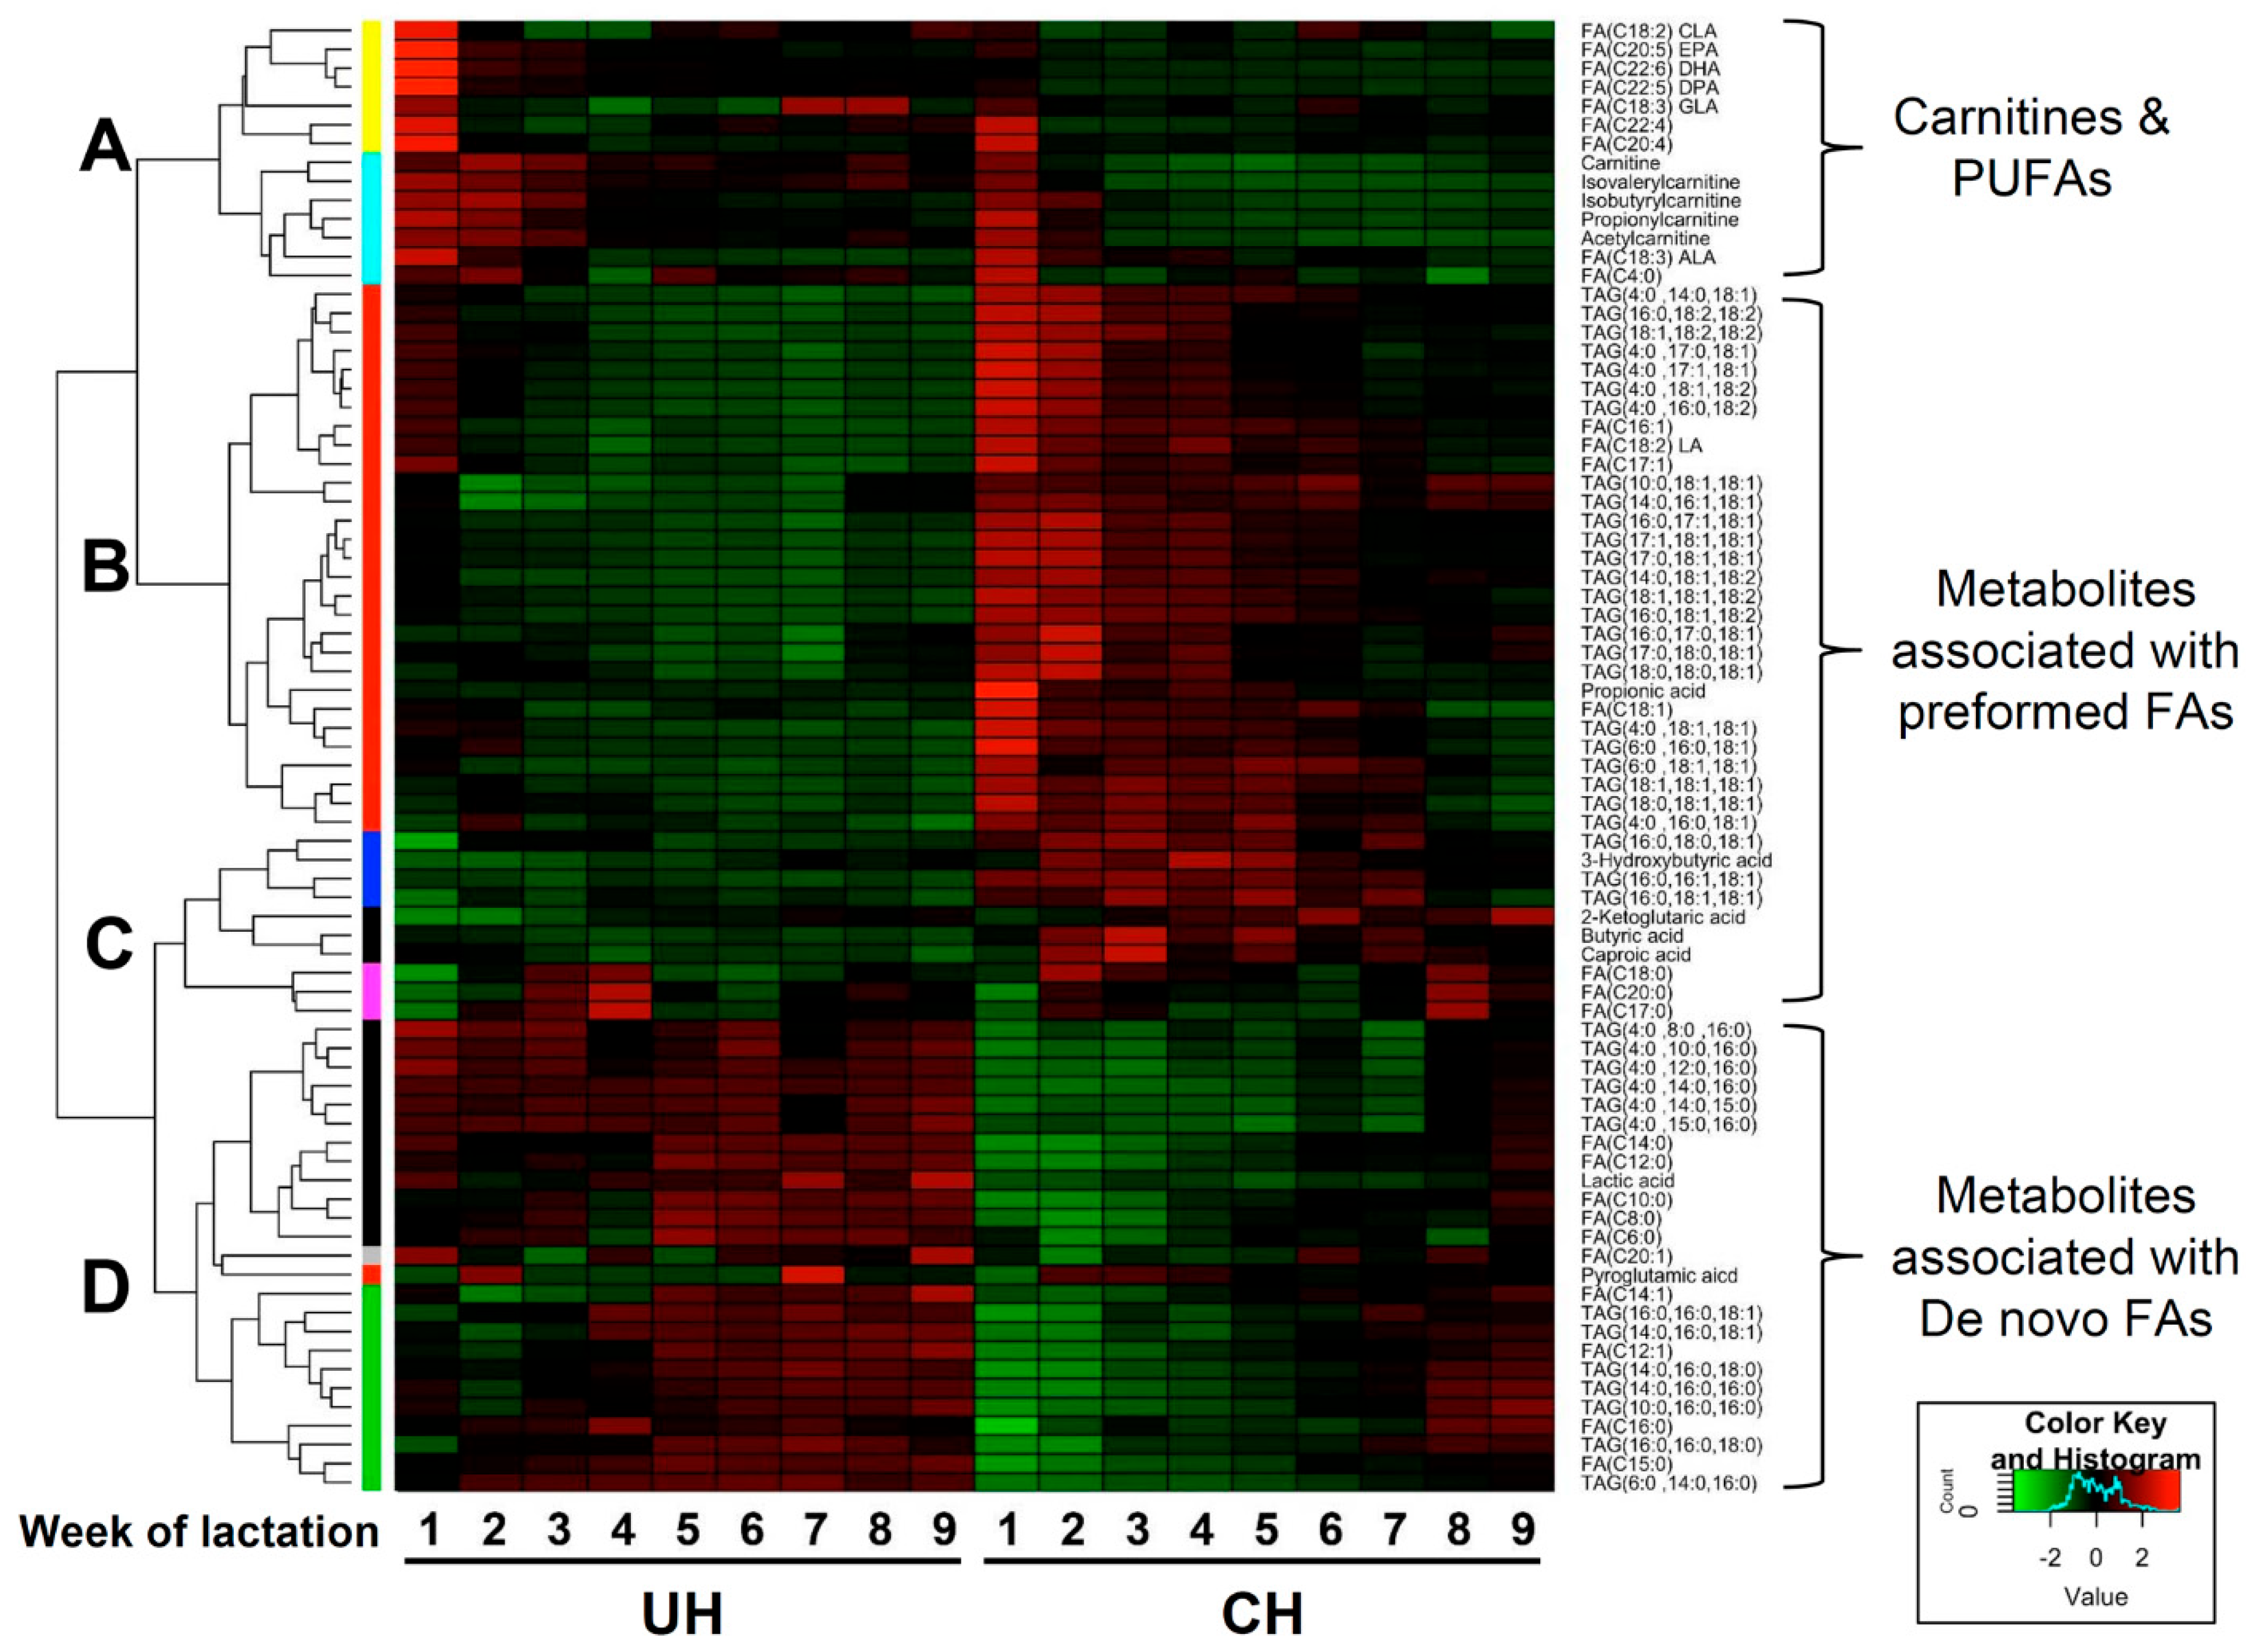
Clustering analysis of UH and CH milk lipidomes. The hierarchical clustering analysis based on the relative abundances of identified TAGs, FAs and short-chain carboxylic acids during the first 9 weeks of lactation produced a heat map with four major clusters (
Figure 6). Cluster A contains metabolites that were more abundant in UH milk and that also gradually decreased in both CH and UH milk during the first 9 weeks of lactation. Cluster A included carnitines and PUFAs. Clusters B and C contained metabolites that were more abundant in CH milk. These clusters mainly comprised preformed fatty acids, the TAGs with at least two preformed fatty acids and free SCFAs from rumen fermentation. Cluster D contained metabolites that were more abundant in UH milk and did not decrease as lactation progressed, including de novo fatty acids, TAGs with at least two de novo fatty acids and lactic acid.
4. Discussion
Previous studies have demonstrated that the milk fat content and milk fat components are altered by the physiological and nutritional statuses of the cow [
4,
5,
6]. Although genetic selection has greatly increased the milk yield [
2,
13], and while heritability estimates indicate that milk fatty acid profiles can be altered through selection [
14,
15], there is little direct evidence that general selection efforts since the mid-1960s have altered milk fat components [
16]. Indeed, although we identified differences in milk fat components between the Holstein genotypes used in this study, our ability to attribute these differences to genetic change is confounded by the difference in the postpartum energy balance of the genotypes. The results from our direct comparison of the UH and CH genotypes are more consistent with the concept that alterations in metabolism that occur to provide the energy and nutrients needed for the immediate onset of milk synthesis alter the fatty acids available for milk synthesis. These alterations subside after the deficit in energy supply is alleviated, which indicates that the alterations are part of the normal biological processes associated with the successful transition into lactation [
17]. Although genetic differences can affect the process and alter the proportions of individual fatty acids available for milk synthesis, the UH vs. CH model indicates that the impact of 50 years of genetic selection appears to be relatively subtle compared to the dramatic need to mobilize larger quantities of body tissue in the high-producing CH cow.
Our previous work with the UH vs. CH experimental model indicated that postpartum energy balance profiles did not differ between the two genotypes [
38]. That study used 9 cows/genotype in year 1, and 10 UH and 12 CH cows in year 2 of the study. Energy balance profiles were nearly identical in years 1 and 2 and nearly identical for the genotypes. Although convincing, the results from subsequent studies [
39], including this study, were more consistent with the expectation that high-producing cows should have a more negative energy balance profile postpartum. The reason(s) for these inconsistent energy balance results is unknown. Thus, although we expected to be able to examine the direct impact of selection on milk components, the results from the current study are confounded by the difference in the energy balance of the genotypes. The magnitude of the negative energy balance was greater, more severe and of a longer duration in the CH cows, indicating they had a greater metabolic load and needed to mobilize more tissue to help offset the deficit. The most prominent fatty acid in milk from the UH and CH cows was C18:1, which has been identified as a marker for the energy balance of cows in early lactation [
40]. The largest energy deficits for UH and CH cows occurred during weeks 1 through 4 of lactation, and the mean energy balance during this interval was highly correlated with the milk C18:1 concentration for both genotypes. This similarity supports the premise that tissue mobilization followed a similar energy deficit-driven modem in both genotypes, with greater mobilization occurring as the energy deficit increased.
Fatty acids and TAGs. Concentrations of the C4–C14 de novo fatty acids in milk did not differ between the genotypes, while concentrations of the C17–C22 preformed fatty acids were greater in CH milk. This was most apparent during the first four weeks of lactation, when the energy deficit and tissue mobilization, reflected by changes in body weight and body condition score, were most severe. This greater availability of preformed fatty acids decreased the proportional contribution of de novo fatty acids in CH milk even though the absolute concentrations of de novo fatty acids were similar in UH and CH milk. This greater elevation of preformed fatty acids in CH milk is consistent with the CH cows having a greater metabolic demand than UH cows for substrates for milk TAG synthesis and a greater need to mobilize body tissue to meet this greater demand. During a negative energy balance, these mobilized fatty acids represent the largest proportion of the fatty acids in milk lipids [
7].
The difference in relative proportions of de novo and preformed fatty acids in UH and CH milk impacted fatty acid esterification in the formation of TAGs. The greater prevalence of preformed fatty acids in CH milk explains why 10 of the 16 most prominent TAGs in CH milk contained two or more preformed (>C16) fatty acids. In contrast, only 4 of the 13 most prominent TAGs in UH milk contained a C18 fatty acid, while 7 of the remaining 9 prevalent UH TAGs contained two de novo (<C16) fatty acids. The presence of one or more preformed fatty acids did not distinguish UH or CH milk as 16 of the 21 most prominent fatty acids that were not more prevalent in either genotype had two or more preformed (>C16) fatty acids. In contrast, the only prominent TAGs with two de novo (<C14) fatty acids (T1, T2 and T3) were more prevalent in UH milk. Thus, although not mutually exclusive, lipidomic profiling of the 50 most abundant TAGs revealed that TAGs with at least two preformed fatty acids were more prevalent in CH milk while TAGs with at least two de novo synthesized fatty acids were more prevalent in UH milk during early lactation.
Carnitine and short-chain carboxylic acids. Carnitine is a facilitator for the transfer of long-chain fatty acids into the mitochondria for β-oxidation and for the transport of short- and medium-chain fatty acids from peroxisomes to mitochondria [
41,
42]. Concentrations of carnitine and its acylcarnitine moieties in milk decreased dramatically from the start of lactation in both genotypes but the decrease was greater in milk from CH cows. Carnitine is only synthesized in the kidney, liver and brain [
42], so the carnitine content in milk depends on carnitine biosynthesis in these organs as well as active uptake from the intestinal tract. Therefore, reduced biosynthesis, decreased uptake into the mammary gland and increased utilization could jointly or individually contribute to the decrease in milk carnitine content in early postpartum milk. Postpartum decreases in milk carnitine have been attributed to periparturient alterations in hepatic synthesis of carnitine [
43,
44]. The greater postpartum decreases in carnitine in CH milk could be attributed to differential impacts of these factors in carnitine metabolism in the CH cow. The more severe and longer interval of negative energy balance experienced by the CH cows most likely increased the use of carnitine for the metabolism and transport of mobilized NEFA, leading to the greater reductions in carnitine concentrations in CH milk. Thus, continued increases in milk yield per cow will likely continue to exacerbate this reduction, such that feeding supplemental carnitine could enhance β-oxidation and help minimize disorders in lipid metabolism during early lactation [
44]. Interestingly, total carnitine concentrations in milk have been reported to be greater in ketotic cows than in normal healthy cows [
45]. In contrast, the two CH cows with persistent subclinical ketosis in the current study had the lowest milk carnitine concentrations of the CH cows. We have not identified a reason(s) for this discrepancy between our study and the earlier work [
45] but additional investigation could be of interest.
Short-chain fatty acids and ketone bodies are both end products of fatty acid oxidation and substrates for fatty acid synthesis. Our results indicated greater postpartum increases in butyric acid and 3-hydroxybutyric acid in CH than in UH milk. More specifically, the increase in 3-hydroxybutyric acid in CH milk was caused by transient (1 sample/cow, N = 4 cows) and persistent (>4 samples/cow, N = 2 cows) concentrations > 100 µM in half of the CH cows during the first 6 weeks of lactation. Concentrations of 3-hydroxybutyric acid in milk from one of these persistent CH cows frequently approached or exceeded 300 µM. A widely adopted approach is to consider 3-hydroxybutyric acid concentrations between 120 and 290 µM as indicative of subclinical ketosis and those > 300 µM indicative of clinical ketosis [
46]. Several studies have identified positive correlations between increased 3-hydroxybutyric acid concentrations or hyperketonemia and subsequent metabolic disorders [
47]. However, other studies have not detected these correlations [
48]. Variation among the studies in methods used to measure 3-hydroxybutyric acid, and more importantly in methods used to diagnose metabolic disorders, contributes to these conflicting reports [
46]. For example, some studies use a single sample with an elevated 3-hydroxybutyric acid concentration to determine the ketotic status, and this ignores the typical metabolic fluctuations in the periparturient dairy cow. Regardless, the divergent results weaken the likelihood that these correlations identify actual causal relationships. An alternative homeorhetic-driven interpretation is that postpartum increases in 3-hydroxybutyrate are a natural consequence of the alterations in tissue metabolism that healthy high-producing cows utilize to successfully transition into lactation [
49]. Although our study has insufficient power to assess health traits, our results support this alternative interpretation as none of the study cows displayed signs of clinical ketosis or other metabolic disorders.
Strengths and weaknesses of this study. The UH vs. CH animal model offers a strong opportunity to assess changes in the US Holstein since the mid-1960s. The repeated-measures design strengthens the ability to identify changes during the study sampling interval. Advances in LC-MS-based analysis and computational tools used in this study offer a powerful technological platform to identify components in complex biological samples. The focus on early lactation when the energy balance was most different between the genotypes coincides with substantial differences in tissue mobilization, which overwhelmed any subtle differences in milk composition that might have been caused by a direct genetic alteration in milk fat synthesis. Although milk components were similar between the genotypes by week 9 of lactation, the analysis of samples collected later in lactation, when both genotypes were in a positive energy balance, might identify polymorphic-driven effects of selection on milk fat synthesis.


