Article

A Quantitative Framework for Assessing Locomotor Asymmetry in Dinosaur Trackways: Testing the Evidence for Limping and Lateral Preference


Advancement and Community Engagement, The University of Queensland, Brisbane, QLD 4072, Australia
Foss. Stud. 2026, 4(2), 9; https://doi.org/10.3390/fossils4020009
Submission received: 20 March 2026 / Revised: 20 April 2026 / Accepted: 20 April 2026 / Published: 24 April 2026
(This article belongs to the Special Issue New Directions in the Study of Vertebrate Trace Fossils)

Abstract

Trackways preserve sequential records of animal locomotion and provide some of the most direct evidence of locomotor behaviour in the vertebrate fossil record. Alternating short–long pace lengths have historically been used to infer gait irregularities such as limping or lateral limb preference, but these interpretations typically lack statistical validation, treating mean asymmetry as sufficient grounds for behavioural conclusions without first establishing whether observed differences exceed normal locomotor variability. This study introduces a quantitative framework that addresses this gap by applying Welch’s t-test to pace and stride length measurements, establishing statistical confirmation of asymmetry as a prerequisite for behavioural interpretation. The framework is demonstrated on nine dinosaurian trackways drawn from published data. While all had previously been interpreted as asymmetric, seven exhibited statistically significant pace asymmetry (p < 0.05) and two did not exceed the range of normal variation. Stride length showed no significant asymmetry in any trackway, confirming that pace-level metrics are more sensitive to limb bias than stride-based measures. This framework provides an objective, reproducible standard for evaluating asymmetry claims—a necessary and feasible methodological advance for vertebrate ichnology.

1. Introduction

Trackways preserve sequential records of footfalls and, when fossilised, provide some of the most direct evidence of locomotor behaviour available in the vertebrate fossil record [1,2,3,4,5,6]. Unlike skeletal remains, which capture anatomy at a single moment in time, trackways document movement as a dynamic process, recording information on gait, speed, turning behaviour, and substrate interaction [7,8,9,10,11,12,13]. For extinct taxa—particularly non-avian dinosaurs—trackways therefore represent a source of behavioural information that cannot be recovered from body fossils alone [14]. Crucially, dinosaur tracks are also the most numerically abundant dinosaur fossil, preserved across a wide range of depositional environments and geological intervals [2,3,14]. This abundance means that, unlike most palaeontological data, trackway datasets are often large enough to support formal quantitative analysis—an advantage the field has yet to fully exploit.
Among the many parameters recorded in trackways, locomotor asymmetry presents a particularly persistent interpretive challenge. Alternating differences in pace length—the distance between consecutive footfalls of opposite limbs—are commonly interpreted as signs of irregular gait, such as limb impairment or lateral preference [7,15,16,17,18]. Such interpretations have been documented across numerous dinosaur trackway studies, typically supported by visual inspection or simple mean comparisons. However, these apparent asymmetries have rarely been evaluated using formal statistical tests, making it difficult to determine whether observed differences reflect biologically meaningful limb bias or fall within the range of normal locomotor variability.
This distinction matters. Statistical testing provides a rigorous means of separating genuine patterns from random variation, yet pace length alternations are frequently treated as inherently diagnostic, even where sample sizes would permit quantitative evaluation. This traditional practice risks over-interpretation, particularly where asymmetries are subtle [16], inconsistent along a trackway [18], or potentially influenced by non-biological factors such as substrate deformation, preservation bias, or mapping uncertainty. The result is a body of behavioural claims—limping, injury, lateral preference—that rest on a foundation that has never been formally tested.
Addressing this gap represents a practical new direction for vertebrate ichnology. Recent advances in digital measurement enable precise, reproducible extraction of trackway parameters within standardised spatial frameworks, making statistical analysis both feasible and scalable [13,19,20,21]. Building on these developments, this study introduces a quantitative framework for evaluating locomotor asymmetry in fossil trackways, applying Welch’s t-test to pace and stride length measurements to assess whether left–right differences exceed those expected from normal variation. The framework is demonstrated on published ichnological studies spanning the Jurassic to Cretaceous and multiple geographic regions those trackways had previously been interpreted as showing limping or gait irregularity. This study examines nine trackways spanning three dinosaur groups, namely, theropods, sauropods, and ornithopods, as well as two human trackways providing a known-condition validation dataset. The explicit aim is to evaluate which of those interpretations are supported under formal statistical scrutiny, and to propose the methodological standard by which future asymmetry claims should be assessed.

2. Materials and Methods

Datasets of trackways were gathered from published ichnological research, most notably from Lockley et al. [7], which was the first major study in dinosaur ichnology to investigate limping behaviour. From this foundational work, datasets included two human trackways (one individual with a known limp—Person-GG, Gerard Gierliński, a Polish palaeoichnologist; one control without impairment—Person-AG, Agnieszka Gierliński, his wife; Figure 1) and six dinosaur trackways (Figure 2A–C, Figure 3A and Figure 4A,B). These included: three theropod trackways (Morocco, Portugal, and USA; labelled here as Theropod 1-03 [7,22]); one manus-only sauropod trackway (Morocco; Sauropod 1 [7,22,23]); and two ornithopod trackways (one bipedal, one quadrupedal; Ornithopod 1 and 02, respectively [7,24]). When multiple maps or datasets (i.e., tables) existed for a trackway (e.g., Person-GG, Theropod 3 [7]), each was analysed separately to check result consistency (Table 1).
Additional sources included three dinosaur trackways: a theropod trackway from South Korea (Theropod 4 [16]); a quadrupedal sauropod trackway from China (Sauropod 2 [25]); and a discontinuous bipedal ornithopod trackway, comprising two primary segments, from Spain (Ornithopod 3 [18]) (Figure 2C, Figure 3B and Figure 4C; Table 1).
Figure 1. Human trackways from Lockley et al. [7]. (A) Person-GG trackway (known limping trackmaker, Arizona, USA). (B) Person-AG trackway (known non-limping control, Arizona, USA). Direction of travel from left to right.
Fossstud 04 00009 g001
Table 1. Provenance and classification of trackways analysed in this study [7,15,16,17,18,22,23,24,25].
Manuscript
Label
Original
Trackway ID
Published
Citation
Original Source (If Different to Citation)LocationAgeTrackmaker
Person-GGG. Gierlinski trackway
(map and tabulated data)
[7]: Figure 5,
Table 1
Arizona,
USA
ModernHuman
(limping)
Person-AGA. Gierlinski trackway
(map and tabulated data)
[7]: Figure 5,
Table 1
Arizona,
USA
ModernHuman
(control)
Theropod 1theropod trackway[7]: Figure 1[22]: Figure 1Atlas Mountains, MoroccoMiddle
Jurassic
Theropod
Theropod 2a/btheropod trackway
(two versions)
[7]: Figure 3A,B Utah,
USA
Late
Jurassic
Theropod
Theropod 3theropod trackway[7]: Figure 3C[15]Praia de Cavalo,
Portugal
Middle
Jurassic
Theropod
Theropod 4trackway D, L1[16]: Figure 8 Hwasun County, South KoreaLate
Cretaceous
Theropod
Sauropod 1sauropod trackway[7]: Figure 2[23]: Figure 9.3Atlas Mountains, MoroccoMiddle
Jurassic
Sauropod
Sauropod 2
pes/manus
QQ-S1[25]: Figure 3 Shandong
Province, China
Early
Cretaceous
Sauropod
Ornithopod 1Valdete trackway[7]: Figure 4A[24]Cameros Basin, SpainEarly
Cretaceous
Ornithopod
Ornithopod 2
pes/manus
Caririchnium trackway[7]: Figure 4B New Mexico,
USA
Early
Cretaceous
Ornithopod
Ornithopod 3a
Ornithopod 3b
BLC1
(segment 1 and 2)
[18]: Figure 2A Cameros Basin, SpainEarly
Cretaceous
Ornithopod
Blender (version 4.1), a free, open-source, primarily 3D modelling and animation software was selected for the purpose of analysis. This software accommodates both 2D and 3D input data, allowing published trackway maps to be imported directly as planar references, while also providing a precision coordinate extraction environment and an integrated Python 3.11 scripting interface that enables automated, reproducible measurement workflows [13,19,20,21]. Footprint positions were marked using polyline vertices placed at a consistent anatomical feature within each trackway (e.g., heel position or the proximal end of the digit III impression). Linear trackway measurements of pace and stride were calculated as Euclidean distances between the start (x1, y1) and end (x2, y2) coordinates defining each measurement (Equation (1)):
Length = ((x2 − x1)2 + (y2 − y1)2)0.5
In dinosaur ichnology, pace length is defined as the distance between successive placements of contralateral feet (e.g., from a left pes impression to the subsequent right pes impression). Stride length refers to the distance between consecutive placements of the same foot (e.g., left-to-left or right-to-right) [2,3]. All measurements were extracted using custom Python scripts executed within Blender’s scripting environment.
Measurements were separated into left and right subsets to enable statistical comparison between contralateral limbs. For each trackway, Welch’s t-test was applied to compare left and right measurement subsets, testing for statistically significant asymmetry. This approach accommodates unequal sample sizes and variances. The analysis calculates mean and standard deviation for each subset, along with the t-statistic and associated p-value (i.e., p < 0.05).
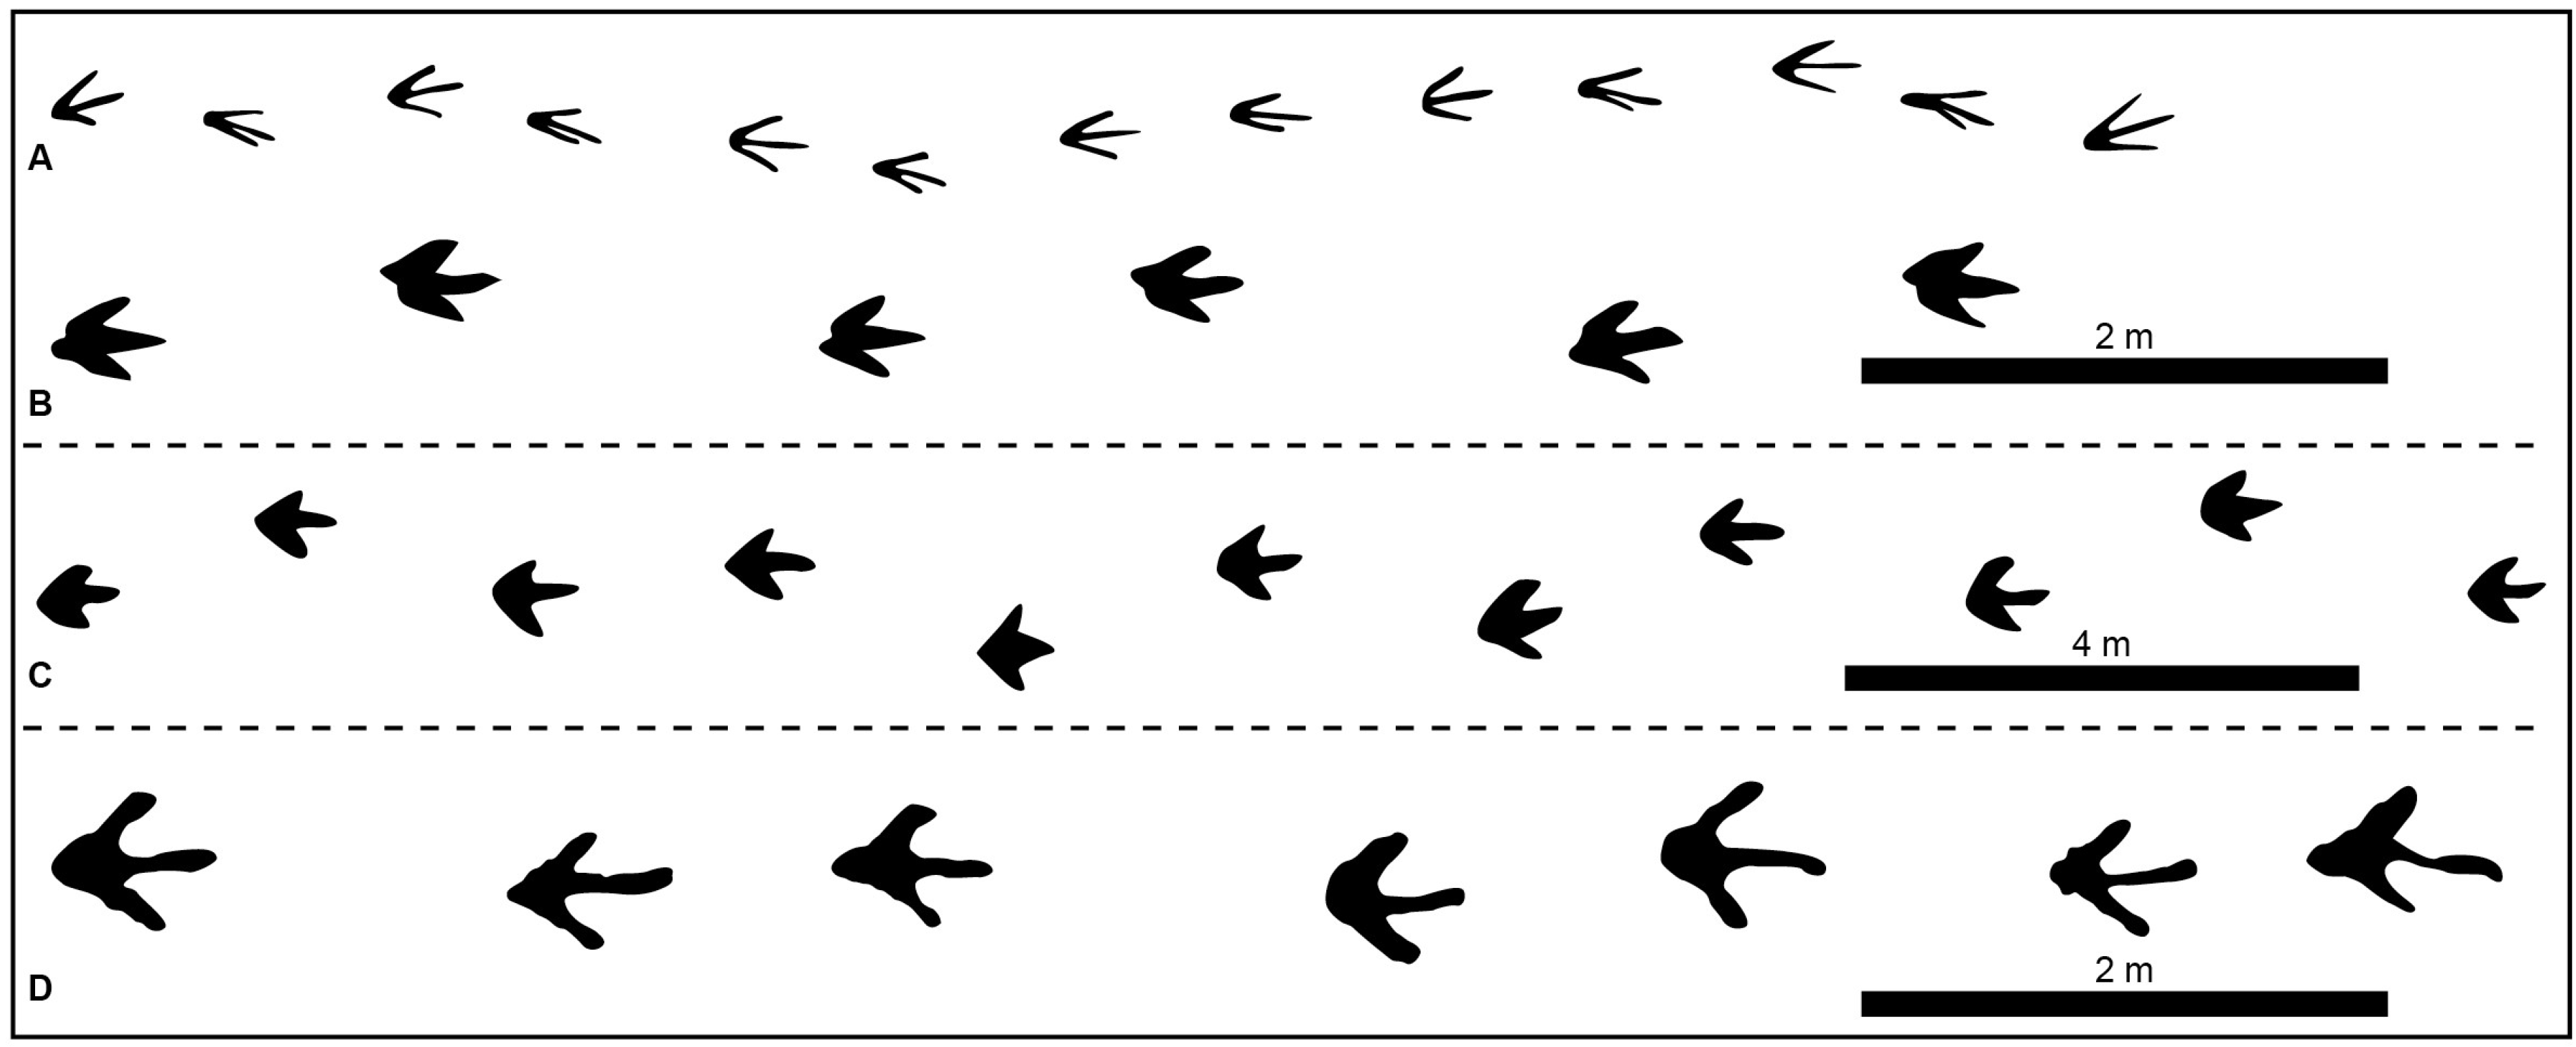
Figure 2. Theropod trackways with a purported limping gait. (A) Theropod 1 (Atlas Mountains, Morocco [7,22]). (B) Theropod 2 (Moab, Utah, USA [7]). (C) Theropod 3 (Praia de Cavalo, Portugal; [7,15]). (D) Theropod 4 (Trackway D, Level L1, Hwasun County, South Korea [16]). Direction of travel from left to right.
Fossstud 04 00009 g002

3. Results

3.1. Pace Length Analysis

Based on the figures examined from Lockley et al.’s [7] study, significant pace asymmetry was found in one of two human trackways and with all six dinosaur trackways (p < 0.05; Table 1).
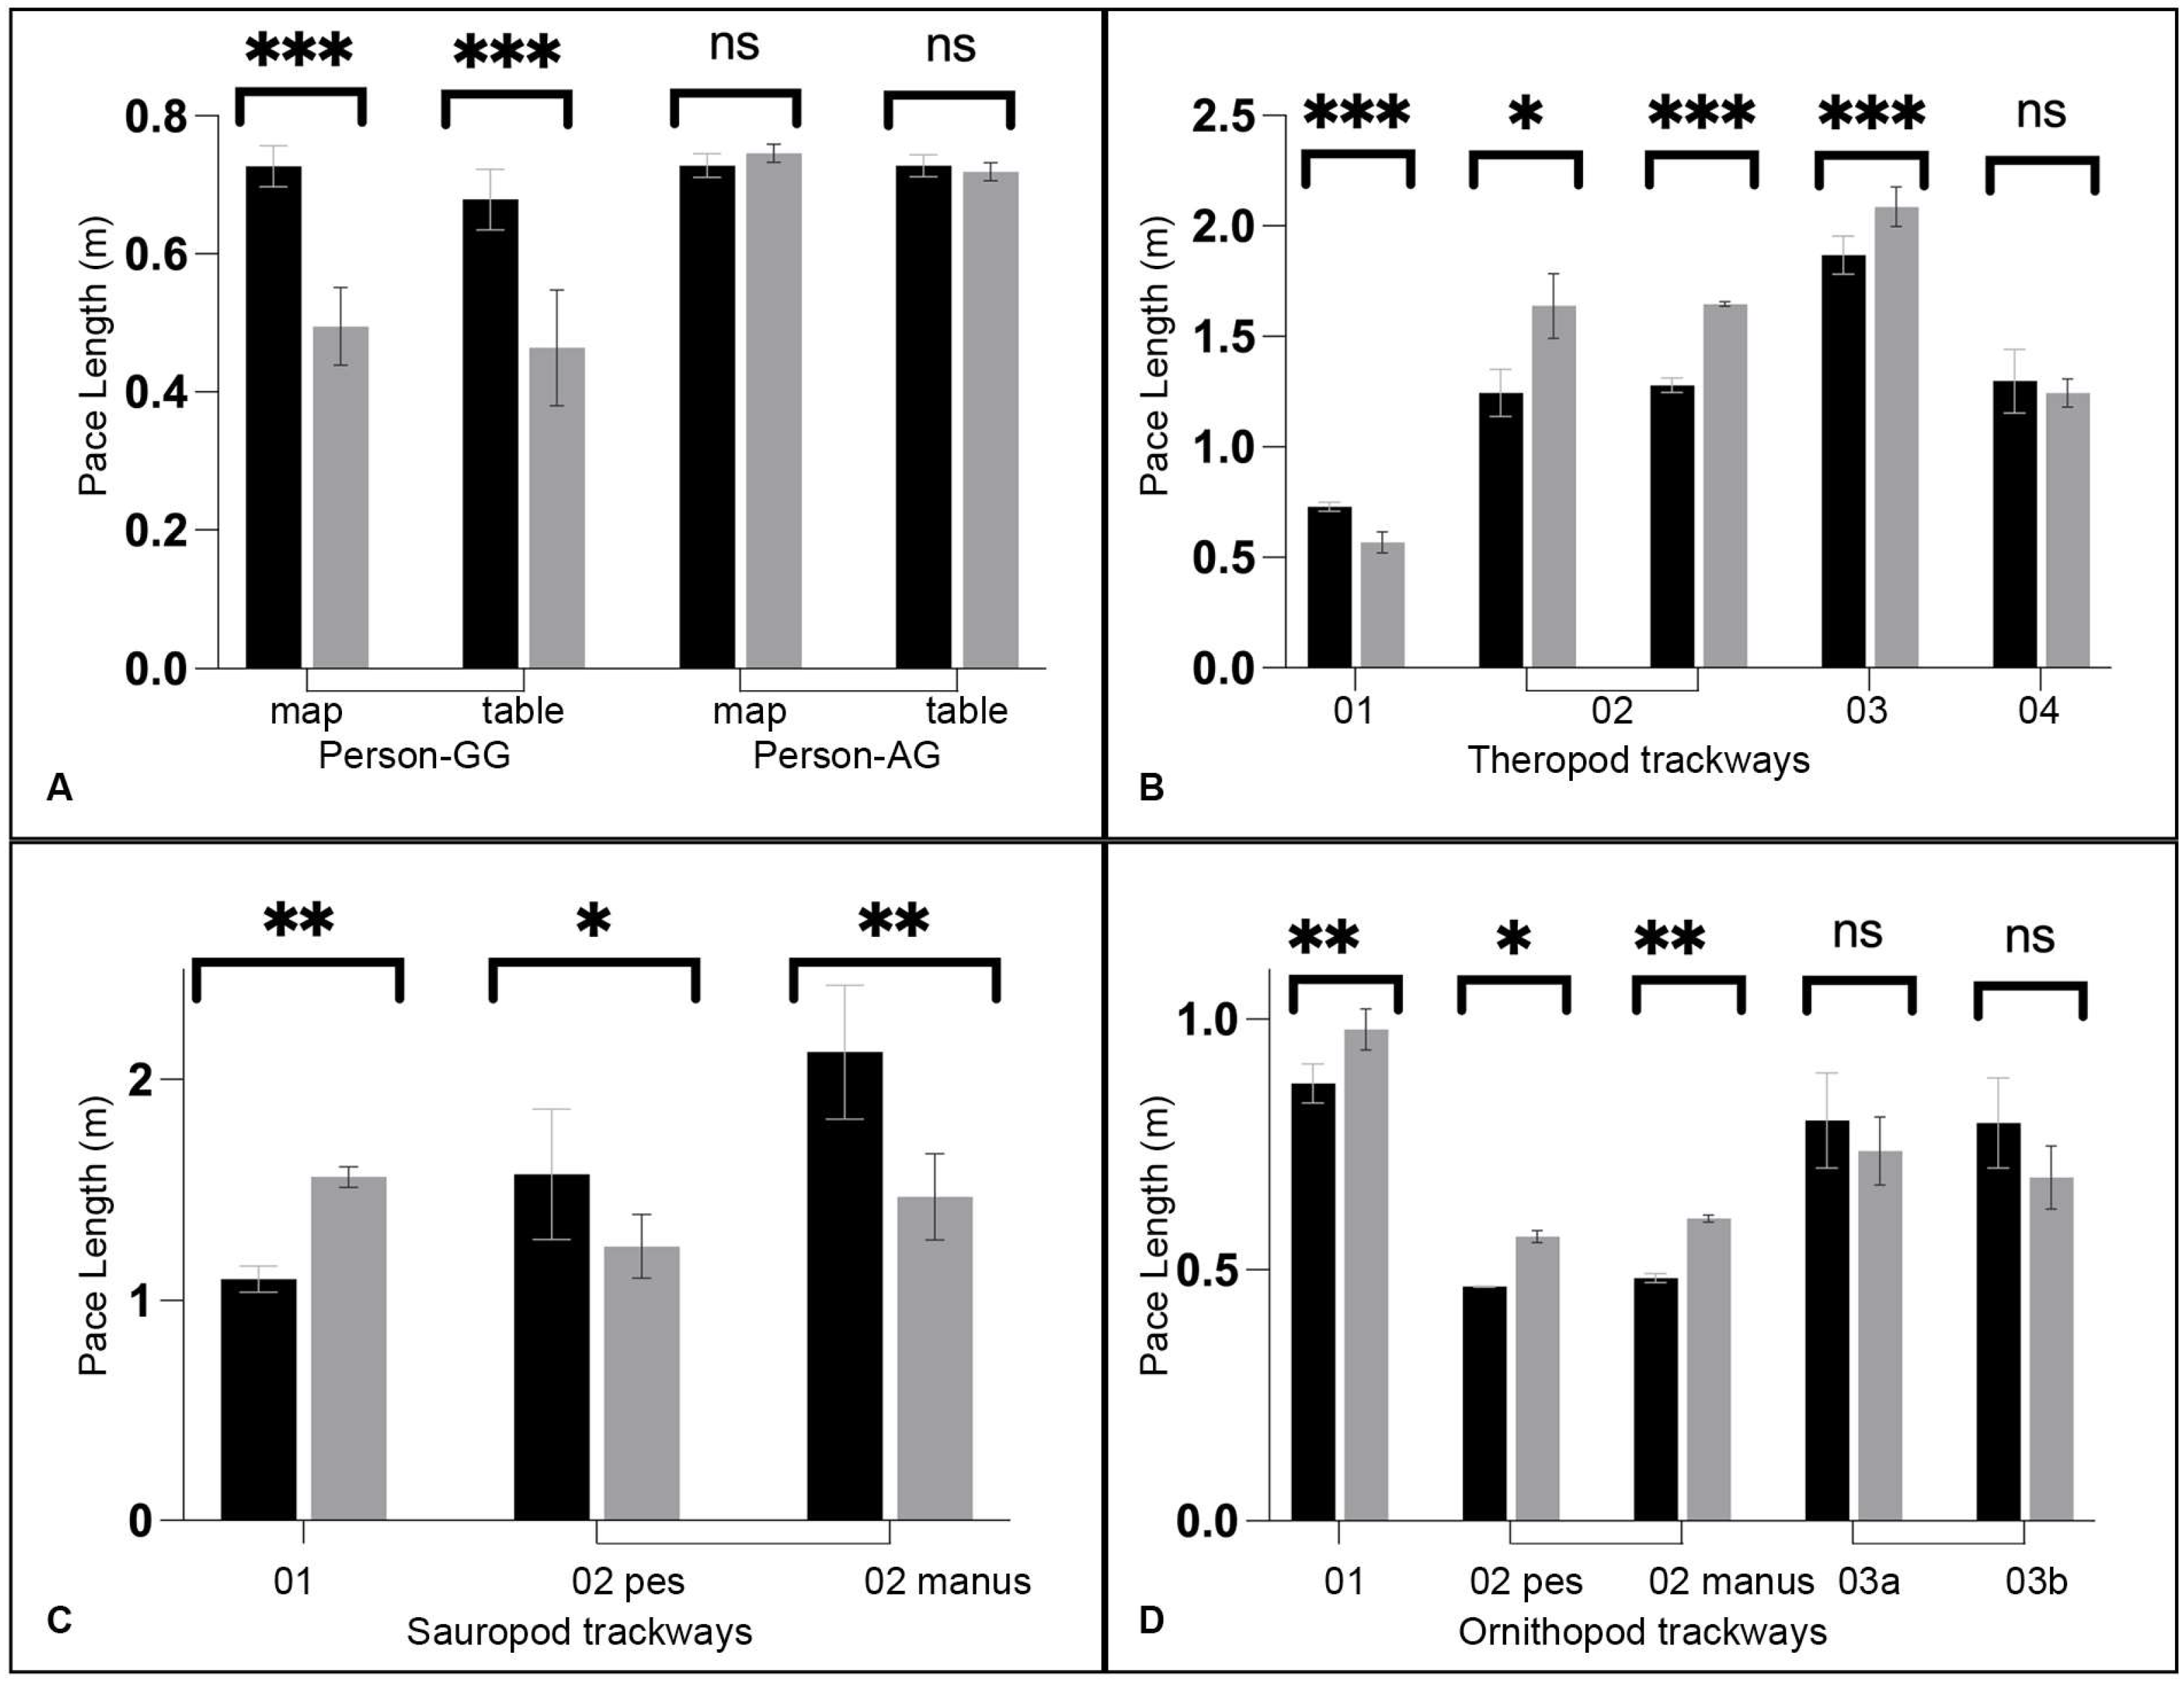
In the human trackways, “Person-GG” showed significant asymmetry (t = 9.063, p < 0.001), with the right-to-left pace being, on average, 21.5 cm greater than the left-to-right paces. In contrast, the control (i.e., non-limper) “Person-AG” showed no significant asymmetry (p = 0.274), with only a 9 mm difference (Figure 1 and Figure 5A; Table 2).
Significant differences were found among theropod dinosaur trackways: the Moroccan trackway (Theropod 1) showed a 16.0 cm longer length in the right-to-left pace (t = 6.788, p < 0.001); both USA trackway versions (Theropod 2a–b) had 37–40 cm greater left-to-right pace lengths (map a: t = –3.059, p = 0.038; map b: t = –11.594, p < 0.001); and the Portuguese trackway (Theropod 3) exhibited a 21.9 cm longer left-to-right pace (t = –3.505, p = 0.008) (Figure 2 and Figure 5B; Table 2).
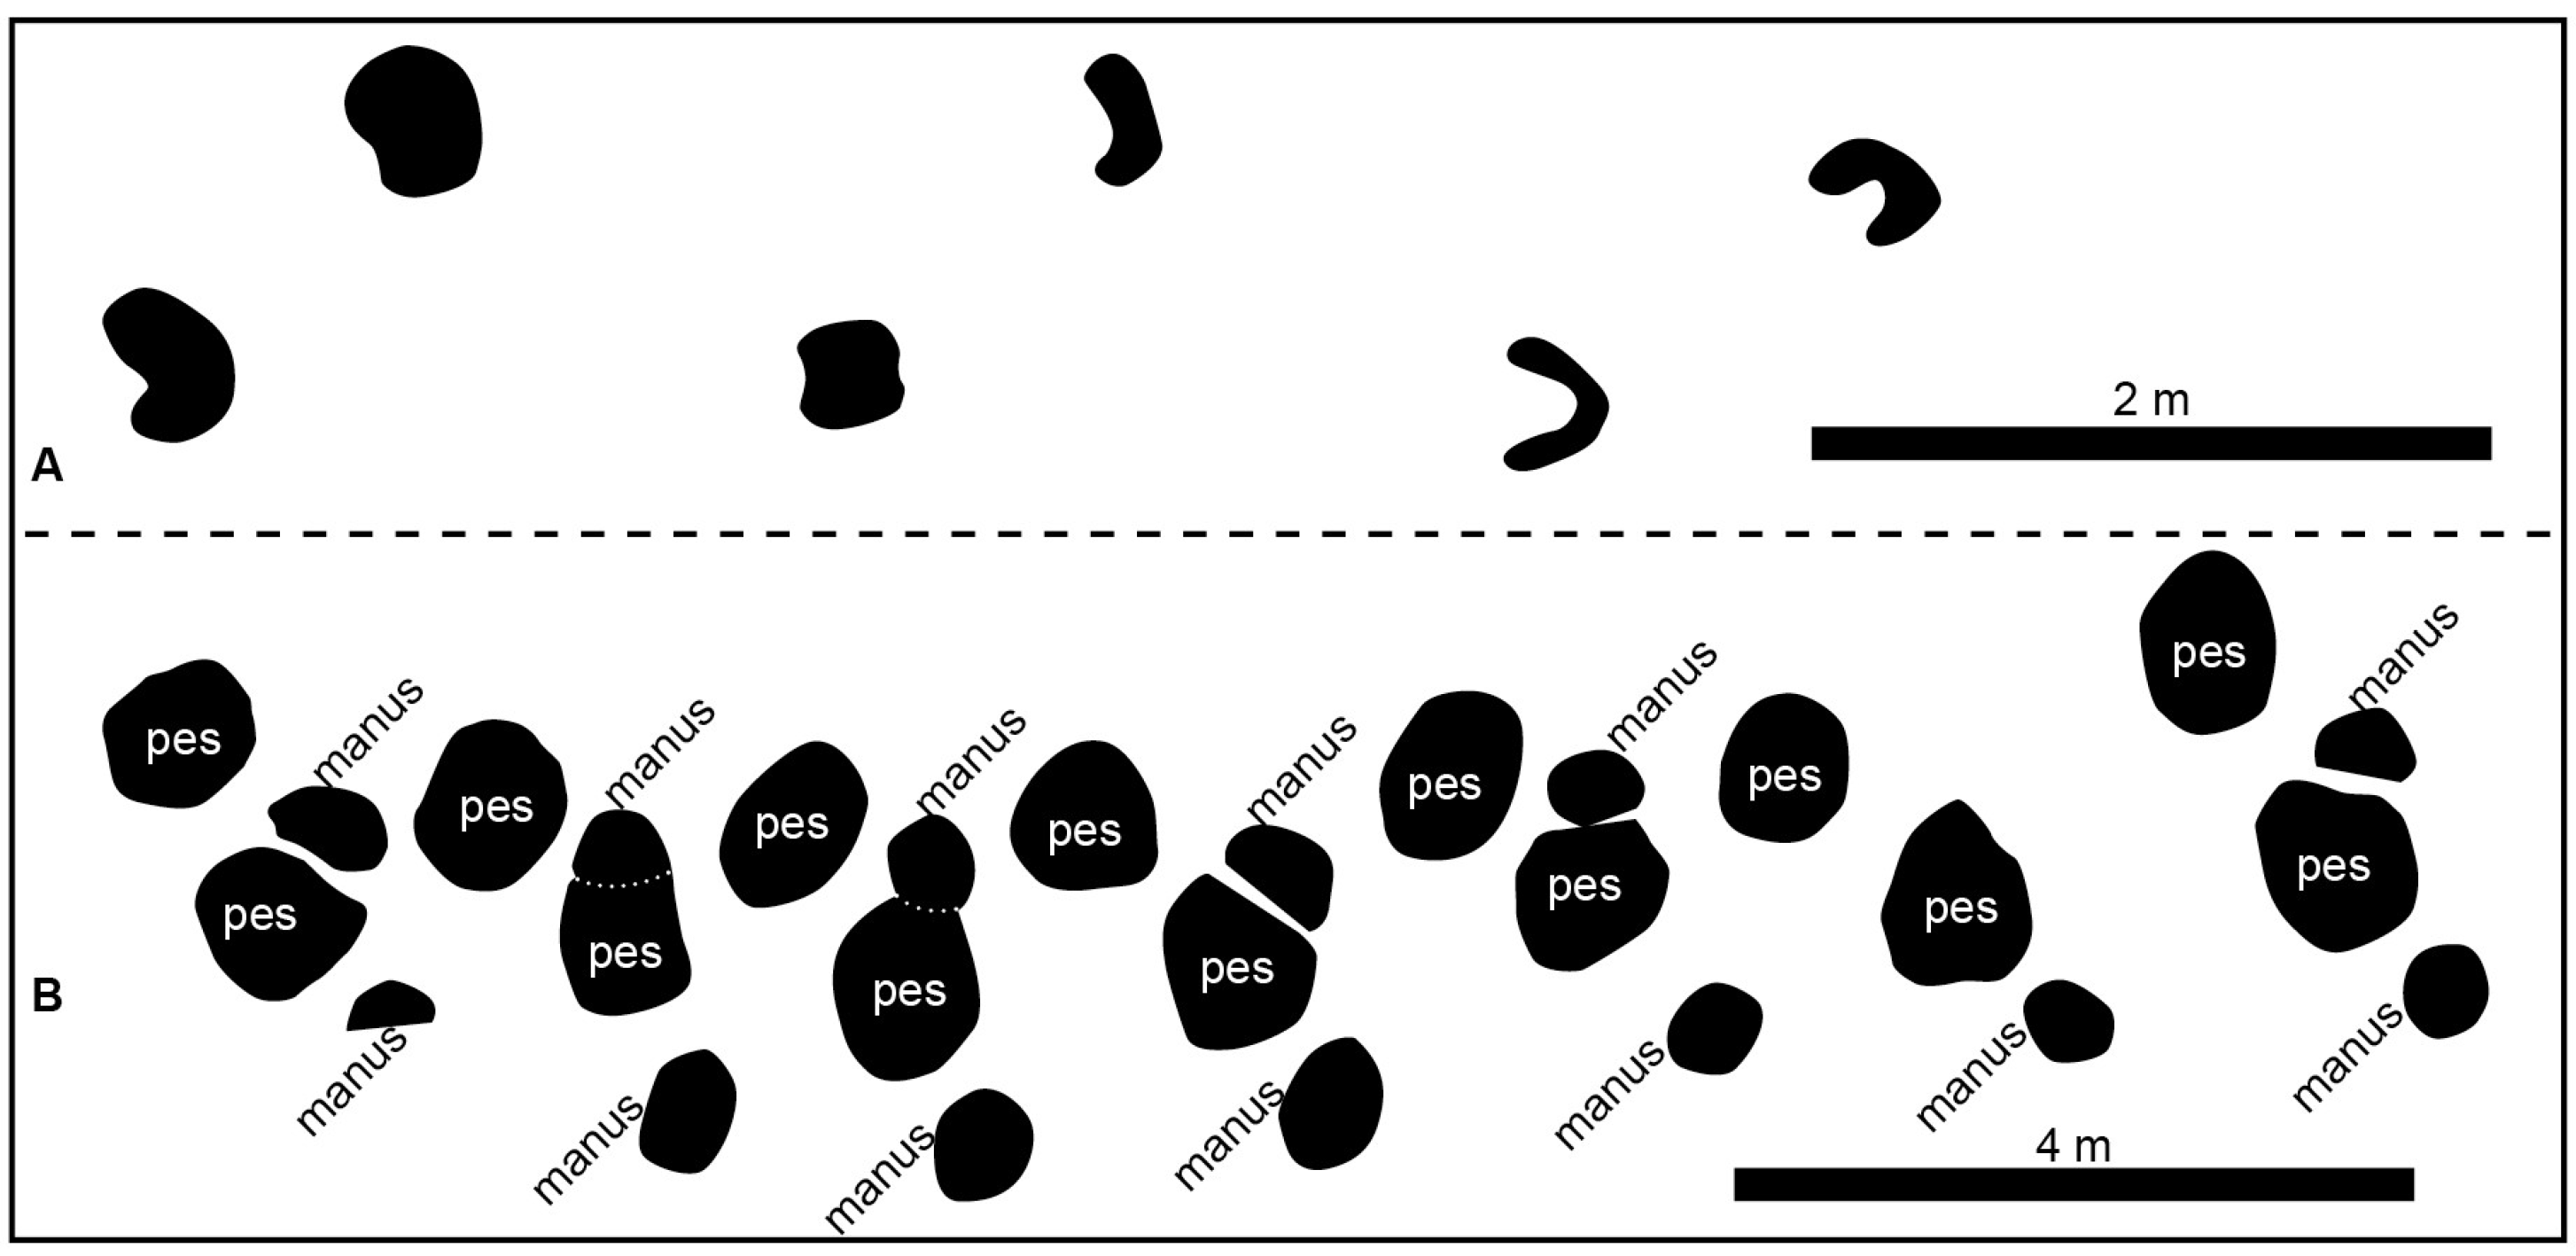
The sauropod manus trackway (Sauropod 1) from Morocco showed that left-to-right paces were significantly greater (46.2 cm) than right-to-left paces (t = –7.196, p = 0.006) (Figure 3A and Figure 5C; Table 2).
Figure 3. Sauropod trackways. (A) Sauropod 1 (manus tracks only, Atlas Mountains, Morocco [7,22,23]). (B) Sauropod 2 (QQ-S1 trackway, Shandong Province, China [25]). Sauropod 1 was attributed a purported limping gait; Sauropod 2 was described as exhibiting an unusual walking pattern. Direction of travel from left to right.
Fossstud 04 00009 g003
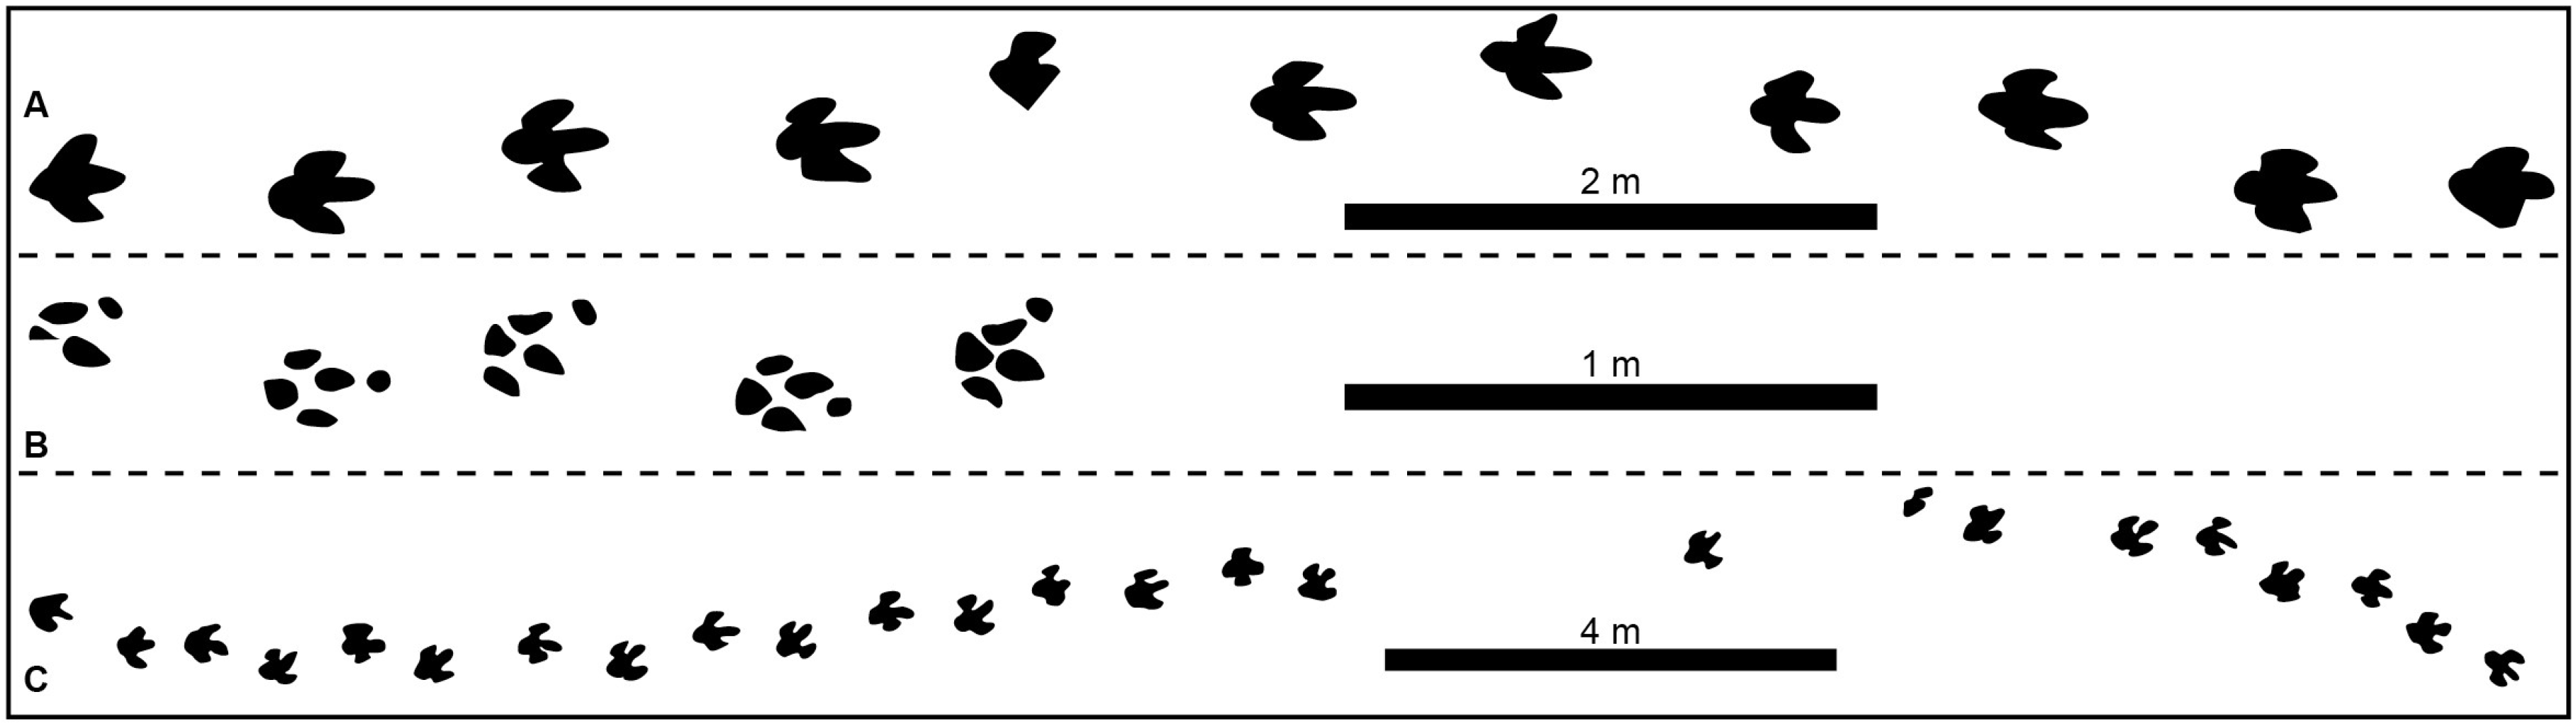
Among ornithopod trackways, the bipedal example from Spain (Ornithopod 1) exhibited significant asymmetry (t = –3.839, p = 0.005), with a 10.8 cm difference (left-to-right paces being longer). A quadrupedal ornithopod (Ornithopod 2) from the USA showed significant asymmetries in both pes and manus pace lengths (pes: t = –8.407, p = 0.014; manus: t = –10.256, p = 0.009), with differences of 9.9 cm and 11.8 cm, respectively (Figure 3A,B and Figure 5D; Table 2).
Among the additional reports of asymmetrical dinosaur trackways, only one out of three exhibited significant left-right pace differences. Here, the Chinese sauropod trackway (Sauropod 2) had pronounced asymmetries (pes: t = 2.373, p = 0.037; manus: t = 4.325, p = 0.001) with consistently greater right-to-left pace lengths for both pes and manus impressions. The mean differences were 32.5 cm for pes and 65.6 cm for manus, respectively (Figure 3B and Figure 5C; Table 2). However, two previously referred “limping” dinosaur trackways did not reveal statistically significant asymmetry. A theropod trackway from South Korea (Theropod 4) demonstrated no significant difference (p = 0.686), even though there was an average side-to-side variation of 5.4 cm (Figure 2D and Figure 5C; Table 2). Similarly, the Spanish ornithopod trackway (Ornithopod 3) had no notable difference between right-to-left and left-to-right movement in both segments (p = 0.198 and p = 0.135) (Figure 4C and Figure 5D; Table 2).
Figure 4. Ornithopod trackways with a purported limping gait. (A) Ornithopod 1 (Valdete trackway, Cameros Basin, Spain [7,24]). (B) Ornithopod 2 (Caririchnium trackway, Mosquero Creek, New Mexico, USA [7]). (C) Ornithopod 3 (BLC1 trackway, Cameros Basin, Spain [18]. Direction of travel from left to right.
Fossstud 04 00009 g004
Table 2. Pace length measurements, directional means, and Welch’s t-test results for each trackway.
TrackwayPace Lengths (m)Right-to Left Mean (SD)Left-to-Right Mean (SD)T-Statistics
(p-Value)
Asymmetry (This Study)
Person-GG (map)0.7163, 0.5617, 0.7838, 0.4888, 0.7345, 0.4616, 0.6858, 0.4342, 0.7149, 0.5801, 0.7242, 0.44470.727 (0.030)0.495 (0.056)8.127 (0.000)yes
Person-GG (table)0.680, 0.540, 0.740, 0.505, 0.690, 0.445, 0.640, 0.420, 0.670, 0.605, 0.690, 0.430, 0.690, 0.500, 0.655, 0.485, 0.685, 0.500, 0.650, 0.465, 0.630, 0.505, 0.695, 0.420, 0.675, 0.300, 0.775, 0.500, 0.720, 0.460, 0.570, 0.250, 0.695, 0.5600.679 (0.044)0.464 (0.084)9.063 (0.000)yes
Person-AG (map)0.7516, 0.751, 0.7335, 0.739, 0.7261, 0.733, 0.7563, 0.7057, 0.7603, 0.71060.728 (0.017)0.746 (0.013)−1.627 (0.142)no
Person-AG (table)0.720, 0.720, 0.735, 0.740, 0.750, 0.745, 0.730, 0.720, 0.700, 0.720, 0.720, 0.710, 0.720, 0.760, 0.720, 0.740, 0.720, 0.710, 0.680, 0.7200.728 (0.016)0.719 (0.018)1.128 (0.274)no
Theropod 10.5678, 0.7101, 0.5337, 0.7704, 0.554, 0.7191, 0.6539, 0.7263, 0.6009, 0.7415, 0.5036, 0.70840.729 (0.021)0.569 (0.048)6.788 (0.000)yes
Theropod 2a1.6874, 1.326, 1.7882, 1.3131, 1.4375, 1.09391.244 (0.107)1.638 (0.147)−3.059 (0.038)yes
Theropod 2b1.2848, 1.6352, 1.236, 1.6582, 1.31731.279 (0.033)1.647 (0.011)−11.594 (0.001)yes
Theropod 31.7748, 1.9215, 1.8348, 2.0868, 1.9626, 2.0937, 1.7892, 2.1653, 1.9809, 2.16551.868 (0.087)2.087 (0.089)−3.505 (0.008)yes
Theropod 41.2966, 1.4423, 1.2809, 1.1547, 1.15531.298 (0.144)1.244 (0.063)0.445 (0.686)no
Sauropod 11.0270, 1.5117, 1.0919, 1.6066, 1.17081.097 (0.059)1.559 (0.047)−7.196 (0.006)yes
Sauropod 2 Pes1.2951, 1.4946, 1.0994, 1.2191, 1.1576, 1.4568, 1.2513, 1.7276, 1.0725, 1.3864, 1.3158, 2.1368, 1.52531.570 (0.295)1.245 (0.144)2.373 (0.037)yes
Sauropod 2 Manus1.1048, 1.6617, 1.6399, 2.0322, 1.7028, 2.4001, 1.4258, 2.4496, 1.6063, 1.8317, 1.2991, 2.3712, 1.49942.124 (0.303)1.468 (0.195)4.325 (0.001)yes
Ornithopod 10.9167, 0.8824, 1.0339, 0.8511, 0.9587, 0.8943, 0.981, 0.9234, 1.0106, 0.81030.872 (0.039)0.980 (0.041)−3.839 (0.005)yes
Ornithopod 2 pes0.5543, 0.4659, 0.5776, 0.46870.467 (0.001)0.566 (0.012)−8.407 (0.014)yes
Ornithopod 2 manus0.6090, 0.4757, 0.5943, 0.49320.484 (0.009)0.602 (0.007)−10.256 (0.009)yes
Ornithopod 3a0.814, 0.6132, 0.6663, 0.7499, 0.6603, 0.9062, 0.8029, 0.8191, 0.7057, 0.8713, 0.7714, 0.7511, 0.8191, 0.8776, 0.65650.798 (0.095)0.737 (0.068)1.357 (0.198)no
Ornithopod 3b0.6579, 0.9427, 0.7305, 0.7133, 0.7534, 0.7839, 0.5924, 0.73280.793 (0.090)0.684 (0.063)1.724 (0.135)no

3.2. Stride Length Analysis

No trackway examined in this study exhibited statistically significant asymmetry in stride length (all p > 0.05). Left–right stride differences ranged from 0.1 to 11.6 cm across all trackways (Table 3).

4. Discussion

Ichnological interpretations of locomotor asymmetry have been traditionally based on visual inspection or simple mean comparisons of pace lengths [7,15,16,17,18,22,23,24,25], without formal assessment of whether observed differences exceed normal locomotor variability. This study demonstrates that statistical validation is not merely a refinement of existing practice but a necessary prerequisite in order to establish whether asymmetry is statistically real before any behavioural interpretation can be considered.
Although Lockley et al. [7] introduced human trackway comparisons primarily to establish the directional rule that the short step precedes placement of the injured foot, the same data serve to validate the present two-stage framework against a known behavioural ground truth. The known limping individual (Person-GG) produced highly significant pace asymmetry while the control individual (Person-AG) did not, confirming that the statistical approach reliably discriminates irregular gaits from normal variation when the biological condition is independently known. This validation is essential before extending the framework to fossil material, where no such ground truth is available. Applying the same logic to the dinosaurian record reveals that traditional qualitative assessments have drawn conclusions from incomplete evidence, treating mean pace differences as sufficient to support behavioural interpretations without testing whether those differences exceed normal variation.
The consequences of bypassing statistical validation are well illustrated by the Spanish ornithopod trackway (Ornithopod 3) of Razzolini et al. [18], who claimed direct evidence of antalgic gait, a conclusion subsequently cited as confirmed pathology in later reviews [26,27]. The current study shows that the pace differences for that trackway do not achieve statistical significance under formal testing (p = 0.198 and p = 0.135 across the two trackway segments), meaning the observed asymmetry is indistinguishable from normal variability (Figure 4C and 5D; Table 2). The problem is not the original observation of the mean differences in pace length between left and right sides (right-to-left greater by 6.1 cm and 10.9 cm across the first and second segments, respectively), but the interpretive leap that it represents evidence of limping. The wider citation of that interpretation as established fact illustrates how unvalidated asymmetry claims propagate through the literature, and underscores why a formal testing step is needed before trackmaker behavioural conclusions are drawn.
Figure 5. Assessment of pace asymmetry in assessed trackways. (A) Human trackways. (B) Theropod trackways. (C) Sauropod trackways. (D) Ornithopod trackways. Black bars indicate mean left pace length; grey bars indicate mean right pace length. “ns” denotes no significant statistical difference. Asterisks denote statistical significance as follows: * p < 0.05, ** p < 0.01, *** p < 0.001; ns indicates no significant difference (p ≥ 0.05).
Fossstud 04 00009 g005
A comparable pattern is seen in the South Korean theropod trackway (Theropod 4) of Huh et al. [16], where the left-to-right pace lengths exceeded right-to-left by 3.7 cm in the original field-based study and 5.4 cm in the current map-based analysis (Figure 2D and Figure 5B; Table 2). Despite acknowledging that this differential was smaller than in other reported limping trackways [7], Huh et al. [16] nonetheless concluded that the asymmetry represented another example of a limping dinosaur. The formal testing applied in the current study does not support that conclusion: the observed asymmetry does not approach statistical significance (p = 0.686; Table 2), meaning the pace difference is indistinguishable from normal locomotor variation, although substrate effects or preservational artefacts are also plausible explanations. Both this case and that of Razzolini et al. [18] therefore illustrate the same underlying problem: a mean pace difference was observed, a limping interpretation was applied, and in neither case was the asymmetry subjected to formal testing before the behavioural conclusion was drawn. That the Huh et al. [16] interpretation has attracted less downstream citation than Razzolini et al. [18] does not reflect a difference in evidential rigour—it reflects the possibilities of how claims circulate in the literature. The need for a consistent statistical approach applies regardless of whether an unvalidated interpretation is widely propagated or not.
The Chinese sauropod trackway (Sauropod 2 [25]) is the one case among the additional trackways examined here where formal testing demonstrates statistically significant pace asymmetry in both the pes (t = 2.373, p = 0.037) and manus (t = 4.325, p = 0.001) trackways (Figure 3B and Figure 5C; Table 2). The manus asymmetry is particularly pronounced, with right-to-left pace lengths exceeding left-to-right by a mean of 65.6 cm, compared to 32.5 cm for the pes. Xing et al. [25] had already recognised that the trackway was unusual, noting the conspicuous medial displacement of the left manus tracks, which were positioned on the inside of the trackway and sometimes in contact with the opposite right pes impressions—a configuration they tentatively linked to possible injury or abnormal behaviour. However, their observation concerned the geometry of individual track placement rather than systematic left-right differences in pace length, and no formal assessment of pace asymmetry was made in the earlier study. The current study therefore adds an independent line of evidence: the abnormality flagged qualitatively by Xing et al. in terms of manus positioning is accompanied by statistically significant asymmetry in alternating pace lengths across both fore- and hindlimbs—a finding only recoverable through the kind of formal testing the present framework provides.
Stride length analysis yielded no significant asymmetry in any trackway, including those with significant pace asymmetry (Table 3), confirming that stride-based metrics are insensitive to the alternating limb discrepancies that characterise irregular gaits [13,19]. Pace length is therefore an appropriate and sensitive metric for detecting locomotor asymmetry in trackway data.
The framework’s accuracy is dependent on the fidelity of published trackway maps to the original track-bearing surfaces. Inaccuracies in footprint positioning, scaling, or rotational alignment may introduce measurement artefacts that influence statistical outcomes [28]. Conversely, longer trackways with greater numbers of pace measurements per side provide increased statistical power, improving the ability to detect genuine asymmetries, including subtle ones that would fall below the detection threshold of smaller samples. This relationship between trackway length and analytical sensitivity underscores the value of documenting and publishing complete trackway extents rather than representative segments [13].
Table 3. Stride length measurements, directional means, and Welch’s t-test results for each trackway.
TrackwayStride Lengths (m)Right-to Left Mean (SD)Left-to-Right Mean (SD)T-Statistics
(p-Value)
Asymmetry (This Study)
Person-GG (map)1.2553, 1.328, 1.2583, 1.209, 1.1819, 1.1373, 1.1165, 1.1445, 1.2875, 1.2976, 1.15791.210 (0.061)1.223 (0.078)−0.295 (0.774)no
Person-AG (map)1.4967, 1.4786, 1.4665, 1.4576, 1.4516, 1.4846, 1.4575, 1.4605, 1.46671.470 (0.012)1.468 (0.016)0.239 (0.818)no
Theropod 11.2765, 1.2351, 1.3037, 1.3231, 1.2552, 1.373, 1.3790, 1.327, 1.3423, 1.2309, 1.21151.298 (0.056)1.295 (0.055)0.084 (0.935)
Theropod 2a3.0098, 3.1072, 3.0836, 2.7381, 2.52472.923 (0.185)2.873 (0.248)0.189 (0.862)no
Theropod 2b2.8897, 2.8445, 2.8658, 2.94232.878 (0.012)2.893 (0.049)−0.311 (0.785)no
Theropod 33.5051, 3.6644, 3.8115, 3.8143, 3.8932, 3.6867, 3.7472, 3.9695, 3.93013.777 (0.150)3.784 (0.122)−0.060 (0.954)no
Theropod 42.6213, 2.6421, 2.2767, 2.25342.448 (0.194)2.449 (0.172)−0.005 (0.997)no
Sauropod 11.9775, 2.0057, 2.0801, 2.28472.029 (0.051)2.145 (0.139)−0.783 (0.516)no
Sauropod 2 Pes1.9612, 2.046, 1.7474, 1.6839, 1.7023, 1.9217, 2.172, 2.1041, 1.9545, 2.2042, 2.615, 2.23862.033 (0.188)2.025 (0.305)0.048 (0.963)no
Sauropod 2 Manus1.6603, 1.8368, 1.8164, 1.7416, 2.0773, 2.0721, 1.9056, 2.285, 2.1208, 2.0989, 2.4886, 2.20522.040 (0.192)2.012 (0.263)0.195 (0.849)no
Ornithopod 11.7862, 1.9076, 1.8695, 1.7794, 1.8366, 1.8442, 1.896, 1.913, 1.7981.861 (0.054)1.837 (0.042)0.656 (0.533)no
Ornithopod 2 pes1.0109, 1.034, 1.03681.034 (0.000)1.024 (0.013)0.453 (0.729)no
Ornithopod 2 manus1.0376, 1.0076, 0.99901.008 (0.000)1.018 (0.019)−0.320 (0.803)no
Ornithopod 3a1.3983, 1.2654, 1.3667, 1.3693, 1.5312, 1.6777, 1.5751, 1.5006, 1.5553, 1.6248, 1.4978, 1.5479, 1.6865, 1.50371.498 (0.132)1.516 (0.101)−0.256 (0.802)no
Ornithopod 3b1.4665, 1.317, 1.3288, 1.4202, 1.4966, 1.3259, 1.32111.354 (0.047)1.403 (0.079)−0.806 (0.457)no
More broadly, this study illustrates a methodological direction that is both overdue and feasible in dinosaur ichnology. Because tracks are the most numerically abundant dinosaur fossil [2,3,14], they are uniquely suited to quantitative analysis; however, the field has largely not exploited this advantage when evaluating behavioural claims. The present study demonstrates that at least two previously accepted limping interpretations do not withstand formal scrutiny [16,18], while also confirming statistically significant pace asymmetry in a third trackway, where no such assessment had previously been made [25]. Importantly, all of these outcomes are recoverable from existing published data without requiring new fieldwork or remeasurement in the field. This matters not only for the specific trackways examined here, but as a proof of concept: applying the same approach systematically to existing published trackway data—regardless of whether asymmetry was previously suspected—may reveal patterns that qualitative inspection alone would never detect. The question of how prevalent locomotor asymmetry truly is in the dinosaurian fossil record remains unanswered and cannot be answered without testing. Standardised statistical protocols, applied systematically rather than only when asymmetry is visually apparent, would remove this observational threshold and allow for more reliable estimates of true asymmetry prevalence across the fossil record. Future extensions of this framework to additional parameters—including pace angulation and trackway width variability—may further refine interpretations of locomotor behaviour in extinct vertebrates [13].

Funding

This research received no external funding.

Data Availability Statement

Data is contained within the article.

Acknowledgments

The author thanks the two reviewers for their constructive comments, which improved the clarity and presentation of this manuscript. During the preparation of this work, the author used ChatGPT (OpenAI, GPT-5.2), an AI language model developed by OpenAI, to assist with the development of the custom Python script used within Blender for statistical trackway analysis, including code structuring and interface design, and the refinement of language throughout the manuscript for clarity and readability. All code and text outputs were subsequently reviewed, edited, and validated by the author, who takes full responsibility for the scientific content and presentation of this work.

Conflicts of Interest

The author declares no conflicts of interest.

References

  1. Bird, R.T. Did Brontosaurus ever walk on land? Nat. Hist. 1944, 53, 60–67. [Google Scholar]
  2. Thulborn, T. Dinosaur Tracks; Chapman and Hill: London, UK, 1990; p. xvii + 410 pp. [Google Scholar]
  3. Lockley, M.G. Tracking Dinosaurs: A New Look at an Ancient World; Cambridge University Press: Cambridge, UK, 1991; p. 238. [Google Scholar]
  4. Bernardi, M.; Gianolla, P.; Petti, F.M.; Mietto, P.; Benton, M.J. Dinosaur diversification linked with the Carnian Pluvial Episode. Nat. Commun. 2018, 9, 1499. [Google Scholar] [CrossRef] [PubMed]
  5. Xing, L.; Lockley, M.G.; Tang, Y.; Romilio, A.; Xu, T.; Li, X.; Tang, Y.; Li, Y. Tetrapod track assemblages from Lower Cretaceous desert facies in the Ordos Basin, Shaanxi Province, China, and their implications for Mesozoic paleoecology. Palaeogeogr. Palaeoclimatol. Palaeoecol. 2018, 507, 1–14. [Google Scholar] [CrossRef]
  6. Xing, L.; Lockley, M.G.; Mao, Z.; Klein, H.; Gu, Z.; Bai, C.; Qiu, L.; Liu, Y.; Romilio, A.; Scott Persons, W.; et al. A new dinosaur track site from the earliest Cretaceous (Berriasian) part of the Tuchengzi Formation, Hebei Province, China: Implications for morphology, ontogeny and paleocommunity structure. Palaeogeogr. Palaeoclimatol. Palaeoecol. 2021, 580, 110619. [Google Scholar] [CrossRef]
  7. Lockley, M.G.; Hunt, A.P.; Moratalla, J.J.; Matsukawa, M. Limping dinosaurs? Trackway evidence for abnormal gaits. Ichnos 1994, 3, 193–202. [Google Scholar] [CrossRef]
  8. Weems, R.E. Locomotor speeds and patterns of running behavior in non-maniraptoriform theropod dinosaurs. New Mex. Mus. Nat. Hist. Sci. Bull. 2006, 37, 379–389. [Google Scholar]
  9. Petti, F.M.; Porchetti, S.D.O.; Sacchi, E.; Nicosia, U. A new purported ankylosaur trackway in the Lower Cretaceous (lower Aptian) shallow-marine carbonate deposits of Puglia, southern Italy. Cretac. Res. 2010, 31, 546–552. [Google Scholar] [CrossRef]
  10. Lallensack, J.N.; van Heteren, A.H.; Wings, O. Geometric morphometric analysis of intratrackway variability: A case study on theropod and ornithopod dinosaur trackways from Münchehagen (Lower Cretaceous, Germany). PeerJ 2016, 4, e2059. [Google Scholar] [CrossRef]
  11. Salisbury, S.W.; Romilio, A.; Herne, M.C.; Tucker, R.T.; Nair, J.P. The Dinosaurian Ichnofauna of the Lower Cretaceous (Valanginian–Barremian) Broome Sandstone of the Walmadany Area (James Price Point), Dampier Peninsula, Western Australia. J. Vertebr. Paleontol. 2016, 36, 1–152. [Google Scholar] [CrossRef]
  12. Xing, L.; Buckley, L.G.; Lockley, M.G.; McCrea, R.T.; Tang, Y. Lower Cretaceous avian tracks from Jiangsu Province, China: A first Chinese report for ichnogenus Goseongornipes (Ignotornidae). Cretac. Res. 2018, 84, 571–577. [Google Scholar] [CrossRef]
  13. Romilio, A.; Murphey, P.C.; Matthews, N.A.; Schumacher, B.A.; Murphey, L.D.; Toscanini, M.; Boyce, P.; Fitzner, Z. Track by Track: Revealing Sauropod Turning and Lateralised Gait at the West Gold Hill Dinosaur Tracksite (Upper Jurassic, Bluff Sandstone, Colorado). Geomatics 2025, 5, 67. [Google Scholar] [CrossRef]
  14. Esperante, R.; McLarty, J.A.; Nick, K.E.; Pompe, L.R.; Biaggi, R.E.; Medina, H.D.B.; Llempen, N.A.; Silvestri, Á.B.L.; Quispe, L.L.M.; Cano, A.J.G.; et al. Morphotypes, preservation, and taphonomy of dinosaur footprints, tail traces, and swim tracks in the largest tracksite in the world: Carreras Pampa (Upper Cretaceous), Torotoro National Park, Bolivia. PLoS ONE 2025, 20, e0335973. [Google Scholar] [CrossRef]
  15. Dantas, P.; dos Santos, V.F.; Lockley, M.G.; Meyer, C.A. Footprint evidence for limping dinosaurs from the Upper Jurassic of Portugal. Gaia 1994, 10, 43–48. [Google Scholar]
  16. Huh, M.; Paik, I.S.; Lockley, M.G.; Hwang, K.-G.; Kim, B.; Kwak, S. Well-preserved theropod tracks from the Upper Cretaceous of Hwasun County, southwestern South Korea, and their paleobiological implications. Cretac. Res. 2006, 27, 123–138. [Google Scholar] [CrossRef]
  17. McCrea, R.T.; Tanke, D.H.; Buckley, L.G.; Lockley, M.G.; Farlow, J.O.; Xing, L.; Matthews, N.A.; Helm, C.W.; Pemberton, S.G.; Breithaupt, B.H. Vertebrate Ichnopathology: Pathologies Inferred from Dinosaur Tracks and Trackways from the Mesozoic. Ichnos 2015, 22, 235–260. [Google Scholar] [CrossRef]
  18. Razzolini, N.L.; Vila, B.; Díaz-Martínez, I.; Manning, P.L.; Galobart, À. Pes shape variation in an ornithopod dinosaur trackway (Lower Cretaceous, NW Spain): New evidence of an antalgic gait in the fossil track record. Cretac. Res. 2016, 58, 125–134. [Google Scholar] [CrossRef]
  19. Romilio, A.; Shao, C. Analysing trackway-based speed calculations to infer dinosaur locomotive capabilities and behaviours. Hist. Biol. 2024, 36, 2244–2253. [Google Scholar] [CrossRef]
  20. Romilio, A. Blender as a tool for palaeoichnological research: Case study from Lark Quarry. Geobios 2025, 88–89, 219–226. [Google Scholar] [CrossRef]
  21. Romilio, A.; Xing, L. A Digital Analysis of the ‘Phoenix Trackway’ at the Hanxi Cretaceous Dinosaur Tracksite, China. Geosciences 2025, 15, 165. [Google Scholar] [CrossRef]
  22. Ishigaki, S. Dinosaur footprints of the Atlas Mountians II. Nat. Study 1986, 32, 6–9. [Google Scholar]
  23. Ishigaki, S. Footprints of swimming sauropods from Morocco. In Dinosaur Tracks and Traces; Gillette, D.D., Lockley, M.G., Eds.; Cambridge University Press: Cambridge, UK, 1989; pp. 83–86. [Google Scholar]
  24. Moratalla, J.J.; Sanz, J.L.; Melero, I.; Jimenez, S. Yacimientos Paleoicnologocos de La Rioja (Huellas de Dinosaurios); Iberdrola y Gobierno de la Rioja: Logroño, Spain, 1988; p. 96. [Google Scholar]
  25. Xing, L.; Liu, Y.; Marty, D.; Kuang, H.; Klein, H.; Persons, W.S., IV; Lyu, Y. Sauropod Trackway Reflecting an Unusual Walking Pattern from the Early Cretaceous of Shandong Province, China. Ichnos 2017, 24, 27–36. [Google Scholar] [CrossRef]
  26. Hearn, L.; Williams, A.C.d.C. Pain in dinosaurs: What is the evidence? Philos. Trans. R. Soc. B Biol. Sci. 2019, 374, 20190370. [Google Scholar] [CrossRef] [PubMed]
  27. Xing, L.; Díaz-Martínez, I.; Lallensack, J.N.; Kim, K.S.; Buckley, L.G.; Romilio, A.; Piñuela, L.; Wang, D.; Chen, Q.; Yang, Q.; et al. Chapter 7—Cretaceous vertebrate tracks. In Vertebrate Ichnology; Lucas, S.G., Hunt, A.P., Klein, H., Eds.; Elsevier: Amsterdam, The Netherlands, 2025; pp. 479–747. [Google Scholar]
  28. Romilio, A.; Tucker, R.T.; Salisbury, S.W. Re-evaluation of the Lark Quarry dinosaur tracksite (late Albian–Cenomanian Winton Formation, central-western Queensland, Australia): No longer a stampede? J. Vertebr. Paleontol. 2013, 33, 102–120. [Google Scholar] [CrossRef]
Disclaimer/Publisher’s Note: The statements, opinions and data contained in all publications are solely those of the individual author(s) and contributor(s) and not of MDPI and/or the editor(s). MDPI and/or the editor(s) disclaim responsibility for any injury to people or property resulting from any ideas, methods, instructions or products referred to in the content.