1. Introduction
Post-operative pulmonary complications (PPCs) are linked to increased morbidity, mortality, and extended hospital stays, making them a significant concern in perioperative care. Every year, over 300 million surgical patients worldwide receive general anesthesia [
1]. In the United States, more than 1 million PPCs occur annually, resulting in 4.8 million additional hospital days and contributing to 46,200 deaths [
2]. In addition, PPCs impose a substantial financial burden, with healthcare costs increasing due to ICU treatment, reoperation, or readmission. These complications are estimated to add between
$11,626 and
$19,626 per patient stay in additional healthcare expenses [
3].
Upon induction of general anesthesia, the respiratory system undergoes immediate alterations, including changes in respiratory drive, impaired muscle function, reduced lung volumes, and atelectasis in over 75% of patients who receive neuromuscular blocking agents [
4]. They occur frequently, have significant negative impacts on patients, and are often difficult to predict [
4]. The term ‘postoperative pulmonary complication’ refers to a broad range of respiratory issues that arise after anesthesia and surgery and is commonly defined as any pulmonary abnormality arising during the postoperative period, which leads to clinically significant dysfunction or an identifiable disease leading to adverse clinical effects [
5]. The wide range of pulmonary complications consistently reported in the literature encompasses conditions such as acute respiratory distress syndrome, atelectasis, bronchospasm, pneumonia, pneumothorax, and respiratory failure, which may require noninvasive or mechanical ventilation. Some studies further extend the definition to include prolonged supplemental oxygen via nasal cannula or facemask for more than 24 h postoperatively [
6]. Other studies adopt a broader approach, incorporating conditions like aspiration pneumonitis, transfusion-related acute lung injury, bronchitis, exacerbation of pre-existing lung disease, or pulmonary embolism [
7]. The definition of PPC remains heterogeneous across the literature, with no single universally adopted standard. This problem has persisted for decades and is now the subject of an active international Delphi consensus effort [
6]. In part because these complications are variably defined, the incidence of PPCs varies widely, ranging from 2% to 70%, depending on factors such as definition, risk factors, and severity [
3,
4,
5,
6]. The goal of this work was to develop and apply a better system for defining and measuring PPCs among the general, low-risk surgical population in a large tertiary medical center.
2. Materials and Methods
A retrospective, descriptive, and observational design was used to define PPCs at a 648-bed Level II, Trauma Level 1 hospital in Washington state. A large dataset created from surgical encounters contained within the hospital electronic health record (EHR) was assembled by a facility data sponsor and an experienced data scientist. Inclusion criteria consisted of adult cases, ages 18–89 years of age, undergoing elective surgery with general endotracheal anesthesia from 2015 to 2023. To intentionally eliminate cases known to be at the highest risk for PPCs, the following exclusion criteria were applied: diagnosis of COVID-19 at any time during the encounter; BMI ≥ 50; American Society of Anesthesiologists (ASA) physical classification score ≥ 5 (5 is not expected to survive without surgery; 6 is used exclusively for patients who have been declared brain-dead) [
8]; urgent or emergent cases; obstetrical, cardiothoracic, and pulmonary service lines. A separate analysis of high-risk cases is planned.
Multiple predictor variables were chosen from the medical record for evaluation based on their value to predict PPC in the scholarly literature. These included the following demographic characteristics: age in years on the day of procedure, BMI, male or female sex, ASA status, the use of home oxygen or home oxygen devices, pre-operative diagnoses of asthma, COPD, neuromuscular disease, and smoking status. This information is documented during a pre-anesthesia assessment performed by the anesthesiology provider (vs. discrete ICD-10 codes) and was retrieved as structured data from their notes. Obstructive sleep apnea (OSA) was identified by diagnosis (17%) or a presumptive, undiagnosed case identified through pre-operative nursing assessment with the STOP-BANG evaluation (7%). The STOP-BANG questionnaire is a widely validated screening tool for OSA [
9]. It consists of eight dichotomous items with a total score ranging from 0 to 8. At a cutoff of ≥3 for identifying intermediate risk (3–4) for disease, the STOP-BANG has a sensitivity of 93% for moderate-to-severe OSA and 100% for severe OSA and is thus widely used to identify anesthetic risk in an under-diagnosed surgical population [
10]. To be more conservative in attribution, a flag was created for STOP-BANG scores ≥5 (high risk for moderate to severe OSA). Case characteristics included case duration, procedure service line (i.e., orthopedics, gynecology), laparoscopic or robotic cases, and deep vs. awake extubation. Pre-operative pulse oximetry means were calculated using start and stop time stamps in the admission unit, averaging the total number of readings, removing the high and the low values.
The measured outcome of interest was the presence of a PPC, defined by a carefully curated list of ICD-10 diagnoses (
Table 1), initially described by Abbot et al. [
11]. The Standardised endpoints in perioperative medicine (StEP-COMPAC) consensus has been increasingly adopted as the reference standard in the recent literature [
12] and served as the baseline for this project. All diagnoses from the Abbot et al. paper were reviewed for inclusion by subject matter experts, led by a board-certified pulmonologist and medical school clinical instructor. Diagnoses that were considered to be the result of community-acquired infection rather than surgical or anesthesia intervention were excluded. Diagnoses that were present on the chart between admission and anesthesia start were not counted as a PPC. Diagnoses that were placed on the chart between anesthesia stop and seven days post-discharge were counted as PPCs, to account for pneumonias developed post-discharge and diagnosed at re-admission. Recently, the Designation Trial used an endpoint of five days postoperatively [
13], but seven days was chosen to align with the PRIME-AIR trial CMS guidelines for preventable readmissions [
7,
14,
15].
If any eligible ICD code was on the chart, the case was counted as a PPC. If multiple diagnoses were present on the chart (as happens when an initial non-specific diagnosis is made and then clarification of the pathogen necessitates a more specific diagnostic code), the case was counted as one PCC. All elective cases (versus urgent, emergent or return to operating room) meeting inclusion criteria were included in the dataset, so there exists a small possibility that an individual may have had more than one elective surgery during the same encounter, each potentially contributing to the development of a PPC. This was not expected to change the incidence rate of PPCs.
Each PPC case was then categorized as mild, moderate, or severe according to methods described by others [
7,
11] with some exceptions. Due to restrictions in the ability to pull data from the sponsoring facility EHR and the nature of retrospective observational data pulls versus prospective clinical trial documentation, the severity of PPCs was calculated based on the presence of oxygen delivery mechanisms, described in
Table 2, applied at least 20 min after anesthesia stop, to account for transfer time with supplemental oxygen from the operating room to the post-anesthesia care unit. Atelectasis, for example, is not routinely documented discretely in the EHR and cannot be used as a factor impacting severity. The pulmonologist worked with the data scientist, using standard equations, to convert oxygen flow in liters to a fraction of inspired oxygen (Fi02) metric. Others have dichotomized PPCs into severe and non-severe categories [
16], but it was thought to be helpful to differentiate a mild category of oxygen therapy, which might be examined as an early PPC prevention strategy in future work.
Cases with multiple oxygenation delivery strategies were assigned to the severity category corresponding to their highest delivery strategy to create exclusive categories. For example, cases that initially used a high-flow nasal canula and then CPAP were recorded as severe. Several covariates were transformed; for example, a variable “new CPAP” was created that subtracted cases where home CPAP was used from the use of CPAP in hospital, to eliminate expected use (in-home or baseline use) and separate it from a rescue strategy. This process was followed for any oxygen therapy (home nasal cannula, BiPAP) included in the dataset.
Missingness was observed in several covariates, including pulse oximetry (1.8%), case duration (2.1%), ASA classification (3.2%), and body mass index (BMI; 5.1%). To address missing data, multiple imputation by chained equations (MICE) was implemented under the assumption of missing at random [
17]. Imputation models included all variables used in the primary analysis. A total of five imputed datasets were generated, and parameter estimates were combined using Rubin’s rules. All subsequent analyses, including ordinal regression models, were conducted on the imputed datasets. Given the large sample size and low degree of missingness, this approach was not expected to introduce meaningful bias. Five BMI values < 10, thought to be erroneous, were removed from the dataset and, in effect, were treated as missing data. Case durations more than four standard deviations from the mean were considered to be erroneous data points, and those values were similarly removed, leaving the cases otherwise intact.
Univariate analyses were completed. Categorical variables were reported using a frequency distribution. Continuous variables were assessed for symmetry. If the continuous variable was skewed, the median and interquartile range (IQR) were reported. If the continuous variable was symmetrical, the mean and standard deviation (SD) were reported. Bivariate analyses were used to compare demographic and clinical case characteristics. Chi-square analysis was used to compare hypothesized group differences in categorical variables. Mann–Whitney U was used to compare hypothesized group differences in continuous variables with skewed distributions. Independent-samples t-tests were used to compare hypothesized group differences in continuous variables that were symmetrically distributed. Effect size indexes were calculated for all significant results.
An adjusted logistic regression model was utilized to examine patient and case characteristics associated with the development of any PPC. Only variables that were independently statistically significant were considered for the multivariable model and were entered in a forward stepwise fashion in order of the largest effect size. Variables were retained in the model if the variable increased the explanatory power of the model, demonstrated by at least a 10% increase in the adjusted R-squared. In a similar fashion, a parsimonious ordinal regression was used to identify risk factors associated with the development of PPCs by severity. Formal internal validation procedures (e.g., bootstrapping or cross-validation) were not performed. The variable selection method of univariate significance plus forward stepwise entry and increment criteria can be susceptible to instability and overfitting bias. However, given the large sample size and stability of effect estimates, the risk of model overfitting was reduced. Future work will incorporate validation techniques to assess model generalizability.
3. Results
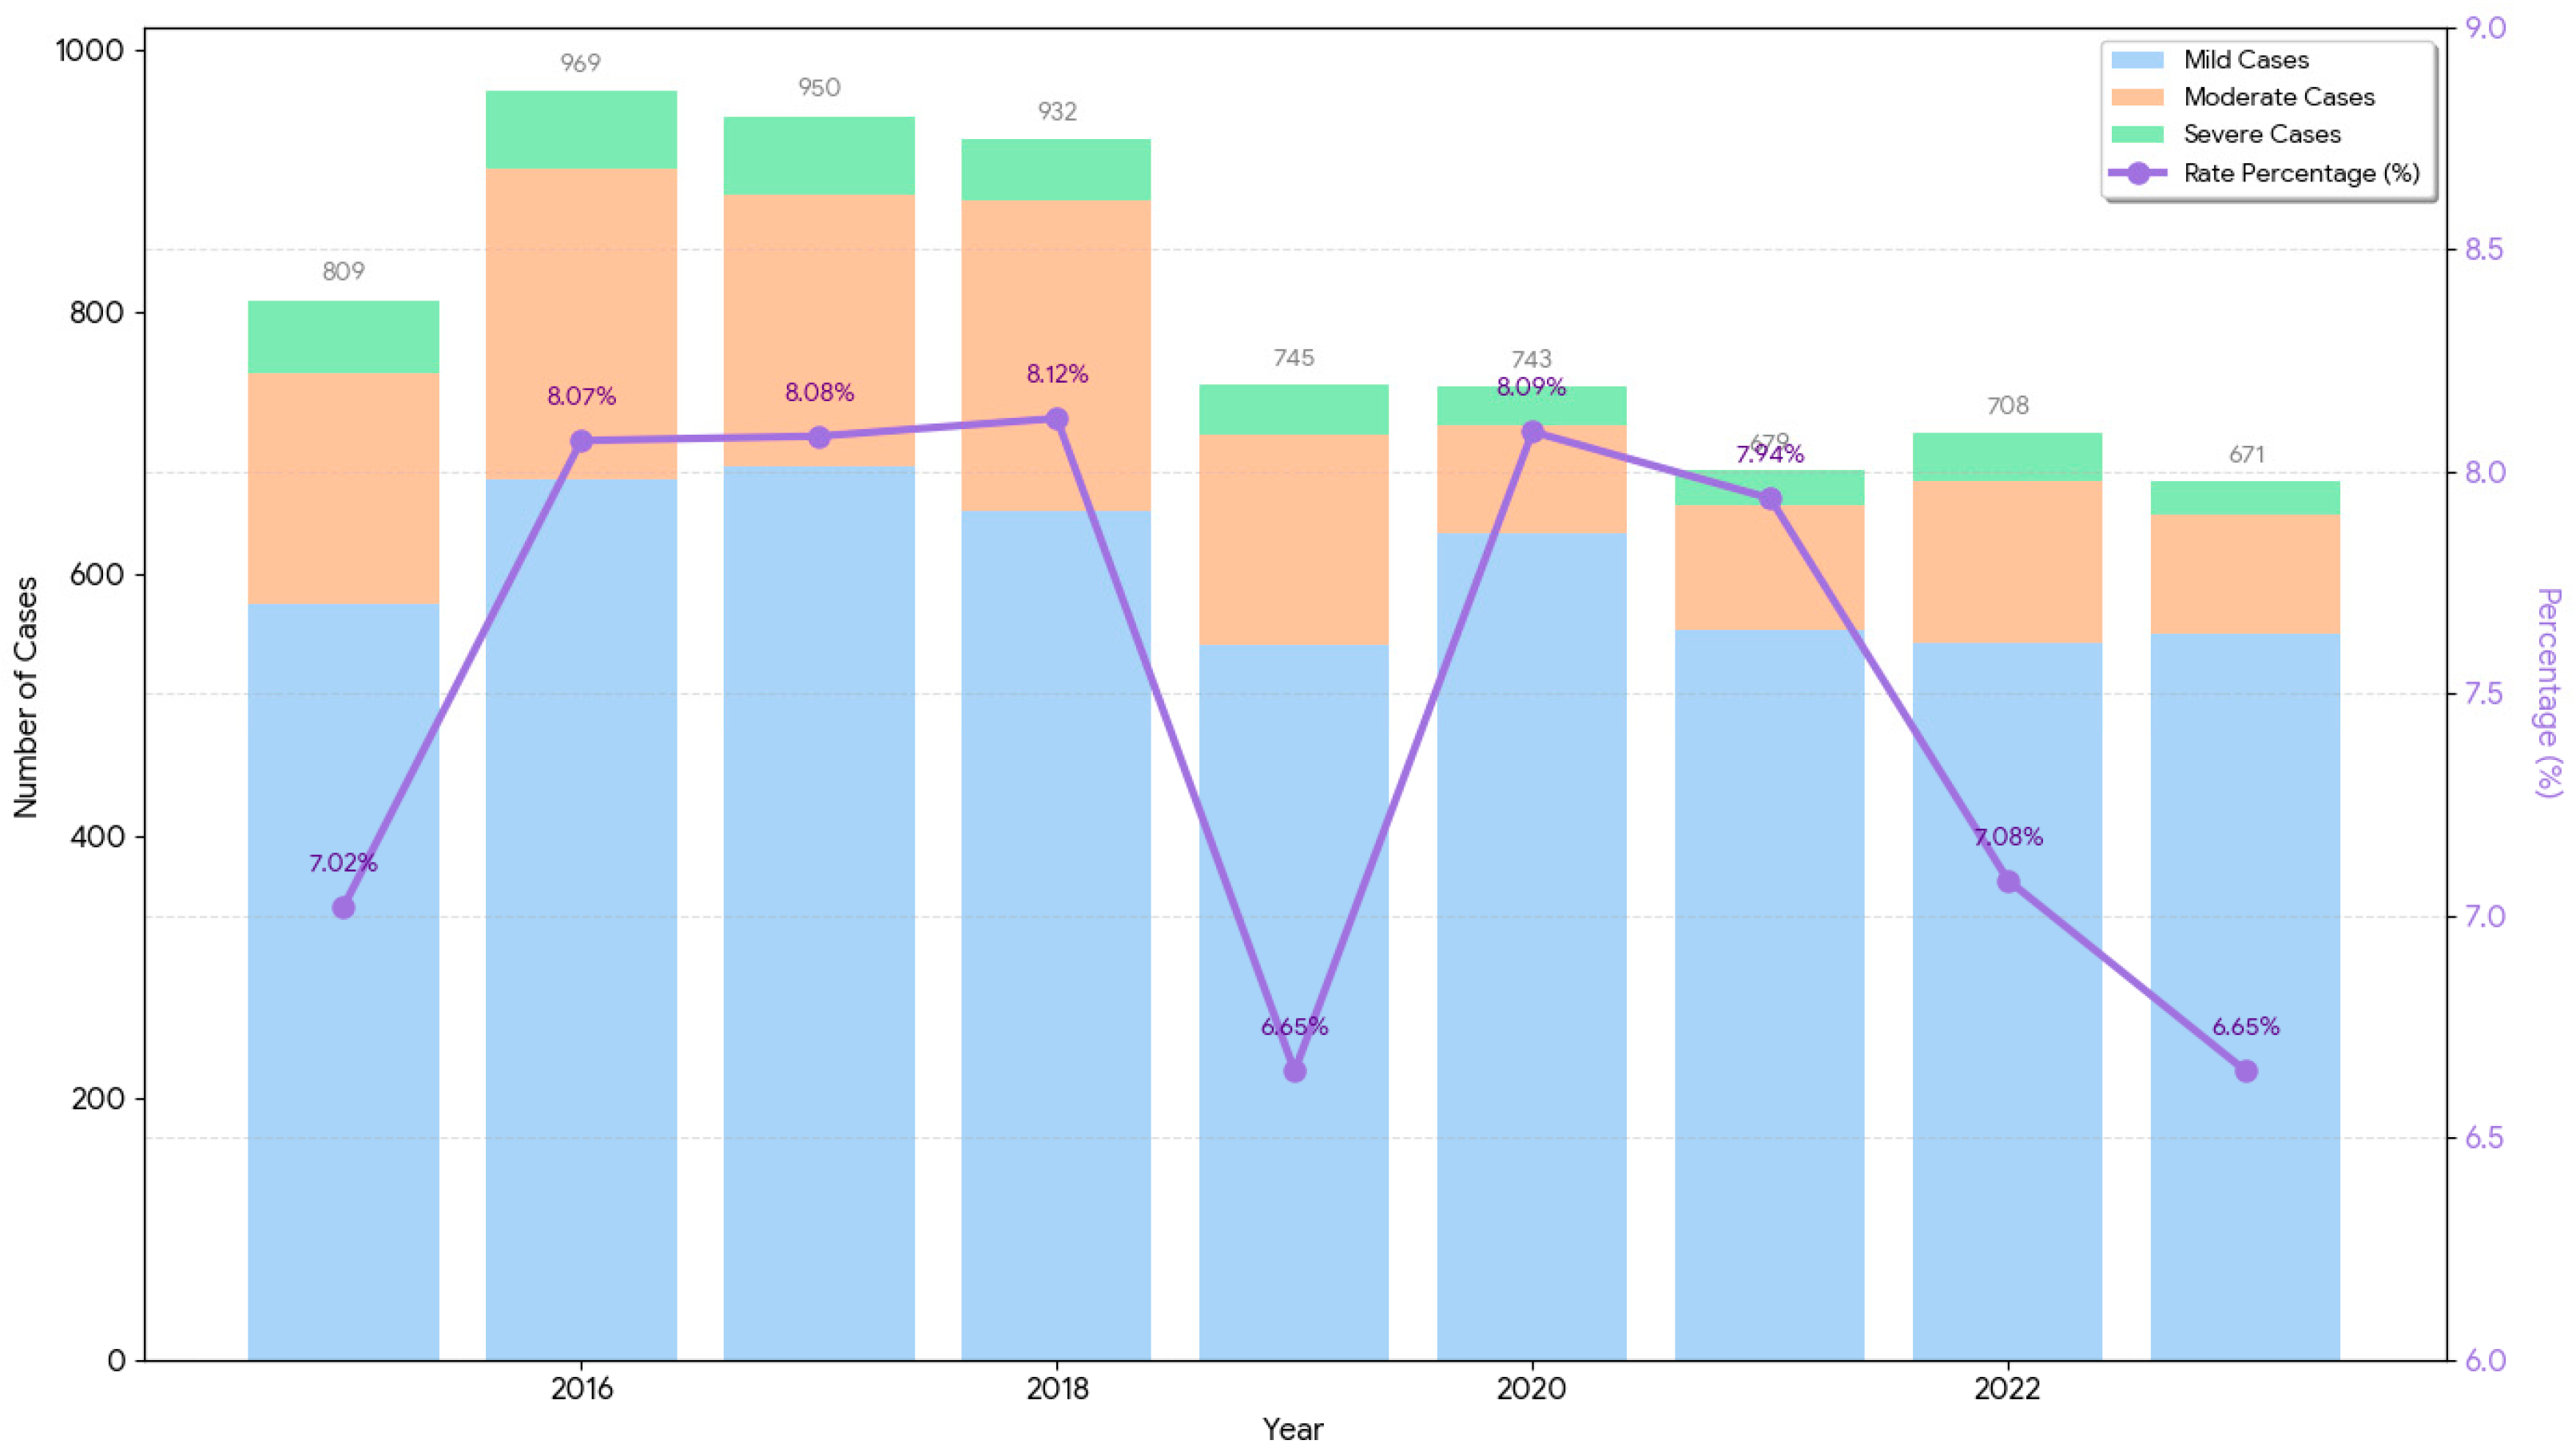
There were 95,808 cases contained in the dataset. The overall PPC rate was 7.52% (n = 7206). Mild cases comprised 5.65% of total cases (n = 5417); moderate cases comprised 1.47% of total cases (n = 1410); severe cases comprised 0.40% of total cases (n = 379). The incidence rate by year is visualized in
Figure 1. PPCs were at the highest point in 2018 (8.12%). Significant drops occurred in 2019 and 2023, both recorded at 6.65%. While the volume of cases has fluctuated, the percentage has remained largely stable, between 6% and 8%.
3.1. Demographic and Case Characteristics
Patients undergoing surgery had an average age of 57 years. There were more females (55%) than males (45%). Most patients had a lower risk ASA score of 1 or 2 (52%), whereas 45% had a higher risk score of 3–4. Thirteen percent of patients endorsed smoking, and some were known to have pre-existing respiratory disease: Asthma (15%); COPD (6%); OSA (17%) or STOP-BANG score ≥ 5 (7%). The median BMI of the sample was 29, notably in the overweight vs. obesity, Class I category. The median case duration was 111 min in length. See
Table 3 for demographic and case characteristics.
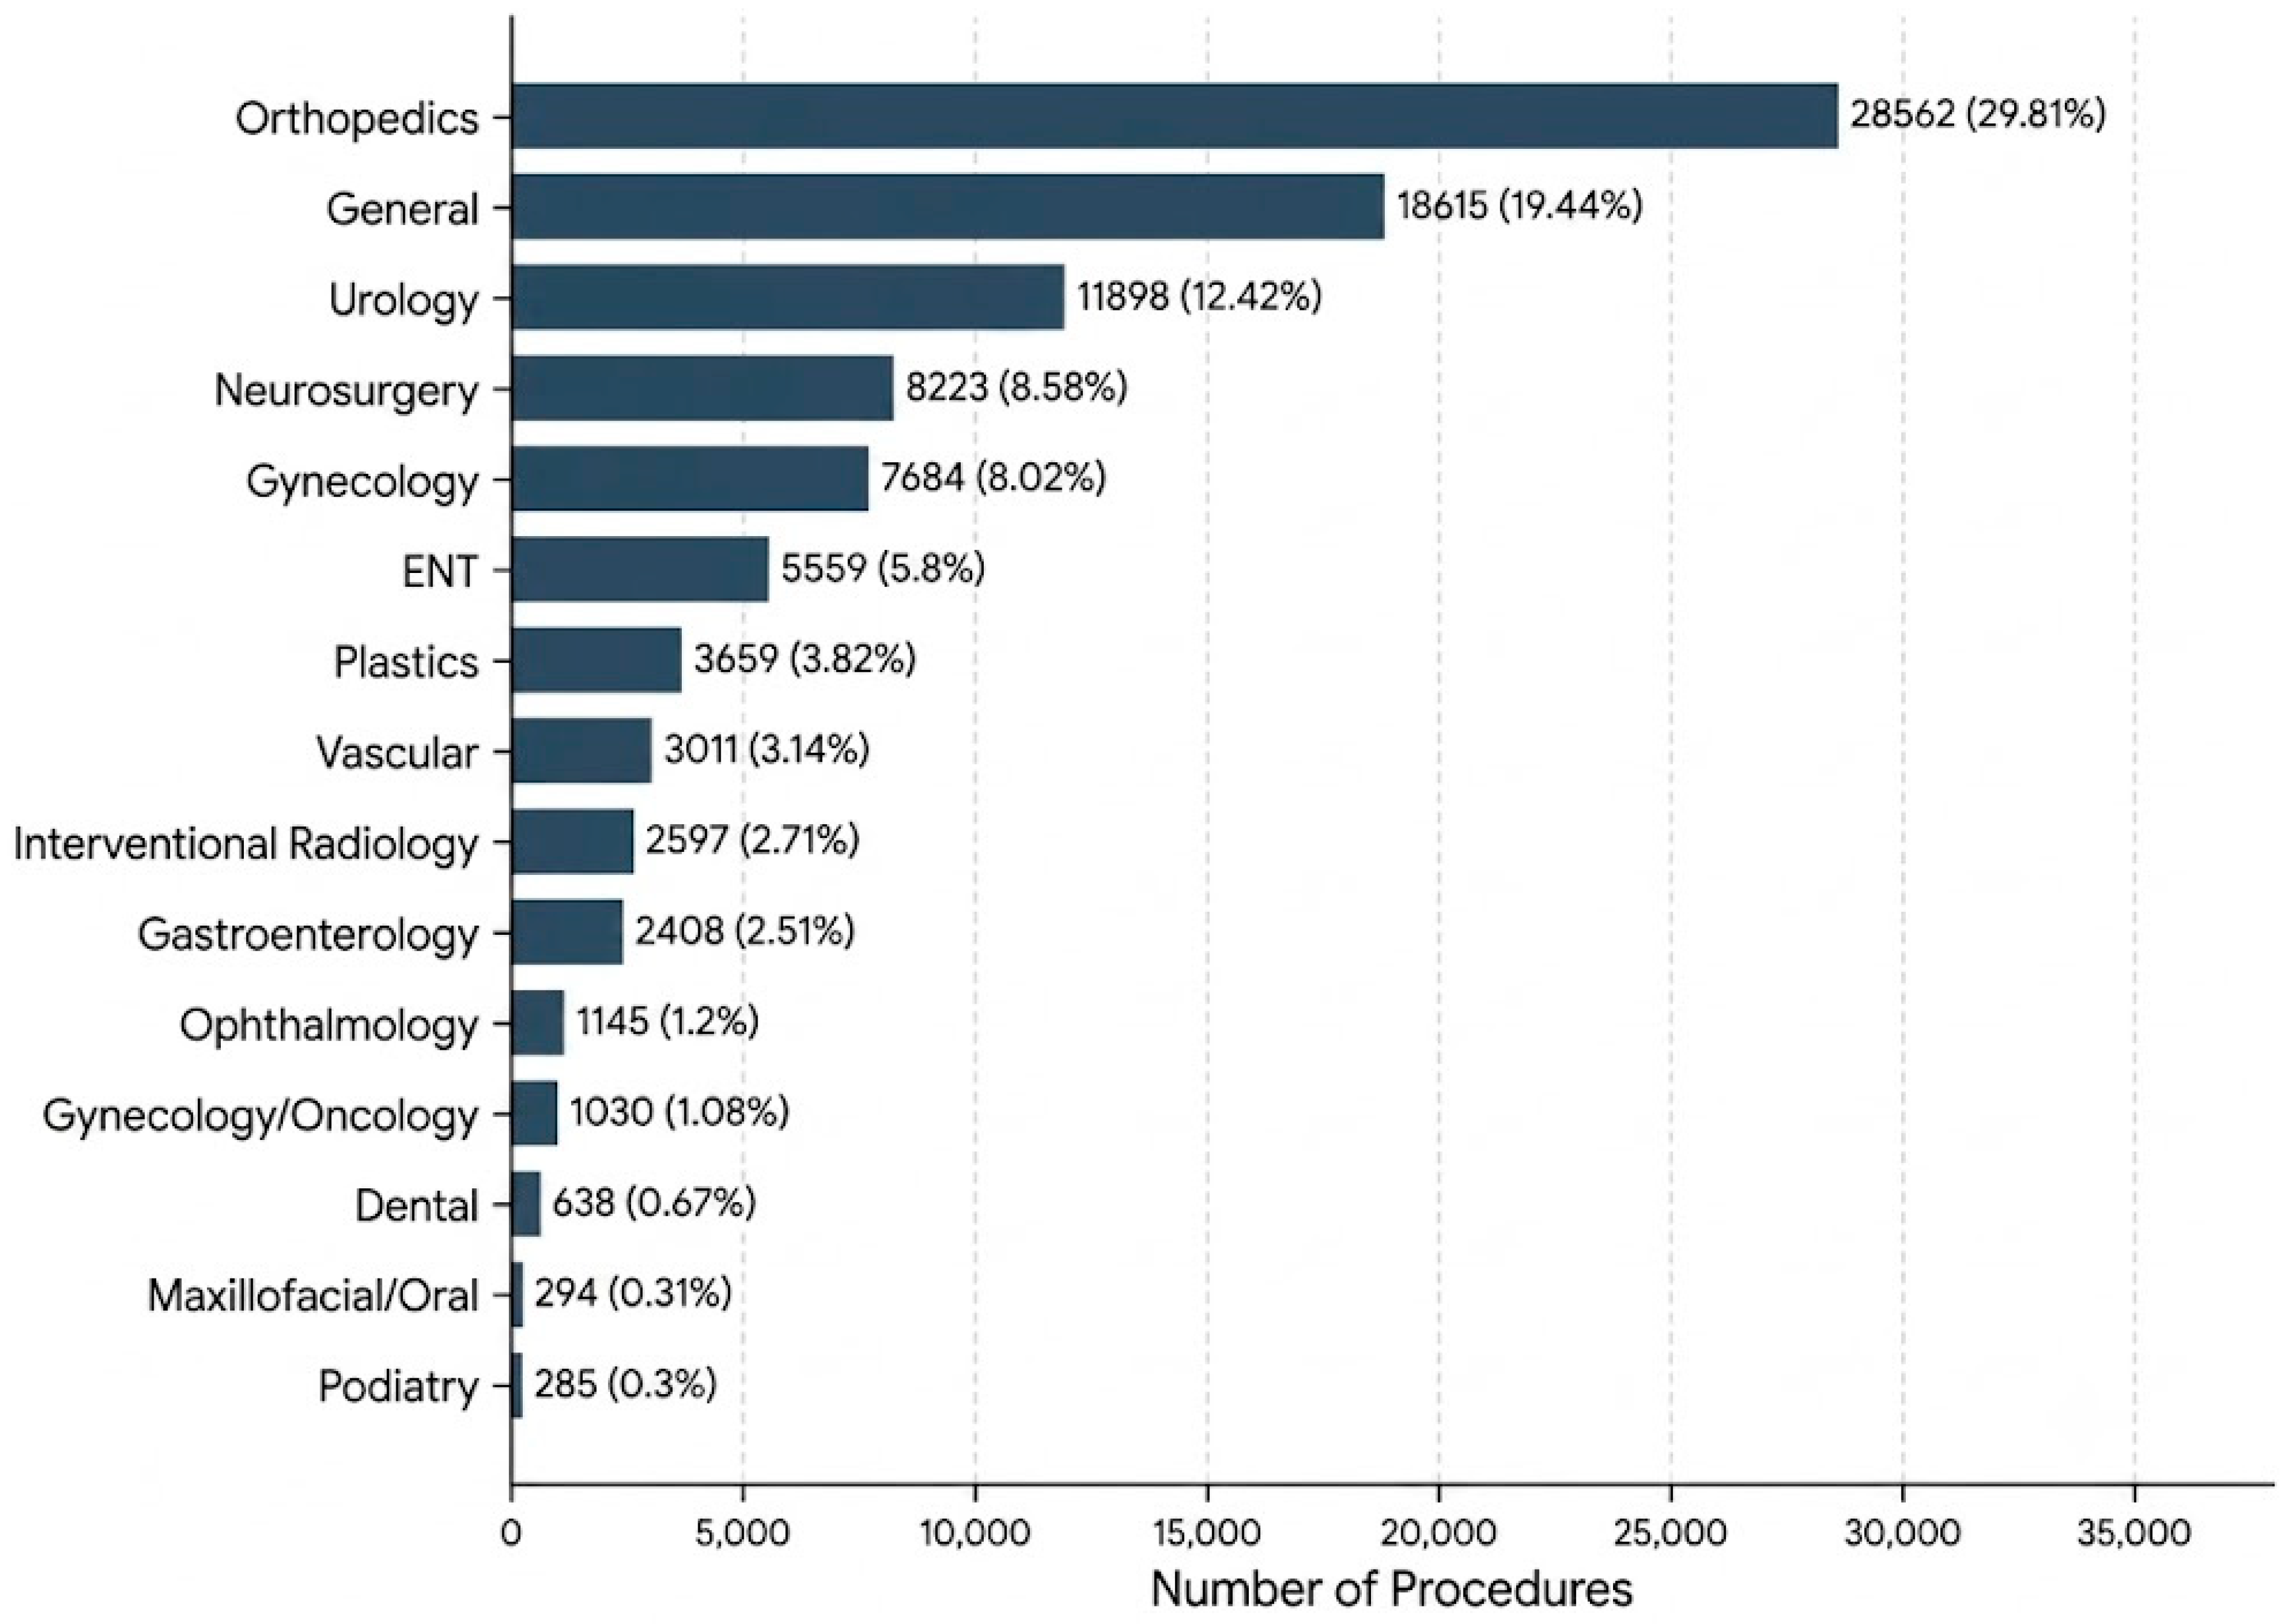
Figure 2 presents surgical case volume by service line. The largest case volumes were attributed to orthopedic and general surgery procedures, followed by neurosurgery and gynecology.
3.2. Risk Factors Independently Associated with the Development of a PPC
Bivariate analyses were conducted to evaluate the impact of multiple predictor variables on the development of any PPC, using a 95% confidence interval (
Table 4).
There was statistical significance between the PPC and no PPC cohorts that was predictable given the cohort size; thus, the effect size index (ESI) was calculated to estimate clinical significance, which may be more meaningful than achieving statistical significance at an alpha of 0.05. Pre-operative pulse oximeter means had the largest ESI, followed by age, case duration, and ASA score. Documented and presumed OSA, COPD, BMI, and the use of oxygen by nasal canula at home, followed by ESI ranging from 0.075 to 0.022. A diagnosis of asthma, a report of current smoking status, robotically assisted procedures, and the use of a home oxygen device (i.e., either CPAP or BiPAP for OSA) were statistically significant but had negligible effect sizes.
Diagnoses of asthma or neuromuscular disease and laparoscopic cases were not significantly associated with PPC occurrence (p > 0.05).
3.3. Adjusted Odds of PPC
A binary logistic regression was conducted to examine whether various risk factors predicted PPCs in a multivariable model. The overall model was statistically significant, χ2(df = 5, N = 95,808) = 44,442, p < 0.001, explaining 10% of the variance (Nagelkerke R2 = 0.106) and correctly classifying 92.4% of cases.
ASA was the strongest predictor in the model (
Table 5). Moderate risk ASA scores (3,4) had twice the odds of developing a PPC compared with lower ASA scores (1,2). Patients with OSA or COPD as pre-existing conditions had 1.5 times higher odds of developing PPC. Long cases were associated with increased risk. For every additional minute, the odds of PPC increased by 0.5%. Average pre-operative oxygen saturation was identified as a protective factor; for every 1% increase in baseline oxygen saturation, there was a 11.5% decrease in the odds of developing a PPC.
As expected with very small ESI, the following factors did not retain significance in the adjusted model: age, BMI, robotic approach, smoking, asthma, and sex. Home oxygen use, home oxygen device use, and the STOPBANG score did not increase the Nagelkerke R2 by at least 10% and therefore were not included in the model.
3.4. Factors Associated with PPC Severity
An ordinal logistic regression model was used to evaluate the association between clinical predictors that were significant in bivariate testing and the outcome variable, PPC severity, coded as 0 (no PPC), 1 (mild), 2 (moderate), or 3 (severe). Ordinal regression analyses performed on the imputed datasets yielded results consistent with those obtained from the complete-case analysis, indicating that missing data did not materially affect the primary findings. The McFadden R
2 value of 0.1442 is a reasonable fit for discrete choice and ordinal models [
18]. While lower than traditional linear functions, values between 0.2 and 0.4 are typically considered representative of a good fit. Approximately 18.4% of the variation in clinical severity is explained by the predictors in the model (Nagelkerke R
2 = 0.1838), exceeding the 15% threshold established as a benchmark for meaningful clinical relevance [
18].
Patients with moderate-risk ASA scores (3,4) had significantly higher odds of postoperative pulmonary complications (PPC) than those with lower ASA scores (1,2). Specifically, the odds increase by 81% for mild PPC (
Table 6), 116% for moderate PPC (
Table 7), and 253% for severe PPC (
Table 8). These findings suggest a strong positive association between increasing ASA classification and progression to more severe PPC categories.
The presence of COPD as a pre-existing condition was also associated with elevated odds of PPC. The odds of mild and moderate PPC were increased by 46%, while the odds of severe PPC were increased by 77%, indicating a greater effect on more severe outcomes.
Other covariates demonstrate varying levels of association. Home BiPAP and home CPAP use were associated with substantially elevated odds of PPC across categories, particularly for moderate and severe outcomes. Smoking and asthma were associated with modest increases in odds across PPC categories. OSA showed a differential effect, with increased odds of mild and moderate PPC (OR = 1.04 and 1.46, respectively) but decreased odds of severe PPC (OR = 0.58). Age appeared to have a negligible effect across all categories.
In contrast, higher mean pulse oximetry and home oxygen use were associated with decreased odds of PPC across categories. Furthermore, for each one-unit increase in mean pulse oximetry, the odds of falling into any PPC category decrease by approximately 11%, holding other variables constant.
Overall, these results indicate that several clinical factors, particularly ASA classification and COPD status, were strongly associated with increased severity of PPC.
4. Discussion
4.1. Overall Incidence
The overall incidence of PPCs observed (7.52%) among this general population of surgical patients, the majority of which were categorized as mild (5.65%), is within the expected range reported in the scholarly literature for low-risk surgical populations. Moderate (1.47%) and severe (<1%) cases of PPCs were rare. The wide range in reported incidence (2–70%) is partly attributable to heterogeneous definitions of PPCs and often to the inclusion of atelectasis, which is common and a problem that this project was designed to address. These findings demonstrate a feasible methodology for moving forward with efforts to validate the measurement and data science strategy and to benchmark performance toward an important quality metric.
The complexity of PPCs among the worlds of anesthesia, surgery, and pulmonary medicine necessitated a multifaceted approach that transcended traditional clinical silos. Addressing this real-world problem through the creation of a massive dataset required diverse skills and perspectives for both the technical construction of the dataset and the clinical interpretation of the findings. By assembling an interprofessional team of certified nurse anesthetists and medical students, biostatisticians, informaticists, and faculty subject matter experts, stakeholders were able to navigate the intricacies of cohort assembly and outcome ascertainment that a single discipline might have overlooked. Specifically, diagnosticians trained in pulmonary medicine provided an essential perspective on the PPCs for which surgery and anesthesia could not reasonably be held accountable.
4.2. Predictors of PPC
Some variables of interest known to impact PPC risk in the literature and found to be independently associated with PPC in this analysis did not persist in multivariable modeling focused on factors associated with PPC. While certain variables may show a strong independent association with PPCs in preliminary analysis, they often lose significance in more complex models. Seminal studies attribute this to the fact that multivariable modeling accounts for shared variance and confounding factors that bivariate tests overlook [
19,
20]. Advancing age and higher BMI likely represent reduced physiologic reserve, frailty and comorbidity burden, all of which may decrease tolerance of intraoperative pulmonary changes. Similarly, preexisting pulmonary disease, including COPD and the requirement for home oxygen, identifies patients with baseline respiratory compromise. Collectively, these findings suggest that PPC risk is concentrated among patients with limited baseline cardiopulmonary reserve and those undergoing more physiologically demanding procedures. In this analysis, the impact of specific risk factors likely overlapped with higher ASA classifications, home oxygen use, and prolonged case durations. This redundancy indicates that multicollinearity and mediating factors may have masked the independent effects of the individual variables.
Use of CPAP and BiPAP was associated with large, estimated odds ratios for PPCs. These findings should be interpreted cautiously. The observed associations may reflect confounding by indication, as patients requiring CPAP or BiPAP are likely to have greater baseline risk. In addition, the relatively small number of patients using CPAP (n = 2592) and BiPAP (n = 423) may contribute to instability in the estimated effects (
Table 9).
The potential for confounding effects in this analysis is noted and should discourage overinterpretation of the results of the adjusted analysis. The retrospective, observational design acknowledges the potential for selection bias among patients who were cleared for elective surgery, who may have been healthier than matched comparisons of the same age and sex with the same BMI for example, with potentially fewer known comorbidities. Lower BMI in surgical cohorts may reflect diminished physiological reserve, frailty, malnutrition, or occult illness, which may increase PPC risk [
21]. It is also possible that treatment by indication bias is responsible for driving PPC rates among a vulnerable subpopulation who were predisposed to PPCs if they received more lung-protective ventilation strategies or recruitment maneuvers (i.e., intraoperative adjustments to PEEP) intraoperatively, for example. The effect of these biases may have even extended to post-operative care aimed at early mobilization and more frequent incentive spirometry or respiratory therapy. These variables were unmeasured in the analysis. The sampling strategy intentionally targeted a low-risk population and therefore a floor effect could explain the flattening or flipping of higher-risk outliers. Future work will focus on teasing out these influences.
The findings, however, are not surprising, as the risk factors for PPC and PPC severity identified in this analysis are well represented in the scholarly literature and may therefore be considered triggers for PPC prevention in clinical settings. Patients with elevated ASA class, chronic pulmonary disease, sleep-disordered breathing requiring home CPAP or BiPAP, tobacco exposure, and prolonged operative duration represent a phenotype at heightened risk for NAP4-described complications [
22] related to atelectasis, ventilator-associated lung injury, and postoperative hypoventilation.
4.3. Clinical Implications
Patients with pre-existing conditions have difficulty breathing for different reasons. Patients with OSA have increased upper airway collapsibility on inspiration, while those with COPD, asthma, or a significant smoking history have increased expiratory airway resistance with concomitant increased work of breathing. In obesity with OSA, there is reduced functional residual capacity with increased chest wall compliance, elevating the risk of atelectasis and increasing the work of breathing.
Under general anesthesia, a standard fixed positive end-expiratory pressure (PEEP) of 5 cm H
2O is frequently insufficient to maintain PEEP. Consequently, explicit lung-protective ventilation strategies are essential. The research evidence suggests that individualized PEEP settings dramatically improve oxygenation and lower driving pressure compared to fixed low PEEP [
23]. This approach is particularly vital in COPD populations, where heterogeneous lung mechanics create a precarious balance: excessive PEEP risks dynamic hyperinflation and air trapping, while inadequate PEEP permits alveolar collapse. Recent studies indicate that driving pressure-guided PEEP improves dynamic compliance and reduces systemic inflammation, even when the resulting titrated PEEP remains modest (~6.4 cm H
2O) [
24]. Similarly, patients with asthma or smoking-related airway resistance benefit from this tailored approach, as it optimizes alveolar recruitment without causing the overdistension seen in “one-size-fits-all” protocols [
25]. Multiple meta-analyses confirm that individualized PEEP titration in these high-risk populations reduces the incidence of PPCs [
13,
26,
27,
28]. These interventions should be integrated with other evidence-based intraoperative measures, including goal-directed fluid therapy and the judicious use of short-acting neuromuscular blocking agents, both of which further mitigate PPC risk [
21].
In addition, pre- and post-operative prevention strategies can be effective at reducing the likelihood of developing PPCs. Preoperative measures such as smoking cessation at least four weeks prior to surgery lead to fewer respiratory and wound healing complications [
29]. A combination of therapies promoting lung expansion postoperatively has been shown to improve patient outcomes and shorten hospital durations. These interventions include: incentive spirometer, early mobilization, directed coughing, deep breathing exercises, chest physiotherapy, inspiratory muscle training, and providing adequate analgesic therapy by reducing pain-related hypoventilation and respiratory muscle dysfunction [
30].
4.4. Limitations
Although a large dataset was assembled, it relied entirely on clinical EHR data, which may have inadvertently included errors, omissions, inconsistencies in coding, or documentation bias, leading to misclassification of PPCs. The magnitude of the effect could have been diminished if pre-operative diagnoses (i.e., asthma, COPD, smoking status) were not properly documented. However, the potential for bias due to missing data was considered minimal due to the large sample size and the absence of evidence suggesting non-random missingness. PPCs may have been underrepresented in this dataset due to a variety of factors. First, PPCs that occurred more than seven days after discharge or when patients were transferred or readmitted by a different facility would not be captured. Second, the subtraction method for creating new oxygen therapy variables (e.g., “new CPAP”) when known home use occurred may have missed cases where documentation was simply incomplete. It is readily acknowledged that changing the definition of PPC may change the incidence rate. Nonetheless, this approach provides a baseline for consistent application to trend results over time. The single-center design of this analysis limits generalizability, yet the use of two adjusted regression models informs characteristics that drive the risk of PPC in the general surgical population. As these findings are consistent with what the scholarly literature identifies as PPC risk factors, readers are encouraged to consider how they may apply these insights to their own surgical populations.
4.5. Next Steps
Some features that may have proven helpful to categorizing PPC severity that were included in the Abbot et al. paper were unavailable (e.g., reduced functional status, anemia, hypoalbuminemia, congestive heart failure). Future work to develop structures to abstract these elements from the EHR, as well as others that may result from the PrECiSIOn consensus [
6], persist.
Steps were intentionally taken to create a low-risk dataset to better understand the experience of the typical patient who undergoes anesthesia. Nearly 25% of postoperative deaths in the first week after surgery are associated with PPCs [
31], providing sufficient rationale for examining incidence rates in the general population. Rates of PPCs among high-risk surgical populations are reported at 20–70%, whereas low-risk surgical populations experience greatly reduced rates of 2–5% [
31]. Total incidence rates of PPCs would have been higher if higher-risk procedures (i.e., non-elective, cardiothoracic or cardiopulmonary cases with higher ASA scores) had been included. This is a focus of future work.




 ,
,