Article

Bioparticle Sources, Dispersion, and Influencing Factors in Rural Environmental Air

1
Key Laboratory of Environmental Pollution Control and Remediation, College of Resources and Environmental Engineering, Inner Mongolia University of Technology, Hohhot 010051, China
2
School of Materials Science and Engineering, Beihang University, Beijing 100191, China
3
State Key Laboratory of Environmental Aquatic Chemistry, Research Center for Eco-Environmental Sciences, Chinese Academy of Sciences, Beijing 100085, China
*
Authors to whom correspondence should be addressed.
These authors contributed equally to this work.
Aerobiology 2025, 3(2), 4; https://doi.org/10.3390/aerobiology3020004
Submission received: 25 March 2025 / Revised: 1 May 2025 / Accepted: 12 May 2025 / Published: 13 May 2025

Abstract

:
Rural villages function as relatively self-sustained production and living units with well-developed infrastructure. In this setting, investigating the transmission pathways of airborne biological particles, including pathogenic microorganisms, is pivotal for ensuring the health of residents. This study investigated the sources and dispersion of biogenic particulate matter in rural ambient air and factors influencing their behavior. Potential bioaerosol sources including livestock farming areas, composting sites, garbage dumps, and sewage treatment facilities were investigated using a calibrated portable bioaerosol detector to collect and analyze the dispersion of bioaerosol particles. The dispersal characteristics of Enterobacteriaceae were explored using an Andersen six-stage sampler. Livestock farming areas were the primary source of bioparticles. The distribution of the bioparticles varied significantly with environmental conditions. Key factors influencing their distribution included the dispersal capabilities due to wind speed and the processes of aggregation and coagulation of particles. The dispersal pathway of Enterobacteriaceae indicated that the inhabitants of residences near the dispersion source might be exposed to health risks from pathogenic bacteria present in bioparticles indoors. Understanding such characteristics and transmission patterns of bioparticles in rural environments provides a scientific basis for risk assessment and management strategies, with important implications for improving air-quality monitoring, public health policies, and environmental management in rural areas.

1. Introduction

With the rapid pace of urbanization, rural areas play a crucial role in connecting cities and nature [1]. They not only offer unique living environments, but also exhibit distinct lifestyles compared to heavily industrialized and urbanized regions [2]. Rural areas generally enjoy a more pristine natural environment with a lower population density, reduced traffic volume, and fewer industrial activities [3]. Consequently, the distribution and concentration of particles in air differ significantly between rural and urban areas.
In recent years, the improper handling of livestock and agricultural waste in rural areas has led to the airborne transmission of pathogenic microorganisms, resulting in intestinal diseases, such as diarrhea and gastroenteritis, particularly among children [4]. Rural areas are often characterized by a high density of poultry farms [5]. In such environments, infections can easily spread among the livestock, potentially leading to large-scale outbreaks [6]. Frequent contact between rural residents and poultry, combined with inadequate health protection measures, disinfection, and sanitation practices, further increases the risk of pathogen transmission [7,8]. The close cohabitation of humans and animals in rural settings facilitates the transmission of avian influenza from poultry to humans [8]. In addition, the COVID-19 pandemic has heightened awareness of the significant health risks posed by the dispersal of pathogenic microorganisms in bioaerosols in rural areas [9,10,11]. These findings highlight the critical need to address the potential health threats.
The primary sources of particles in rural areas are agricultural activities such as crop cultivation, livestock farming, and soil dust [12]. These particles primarily comprise organic matter and soil microparticles, which may possess different chemical compositions and forms than the particles found in urban areas [13]. Rural areas generally have lower pollutant concentrations because of their lower traffic volumes and distance from industrial zones [12]. However, local or seasonal increases in particle concentrations may occur owing to agricultural activities and soil dust [14]. Particle size plays a crucial role in determining impact on human health [2]. Compared with urban areas, rural areas may exhibit a particle size distribution biased towards larger sizes, including coarse particles (PM10) and fine particles (PM2.5) [15]. These larger particles remain in the air for shorter periods than smaller particles, and are more likely to settle [16]. The characteristics of particles in rural areas may lead to health effects that differ from those in urban areas [17]. Although larger particles are less likely to penetrate deeply into the respiratory system, they can cause respiratory infections, allergic reactions, and other symptoms [18].
In recent years, extensive research has been conducted on the health effects of rural air pollution, with a particular focus on particles [19]. However, in addition to the particles, the impact of bioparticles deserves attention. Bioparticles primarily refer to microorganisms such as bacteria, fungi, and viruses that exist in the form of particles such as dust, pollen, and mold spores in the air [20]. The inhalation of particles containing biogenic components can lead to various severe health problems, including allergic reactions, asthma, bronchitis, and respiratory infections [21]. These microorganisms possess infectious, allergenic, and toxic properties, which exacerbate their impact on human health [4]. Additionally, rural populations generally have a lower awareness of bioparticles and lack corresponding preventive measures, further intensifying their potential risks [22]. However, limited attention has been given to the effects of particles containing biogenic components.
Therefore, the objective of this study was to investigate the sources and dispersion patterns of bioparticles in a rural environment under different weather conditions. We aimed to identify the key environmental factors influencing bioparticle concentrations and to characterize the presence of Enterobacteriaceae, a group of bacteria with potential health implications. This research will contribute to a better understanding of bioaerosol dynamics in rural areas and provide a scientific basis for future air-quality monitoring and management strategies.

2. Materials and Methods

2.1. Description of the Study Sites

The selected study site was a village located in the western part of Hohhot City, Inner Mongolia Autonomous Region, which has the characteristics of a village distribution common to the northwestern region (residential areas surrounded by farmland) and point sources of fugitive bioaerosols common to rural areas (livestock and poultry farming areas, bio-composting areas, dry latrines, garbage dumps, and sewage treatment areas). Thus, the research conclusions obtained for this village may be applicable to similar villages in other regions. The village covers approximately 0.4 square kilometers. The resident population comprises approximately 540 people in 260 households. The main crops are maize and livestock, such as cows, pigs, sheep, and chickens. The annual per capita income is approximately RMB 6000–8000.
Currently, there is no corresponding sewage collection network infrastructure for treating pollutants in villages. Greywater is mainly disposed of through yard sprinkling, whereas blackwater mainly goes to household dry toilets or septic tanks. Fixed garbage bins were placed within the village, and garbage trucks collected waste daily. Villagers engage in small-scale animal husbandry, usually in their own yards. Livestock farming areas are located 5–10 m away from residential areas, and the generated animal waste is generally piled up outside the yards.

2.2. Determination of Sampling Locations and Methods

Exploit the DJI MINI 3 drone to carry out high-altitude photographic tasks, obtaining top-down images. Analyze the distribution of village houses and the layout of roads. Conduct field investigations to identify and mark risk spots on the top-down images. This determines the risk sources in a typical village for subsequent data analysis and figure plotting. The village was gridded on a 0.07 km × 0.07 km grid and 81 grids were divided (Figure 1). We sampled bioparticles in areas with obvious livestock farming areas, composting sites, garbage dumps, dry toilet and sewage treatment facilities across 81 grids. Also, each of the 81 grids was split into 25 sub-grids. In each sub-grid, we picked a spot without the above risk sources to collect the local environmental background value.
To determine Enterobacteriaceae concentrations and analyze their escape pathways, we selected nine square grids within the village for sampling with an Andersen six-stage impact sampler. These grids were chosen because they represented areas with the highest potential risk of Enterobacteriaceae contamination, based on preliminary measurements with the portable bioaerosol alarm, and included a range of land uses, including residential areas near livestock farming and waste disposal sites. While the Andersen sampler measurements were limited to these nine grids due to resource constraints, the portable bioaerosol alarm was used to provide a broader picture of bioparticle concentrations across the entire study area (reddened portion of Figure 1).
Daily weather conditions were recorded during the sampling period using portable instruments and daily weather forecasts (Table 1).

2.3. Collected Atmospheric Particles

Bioaerosol particles were collected in 2025 squares using a portable bioaerosol alarm (BM3001; Huatainuoan, Beijing, China). The equipment will automatically calibrate after being powered on for 30 s. This instrument measures the concentration and variation in bioaerosol particles in ambient air. The BM3001 uses the Mie scattering and ultraviolet-induced fluorescence (UV-LIF) methods to detect the particle size of bioaerosols. The instrument has an inlet size range of 0.5–10 μm and uses an excitation wavelength of 400 nm. It can continuously monitor the concentration changes in various biological factors (such as bacteria, spores, and viruses) in the air in real time and activate alarms when the concentration exceeds the threshold. Microorganisms suspended in the air contain organic metabolites such as tryptophan, the reduced form of coenzyme I (NADH), and riboflavin. Under excitation by short-wavelength light, they produce intrinsic fluorescence. Based on their intrinsic fluorescence characteristics, the biological properties of suspended particles can be distinguished. In the actual air environment, cigarette particles, paper dust, pollen, kaolin, etc., will also produce intrinsic fluorescence, so in the process of use, the instrument should try to avoid inhaling these fluorescence interferences in order to reduce the false-alarm rate. We regularly maintain it. For example, the dust filter is cleaned once a week, and the filter is replaced every 2–3 months. The replacement frequency can be adjusted according to the usage and environment to ensure data accuracy. A total of approximately 2500 samples were collected across the 81 grids using a BM3001 bioaerosol alarm. Each sampling event lasted for 30 s. This device records data every 2 s on average. The concentration at each sampling site was determined by averaging 15 data points. To minimize the impact of temporal variations in bioparticle concentration across multiple sampling sites, we maintained a consistent sampling sequence daily. The BM3001 bioaerosol alarm was positioned at a sampling height of 1.5 m above the ground, which corresponds to the average breathing height of an adult.
Enterobacteriaceae bioaerosol samples were collected using an Andersen six-stage sampler [4]. It utilizes the principle of inertial impaction to capture bioaerosol particles on solid agar surfaces. The sampler simulated the structure of the human respiratory system and consisted of six stages, with each stage representing a specific part of the respiratory system [23]. During sampling, a pump was used to draw air through the sampler at a flow rate of 28.3 L/min for 3 min [24]. The sampling height was set to 1.5 m, which corresponds to the breathing height of a person. The surface of the sampler was wiped with 75% alcohol before and after each sampling. McConkey agar was used as the culture medium to collect bacteria from the Enterobacteriaceae family [2]. The samples are incubated at 36 °C for 48–72 h. The total number of colonies was recorded at each sampling stage. To correct for any overlap of colonies on the agar plates that might affect the results, the positive-hole correction method was employed in the data processing of the Anderson sampler [25].

2.4. Data Analysis

Surfer software (Surfer 15) is a powerful Geographic Information System (GIS) and 3D data visualization software that provides the Kriging interpolation method, an important interpolation technique. This study utilized the Kriging interpolation method to predict unknown values by statistically analyzing the observed values of known points. Before applying the Kriging interpolation method, a set of observed point data with known locations must be prepared, and interpolation parameters such as the type of interpolation method, Kriging radius, and Kriging lag should be set according to the actual requirements. By performing calculations using Surfer software, the Kriging interpolation method can generate smooth contours or grid surfaces, allowing for a visual representation of the spatial distribution across the entire study area [26].

3. Results and Discussion

3.1. Biological Particle Dispersion Under Different Meteorological Conditions

3.1.1. Low-/High-Wind-Speed Weather Conditions

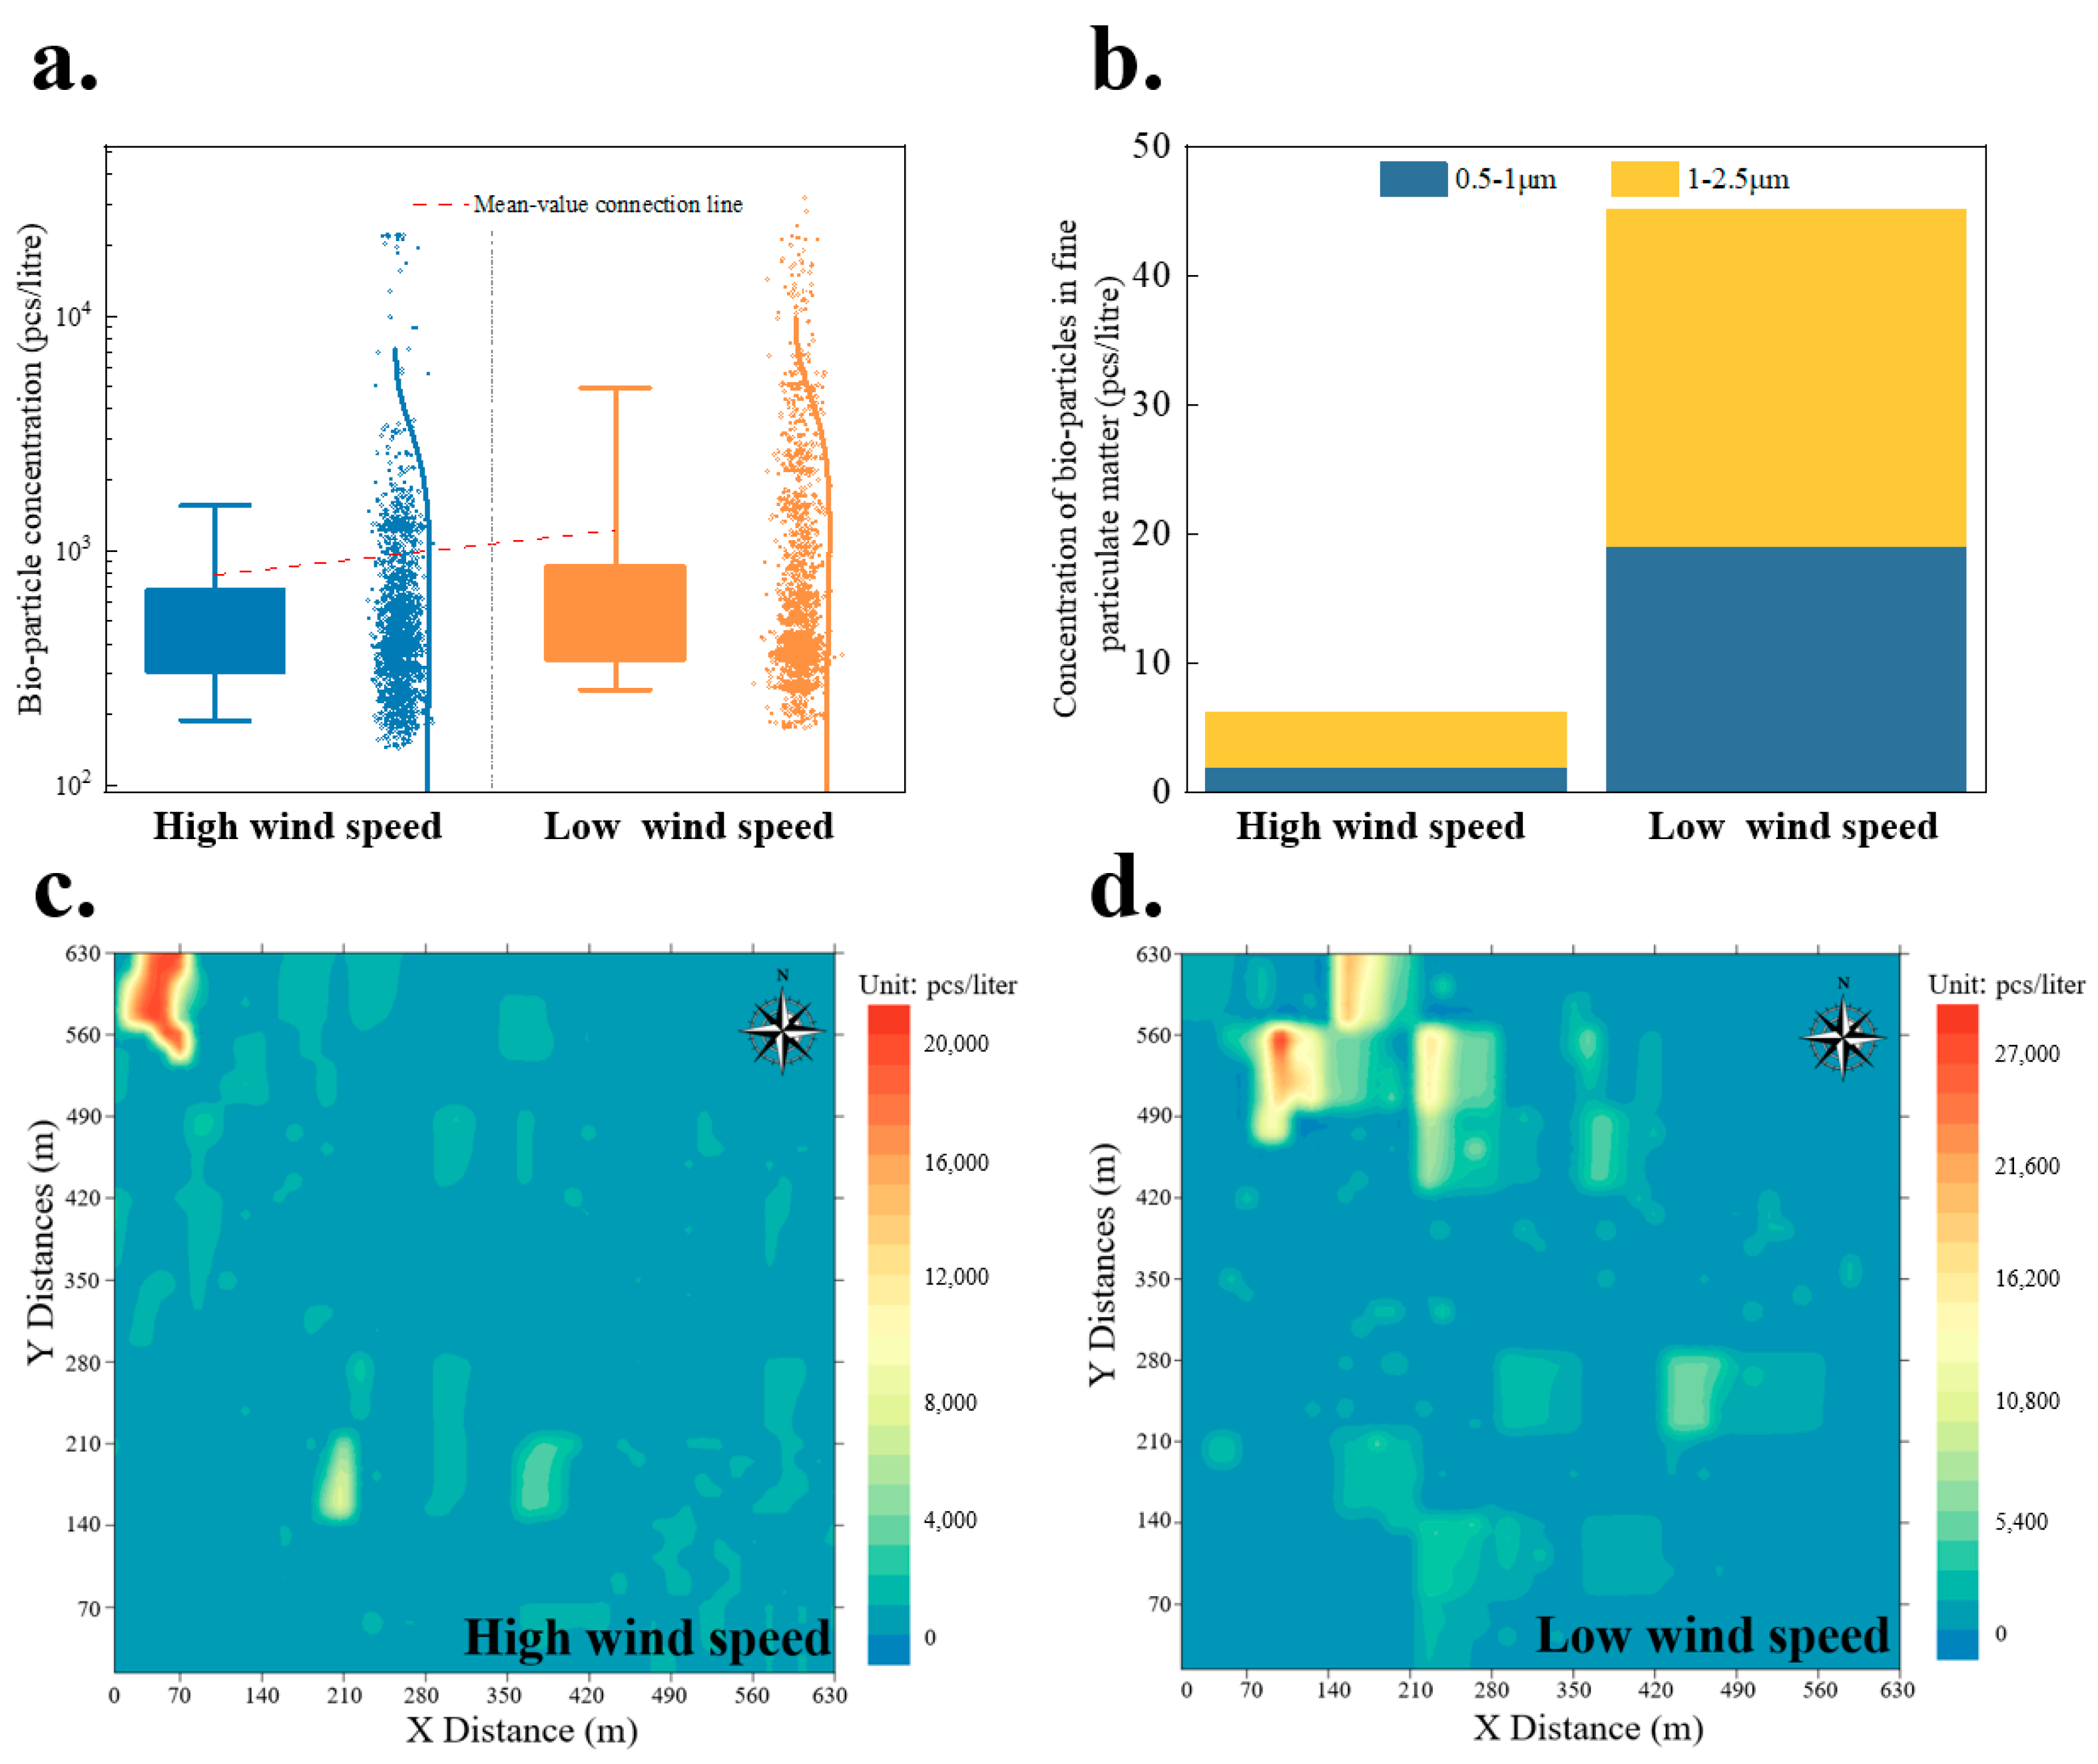
An analysis of the biological particles in the village under varying wind speeds (Figure 2) revealed that at low wind speeds (Wind Speed: 1.7 m/s), multiple point sources of bioparticle diffusion significantly appeared within the village (Figure 2d), with concentrations reaching approximately 5400 particles per liter. The primary sources of these particles were areas surrounding livestock and poultry farms, followed by waste disposal or bio-composting sites. Additionally, a significant hotspot with concentrations as high as 27,000 particles/L was observed in the upper-left corner of the village. Conversely, at high wind speeds (wind speed: 3.0 m/s), the point sources of bioparticle dispersion were reduced (Figure 2c), resulting in a lower overall concentration of biological particles within the village. Different wind speeds also impacted the size distribution of the biological particles (Figure 2b). More fine biological particles (0.5–2.5 μm) were found under low-wind-speed scenarios. In contrast, the opposite trend was observed under high-wind-speed conditions.

3.1.2. Low-/High-Temperature Weather Conditions

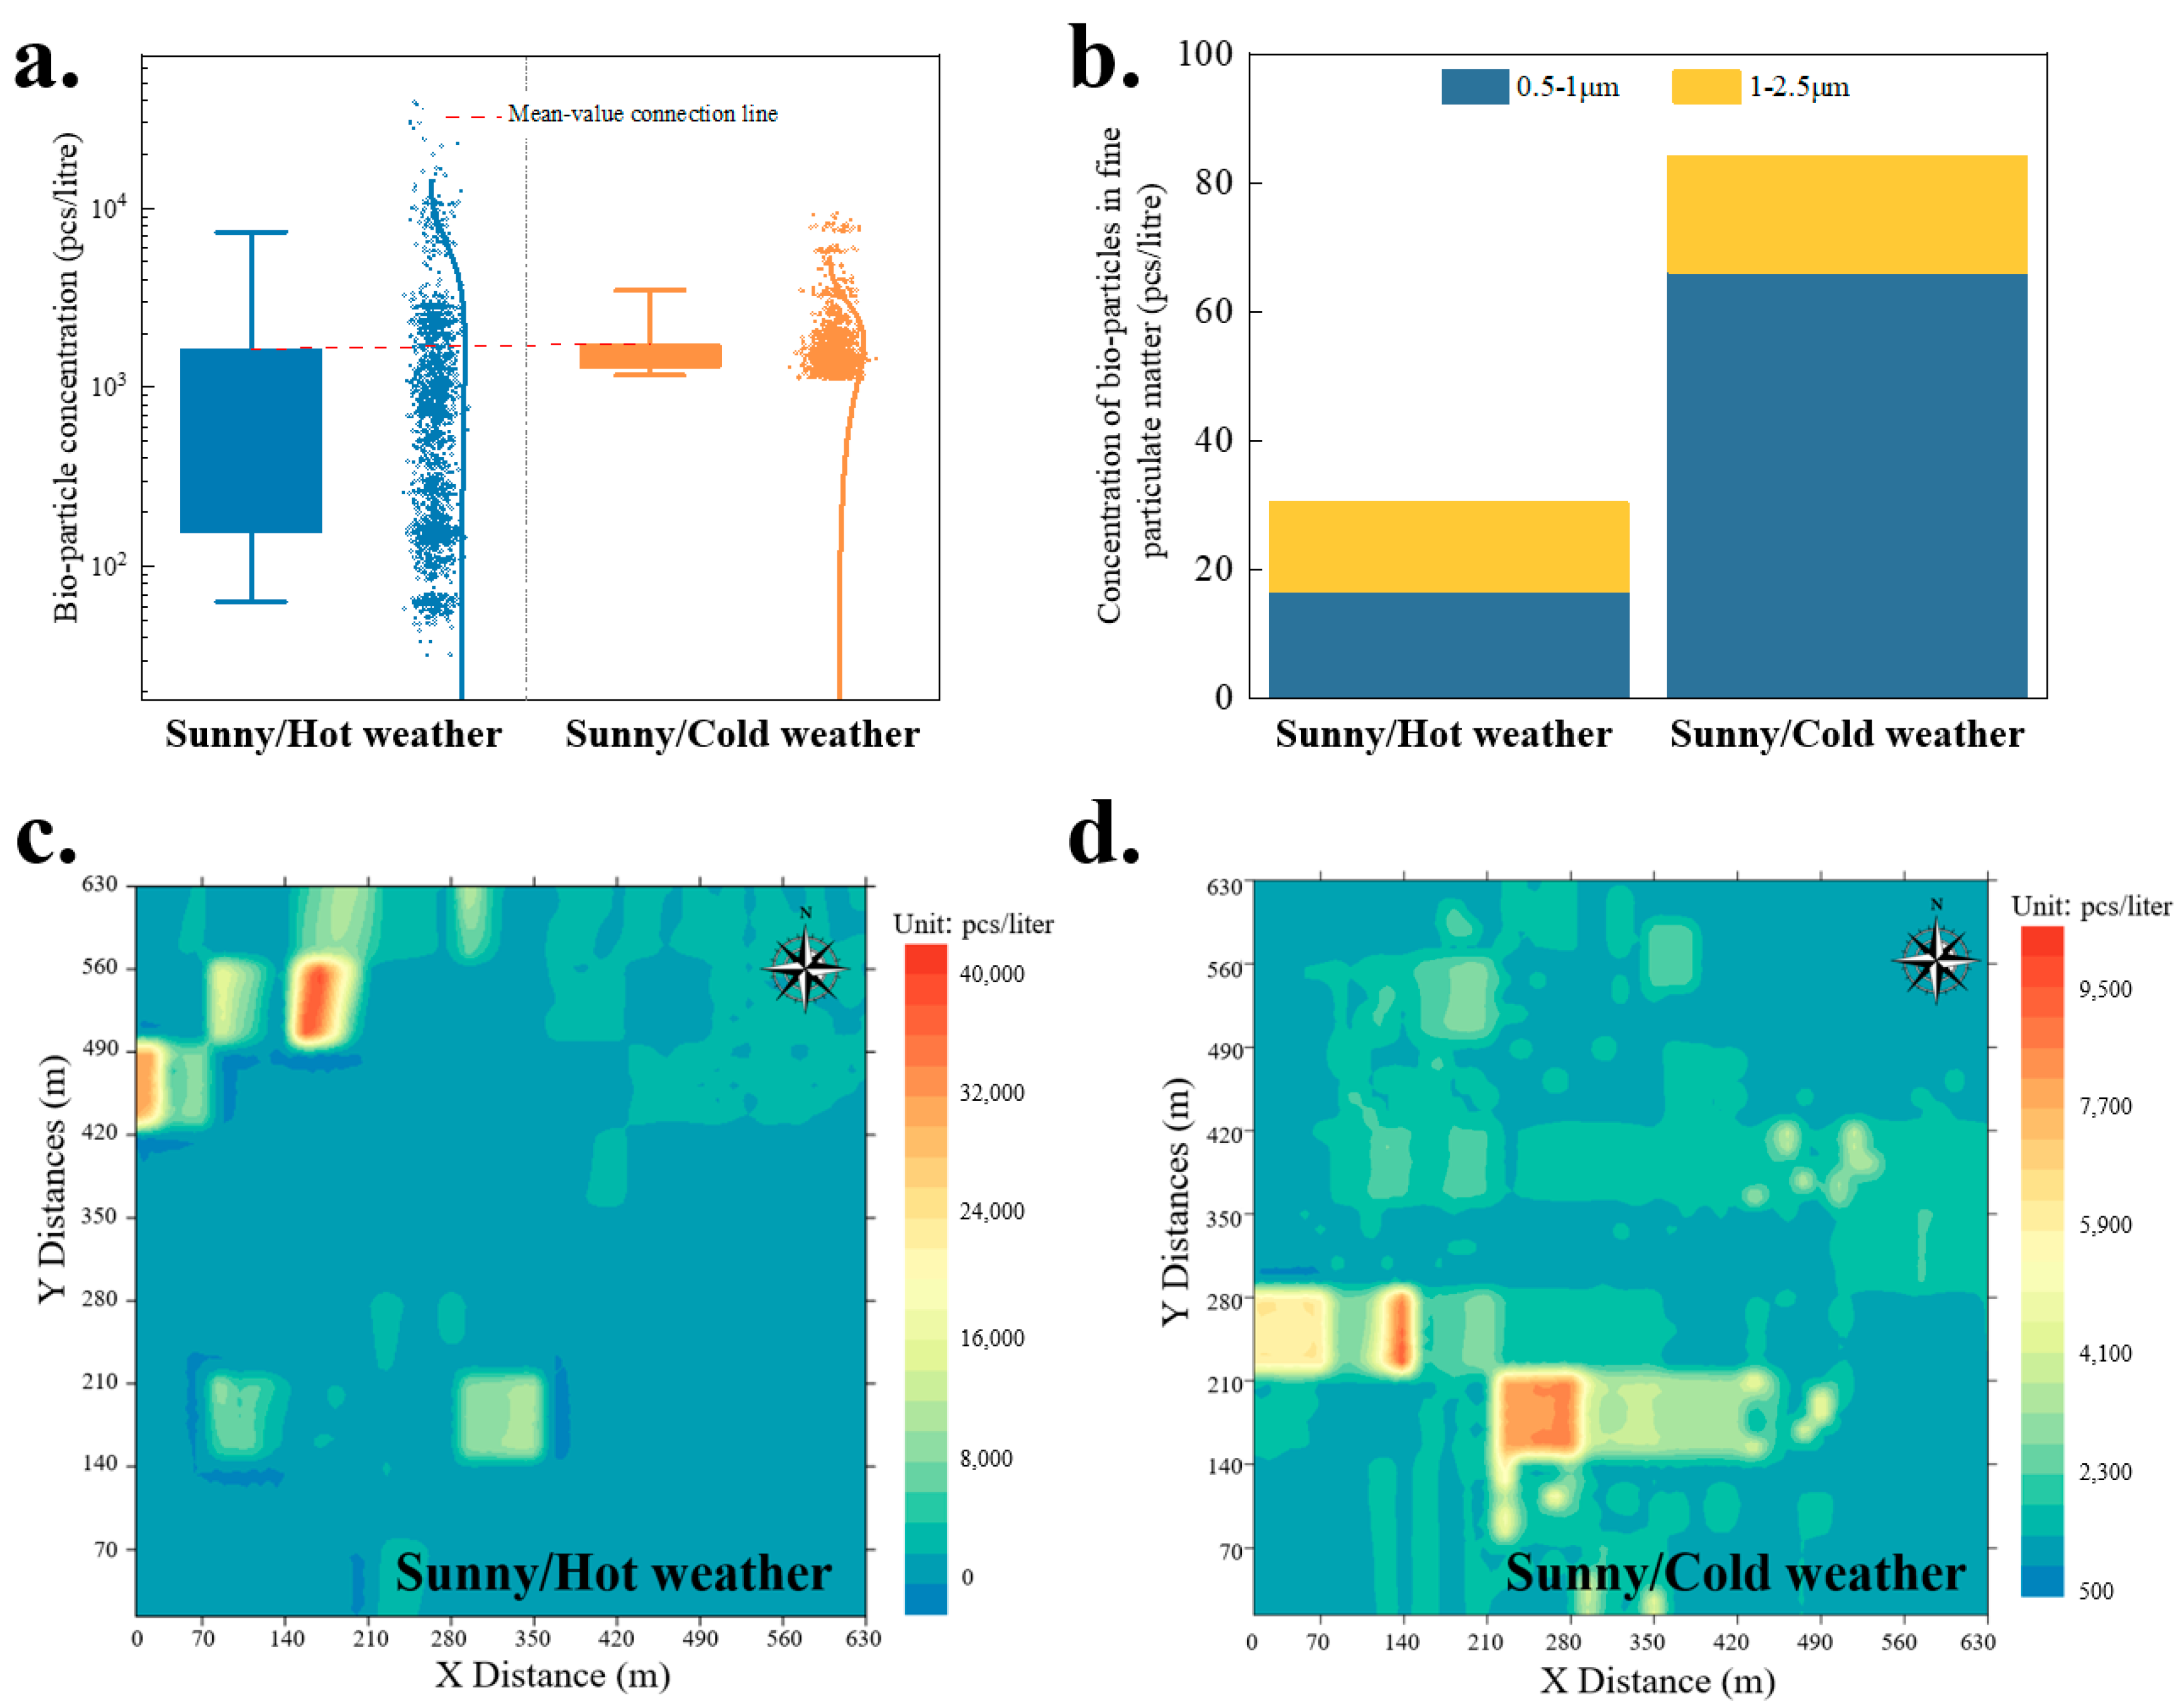
Figure 3 illustrates the escape characteristics of biological particles under high- and low-temperature weather conditions based on the collected data. The analysis in Figure 3a reveals a minimal difference in the mean concentration of biological particles between the hot and cold weather conditions. However, under hot weather conditions, extreme values were observed in the village, primarily concentrated in the livestock farming areas, with concentrations reaching 39,062 particles/L. In contrast, cold weather conditions resulted in a narrower range of biological particle concentrations within the village, predominantly distributed between 144 and 2988 particles/L. While we focused on temperature differences, we acknowledge that humidity levels also varied between these conditions (Table 1). An analysis in Figure 3a reveals a minimal difference in the mean concentration of biological particles between the hot and cold weather conditions. However, humidity levels were significantly higher during the cold weather conditions. This higher humidity may have contributed to the increased bioparticle concentrations we observed under cold conditions, as high humidity can promote the survival of certain microorganisms and affect particle aggregation.
Figure 3b demonstrates that the concentration of biological particles in fine particulate matter was significantly lower under hot weather conditions. Specifically, the concentrations of biological particles in the 0.5–1 μm and 1–2.5 μm ranges were 17 and 14 particles/L, respectively. Conversely, cold weather conditions led to a marked increase in bioparticle concentrations within fine particulate matter. The concentration of bioparticles smaller than 2.5 μm rose to 84 particles/L, with those in the 0.5–1 μm range dominating at 66 particles/L.

3.1.3. Cloudy Weather Conditions

The distribution of biological particles within the village under cloudy weather conditions was characterized, as shown in Figure 4. Figure 4a reveals that the average concentration of biological particles in the village under cloudy weather conditions (1303 particles/L) was significantly higher than that on sunny days (786 particles/L). Interestingly, no significant difference was found between sunny and cloudy weather conditions when examining biological particles smaller than 2.5 μm (Figure 4b).
A further analysis of Figure 4c,d reveals the distinct distribution characteristics of biological particles within the village under different weather conditions. During cloudy weather, the wind direction was predominantly northeastern, with a speed of 2.7 m/s. The bioparticle escape-path diagrams for cloudy weather indicate a wide range of bioparticle aggregations in the relatively open northern part of the village (X distance 0–630 m, Y distance 490–630 m), with concentrations ranging from 2000 to 13,636 particles/L. The highest concentration ranges were observed in localized areas with a high livestock farming density (X distance 70–140 m, Y distance 490–560 m) under cloudy conditions.

3.1.4. Rainfall Weather Conditions

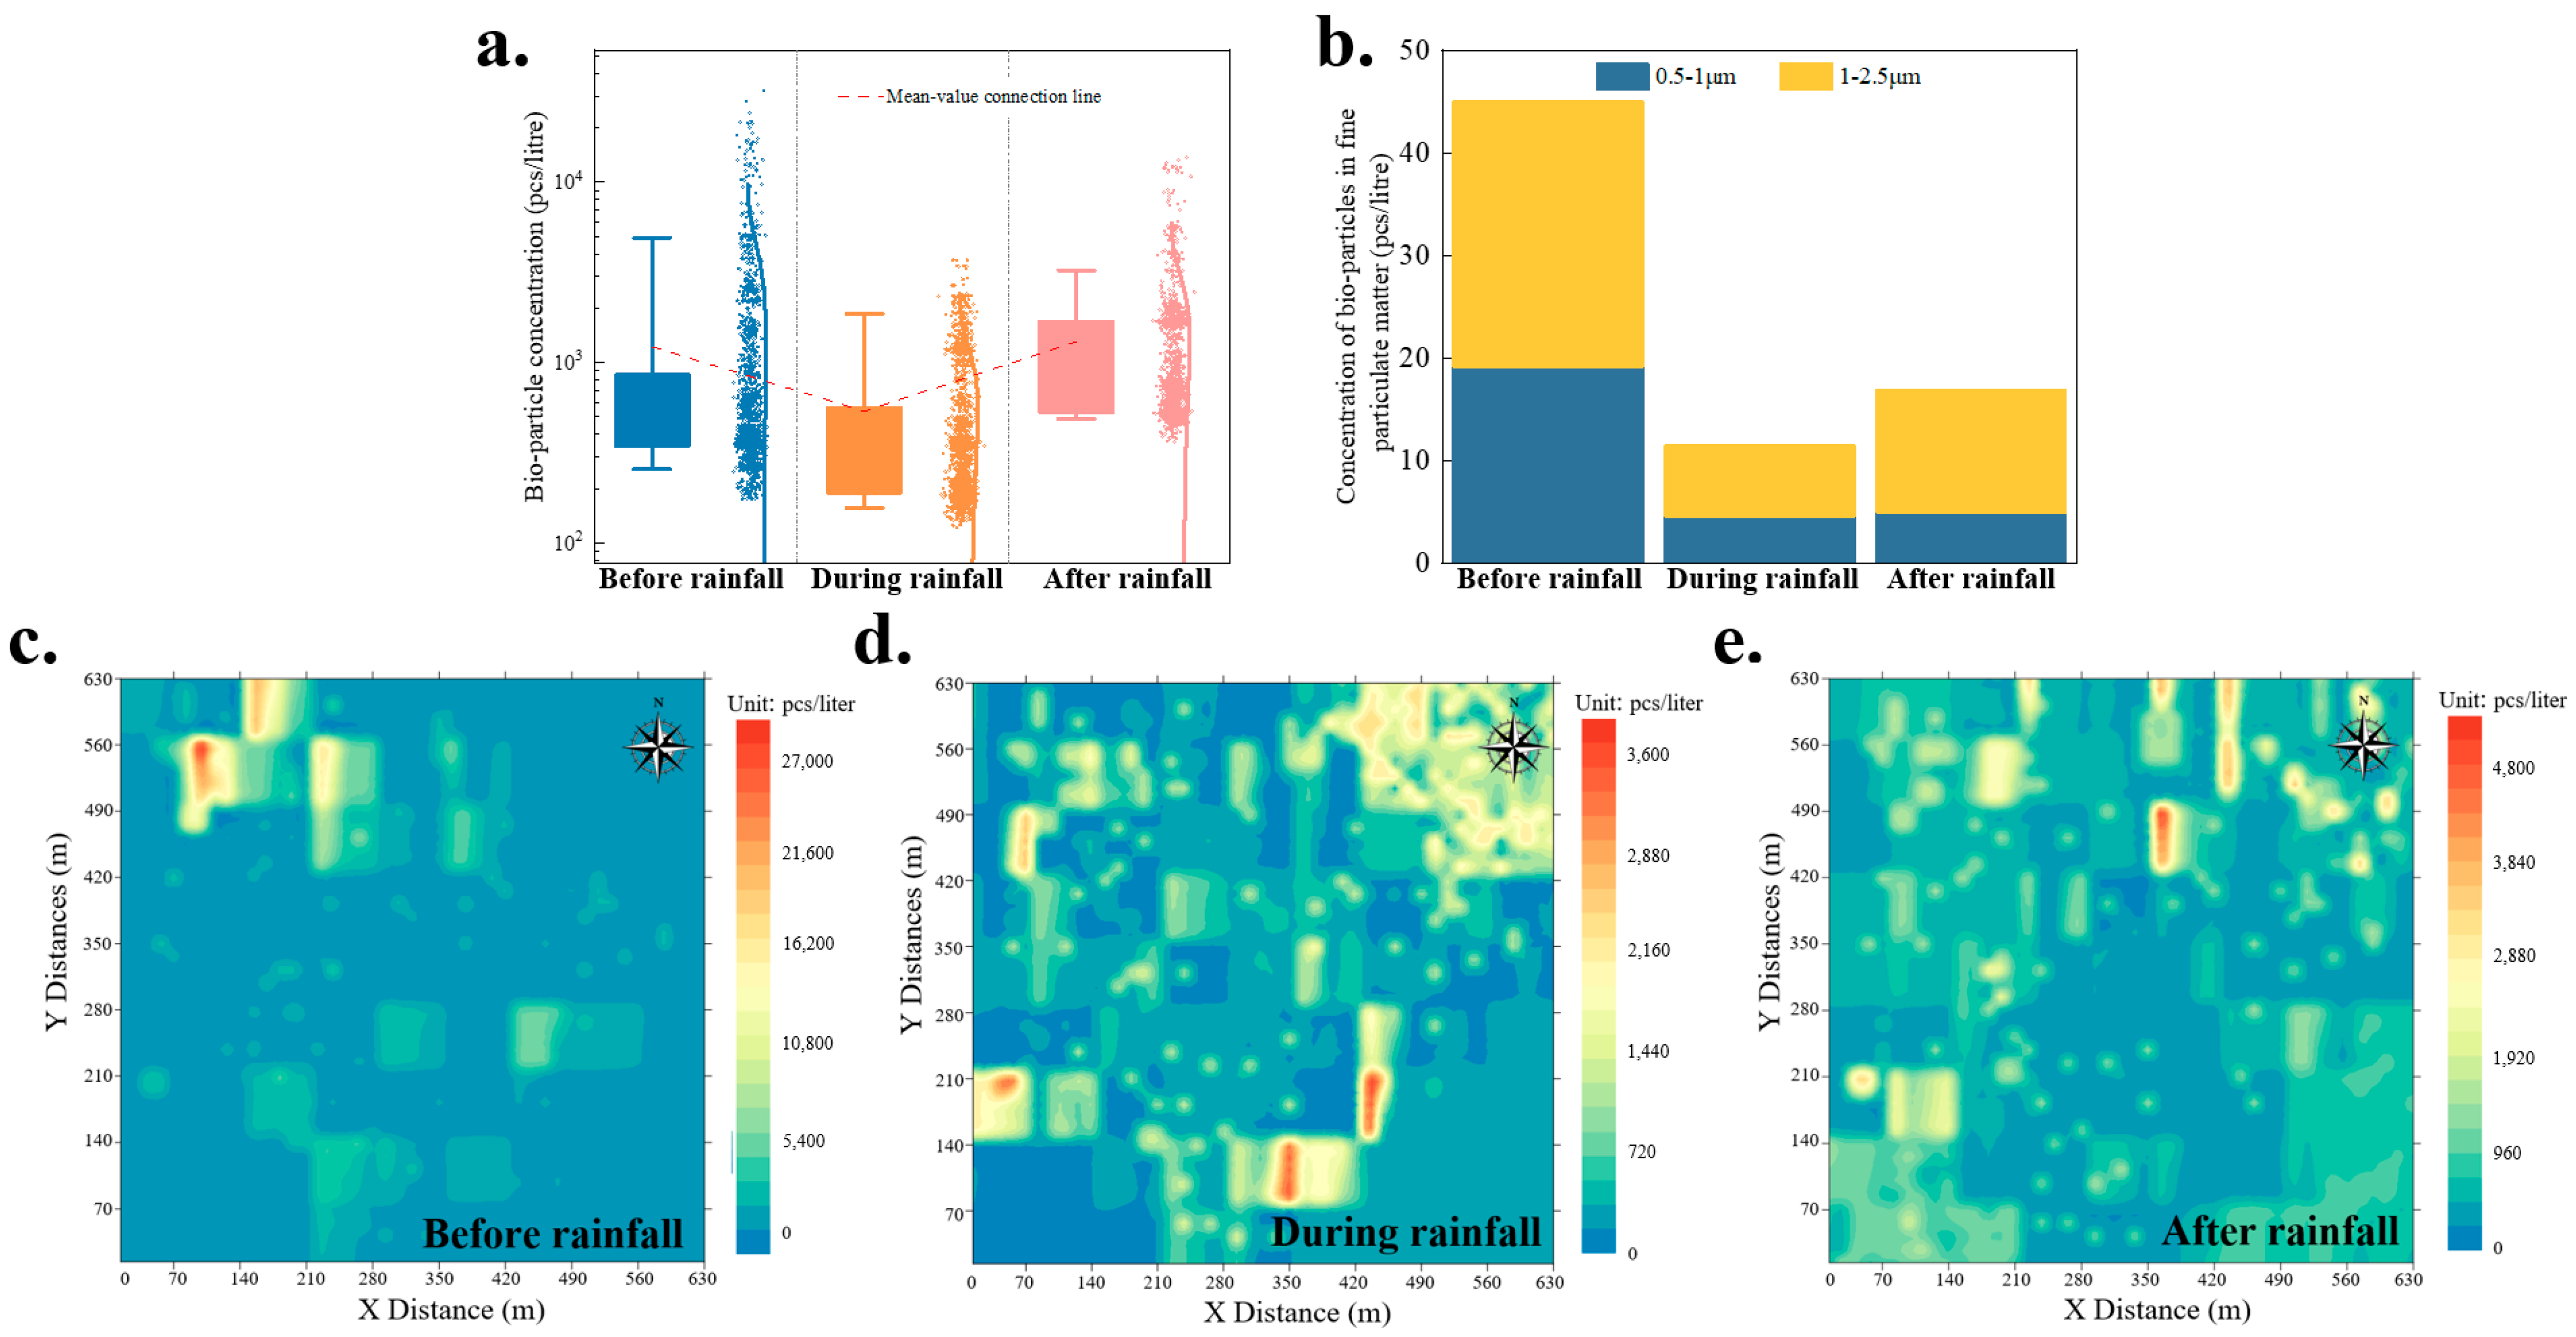
Figure 5 illustrates the distribution of biological particles within the village during rainfall. An analysis of the biological particle concentration characteristics under rainfall, as shown in Figure 5a, reveals that precipitation significantly affected the concentration of biological particles in the village. On the day preceding the rainfall, the concentration of biological particles was 1707 particles/L. Following the onset of rain, the concentration decreased sharply to 786 particles/L. However, once precipitation ceased, the concentration of biological particles in the village began to increase gradually, reaching 1116 particles/L the following day. A similar trend was observed for the fine-sized bioparticles (Figure 5b). Prior to rainfall, the concentration of biological particles smaller than 2.5 μm was 45 particles/L, which decreased to 12 particles/L during the rain event. After the rain stopped, the concentration of fine bioparticles slowly increased to 17 particles/L.

3.1.5. Hazy Weather Conditions

An analysis of the biological particle concentration characteristics in the village under various weather conditions, as depicted in Figure 6a, revealed interesting patterns. The average biological particle concentrations during sunny and mildly hazy weather were similar (1757 particles/L and 1813 particles/L, respectively). However, under moderately hazy conditions, the concentration of biological particles within the village increased significantly to 2516 particles/L. Further analysis of bioparticle concentrations in fine particulate matter (Figure 6b) showed similar levels of 84 and 80 bioparticles/L under sunny and mildly hazy conditions, respectively. However, the highest concentration of biological particles in fine particulate was observed under moderately hazy conditions.

3.2. Factors Affecting the Diffusion of Biological Particles

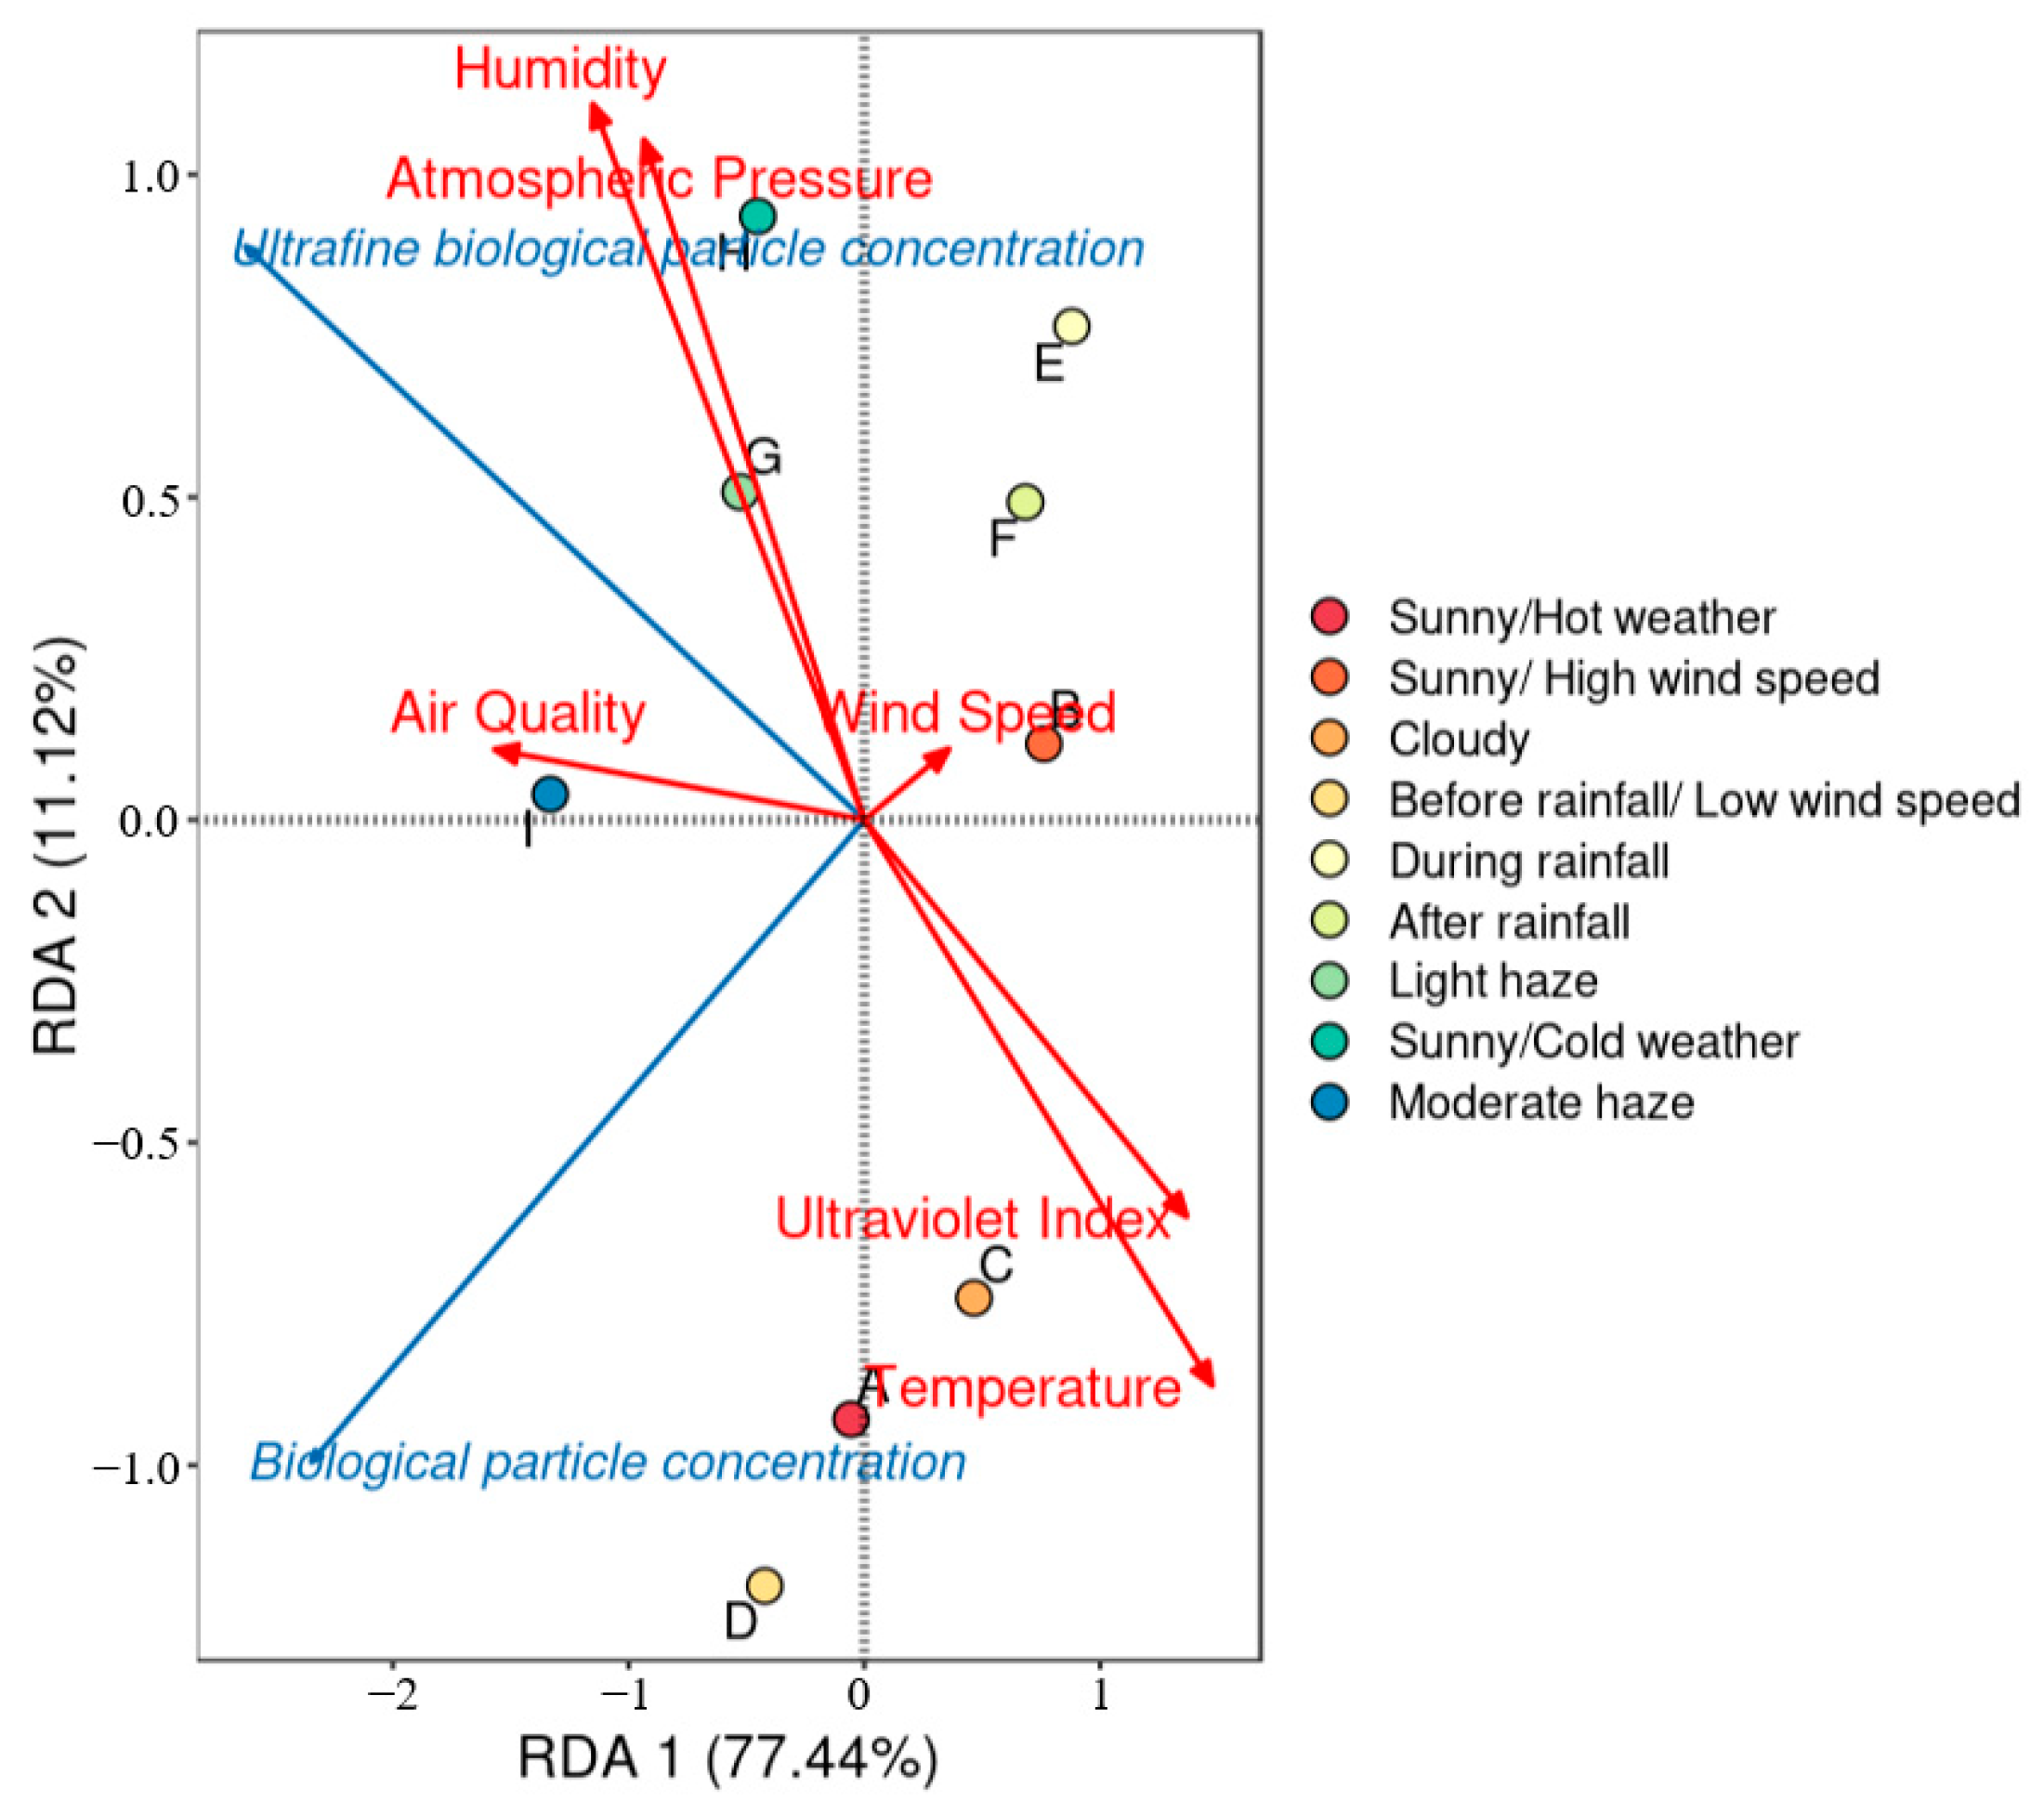
To better discuss the roles and potential impacts of various environmental factors on the dispersion of biological particles in rural air, this study conducted RDA (Redundancy Analysis) to examine the correlations between environmental conditions and biological particle concentrations (Figure 7). It is evident from the figure that there are subtle differences in the correlation between environmental conditions and the concentrations of biological and ultrafine biological particles. The concentration of biological particles is positively correlated with temperature, the ultraviolet index, and air quality, whereas it is negatively correlated with atmospheric pressure, air humidity, and wind speed. In contrast, the concentration of ultrafine biological particles was positively correlated with atmospheric pressure, air humidity, and air quality, but negatively correlated with wind speed, ultraviolet index, and temperature. However, in reality, the concentration of biological particles is influenced by multiple factors, making it impractical to analyze their concentrations based solely on individual environmental conditions. A comprehensive analysis that considers actual circumstances is essential for accurate assessment.
The analysis of all bioparticle dispersion maps revealed that the northwestern region (X distance 0–210 m, Y distance 420–630 m) consistently exhibited high concentrations of bioparticle aggregates in multiple maps. This phenomenon can be primarily attributed to the presence of several potential point sources of fugitive risk within this area, including 15 farming households with significantly higher farming densities than those in other regions. Additionally, the presence of bio-composting areas and garbage dumps within this zone contributed to the dispersion of substantial quantities of bioparticles [2]. The proximity of houses and the addition of shed roofs to some farming areas in this region impedes ultraviolet irradiation, further contributing to elevated bioparticle concentrations. This combination of factors may increase health risks for the surrounding population.
A further in-depth analysis of the impact of UV radiation revealed that during cloudy weather conditions (Figure 4), the ultraviolet index significantly decreases. Actual monitoring indicated that the UV intensity measured on sunny days was 4.7 mW/m2, dropping to 2.7 mW/m2 on cloudy days. High-intensity UV rays can damage the nucleic acid structure of microorganisms, leading to their death [27]. Consequently, the lower UV intensity during cloudy weather likely contributes to the higher concentrations of biological particles. Analyzing the impact of different temperatures on the concentration distribution of biological particles (Figure 3) revealed that while the overall concentrations of bioparticles under hot and cold weather conditions were similar, ultrafine bioparticles exhibited significant differences. During hot weather, the UV intensity reached 3.7 mW/m2, which was significantly higher than the 1.0 mW/m2 observed during cold weather. Owing to their small size and large specific surface area, fine particulate bioparticles are more readily exposed to environmental factors, including UV radiation [28]. Consequently, the higher UV intensity during hot weather likely contributes to the lower concentration of fine particulate bioparticles in the air.
In addition to UV radiation, wind speed is a major factor affecting the dispersion of biological particles. Figure 2c,d reveal significant differences in the locations of high bioparticle concentrations in the northwestern region of the village (X distance 0–210 m, Y distance 420–630 m). These differences were closely related to the prevailing wind-speed conditions. In Figure 2c, the wind speed is westerly at 3.0 m/s, whereas in Figure 2d, it is easterly at 1.7 m/s. Such differences in wind speeds resulted in markedly different areas of high bioparticle concentrations, with slower wind speeds (Figure 2d) influencing a broader range. Similarly, under cloudy weather conditions (Figure 4d), lower wind speeds reduced the dispersion capacity of the biological particles, making the village more prone to multipoint bioparticle aggregation. These aggregations are primarily associated with potential sources of bioparticle dispersion within the village, including garbage-dumping areas, livestock breeding zones, sewage treatment facilities, and composting sites, all of which significantly affect the surrounding environment.
Analysis of the concentration of biological particles during sunny and hazy weather (Figure 6c–e) revealed that during mild haze, high concentrations of bioparticles aggregated in the southern part of the village. This phenomenon can be primarily attributed to the prevailing southeasterly winds, which facilitate the accumulation of bioparticles escaping from the northern areas of the village. In contrast, under moderate haze conditions, wind speed (2.0 m/s) was significantly lower than that observed under mild haze (3.0 m/s). This reduction in wind speed restricted bioparticle diffusion, leading to higher concentrations of bioparticles accumulating throughout the village. Notably, the main roads of the village, located at an X distance of 0–630 m and a Y distance of 280–350 m, exhibited lower concentrations of biological particles under hazy conditions. These open areas facilitate better air circulation, contributing to the dilution and diffusion of bioparticles. Additionally, direct sunlight exposure in these areas may act as a natural disinfectant and sterilizer, further reducing the presence of biological particles. This is also one of the reasons for the lower concentration of biological particles on the open main roads. These findings suggest that residents should enhance their protective measures against biological particles, particularly during moderate-haze periods. The increased concentration of bioparticles, especially fine particulate matter, under such conditions warrants heightened awareness and precautionary action to mitigate potential health risks.
The study of rainfall (Figure 5) revealed that the sharp decrease in the overall bioparticle concentration in the village during rainfall could be primarily attributed to the scavenging effect of falling raindrops. This significantly reduces the concentration of bioparticles, including fine particles, in the village atmosphere. However, the gradual increase in biological particle concentrations after the cessation of rainfall may be explained by changes in the relative humidity. As the rain stopped, the relative humidity in the village air decreased from 58.7% to 43.0%. Consequently, surface water on the soil, leaves, and other surfaces began to evaporate, potentially releasing bioparticles and gradually increasing their concentration in the air.
Figure 5c–e reveal several key characteristics of the biological particle distribution in the village under rainfall conditions. On the day of rainfall, a high concentration of bioparticles was observed, aggregating in the northeastern region of the village (X distance 420–630 m, Y distance 420–630 m). This phenomenon can be attributed to the prevailing easterly winds, which facilitate the diffusion of high concentrations of bioparticles from the western to the eastern region. Although rainfall generally reduces the concentration of airborne bioparticles, high concentrations persist within multiple small areas, showing a tendency to disperse to surrounding areas. This pattern suggests the presence of various potential risk sources in the village. After the rain ceased, the bioparticle concentrations increased throughout the village, and these potential point sources continued to disperse the bioparticles to adjacent areas. Notably, the concentration of bioparticles in the planted areas of the village (X distance 0–210 m, Y distance 0–140 m; X distance 420–630 m, Y distance 0–280 m; X distance 420–630 m, Y distance 420–630 m) increased at a faster rate following the cessation of rainfall. This accelerated increase may be attributed to the presence of large areas of wet soil and water accumulation in the planted zones. As water evaporates after rainfall, it likely mobilizes biological particles from the soil, resulting in a more rapid increase in bioparticle concentration in these areas.
Analysis of the impact of particulate matter concentrations on bioparticle concentrations (Figure 6c–e) revealed that air quality was comparable during sunny and mildly hazy days, with particulate matter concentrations of 98.0 μg/m3 and 117.0 μg/m3, respectively. In contrast, moderately hazy weather presented a distinct scenario, with an air-quality reading of 187.3 μg/m3. Studies have found that increased particulate matter concentrations enhance the likelihood of collision and coagulation between particles and bioparticles, thereby accelerating their settling in the atmosphere. Consequently, under high particulate matter concentrations, the detected concentration of bioparticles tends to be higher [29].
The preceding content mentions that bioparticles are influenced by environmental conditions such as wind speed, light, and humidity. However, studies have found that the intrinsic characteristics and behaviors of bioparticles significantly affect their concentration in air. These characteristics and behaviors primarily include the reproduction and growth of bioparticles, their death and degradation, and their aggregation and deposition [30,31].
Bioparticles can typically possess the ability to replicate and reproduce. Reproduction can be sexual or asexual. For example, bacteria within bioparticles reproduce asexually through binary fission, whereas fungal spores present in the air can expand their populations via both sexual and asexual reproduction [32]. Moreover, we can observe from Figure 3c and Figure 5e that the bioparticle concentrations are significantly higher under particularly favorable environmental conditions, such as high temperatures or post-rainy weather. This increase is partly attributable to the reproductive activities of the bioparticles. Bioparticles proliferate rapidly in optimal environments. Bacteria engage in swift metabolism and division under nutrient-rich, warm, and humid conditions, whereas the germination and growth of fungal spores depends on suitable humidity and the presence of organic matter [33,34,35]. As a result, microorganisms proliferate rapidly under favorable conditions such as high temperatures and high humidity, leading to an increase in the concentration of biological particles over time.
Similarly, in addition to being able to grow and reproduce, bioparticles also face the risk of death when exposed to various environmental stressors. UV radiation, desiccation, and temperature fluctuations can cause cellular damage and death. This can be observed in Figure 3 and Figure 4. Ultimately, dead particles undergo a degradation process primarily facilitated by other microorganisms such as bacteria and fungi. Through enzymatic degradation, these microorganisms break down bioparticles into smaller organic molecules that eventually return to their inorganic state [36]. The rate of degradation in the environment depends on the temperature, humidity, and chemical composition of bioparticles [37].
In air, bioparticles often aggregate because of fluid dynamics and electrostatic effects [38]. Aggregation increases the effective size of the bioparticles, thereby altering their dynamic behavior. Interactions between bacteria, organic particles, and inorganic particles can form larger composite particles, increasing their settling rate (Figure 6). Larger bioparticles or aggregated composite particles gradually settle on the ground or other surfaces because of gravity. This process is influenced by aerodynamic factors such as atmospheric turbulence and wind speed (Figure 2). The settling rate is typically proportional to the diameter and density of particles. After settling, these bioparticles can be resuspended, particularly under conditions of high wind speed or dry surfaces.

3.3. Analysis of Pathogenic Bacteria Escape Pathways Under Different Weather Conditions in Villages

This study conducted an in-depth analysis of the Enterobacteriaceae escape pathways within the village under various weather conditions, as illustrated in Figure 8. The specific meteorological parameters are detailed in Table 1. The primary objective was to systematically assess Enterobacteriaceae dispersal patterns from potential risk sources and evaluate their possible impact on indoor environments at a regional scale. Enterobacteriaceae primarily includes Escherichia coli and other related bacterial species, whose presence in rural air can pose various health risks to humans [39,40]. These bacteria can cause gastrointestinal, urinary, and respiratory infections [41]. When these microbial populations disperse through the air and are inhaled or come into contact with humans, especially those with a weakened immune system, they can lead to severe health problems [2]. High concentrations of Enterobacteriaceae contamination can increase the likelihood of infection, particularly in densely populated rural areas with poor sanitation conditions [42]. In rural regions, Enterobacteriaceae contamination is not limited to air; it can also spread through dust and water droplets to food and drinking water [43]. Contaminated food and water sources are the major pathways for outbreaks of Enterobacteriaceae-related diseases [44].
Figure 8a shows that in hot weather, Enterobacteriaceae concentrations peaked at 2859 CFU/m3 in the livestock area, potentially affecting ambient air within a 40 m radius. This phenomenon likely contributed to the elevated indoor Enterobacteriaceae levels (300 CFU/m3) detected in the nearby, densely populated Home 3, which exhibited significantly higher concentrations than the other two residences. The village’s lower-right corner, adjacent to extensive agricultural land, also demonstrated locally high Enterobacteriaceae concentrations. Various anthropogenic factors, including cultivation, fertilization, and soil turning coupled with prevailing northeasterly winds, have resulted in the northward spread of Enterobacteriaceae across the village.
After the rainfall (Figure 8b), sampling revealed relatively low Enterobacteriaceae concentrations throughout the village. However, moist soil and water accumulation may have provided favorable conditions for Enterobacteriaceae growth, maintaining a tendency for high concentrations to spread toward the agricultural land in the lower right corner. Notably, the Enterobacteriaceae concentrations did not differ significantly among the three households under these conditions.
During moderately hazy weather (Figure 8c), characterized by cold temperatures and snow-covered roads, the overall Enterobacteriaceae concentrations in the village were lower. However, specific areas, such as landfills, dry latrines, sewage treatment facilities, and bio-composting sites, exhibited higher concentrations owing to the presence of additional pollutants. These areas facilitated the spread and multiplication of Enterobacteriaceae, potentially affecting the surrounding environment within a 25 m radius. Consequently, elevated Enterobacteriaceae concentrations were detected in these zones, posing potential risks to the nearby indoor environments. This is primarily because outdoor bioaerosols can infiltrate into indoor spaces through ventilation systems, open windows, and other pathways, increasing the overall indoor bioaerosol load [45]. This is particularly evident in rural areas where homes may be in close proximity to agricultural bioaerosol sources. The infiltration of outdoor bioaerosols can exacerbate indoor air-quality problems and increase health risks for building occupants, especially vulnerable groups such as children and the elderly.

4. Conclusions and Prospects

This study explored the distribution characteristics of bioparticles under different weather conditions and analyzed the mechanisms that might cause various phenomena. Finally, the potential impact of pathogenic bacteria on the bioparticles was assessed. The results of this study were as follows:
  • Livestock farming areas in rural regions are the principal source of bioparticles, including pathogenic microorganisms. Environmental conditions such as wind speed, temperature, humidity, and precipitation significantly influence the distribution and concentration of these particles.
  • Low wind speeds and cloudy or hazy weather contribute to higher concentrations and limited dispersion. Conversely, high wind speeds and rainfall events reduced bioparticle concentrations by enhancing dispersion and scavenging effects.
  • Pathogenic bacteria, such as those from the Enterobacteriaceae family, exhibit specific dispersal pathways that are influenced by local environmental factors. Indoor environments in close proximity to livestock farming areas are at a high risk of contamination, posing potential health risks to rural inhabitants.
Based on our findings, we recommend that local governments consider the following policy implications and mitigation strategies: (1) Implement zoning regulations to ensure adequate separation between livestock farming areas and residential areas, minimizing exposure to bioparticles. (2) Establish mandatory composting programs for livestock waste to reduce bioparticle emissions from agricultural sources, a key finding of our study. (3) Launch public health education campaigns to inform residents about the risks of bioparticles and promote practices such as proper ventilation and hand hygiene. (4) Expand air-quality monitoring programs to include bioparticles, providing a more comprehensive assessment of air quality in rural areas.
Future research should address limitations in measurement techniques and potential interference from non-biological organic compounds. While conventional methods may underestimate bioaerosol concentrations, fluorescent monitors are prone to interference from sources like solid fuel burning and secondary organic particles [45]. Therefore, we recommend employing advanced analytical techniques such as PCR and metagenomics to differentiate biological from non-biological particles and developing real-time sensors less susceptible to interference. Integrating multiple measurement methods will provide a more comprehensive understanding of bioaerosol dynamics.

Author Contributions

X.Y.: Investigation, Writing—Original Draft; Y.H.: Supervision, Conceptualization, Writing—Review and Editing; Y.C.: Writing—Review and Editing; J.L.: Supervision, Writing—Original Draft; Z.L.: Investigation—Original Draft; Y.L.: Investigation—Original Draft; W.F.: Writing—Original Draft. All authors have read and agreed to the published version of the manuscript.

Funding

This work was supported by the Special Project of Eco-environmental Technology for Peak Carbon Dioxide Emissions and Carbon Neutrality (RCEES-TDZ-2021-26), the Key Project of Science and Technology of Henan Province (No. 242102320128), support Program for Young Scientific and Technological Talents at Universities of Inner Mongolia Autonomous Region of China (JY20220071), the Natural Science Foundation of Inner Mongolia Autonomous Region of China (2023QN02017), the National Key R&D Program of China (2020YFD1100500) and the Project of Inner Mongolia “Prairie Talents” Engineering Innovation Entrepreneurship Talent Team of China.

Institutional Review Board Statement

Not applicable.

Data Availability Statement

The original contributions presented in this study are included in the article. Further inquiries can be directed to the corresponding authors.

Conflicts of Interest

The authors declare that they have no known competing financial interests or personal relationships that could have appeared to influence the work reported in this paper.

References

  1. Diamond, S.E.; Prileson, E.G.; Martin, R.A. Adaptation to urban environments. Curr. Opin. Insect Sci. 2022, 51, 100893. [Google Scholar] [CrossRef]
  2. Liu, J.; Yu, X.; Wang, Y.; Han, Y.; Cao, Y.; Wang, Z.; Lyu, J.; Zhou, Z.; Yan, Y.; Zheng, T. Dispersion characteristics of bioaerosols during treatment of rural solid waste in northwest China. Environ. Pollut. 2023, 324, 121338. [Google Scholar] [CrossRef] [PubMed]
  3. Yao, Q.; An, N.; Gu, G.C.; Yang, E.D.; Yang, H.H.; Li, C.; Yan, K. Research progress on features and characteristics of rural settlements: Literature distribution, key issues, and development trends. Buildings 2023, 13, 2457. [Google Scholar] [CrossRef]
  4. Yu, X.Z.; Han, Y.P.; Liu, J.G.; Cao, Y.N.; Wang, Y.; Wang, Z.X.; Lyu, J.; Zhou, Z.Y.; Yan, Y.; Zhang, Y.X. Distribution characteristics and potential risks of bioaerosols during scattered farming. Iscience 2023, 26, 108378. [Google Scholar] [CrossRef] [PubMed]
  5. Cheng, M.J.; Quan, J.W.; Yin, J.H.; Liu, X.W.; Yuan, Z.W.; Ma, L. High-resolution maps of intensive and extensive livestock production in China. Resour. Environ. Sustain. 2023, 12, 100104. [Google Scholar] [CrossRef]
  6. Gržinić, G.; Piotrowicz-Cieślak, A.; Klimkowicz-Pawlas, A.; Górny, R.L.; Ławniczek-Wałczyk, A.; Piechowicz, L.; Olkowska, E.; Potrykus, M.; Tankiewicz, M.; Krupka, M.; et al. Intensive poultry farming: A review of the impact on the environment and human health. Sci. Total Environ. 2023, 858, 160014. [Google Scholar] [CrossRef]
  7. Conan, A.; Goutard, F.L.; Sorn, S.; Vong, S. Biosecurity measures for backyard poultry in developing countries: A systematic review. BMC Vet. Res. 2012, 8, 240. [Google Scholar] [CrossRef]
  8. Song, P.P.; Xia, J.F.; Gao, J.J.; Xu, L.Z.; Huang, Y.; Yao, L.N.; Tang, W. Measures to combat H7N9 virus infection in China: Live poultry purchasing habits, poultry handling, and living conditions increase the risk of exposure to contaminated environments. Biosci. Trends 2013, 7, 168–171. [Google Scholar] [CrossRef]
  9. Callaghan, T.; Lueck, J.A.; Trujillo, K.L.; Ferdinand, A.O. Rural and urban differences in COVID-19 prevention behaviors. J. Rural Health 2021, 37, 287–295. [Google Scholar] [CrossRef]
  10. Henning-Smith, C. The unique impact of COVID-19 on older adults in rural areas. J. Aging Soc. Policy 2020, 32, 396–402. [Google Scholar] [CrossRef]
  11. Paul, R.; Arif, A.A.; Adeyemi, O.; Ghosh, S.; Han, D. Progression of COVID-19 from urban to rural areas in the United States: A spatiotemporal analysis of prevalence rates. J. Rural Health 2020, 36, 591–601. [Google Scholar] [CrossRef]
  12. Lim, S.; Bassey, E.; Bos, B.; Makacha, L.; Varaden, D.; Arku, R.E.; Baumgartner, J.; Brauer, M.; Ezzati, M.; Kelly, F.J.; et al. Comparing human exposure to fine particulate matter in low and high-income countries: A systematic review of studies measuring personal PM2.5 exposure. Sci. Total Environ. 2022, 833, 155207. [Google Scholar] [CrossRef] [PubMed]
  13. Otuyo, M.K.; Nadzir, M.S.M.; Latif, M.T.; Din, S.A.M. A review of personal exposure studies in selected Asian countries’ public transport microenvironments: Lessons learned and future directions. Environ. Sci. Pollut. Res. Int. 2023, 30, 121306–121337. [Google Scholar] [CrossRef] [PubMed]
  14. Fan, J.C.; Li, S.L.; Fan, C.L.; Bai, Z.G.; Yang, K.H. The impact of PM2.5 on asthma emergency department visits: A systematic review and meta-analysis. Environ. Sci. Pollut. Res. Int. 2016, 23, 843–850. [Google Scholar] [CrossRef]
  15. Pallarés, S.; Gómez, E.T.; Martínez-Poveda, Á.; Jordán, M.M. Distribution Levels of Particulate Matter Fractions (<2.5 μm, 2.5–10 μm and >10 μm) at Seven Primary Schools in a European Ceramic Cluster. Int. J. Environ. Res. Public Health 2021, 18, 4922. [Google Scholar] [CrossRef]
  16. Wan, J.A.; Zhang, Z.R.; Huo, Y.; Wang, X.Z.; Wang, Y.F.; Wu, J.H.; Huo, M.X. Particle size matters: Distribution, source, and seasonality characteristics of airborne and pathogenic bacteria in wastewater treatment plants. Atmosphere 2023, 14, 465. [Google Scholar] [CrossRef]
  17. Humbert, S.; Marshall, J.D.; Shaked, S.; Spadaro, J.V.; Nishioka, Y.; Preiss, P.; McKone, T.E.; Horvath, A.; Jolliet, O. Intake fraction for particulate matter: Recommendations for life cycle impact assessment. Environ. Sci. Technol. 2011, 45, 4808–4816. [Google Scholar] [CrossRef] [PubMed]
  18. Nakhjirgan, P.; Kashani, H.; Kermani, M. Exposure to outdoor particulate matter and risk of respiratory diseases: A systematic review and meta-analysis. Environ. Geochem. Health 2023, 46, 20. [Google Scholar] [CrossRef]
  19. Pryor, J.T.; Cowley, L.O.; Simonds, S.E. The physiological effects of air pollution: Particulate matter, physiology and disease. Front. Public Health 2022, 10, 882569. [Google Scholar] [CrossRef]
  20. Iqbal, M.A.; Siddiqua, S.A.; Faruk, M.O.; Md Towfiqul Islam, A.R.; Salam, M.A. Systematic review and meta-analysis of the potential threats to respiratory health from microbial Bioaerosol exposures. Environ. Pollut. 2024, 341, 122972. [Google Scholar] [CrossRef] [PubMed]
  21. Han, Y.P.; Li, L.; Wang, Y.; Ma, J.W.; Li, P.Y.; Han, C.; Liu, J.X. Composition, dispersion, and health risks of bioaerosols in wastewater treatment plants: A review. Front. Environ. Sci. Eng. 2020, 15, 38. [Google Scholar] [CrossRef]
  22. Balakrishnan, V.; Yong, K.K.; Tiong, C.K.; Ng, N.J.S.; Ni, Z. A scoping review of knowledge, awareness, perceptions, attitudes, and risky behaviors of sexually transmitted infections in Southeast Asia. Healthcare 2023, 11, 1093. [Google Scholar] [CrossRef]
  23. Han, Y.; Yang, K.; Yang, T.; Zhang, M.; Li, L. Bioaerosols emission and exposure risk of a wastewater treatment plant with A2O treatment process. Ecotoxicol. Environ. Saf. 2019, 169, 161–168. [Google Scholar] [CrossRef]
  24. Han, Y.; Yang, T.; Xu, G.; Li, L.; Liu, J. Characteristics and interactions of bioaerosol microorganisms from wastewater treatment plants. J. Hazard. Mater. 2020, 391, 122256. [Google Scholar] [CrossRef]
  25. Han, Y.; Yang, T.; Yan, X.; Li, L.; Liu, J. Effect of aeration mode on aerosol characteristics from the same wastewater treatment plant. Water Res. 2020, 170, 115324. [Google Scholar] [CrossRef] [PubMed]
  26. Yousefzadeh, A.; Maleki, A.; Athar, S.D.; Darvishi, E.; Ahmadi, M.; Mohammadi, E.; Tang, V.T.; Kalmarzi, R.N.; Kashefi, H. Evaluation of bio-aerosols type, density, and modeling of dispersion in inside and outside of different wards of educational hospital. Environ. Sci. Pollut. Res. Int. 2022, 29, 14143–14157. [Google Scholar] [CrossRef]
  27. Xie, Y.K.; Zhu, X.J.; Zhang, P.Y.; Wang, S.; Yang, J.; Li, J.G. Cost-effective instant air disinfection for building ventilation system by a combination of UV and micro-static electricity. Chem. Eng. J. 2023, 454, 140231. [Google Scholar] [CrossRef]
  28. Nakai, R. Size matters: Ultra-small and filterable microorganisms in the environment. Microbes Environ. 2020, 35, ME20025. [Google Scholar] [CrossRef]
  29. Xie, Z.S.; Fan, C.L.; Lu, R.; Liu, P.X.; Wang, B.B.; Du, S.L.; Jin, C.; Deng, S.X.; Li, Y.P. Characteristics of ambient bioaerosols during haze episodes in China: A review. Environ. Pollut. 2018, 243, 1930–1942. [Google Scholar] [CrossRef]
  30. Després, V.R.; Huffman, J.A.; Burrows, S.M.; Hoose, C.; Safatov, A.S.; Buryak, G.; Fröhlich-Nowoisky, J.; Elbert, W.; Andreae, M.O.; Pöschl, U.; et al. Primary biological aerosol particles in the atmosphere: A review. Tellus B 2012, 64, 1–58. [Google Scholar] [CrossRef]
  31. Núñez, A.; Amo de Paz, G.A.; Rastrojo, A.; García, A.M.; Alcamí, A.; Gutiérrez-Bustillo, A.M.; Moreno, D.A. Monitoring of airborne biological particles in outdoor atmosphere. Part 2: Metagenomics applied to urban environments. Int. Microbiol. 2016, 19, 69–80. [Google Scholar] [CrossRef] [PubMed]
  32. van Overbeek, L.S.; Saikkonen, K. Impact of bacterial-fungal interactions on the colonization of the endosphere. Trends Plant Sci. 2016, 21, 230–242. [Google Scholar] [CrossRef] [PubMed]
  33. Nguyen, J.; Fernandez, V.; Pontrelli, S.; Sauer, U.; Ackermann, M.; Stocker, R. A distinct growth physiology enhances bacterial growth under rapid nutrient fluctuations. Nat. Commun. 2021, 12, 3662. [Google Scholar] [CrossRef]
  34. Piecková, E. Adverse health effects of indoor moulds. Arh. Hig. Rada Toksikol. 2012, 63, 545–549. [Google Scholar] [CrossRef] [PubMed]
  35. Wang, J.D.; Levin, P.A. Metabolism, cell growth and the bacterial cell cycle. Nat. Rev. Microbiol. 2009, 7, 822–827. [Google Scholar] [CrossRef]
  36. Chen, C.C.; Dai, L.H.; Ma, L.X.; Guo, R.T. Enzymatic degradation of plant biomass and synthetic polymers. Nat. Rev. Chem. 2020, 4, 114–126. [Google Scholar] [CrossRef]
  37. Amobonye, A.; Bhagwat, P.; Singh, S.; Pillai, S. Plastic biodegradation: Frontline microbes and their enzymes. Sci. Total Environ. 2021, 759, 143536. [Google Scholar] [CrossRef]
  38. Lindgren, E.B.; Stamm, B.; Chan, H.K.; Maday, Y.; Stace, A.J.; Besley, E. The effect of like-charge attraction on aerosol growth in the atmosphere of titan. Icarus 2017, 291, 245–253. [Google Scholar] [CrossRef]
  39. Bower, P.A.; Scopel, C.O.; Jensen, E.T.; Depas, M.M.; McLellan, S.L. Detection of genetic markers of fecal indicator bacteria in Lake Michigan and determination of their relationship to Escherichia coli densities using standard microbiological methods. Appl. Environ. Microbiol. 2005, 71, 8305–8313. [Google Scholar] [CrossRef]
  40. Schraft, H.; Watterworth, L.A. Enumeration of heterotrophs, fecal coliforms and Escherichia coli in water: Comparison of 3M Petrifilm plates with standard plating procedures. J. Microbiol. Methods 2005, 60, 335–342. [Google Scholar] [CrossRef]
  41. Yu, X.Z.; Han, Y.P.; Cao, Y.N.; Wang, Z.X.; Zhou, Z.Y.; Zheng, T.L.; Liu, J.G.; Yang, X.X. Progress in the distribution characteristics and risks of bioaerosols from anthropogenic sources. Microbiol. China 2023, 50, 667–686. [Google Scholar]
  42. Han, Y.P.; Yu, X.Z.; Cao, Y.N.; Liu, J.G.; Wang, Y.; Liu, Z.P.; Lyu, C.L.; Li, Y.L.; Jin, X.; Zhang, Y.X.; et al. Transport and risk of airborne pathogenic microorganisms in the process of decentralized sewage discharge and treatment. Water Res. 2024, 256, 121646. [Google Scholar] [CrossRef] [PubMed]
  43. Baghal Asghari, F.B.; Dehghani, M.H.; Dehghanzadeh, R.; Farajzadeh, D.; Yaghmaeian, K.; Mahvi, A.H.; Rajabi, A. Antibiotic resistance and antibiotic-resistance genes of Pseudomonas spp. and Escherichia coli isolated from untreated hospital wastewater. Water Sci. Technol. 2021, 84, 172–181. [Google Scholar] [CrossRef] [PubMed]
  44. Patterson, L.; Navarro-Gonzalez, N.; Jay-Russell, M.T.; Aminabadi, P.; Pires, A.F.A. Risk factors of Shiga toxin-producing Escherichia coli in livestock raised on diversified small-scale farms in California. Epidemiol. Infect. 2022, 150, e125. [Google Scholar] [CrossRef]
  45. Yang, J.; Seo, J.; Jee, Y.; Kim, Y.; Sohn, J. Composition Analysis of Airborne Microbiota in Outdoor and Indoor Based on Dust Separated by Micro-sized and Nano-sized. Aerosol Air Qual. Res. 2023, 23, 210231. [Google Scholar] [CrossRef]
Figure 1. Preliminary preparatory work and determination of sampling methods.
Aerobiology 03 00004 g001
Figure 2. Characterization of biological particle distribution in villages under high- and low-wind-speed weather conditions; (a) characterization of biological particle concentration; (b) characterization of biological particle concentration in fine particulate matter; (c) characterization of biological particle distribution in villages under high wind speed; (d) characterization of biological particle distribution in villages under low wind speed.
Aerobiology 03 00004 g002
Figure 3. Characterization of biological particle distribution in villages under high and low temperature weather conditions; (a) characterization of biological particle concentration; (b) characterization of biological particle concentration in fine particulate matter; (c) characterization of biological particle distribution in villages under high-temperature weather; (d) characterization of biological particle distribution in villages under low-temperature weather.
Aerobiology 03 00004 g003
Figure 4. Characteristics of bioparticle distribution in villages under cloudy weather conditions; (a) characteristics of bioparticle concentration; (b) characteristics of bioparticle concentration in fine particulate matter; (c) characteristics of bioparticle distribution in villages under sunny weather; (d) characteristics of bioparticle distribution in villages under cloudy weather.
Aerobiology 03 00004 g004
Figure 5. Characteristics of bioparticle distribution in villages under rainfall weather conditions; (a) characteristics of bioparticle concentration; (b) characteristics of bioparticle concentration in fine particulate matter; (c) characteristics of bioparticle distribution in villages in pre-rainfall air; (d) characteristics of bioparticle distribution in villages in rainfall; (e) characteristics of bioparticle distribution in villages in post-rainfall air.
Aerobiology 03 00004 g005
Figure 6. Characteristics of bioparticle distribution in villages under hazy weather conditions; (a) characteristics of bioparticle concentration; (b) characteristics of bioparticle concentration in fine particulate matter; (c) characteristics of bioparticle distribution in villages under sunny weather; (d) characteristics of bioparticle distribution in villages under mild hazy weather; (e) characteristics of bioparticle distribution in villages under moderately hazy weather.
Aerobiology 03 00004 g006
Figure 7. RDA analysis of environmental conditions and bioparticle concentrations.
Aerobiology 03 00004 g007
Figure 8. A diagram of the escape pathway of Enterobacteriaceae within the village; (a) Hot weather; (b) After rainfall; (c) Moderate haze.
Aerobiology 03 00004 g008
Table 1. Summary of environmental conditions.
Sample TypeTemperature (°C)Humidity (%)Atmospheric Pressure (hpa)Wind Speed (m/s)Wind DirectionUltraviolet IndexAir Quality (μg/m3)Weather Conditions
Bioparticle23.023.0891.32.7west3.789.3sunny/hot weather
26.023.7887.73.0west4.767.0Sunny/High wind speed
23.330.3889.02.7northeast2.784.7cloudy
22.048.31010.11.7east2.353.0before rainfall/Low wind speed
23.058.71009.72.3east2.039.0during rainfall
25.743.01012.21.7east3.756.3after rainfall
−17.066.01043.33.0southeast1.3117.0light haze
−11.066.71033.02.3southeast1.098.0sunny/cold weather
−10.371.71033.02.0southeast0.7187.3moderate haze
Enterobacteriaceae26.430.2888.62.7northeast3.259.2hot weather
25.743.01012.21.7east3.756.3after rainfall
−15.366.01045.34.0southeast1.0162.0moderate haze
Wind direction is the prevailing wind direction during the sampling period. Air quality refers to AQI (Air-Quality Index). The AQI values in this study were determined by the weather forecast at the time.
Disclaimer/Publisher’s Note: The statements, opinions and data contained in all publications are solely those of the individual author(s) and contributor(s) and not of MDPI and/or the editor(s). MDPI and/or the editor(s) disclaim responsibility for any injury to people or property resulting from any ideas, methods, instructions or products referred to in the content.