Abstract
We investigated whether a cold front passed on the day when the most cedar pollen was dispersed in each year. When we looked at the 10-year period from 2015 to 2024, and found seven cases in which a cold front passed through the pollen survey area in the Tohoku region. In these cases, extremely large amounts of pollen were dispersed in the hours before and after the front passed. What they had in common was that the amount of pollen dispersion increased significantly at the time the front passed and before and after it. There were 3 cases when a large amount of Japanese cedar pollen was dispersed, even though a cold front did not pass through our Tohoku region. In these cases, large amounts of pollen were dispersed during the time when the warm front was located several hundred to one thousand kilometers south from Tohoku region. The large amount of dispersion continued as long as the fronts moved northward and got closer by several hundred kilometers to the Tohoku region, and the pollen dispersion decreased by the time the front reached the Tohoku region.
1. Introduction
Japanese cedar (Cryptomeria japonica D. Don) (hereafter abbreviated as cedar) is an endemic species that grows only in Japan. About 40% of the forest area is artificial forest, and about half of that is planted with cedars. They are widely planted in Honshu (the main island of Japan). In Hokkaido, they are distributed in the southern tip, and in Okinawa, in the northern part of the main island. Japanese cypresses (Chamaecyparis obtuse) are also planted in large numbers, although there are not very many in the Tohoku region (the area of the dashed line in Figure 1). In the northern part of the Tohoku region, Aomori Prefecture, many Hiba (Thujopsis delabrata var. hondae) are planted (they flower later than cedars). In the southern half of the Japanese archipelago (parts of (3), (5), (6), and (7) in Figure 1), more Japanese cypresses are planted than cedars [1]. Cedar trees flower at different altitudes. Our past surveys have shown that flowers bloom at altitudes about 100 m higher with a one week delay [2]. It is also known that in years with warm winters, pollen dispersion begins earlier, while in years with severe winters, this occurs later [2]. This makes it possible to know when Japanese cedar pollen (hereafter abbreviated as cedar pollen) starts to disperse and when it disperses the most.
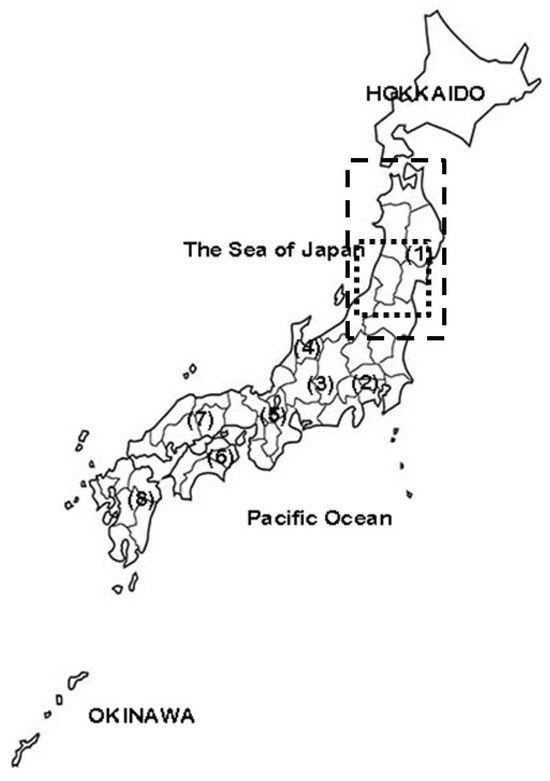
Figure 1.
The location on the map of Japan of the Tohoku region. The area surrounded by a dashed square was the subject of the survey. The locations of each region listed in the results are as follows: (1): Tohoku region; (2): Kanto region; (3): Chubu region; (4): Hokuriku region; (5): Kansai region; (6): Shikoku region; (7): Chugoku region; (8): Kyushu region.
Sahashi [3,4] reports the start of cedar pollen dispersion across Japan annually in the Japanese Journal of Palynology. He has summarized the time when cedar pollen dispersion begins nationwide as the cedar pollen front. According to the report, in the Kyushu, Chugoku, and Shikoku regions ((6) to (8) in Figure 1), the season begins from late January to early February, while in the Kanto and Kansai regions ((2) and (5) in Figure 1) it is in mid-February, and in the Hokuriku and Tohoku regions ((1) and (4) in Figure 1) it is from late February to early March.
Durham samplers have been widely used nationwide to measure such cedar pollen. Some patients experience pollinosis symptoms 2 to 3 weeks before cedar pollen is detected by the Durham samplers [5]. In the past, we have used Burkard samplers and Rotorod samplers in combination. In the 2000s, real-time pollen monitors begun to be used to provide information. In our Tohoku region, real-time information provision began in 2008. There are several types of monitors [6], among which the KH-3000 monitor (Yokosuka City, Japan 238-0013) and Pollen Robo (Chiba City, Japan 261-0023) have been widely used. The KH-3000 monitor, which was first developed, was previously used to provide information nationwide, although recently the Pollen Robo has been used to provide information nationwide. These real-time cedar pollen monitors are not devices that identify pollen morphologically and provide pollen counts. They utilize laser light-scattering to count airborne pollen concentrations [7,8,9,10,11,12]. This is achieved by determining the size of airborne particles from the intensity of scattering properties of the reflected light, then counting the pollen-sized grains. In Japan, such real-time cedar pollen monitors were developed because of the following factors: (1) The pollen in the air during the cedar pollen season in Japan is almost exclusively cedar pollen. (2) Cedar pollen is dispersed in quantities incomparable to other pollen species.
In our data, the KH-3000 monitor showed some values (<10 grains/m3) even during periods when pollen was not observed [13]. Occasionally, abnormal peaks that were not pollen were observed (Supplementary Figure S1). Abnormal values were also observed during yellow sand and snowfall periods. The Pollen Robo evolves every year, and in 2025 it became the eighth-generation monitor. In 2025, the peak of cedar pollen dispersion coincided with the arrival of yellow sand, although the new Pollen Robo did not count the yellow sand. It also does not seem to count ice nuclei seen during snowfall. It has built-in communication equipment and can be observed anywhere in Japan, as long as there is a power source. The difference between the two is that the KH-3000 monitor sucks in air samples from above, while the Pollen Robo sucks them in from below. In light of these circumstances, we thought it would be fine to target the day with the most dispersion in each year (the day of highest dispersion).
Here, we questioned which weather conditions result in the highest amounts of cedar pollen dispersion per hour in a day. Cedar pollen is dispersed in especially large amounts on warm, high-temperature days. However, the authors of the present study have experienced the release of large amounts of cedar pollen just before temperatures dropped and rain began to fall after a series of warm, sunny days because cold fronts pass through when temperatures drop and rain begins to fall after a period of sunny days; therefore, we focused on fronts and pollen release. A cold front had passed through on the day of maximum dispersion in our previous survey [14]. Currently, we think that the reason for the high amount on this day was that the pollen was concentrated by the front. This can be inferred from the fact that a front associated with a low-pressure system is concentrated as it passes through mountain ranges [15]. Normally, cedar pollen arrives at the sampling point from a limited area, although when there is a cold front, the pollen generated in an area covered by warm air is pushed by the strong cold air and concentrated. The pollen is collected from a wider area than usual and from faraway places where it normally does not arrive, so it is thought that the concentration increases. Therefore, we decided to first check whether a front was passing on the day of the highest count of pollen in each year. If this idea is correct, there should be more pollen in the area where the front is and the surrounding areas, so we investigated the relationship between the places where the front passed and the amounts of cedar pollen. In the present study, we investigated whether this phenomenon was evident in other years by studying cedar pollen release seasons over the ten-year period from 2015 to 2024.
2. Materials and Methods
Hourly data for the time of the peak pollen season at each year from 2015 to 2021 were collected from the Internet websites for the KH-3000 monitor (the Ministry of the Environment website “Hanako-san”, Past Data List (2003 Kanto region only to 2021) https://www.env.go.jp/page_00209.html accessed on 31 May 2025; we can view past data from 2003 to 2021) and for the years from 2022 to 2024 for Pollen Robo, from the website of Weathernews Nationwide pollen observation data (only available during pollen season) (https://weathernews.jp/pollen/obs.html accessed on 31 May 2025).
KH-3000 monitors have been installed nationwide by the Ministry of the Environment, with two monitors being installed in each prefecture—one for urban areas and the other for rural areas. We have been purchasing these real-time monitors for research purposes since the 1990s, and they are installed at three locations in Yamagata Prefecture. However, the nationwide service providing information from the monitors was suspended after the 2021 season. In this study, therefore, data from Pollen Robo devices were used for the years after this. One thousand Pollen Robos are installed throughout Japan every spring, providing real-time data for people who install the monitors. As large amounts of data are made public, individuals can find out the dispersal information in their local area in real time 15 min later (i.e., the value from 9:00 to 10:00 will be available at 10:15).
The hourly measurement values of each point in the Tohoku region, which are necessary for data analyses, were taken from the values published on the website. The number of cedar pollen grains at each location is shown in pie chart form as a logarithmic value based on the Weber–Fechner law. The data for the wind direction, wind speed, and temperature were published on the website of the Japan Meteorological Agency (The past weather data search screen is displayed here https://www.data.jma.go.jp/stats/etrn/index.php) accessed on 31 May 2025. We obtained the location coordinates of each measurement point in the Tohoku region, which made it possible to display the cedar pollen measurement values, wind direction, and wind speed values on a map. We used Python 3.8 to display on a map the amount of cedar pollen in the air, along with data for the wind direction and wind speed. We used Adobe Photoshop to paste the weather chart, based on the chart published by the Japan Weather Association (Current weather chart provided by the Japan Weather Association (Japanese) https://tenki.jp/guide/chart accessed on 31 May 2025 View past weather charts and calendars going back to 2015). The distribution map of cedar forests in the southern Tohoku region (dotted area in Figure 1) shown in Figure 2 was created using TM images from the Landsat satellite [16]. To create this distribution map, we first walked around the cedar forests that we would use as training areas, and then used the areas to extract satellite data. Thirty years have passed since the image was created, although deforestation has not progressed in Japan, especially in our region. One reason for this is that cedars are not consumed as lumber due to competition from imported timber. The second reason is that even if trees are cut down, they are replanted in the same place to prevent an increase in carbon dioxide caused by global warming and for disaster prevention purposes. Therefore, although a long time has passed since the image was created, cedar forests are distributed mainly in the same areas. Due to the social problem of cedar pollen allergy, there has been a recent movement to cut down trees and plant different species, although this movement has not yet occurred in Tohoku region, as large cities such as the Tokyo metropolitan area have taken the lead.
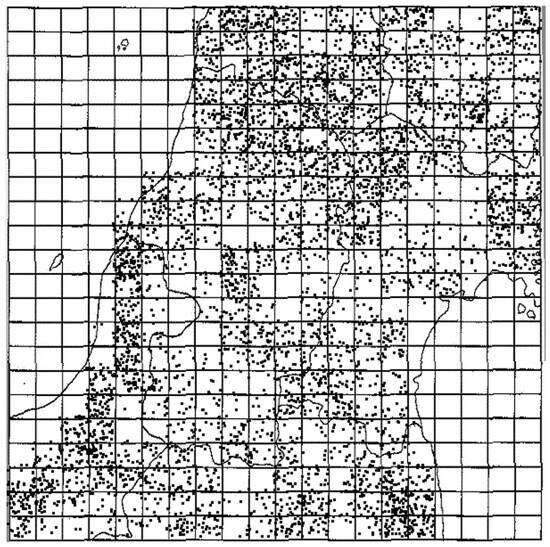
Figure 2.
Distribution map of cedar forests in the southern Tohoku region created using Landsat-TM data [16]. The areas with denser black dots are where more trees are planted. The black double circle in the center indicates the location of a real-time cedar pollen monitor in Yamagata City.
3. Results
The results of the study for the 10-year period from 2015 to 2024 are shown in Table 1a. In 7 out of the 10 years, a cold front passed through the Tohoku region on the day with the highest pollen count. In the remaining 3 years, no cold front passed through the Tohoku region, although a warm front or stationary front passed through. The details of these three years are shown in Table 1b. Figure 3A–G shows the position of the cold front and the cedar pollen counts at each survey site. The cedar pollen counts at each location are shown in pie chart form, in which the logarithm of the pollen count is the diameter of the circle. It often takes about 3 to 10 h for a cold front to move across the Tohoku region from the Sea of Japan side to the Pacific Ocean side, although sometimes this passage takes just a few hours, as on 3 April 2015 (Figure 3A) and 21 March 2019 (Figure 3D). A large numbers of pollen grains were counted in the western parts of the Tohoku region when the front was still in the Sea of Japan and had not yet reached the Japanese archipelago. In any year, cedar pollen counts can be found in large numbers where the front is located and before and after it has passed through each observation point. A lot of cedar pollen is dispersed in the front surface of a front. In such instances, pollen continues to disperse for several hours after the front passes, although as time passes and the front moves away, it stops dispersing.

Table 1.
(a) The time and weather conditions when the cold front passed on the day of the highest pollen count in each year. (b) The year when no cold front passed on the day of the highest pollen count.
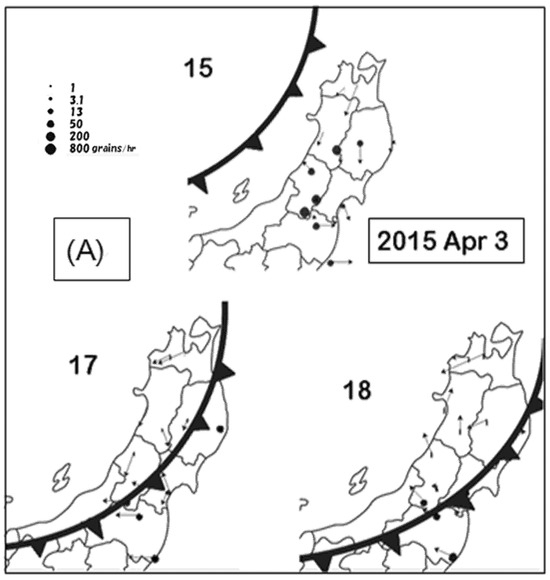
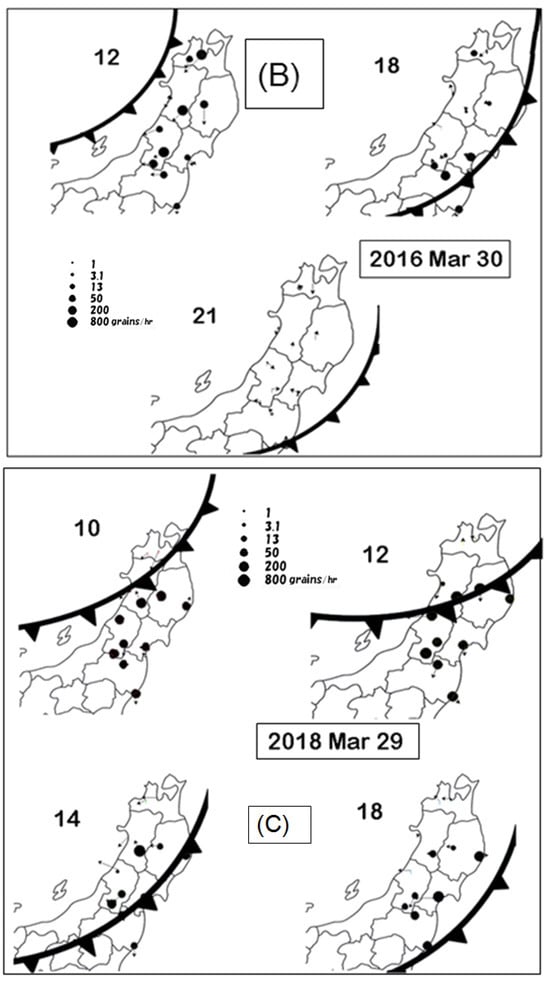
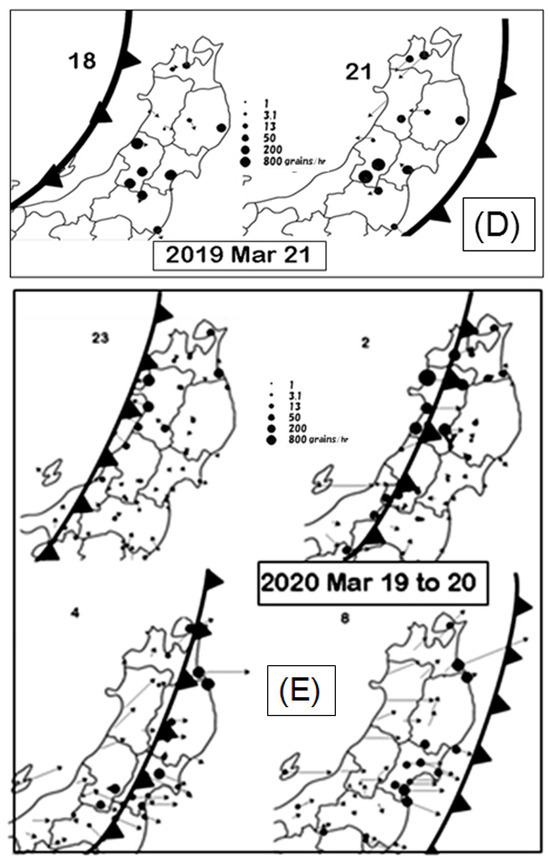
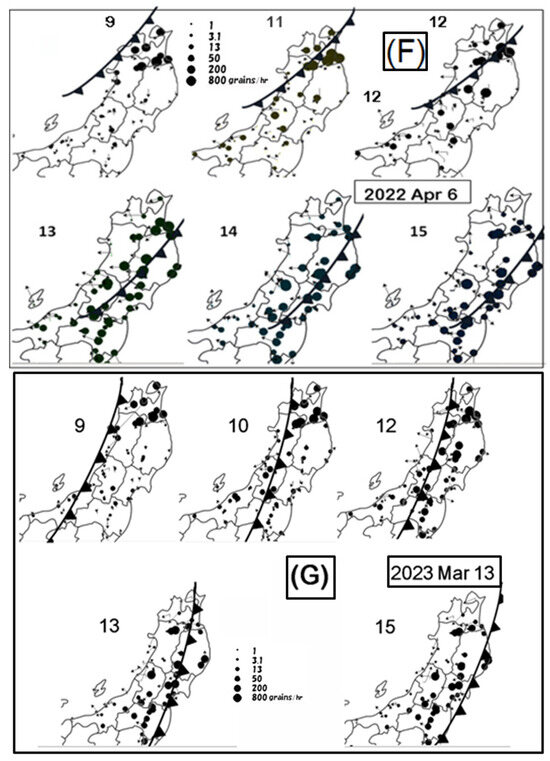
Figure 3.
Changes in cedar pollen counts, wind direction, and wind speed during passages of cold fronts: (A) 3 April 2015, 15:00 to 18:00; (B) 30 March 2016, 12:00 to 21:00; (C) 29 March 2018, 10:00 to 18:00; (D) 21 March 2019, 08:00 to 21:00; (E) 19–20 March 2020, 23:00 to 08:00; (F) 6 April 2022, 09:00 to 15:00; (G) 13 March 2023, 09:00 to 15:00.
The phenomenon of large amounts of pollen dispersion also occurring before a front was seen in cases of warm fronts. As an example of these phenomena, Figure 4 shows the positions of low-pressure warm fronts at a succession of timepoints on 23 March 2023, as well as pie chart presentations of logarithmic values of 52 points obtained from Pollen Robo in the Tohoku region. The figure shows the situation on the day when a low-pressure system moved in a northeast direction from the Sea off Kyushu to Tohoku. On this day, a warm front moved north through the Kyushu, Chugoku, and Chubu regions. In Tohoku, cedar pollen was also dispersed during this time (11:00 in Figure 4a to 15:00 in Figure 4c), with particularly high pollen counts in areas on the Sea of Japan side close to the low-pressure system. There was almost no change in the number of pollen counts dispersed. Around 19:00, when the warm front approached southern Tohoku, the number of pollen counts decreased. This was different from the case of a cold front.
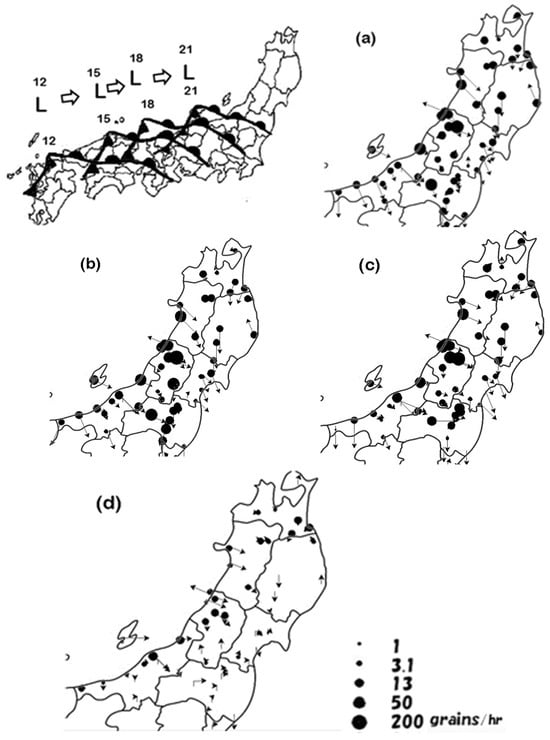
Figure 4.
An example of the locations of low-pressure systems (L), warm fronts, and cold fronts. Each figure shows the amount of pollen in the air by the size of the pie chart, and the wind direction and speed at that time by the arrow and its length. (a–d) The trend from 23 March 2023: (a) 11:00; (b) 13:00; (c) 15:00; (d) 19:00. The suction capacity of the Pollen Robo has not been disclosed, although since it is about 30% of that of the real-time pollen monitor KH-3000, the values have been tripled in the pie chart in Figure 4. Therefore, it cannot be directly compared with Figure 3.
Figure 4 shows the results for 2023. As the Pollen Robo is improved every year, we used new data. Similar results were obtained in 2022. Namely, a low-pressure system located south of Japan gradually moved northward, reaching as far north as the Tohoku region. The warm front dispersed large amounts of cedar pollen at distances from several hundred to one thousand kilometers ahead in its direction of travel (Figure 4a,c). Subsequently, the amounts of dispersed pollen decreased with time (Figure 4d).
4. Discussion
Fronts associated with low-pressure systems are paired with cold and warm fronts. In this study, we investigated cases of cold front passages, when cold fronts passed through the Tohoku region of Japan where the study authors reside. In all cases highlighted in Table 1 and Figure 3, the low-pressure systems were located in the Tsugaru Strait (a strait between Hokkaido and Honshu) or further north (Hokkaido, Sakhalin). Paired warm fronts associated with low-pressure systems were not recorded in the region shown in Figure 3 but only to the north of this area. As almost no cedar trees are planted in Hokkaido except on its southern tip, the warm fronts were not important in these cases, and so are not included in Figure 3. The number of cedar pollen counts at each survey point shown in the pie chart is expressed as a logarithmic value. This is based on the Weber–Fechner law, which states that the perceived intensity is proportional to the logarithm of the stimulus.
In this study, we looked at how pollen counts at various locations change with the passage of a cold front. What is common in many cases is that the pollen counts increase significantly at the time the cold front passes, as well as before and after. Previously, we obtained results in 2020; however, these results were for only two years [14]. This time, we analyzed the data for 10 years, and confirmed the previous results.
We believe that this phenomenon occurs for the following reasons. In cases of cold fronts, there is warm air in front of the cold air of the front. During the peak pollen dispersion time, a large amount of cedar pollen is generated in this warm air mass. Cedar pollen falls at a speed of 3 to 5 cm per second, so if the wind carrying the pollen only has a horizontal component, it will fall onto the ground several hundred meters to several kilometers away. However, because cedars are mainly planted on the slopes of mountainous areas, the cedar pollen produced by the warm air is carried into the sky by updrafts. In basins such as Yamagata, the bottom of the basin is warmed by the warm air, so valley breezes always blow, and this phenomenon can be seen. When a cold front moves into a warm air mass, the cold air sinks below the warm air, concentrating the pollen that was present in the warm air mass. This is because air masses with different properties do not mix easily, so they gather and concentrate on the front surface. As the cedar pollen on the front surface falls due to gravity, it may be suggested that a large amount of cedar pollen is dispersed at the front surface of the front, before and after the passage of the front.
There were days when a large amount of cedar pollen was dispersed even though a cold front did not pass through our area. In most of these cases, the low-pressure systems were located on the south of the Sea of Japan. When these low-pressure systems moved northeast, the warm front moved northeast along the Japanese archipelago. By the time the warm front reached the Tohoku region, the amount of dispersed cedar pollen had decreased. This is a different situation to that which is seen in the case of a cold front. In areas south of the Kanto region, the term “Haru Ichiban” (describing the first gusty wind of spring in Japan, when the cedar pollen is at its peak in the Kanto region and further south) is used to announce the arrival of spring. At this time, the cedar pollen is most abundant in the Kanto region. This time is characterized by a low-pressure system over the Sea of Japan that causes strong southerly winds to blow. In the Tohoku region, which was our target area, the cedar pollen has only just begun to disperse at the time of the “Haru Ichiban”, and the peak pollen season is still several weeks later, although looking at the movement of the front in Figure 4, it is very similar. More details on this will be shared in the future.
Previously, to identify trends in cedar pollen counts, we used the simulation model developed by Professor Emeritus Kawashima of Kyoto University [17,18]. Using this prediction method, we were able to predict the dispersion situation in most cases, although there were days when it could not be predicted. As we wrote in the introduction, if warm days continue during the peak pollen dispersion period, the pollen count increases day by day. However, it was not possible to predict the phenomenon of large amounts of dispersed pollen on occasions when the weather worsened and rain started to fall. Using the simulation method, a distribution map of cedar forests is used to make the cedar forests in each mesh bloom at each altitude [2], and the pollen released from the blooming cedar trees is moved by the wind. However, the only variables used in this case were the temperature and wind direction and speed for each 10 km mesh. Consequently, phenomena such as the passage of a cold front were not incorporated; therefore, these could not be predicted. In addition, because the number of male flower buds varies by year and by region, this must also be taken into consideration. In other words, in years when there are many male flower buds, the dispersal period is longer, and the peak amount of dispersed pollen is also greater. These amounts can differ between the southern and northern parts of Japan, and in some cases between the Sea of Japan side and Pacific Ocean side. This was taken into consideration, therefore, when determining the period of maximum dispersal.
From the perspective of providing information to people in Japan who may be impacted by high levels of pollen, it is necessary that warnings about the abovementioned phenomena be given through weather forecasts on days when a cold front is expected to pass, or when a warm front is expected to move from the south to the north of the Japanese archipelago. In the case of a cold front, the time it takes to pass is about 10 h. There is a possibility that pollen will be dispersed for a few hours after the front passes until, after about 5 h, it is no longer dispersed. In the case of a warm front, the amount of dispersed cedar pollen increases during times when the front does not pass populated areas, so it is necessary to provide information early. In the Tohoku region, for instance, the number of pollen grains released will increase as soon as the warm front reaches the Hokuriku and Kanto regions.
Incidentally, in the case of a cold front, the cedar pollen is dispersed in extremely large quantities for only a short period of time. Does this mean we only need to be careful for a short period of time? This does not seem to be the case. Pollen allergens may persist for a long time, even after the pollen can no longer be seen. It is known that pollen in the air contains pollen allergens (antigens) that are released from the pollen [6,19]. More specifically, in addition to being caused by cedar pollen itself, cedar pollen allergens (antigens) exist in the air when released from cedar pollen and attached to other airborne particles (Supplementary Figure S2) [20,21]. It is also known that there is sometimes no correlation between the number of pollen grains and the amount of pollen allergens (Cry j 1) [22,23]. Cry j 1 existed several days before cedar pollen appeared in the air. This fact coincides with the finding that symptoms appear among sensitive pollinosis patients before the pollen can be detected in the air [22]. We speculate that the reason for this is that the allergens derived from pollen that are transferred to water by rain droplets or other factors adhere to airborne particles [20,21]. Major cedar pollen allergens are present in exine (Cry j 1) [23,24] and starch granules (Cry j 2) [23,25]. It may be recalled that in the cold fronts, pollen grains are concentrated on the front surface of the front. Some parts of the pollen allergens are transferred to water droplets in the air around the pollen grains; the water droplets then gather together and fall to the ground as rain. In such instances, pollen allergens remain in the rainwater, so caution may be necessary when light rain is observed several hours after the passage of a cold front. Additionally, in urban areas, pollen allergens attached to diesel gas may be dispersed on roads with heavy traffic [26,27]. This allergen also adheres to yellow sand [28], so caution is also necessary when yellow sand comes from the Asian continent. At such times, cedar pollinosis patients should be especially careful. Although the sudden increase in pollen counts when a front passes is short-lived, it is believed that the cedar pollen allergens eluted from the pollen that fall with rain remain suspended in the air for a long period of time, increasing the possibility of a new onset of disease. In the case of a warm front, however, there is little risk of rainfall. Nevertheless, the cedar pollen concentrated in the air remains dispersed in large quantities for a long time. As this is the period before the front passes, it is to be expected that the cedar pollen will continue to disperse for a long time; therefore, caution is also required in cases of warm fronts.
5. Conclusions
- We investigated whether the amount of cedar pollen dispersal increased significantly due to cold fronts passing through the Tohoku region during the peak cedar pollen dispersal period over the 10-year from 2015 to 2024. There were 7 cases in which a cold front passed through the pollen survey site (Tohoku region) on the highest cedar pollen dispersion day.
- We looked at how the pollen counts at various locations change with the passage of a cold front. What is common is that the pollen counts increase significantly at the time the front passes and before and after the front has passed. In cases of cold fronts, extremely large amounts of pollen were dispersed during the several hours before and after the front passed.
- There were 3 days when the highest count of cedar pollen was dispersed even though a cold front did not pass through our Tohoku region. Large amounts of pollen were dispersed when the front was located several hundred to one thousand kilometers south of the Tohoku region and while heading north. The amount of pollen decreased by the time the front reached the Tohoku region.
Supplementary Materials
This study was exempt from ethical review and approval because it focuses on airborne pollen. The following supporting information can be downloaded at: https://www.mdpi.com/article/10.3390/aerobiology3020005/s1, Figure S1. Comparison of the real-time cedar pollen monitor KH-3000 (dotted line) and the Burkard sampler (solid line). Figure S2. Cedar pollen antigen spots from airborne pollen samples at cedar pollen season collected with Burkard sampler [29,30].
Author Contributions
Conceptualization, methodology, software, validation, investigation, writing—original draft preparation, writing—review and editing, visualization, Y.T.; investigation, resources & data curation, Y.S.; supervision, T.I. All authors have read and agreed to the published version of the manuscript.
Funding
This research received no external funding.
Informed Consent Statement
Not applicable.
Data Availability Statement
The original contributions presented in this study are included in the article/Supplementary Material. Further inquiries can be directed to the corresponding author.
Acknowledgments
The authors thank the anonymous reviewers for their detailed comments. We would like to express our sincere gratitude for the use of data from Weathernews’ Pollen Robo, wind direction, wind speed and temperature data from the Japan Meteorological Agency, and weather charts from the Japan Weather Association.
Conflicts of Interest
The authors declare no conflicts of interest.
References
- Sahashi, N.; Takahashi, Y.; Murayama, K. All About Japanese Cedar Pollen; Medical Journal Company: Tokyo, Japan, 1995; ISBN 4-944012-15-2. (In Japanese) [Google Scholar]
- Takahashi, Y.; Ono, S.; Ishimori, H.; Aoki, S.; Kawashima, S.; Kimura, K.; Aikawa, S. Locality of flowering time of Cryptomeria japonica and its estimation method from altitude or 1km2 grid temperature. Jpn. J. Palynol. 1993, 39, 113–120. (In Japanese) [Google Scholar]
- Sahashi, N.; Murayama, K. Change in the northward movement of the pollen of Cryptomeria japonica in Japan, during 1986–1991. Allergie et Immunologie 1993, 25, 150–153. [Google Scholar]
- Sahashi, N. The Cryptomeria japonica pollen front in 2019 & charactiristics of C. japonica and Chamaecyparis obtusa pollen scattering. Jpn. J. Palynol. 1992, 38, 140–147. (In Japanese) [Google Scholar]
- Takahashi, Y.; Suzuki, Y.; Ohta, N.; Kakehata, S. Multi-point analysis of airborne Japanese cedar (Cryptomeria japonica D. Don) pollen by Pollen Robo and the relationship between pollen count and the severity of symptoms. Aerobiologia 2019, 35, 635–646. [Google Scholar] [CrossRef]
- Takahashi, Y. Current state of Japanese cedar (Cryptomeria japonica D. Don) pollen information and future directions for its airborne allergen determination and improved pollen monitoring. Aerobiology 2024, 2, 1–17. [Google Scholar] [CrossRef]
- Kawashima, S.; Clot, B.; Fujita, T.; Takahashi, Y.; Nakamura, K. An algorithm and a device for counting airborne pollen automatically using laser optics. Atmos. Environ. 2007, 41, 7987–7993. [Google Scholar] [CrossRef]
- Kawashima, S.; Thibaudon, M.; Matsuda, S.; Fujita, T.; Lemonis, N.; Clot, B.; Oliver, G. Automated pollen monitoring system using laser optics for observing seasonal changes in the concentration of total airborne pollen. Aerobiologia 2017, 33, 351–362. [Google Scholar] [CrossRef]
- Yoda, S.; Enomoto, T.; Shibano, A.; Ikeda, H.; Yajin, S.; Dake, Y.; Harada, T. A comparative study between real-time monitor KH-3000 and conventional Durham sampler measuring airborne pollen. Nippon Jibiinkoka Gakkai Kaiho 2005, 108, 801–805. (In Japanese) [Google Scholar] [CrossRef][Green Version]
- Imai, T.; Nohara, U.; Endo, T.; Fukaya, S. Usefullness and practical use of an automatic counter for scattering pollens in spring. Jpn. J. Allergy 2005, 54, 559–568. (In Japanese) [Google Scholar]
- Sahashi, N.; Fujita, T. A new system for monitoring air borne pollen using laser light-scattering system and the results. Environ. Conserv. Eng. 2003, 32, 191–195. [Google Scholar] [CrossRef]
- Miki, K.; Fujita, T.; Sahashi, N. Development and application of a method to classify airborne pollen taxa concentration using light scattering data. Sci. Rep. 2021, 11, 22371. [Google Scholar] [CrossRef] [PubMed]
- Takahashi, Y.; Kawashima, S.; Fujita, T. Comparison between real-time pollen monitor KH-3000 and Burkard sampler. Jpn. J. Allergol. 2001, 50, 1136–1142. (In Japanese) [Google Scholar]
- Takahashi, Y.; Kawashima, S.; Suzuki, Y.; Kakehata, S. Relationship between large amounts of Cryptomeria japonica D. Don pollen dispersion and cold front passage. Int. J. Plant Anim. Environ. 2022, 12, 134–137. [Google Scholar] [CrossRef]
- Takahashi, Y.; Kawashima, S.; Suzuki, Y.; Ohta, N.; Kakehata, S. Enrichment of airborne Japanese cedar (Cryptomeria japonica) pollen in mountain ranges when passing through a front accompanying temperate low pressure. Aerobiologia 2018, 34, 105–110. [Google Scholar] [CrossRef]
- Takahashi, Y.; Tokumaru, K.; Kawashima, S. Distribution chart of Cryptomeria japonica forest through data analysis of Landsat-TM. Jpn. J. Palynol. 1992, 38, 140–147. [Google Scholar]
- Kawashima, S.; Takahashi, Y. Modelling and simulation of mesoscale dispersion process for airborne cedar pollen. Grana 1995, 34, 142–150. [Google Scholar] [CrossRef]
- Kawashima, S.; Takahashi, Y. Improved simulation of mesoscale dispersion process for airborne cedar pollen using a flowering time map. Grana 1999, 38, 316–324. [Google Scholar] [CrossRef]
- Stewart, G.A.; Holt, P.G. Submicronic airborne allergens. Med. J. Aust. 1985, 143, 426–427. [Google Scholar] [CrossRef]
- Takahashi, Y.; Sakaguchi, M.; Inouye, S.; Miyazawa, S.; Imaoka, K.; Katagiri, S. Existence of exine-free airborne allergen particles of Japanese cedar (Cryptomeria japonica) pollen. Allergy 1991, 46, 588–593. [Google Scholar] [CrossRef]
- Takahashi, Y.; Ohashi, T.; Nagoya, T.; Sakaguchi, M.; Yasueda, H.; Nitta, H. Possibility of real-time measurement of an airborne Cryptomeria japonica pollen allergen based on the principle of the surface plasmon resonance. Aerobiologia 2008, 17, 313–318. [Google Scholar] [CrossRef]
- Baba, K. Pollen dispersion as a modification factor of Japanese cedar pollinosis. Allergy Pract. 1998, 230, 170–174. (In Japanese) [Google Scholar]
- Miki-Hiroshige, H.; Nakamura, S.; Yasueda, H.; Shida, T.; Takahashi, Y. immunochemical localization of the allergenic proteins in the pollen of Cryptomeria japonica. Sex. Plant Reprod. 1994, 7, 95–100. [Google Scholar]
- Yasueda, H.; Yui, Y.; Shimizu, T.; Shida, T. Isolation and partial characterization of the major allergen from Japanese cedar (Cryptomeria japonica) pollen. J. Allergy Clin. Immunol. 1993, 71, 77–86. [Google Scholar] [CrossRef]
- Sakaguchi, M.; Inouye, S.; Taniai, M.; Ando, S.; Usui, M.; Matuhasi, T. Identification of the second major allergen of Japanese cedar pollen. Allergy 1994, 45, 309–312. [Google Scholar] [CrossRef] [PubMed]
- Takafuji, S.; Suzuki, S.; Koizumi, K.; Tadokoro, K.; Miyamoto, T.; Ikemori, R.; Muranaka, M. Diesel-exhaust particles inoculated by the intranasal route have an adjuvant activity for IgE production on mice. J. Allergy Clin. Immunol. 1987, 79, 639–645. [Google Scholar] [CrossRef]
- Muranaka, M.; Suzuki, S.; Koizumi, K.; Takafuji, S.; Miyamoto, T.; Ikemori, R.; Tokiwa, H. Adjuvant activity of diesel-exhaust particles for the production of IgE antibody in mice. J. Allergy Clin. Immunol. 1986, 77, 616–623. [Google Scholar] [CrossRef]
- Wang, Q.; Gong, X.; Suzuki, M.; Lu, S.; Sekiguchi, K.; Nakajima, D.; Miwa, M. Size-segregated allergenic particles released from airborne Cryptomeria japonica pollen grains during the Yellow Sand events within the pollen scattering seasons. Asian J. Atmos. Environ. 2003, 7, 191–198. [Google Scholar] [CrossRef]
- Takahashi, Y. Future prospect and present status of airborne pollen and pollen allergen measurement, IGAKU NO AYUMI. J. Clin. Exp. Med. 2002, 200, 353–357. (In Japanese) [Google Scholar]
- Takahashi, Y.; Nagoya, T.; Ohta, N. Identification of airborne pollen and airborne particles with pollen allergen (Cry j 1, Dac g) by aeroallergen immunoblotting technique. Jpn. J. Allergol. 2002, 51, 609–614. (In Japanese) [Google Scholar]


Disclaimer/Publisher’s Note: The statements, opinions and data contained in all publications are solely those of the individual author(s) and contributor(s) and not of MDPI and/or the editor(s). MDPI and/or the editor(s) disclaim responsibility for any injury to people or property resulting from any ideas, methods, instructions or products referred to in the content. |
© 2025 by the authors. Licensee MDPI, Basel, Switzerland. This article is an open access article distributed under the terms and conditions of the Creative Commons Attribution (CC BY) license (https://creativecommons.org/licenses/by/4.0/).