Abstract
The successful management of road pavement maintenance requires the existence of suitable monitoring procedures for assessing pavement condition. A powerful tool for this is the use of non-destructive testing technologies. Non-destructive testing (NDT) aims to support the monitoring of pavement condition, as it enables constant and rapid collection of in situ data. Analyzing NDT data can result in the development of useful indexes that can be related to trigger values (criteria) to define pavement condition. This information can be used to assess the “health” of the pavement to decide whether intervention is required. However, to effectively support the implementation of pavement management measures, it is sometimes necessary to implement a pavement monitoring and assessment framework that can be adapted by road authorities on a case-by-case basis. To this end, this study addresses the development of a pavement monitoring and assessment procedure by integrating different NDT technologies to collect and evaluate data. The procedure, referred to as Integrated Testing and Evaluation (ITE), is proposed as an algorithm to find optimal strategies for prioritizing potential pavement interventions, considering the budget constraints for the required investigations.
1. Introduction
Condition assessment, performance forecasting and needs analysis are the three most important processes in pavement management [1]. They aim to evaluate pavement intervention strategies considering budget constraints, assess environmental aspects and determine the optimal time for intervention measures. In this sense, the activation of a Pavement Management System (PMS) is necessary to provide tools and methods to maintain the serviceability of pavements in the most cost-effective way. An ideal PMS aims to maintain pavements appropriately, extend their service life, ensure user safety and make good use of public funds [2,3].
However, the successful operation of a PMS requires appropriate pavement monitoring and evaluation procedures. Non-destructive testing (NDT) plays an important role in the monitoring, assessment and evaluation of pavement condition as it allows continuous and rapid collection of pavement data, without compromising its structural integrity [4,5]. The analysis of these data can lead to indicators relating to action levels (criteria) that define the condition of the pavement and can be used to assess the “health” of the pavement to decide whether pavement intervention is required. The knowledge gained leads to the management activities required for pavement preservation, which benefit not only the road authorities involved but also the users.
To effectively support the implementation of pavement management measures, it is sometimes necessary to implement a framework for pavement monitoring and assessment that can be adapted by authorities on a case-by-case basis. To this end, this study addresses the development of a pavement monitoring and assessment procedure by integrating different NDT technologies for data collection and evaluation. This procedure contains four fundamental points: NDT data, regular monitoring, precise methods for data analysis and balanced criteria for pavement evaluation.
The developed procedure, called Integrated Testing and Evaluation (ITE), is proposed based on previous experience [6] as an algorithm to find optimal strategies for prioritizing potential pavement interventions considering the budget constraints for the required investigations. It is implemented on a highway with a length of approximately 105 km using several data, e.g., traffic, layers’ thicknesses, elastic deflections, roughness and skid resistance, to determine the optimal section strategies and prioritization measures. The layer thickness data are collected with a Ground Penetrating Radar (GPR) [7,8], the deflection data with a Falling Weight Deflectometer (FWD) [9], the roughness data with a Road Surface Profiler (RSP) [10,11] and the skid resistance with the Grip Tester (GT) system [12,13].
It should be noted that the above systems are widely used worldwide, so there are already frameworks for their combined use but not for all of them together. In addition, the algorithm developed does not “mask” the condition of the pavement under a single index, such as the Overall Pavement Condition Index (OPCI) [14], but provides a multi-criteria tool that can evaluate the individual structural and functional characteristics of the pavements and synthesize the actual need for rehabilitation/repair works. No advanced analysis is required, only a statistical justification of the criteria values that are defined and support the decision on the need and type of rehabilitation/repair. It is therefore assumed that the implementation of the developed algorithm to support pavement management activities offers advantages such as simplicity and optimization of the use of resources. The implementation and the associated results are explained in more detail below.
2. Algorithm Development: Methodology and Characteristics
2.1. Description of NDT Data
The aim of the developed procedure is to facilitate the management of pavement maintenance activities. For this purpose, it is necessary to assess the current condition and predict the performance of the pavement under the influence of environmental changes and increased traffic. Therefore, an accurate and appropriate assessment is important to extend the life of the pavement through appropriate maintenance or rehabilitation. Various data must be collected for this purpose, bearing in mind that the assessment of precise data is crucial for efficient pavement management. For the assessment of the structural condition of the pavement, the minimum required data are traffic information, the thickness of the pavement layers and records of pavement deformation. For the functional assessment of the pavement, it is important to collect roughness data that reflect how the road users perceive the overall condition of a pavement. Of course, functional assessment could benefit from additional data such as skid resistance measurements, rutting measurements or records of surface damage to fully support pavement management activities [15]; roughness and skid resistance data are considered the minimum data required to address the simplicity of the algorithm developed.
Pavement data required for implementing the developed procedure are collected using NDT techniques. The GPR method [16,17] enables the collection of accurate continuous pavement thickness data. The main part of a GPR system is the antenna unit, which transmits and receives radar signals (Figure 1). In some cases, two antennas may be used for this purpose. Moreover, a transmitter is used for signal generation, while a receiver is used for signal detection. The whole operation of the GPR system is controlled through the control unit, which is accessed by the GPR operator. The collected data are then transferred to the storage device and can be assessed through the display unit.
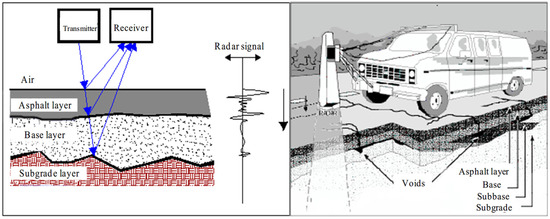
Figure 1.
GPR technique.
The GPR method can be used to identify “black” spots, which can then be further investigated with FWD tests or even core drilling. In addition, GPR is a useful tool for estimating the thicknesses of the individual layers of a pavement. These data can be used in conjunction with the FWD data in order to evaluate the physical properties of the pavement [18,19]. It is noted that the accuracy of the thicknesses measured with the GPR depends on several factors, such as the magnitude of the thickness of the individual layers, the material of the layer, the age of the pavement structure and so on [7,20,21]. Moreover, advanced analysis techniques may be also used to improve the GPR accuracy according to the individual case examined [22].
In FWD, a load pulse is generated by dropping a weight onto a damped spring system mounted on a load plate (Figure 2). The falling mass, the spring system (rubber buffer) and the drop height can each be adjusted to achieve the desired impact load on the pavement. Vertical deflection peaks are measured in the center of the load plate and at several radial positions by a series of deflection sensors. The impulse load applied to the pavement causes a “wave front” of recoverable deformations or deflections that propagate from the center of the load. Both the peak impulse load (force) and the maximum vertical deflections of the “wave front” are measured at several radial distances from the center of gravity of the load. The measured deflections generated by the imposed load provide an indication of the structural strength of the pavement. By analyzing FWD deflections, in combination with GPR layer thicknesses and traffic data, the bearing capacity of a pavement can be assessed. This procedure may result in a need for an intervention in terms of pavement maintenance.
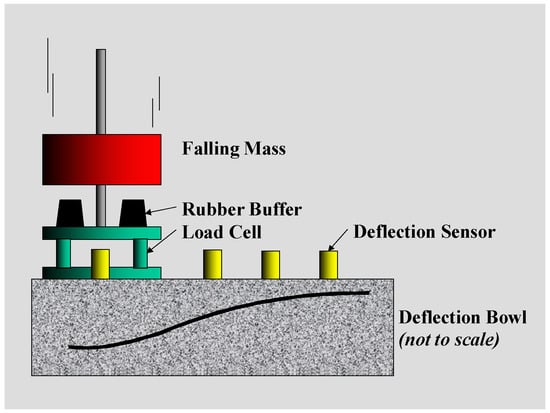
Figure 2.
FWD testing [23].
Roughness data are commonly collected using high-speed inertial profilers. These systems capture the characteristics of the road surface profile at high speeds using accelerometers and sensors (lasers) that measure the vertical distance between the accelerometer and the surface. The profilers usually have a beam as a base unit, in which electronic laser sensors and accelerometers are integrated [6]. This unit can be attached to the rear or front of an appropriately modified vehicle and provides a flat surface for attaching the sensors (Figure 3). The longitudinal surface profile of the measured road pavement is created by further processing the recorded data. This information is then used for estimating the International Roughness Index (IRI) [19,24,25].
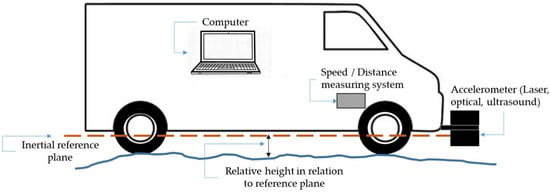
Figure 3.
High-speed inertial profiler.
There are several devices that collect data on the skid resistance of road surfaces. The Grip Tester (GT) system (Figure 4) is a friction measurement trailer that uses a fixed slip wheel to simulate the anti-lock braking system on wet roads [13]. It consists of a three-wheel system and a test wheel with a tire with a smooth tread. The slip of the test wheel is fixed at a certain level while the GT is moving at a speed of about 50 km/h. To create wet road conditions, a watering system creates a constant user-defined water film depth on the test wheel. The fixed slip of the test wheel combined with the water film depth allows the GT to continuously measure a wet road surface and determine an average friction index, the Grip Number (GN) [12].
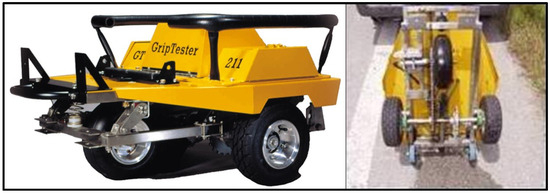
Figure 4.
Grip tester.
In summary, the presented procedure for monitoring and evaluating pavement condition incorporates the bearing capacity of the road pavement, along with the user-related surface characteristics, i.e., roughness and skid resistance, to determine optimal maintenance strategies and priority actions for pavements.
2.2. Conceptualization
The proposed procedure for pavement monitoring and evaluation by integrating NDT, i.e., the ITE process, includes two basic pillars, which are related to the structural and functional condition of the pavement under investigation. With this in mind, pavement monitoring and evaluation is subsequently defined.
The investigation of the structural condition of the pavement can be performed mainly based on GPR and FWD tests [23]. For the analysis, the initial pavement section is first divided into homogeneous subsections based on GPR layer thickness, FWD deflection and traffic data. In this way, new sections of the pavement under investigation are determined by recognizing the intermediate sections. The above procedure is presented schematically in Figure 5, which shows that the road section is initially divided in subsections based on deflection data, layer thicknesses and traffic, leading to the final division of the road section into five homogenous subsections.
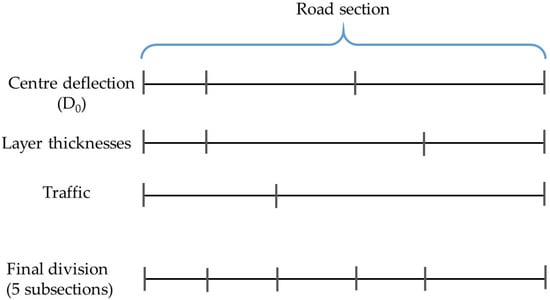
Figure 5.
Final road division into homogenous subsections based on D0 index, thickness data and traffic data subdivision.
For the classification of sections based on deflection data, the D0 index is a globally used index from the FWD measurements [25,26]. The D0 index provides an indication of the overall structural condition of a pavement. It is estimated based on the maximum measured FWD deflection, which is generated at the center of the FWD loading plate. To estimate the D0 index, the recorded deflection should be normalized to the target load of the test and a reference temperature (usually 20 °C) using appropriate international factors [23]. This procedure is important because the measured deflections depend on the applied load, while the behavior of asphalt mixtures is affected by temperature.
Various statistical methods can be used for the division of a road section into homogeneous subsections. An indicative method is the cumulative sum method (Cum Sum), in which the cumulative sum (si) is calculated through Equation (1) for the first test point and through Equation (2) for the remaining ones.
where
s1 = x1 − xm
si = xi − xm + si−1
- x1 is the parameter measured at the first test point;
- xm is the mean value of the measured parameter of each main section;
- s1 is the cumulative sum of the deviation from the mean for the first test point;
- xi is the parameter measured at test point i;
- si is the cumulative sum of the deviation from the mean at test point i;
- si−1 is the cumulative sum of the deviation from the mean at test point i − 1.
In the Cum Sum method, the change of the slope of the line connecting the cumulative sums (si) of the deviations from the mean value of a parameter may determine the homogeneity of a section. Then, the statistical difference between neighboring intercepts can be tested using the T-test. Finally, the homogeneity between two neighboring subsections can be estimated by calculating the weighted variance of the subsections.
The next step of the analysis includes the assessment of the structural condition of each homogeneous subsection based on international experience and practice [27,28,29]. It is considered that, by defining the 85% percentile of D0 values (only 15% of the values are higher) as representative of the subsection in question, a more conservative and safer analysis of strength (i.e., overlay thickness) is possible. Depending on the authority, even higher percentile values could be considered for the analysis, but this would probably lead to an unnecessary increase in maintenance costs. The outcome of this process is to determine the areas where strengthening of the pavement in the form of an overlay is required.
If there is no need to improve the strength of the pavement, the evaluation of the functional condition of the pavement is performed. Initially, the longitudinal profile of the pavement surface is determined, which includes a statistical analysis of the measured IRI values. This index is a well-established roughness index as it is considered a good indicator of pavement condition in terms of road roughness [28,29,30], which reflects the road user’s perception of ride quality. The IRI is an important decision criterion for assessing construction quality in terms of pavement surface condition [31].
Three criteria are defined for the assessment based on critical IRI values for certain characteristic variables and confidence levels (i.e., IRIcrA, IRIcrB, IRIcrC). The statistical analysis includes the determination of the theoretical distribution function that best fits the distribution of the obtained IRI data and the calculation of the values of the characteristic variables at three confidence levels -85, 95 and 100%- i.e., IRI85, IRI95, IRI100 (see Table 1).

Table 1.
Criteria for IRI values.
It should be noted that the critical values of the characteristic variables mainly depend on the classification of the road class defined by the traffic volume (i.e., average annual daily traffic, % trucks, ESALs). For the case shown in Table 2, the critical maximum roughness values (IRIs) refer to the ride quality of a highway pavement.

Table 2.
Max IRI values.
Based on the three criteria mentioned above, the necessary measures can be determined depending on the roughness condition. If there is no need to restore the roughness of the pavement, it is advisable to check the skid resistance level of the pavement. As part of the ITE procedure, skid resistance can be assessed by estimating a characteristic GN value for each section, which must then be compared with a fixed critical value for skid resistance, set at GNcr = 0.41. This critical value is regarded as a warning level for further investigation (investigation level) and not as a threshold for interventions in the road pavement. If the skid resistance of a road section is found to be below this level, an investigation is required to determine whether treatment should be undertaken. The decision depends on the impact of seasonal variations on skid resistance, the amount of dust on the surface, the number of accidents on wet roads due to “loss of control” or “skidding”, the permitted vehicle speed, etc., and includes measures ranging from reducing vehicle speed (vertical signage) to complete replacement of the surface course.
Figure 6 illustrates the entire ITE algorithm. To summarize, the functional assessment procedure follows the structural assessment of the pavement. If the structural assessment shows no need for action, the functional assessment is carried out immediately. If an intervention is necessary for structural reasons, the assessment of the roughness profile must be carried out after the necessary intervention.
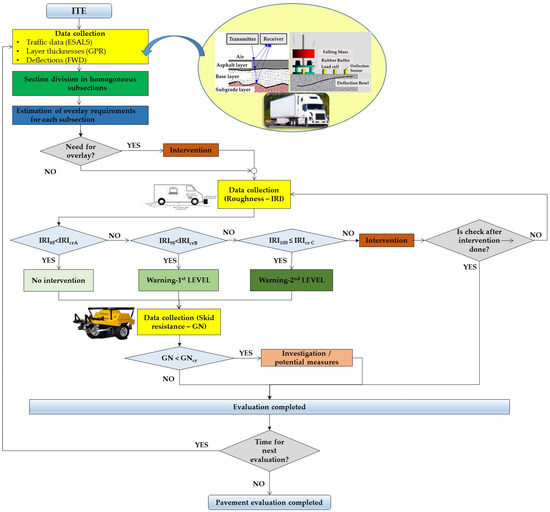
Figure 6.
ITE flowchart.
If the examined sections are structurally adequate and meet the roughness assessment criteria, the ITE procedure is completed. Otherwise, maintenance measures to improve the ride quality are proposed and the roughness assessment is carried out after the measures have been implemented.
The ITE algorithm can be repeated regularly in future pavement assessments to support pavement management activities.
3. Application
3.1. Test Site
The ITE algorithm was applied along a heavy-duty flexible pavement of a highway to be tested. The pavement structure consisted of Asphalt Concrete (AC) layers based on Unbound Granular Material (UGM) layers. Figure 7 presents the pavement cross-section, indicating the range of layers’ thickness values.
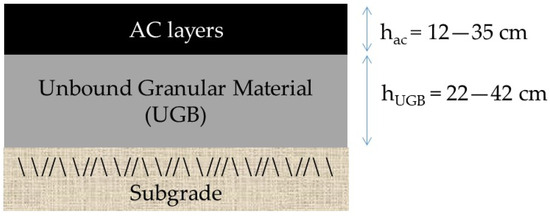
Figure 7.
Pavement cross-section.
The traffic data were generated from the highway toll system, which provides detailed information on heavy (truck) traffic that is considered in the design and evaluation of pavements. Differences in the traffic data occurred when interchanges appeared (in this specific case, two interchanges).
NDT data (i.e., deflection, layer thicknesses, roughness and skid resistance) were collected along the right lane (heavy duty lane) of the highway section under investigation using the systems shown in Figure 8.
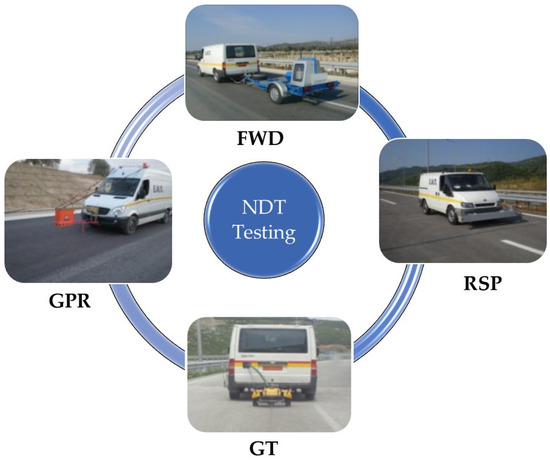
Figure 8.
NDT systems used for data collection.
In particular, the deflection measurements were carried out at 200 m intervals on the right-hand wheel path of the lane with a Dynatest 8002 FWD Test System [32]. During the FWD tests, pavement and air temperatures were also recorded for the normalization of the deflection measurements to the reference temperature, i.e., 20 °C [23].
The thickness measurements were carried out continuously along the same path with a complete GPR system for road inspection of GSSI [33]. For the GPR measurements, an air-coupled horn antenna of 1 GHz frequency was used, providing a penetration depth reading of approximately 90 cm. The system’s storage capacity was 900 GB and a wheel-mounted distance measuring instrument (DMI) was included The analysis of the GPR measurements for thickness estimation at intervals of 10 m was carried out using Road Doctor version 3.6.90 software [34].
The roughness measurements were carried out with a Dynatest 5051 Mark III, Road Surface Profiler (RSP) test system [35]. This is a high-speed inertial profiler that uses an accelerometer to obtain vertical vehicle body movement, and a laser sensor for measuring the displacement between the vehicle body and the pavement. Road profile measurements were obtained by summing the body movement with the appropriate body–road displacements and analyzed in accordance with Word Bank guidelines for conducting and calibrating road roughness measurements [36] and, in this particular case, at 10 m intervals
The skid resistance measurements were carried out with a grip tester system manufactured by Findlay Irvine [37]. Its operation principles are described above in Section 2.1. The measured GN values were averaged every 10 m.
It should be noted that the efficiency of the processing of NDT measurements in terms of the accuracy of the results is an important concern in any case. This is a general task that is also considered in specific cases, but details about the analysis process (e.g., calibration of the GPR analysis with drill cores) are beyond the scope of the present work. The aim is to show how the final data (i.e., traffic, D0, GPR thickness, IRI and GN) are further analyzed to assess the need for pavement interventions.
3.2. Data Analysis and Results
The structural assessment of the highway pavement condition was carried out by dividing the road section into homogeneous subsections that had an approximately uniform pavement structure and load-bearing capacity. The criteria used to divide the pavement into homogeneous subsections for analysis using the ITE procedure were the normalized deflection values (D0 index), the AC layer thickness and the traffic. The selection of these criteria was based on international experience and practice to define sections with similar structural characteristics and imposed loading.
Figure 9 shows the division of the road section according to the D0 index into (four) subsections, based on the statistical values (si) derived from the implementation of the Cum Sum method. Accordingly, Figure 10 shows the division of the road section according to AC layer thickness into (nine) subsections. It is noted that, for each division, the statistical difference between neighboring subsections was tested using the T-test.
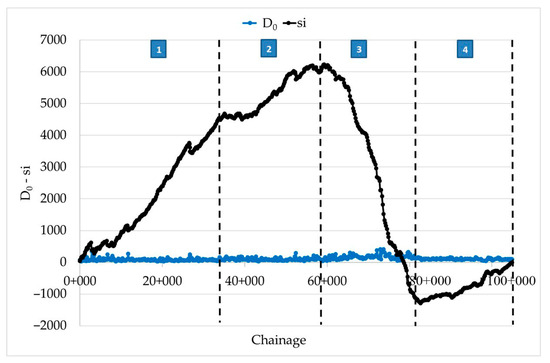
Figure 9.
Division of road section based on D0 using the Cum Sum method.
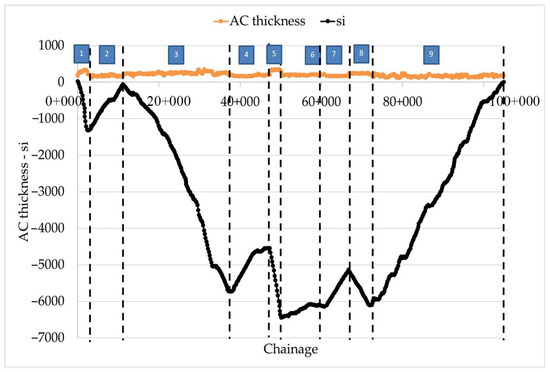
Figure 10.
Division of road section based on AC layer thickness using the Cum Sum method.
By also considering the traffic data, the final division of the road section into thirteen uniform subsections (A-1–A-13) occurred, as illustrated in Figure 11.
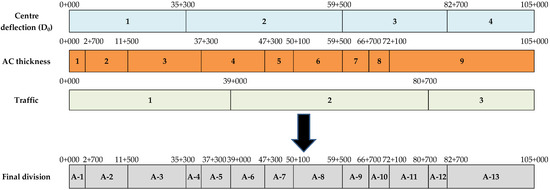
Figure 11.
Final road division based on D0 index, AC layer thicknesses and traffic data subdivision.
Once the homogeneous subsections were defined, a structural assessment analysis was performed to evaluate the properties of the pavement layers in situ (i.e., back-calculated moduli). This information was then used to determine the bearing capacity and to calculate the requirements for the surface course over a design period of 20 years.
The results of the structural analysis (Figure 12) show that eleven out of thirteen subsections appeared to be structurally adequate, while the two remaining ones (A-8 and A-11) needed to be reinforced. It should be noted that the assumption of elastic material properties may influence the analysis of the structural condition of the pavement during the ITE phase of the estimation of the potential need for overlays. However, this is the usual assumption for analyzing and evaluating the strength of the pavement.
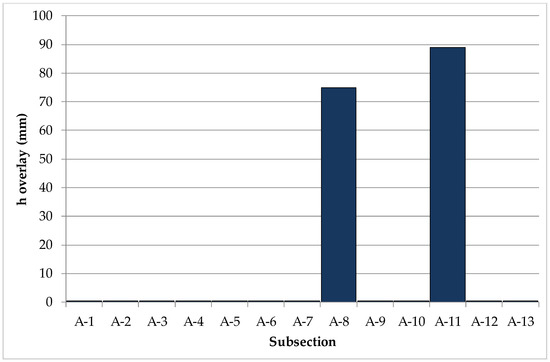
Figure 12.
Overlay requirements per subsection.
The next step was the measurement and evaluation of pavement roughness for subsections A-1–A-7, A-9, A-10, A-12 and A-13 in accordance with the criteria in Table 2. The evaluation was based on the statistical analysis of the measured IRI values calculated at an interval of 10 m. In particular, when analyzing the distribution of the relative frequencies of the measured IRI values of subsections A-1–A-7, A-9, A-10, A-12 and A-13, the probability density function of the log-normal distribution type showed the best approximation, as shown by the results of the Kolmogorov–Smirnov test [38]. For subsections A-2 and A-13, for example, the corresponding results are shown in Figure 13. The theoretical distribution function with the best fit of the obtained IRI data was then used to calculate the values of the characteristic variables at certain confidence levels, as shown in Figure 14, in order to apply the recommended criteria from Table 2.
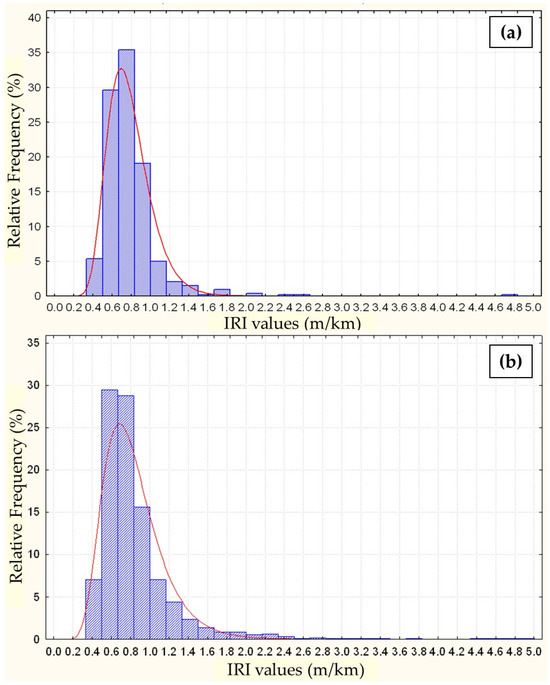
Figure 13.
Example of best fit probability distribution function: (a) subsection A-2: log-normal distribution (Kolmogorov–Smirnov d = 0.06979, p < 0.05) and (b) subsection A-13: log-normal distribution (Kolmogorov–Smirnov d = 0.08528, p < 0.01).
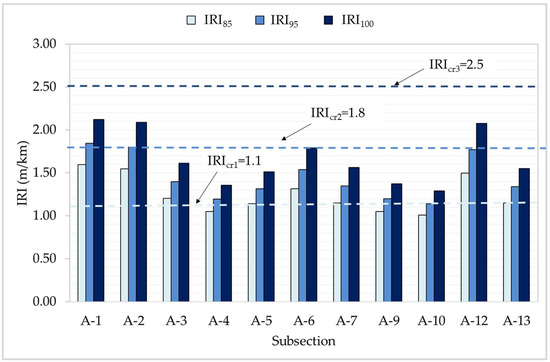
Figure 14.
IRI evaluation results.
The results of the roughness evaluation of the subsections using IRI show that the functional condition in terms of roughness level was sufficient and that there was no need to intervene in the pavement of subsections A-1–A-7, A-9, A-10, A-12 and A-13 to maintain the ride quality of pavement surface. For these homogeneous subsections, the analysis was extended by also considering a characteristic GN value for each subsection. This characteristic value was chosen as the mode of each GN dataset per subsection, as it was the most frequent value of the dataset and must be compared with a deterministically defined critical value, i.e., GNcr = 0.41, which was considered a warning level. Figure 15 shows the GN mode values compared with the critical value.
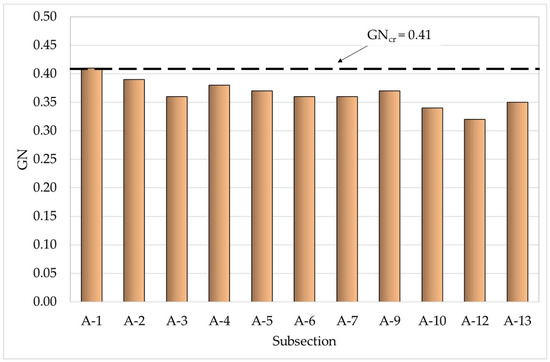
Figure 15.
GN evaluation results.
From the observation of the estimated characteristic GN values, it was concluded that all sections had a GN value that was below the specified GNcr value, which meant that further measures would be required to deal with the loss of skid resistance. On this basis, an investigation would be needed in order to determine whether specific treatments should be implemented.
The assessment of the pavement functional condition would also be carried out for subsections A-8 and A-11 after the reinforcement works. This concludes the proposed ITE procedure.
Apart from rural roads or highways as considered in this work, the ITE approach could also be used for different classifications of roads. Accordingly, the criteria would change depending on the requirements of the respective road category.
4. Conclusions
The ITE algorithm presented in this paper is proposed as a simple and effective method for determining optimal maintenance/rehabilitation strategies that minimize the need for data resources. The main requirement of ITE is the collection of NDT data on thickness, deflection, roughness and skid resistance, which must be appropriately evaluated after a rigorous monitoring loop of the pavement using weighted criteria. The most important advantages of the procedure presented can be summarized in three key points, namely:
- Efficiency, as the ITE can be a powerful tool for determining the maintenance needs of road pavements;
- Adaptability, as it can be modified and implemented according to the requirements of individual road operators;
- Applicability, as it is a rational and easy-to-implement testing and evaluation procedure.
However, it is true that this paper does not address the economic costs, the impact on road users and the periodicity of the NDT techniques used for monitoring. These critical issues have motivated a whole branch of research on structural health monitoring (SHM) of pavements and other structures (buildings, bridges, etc.). Although this approach is beyond the scope of this paper, future research could also consider these rapidly evolving techniques.
In any case, the value of the ITE algorithm is not questioned, as it is an objective procedure to support decision making within a PMS. It can also ensure road authorities a cost-effective use of limited resources, which is of utmost importance. All in all, the proposed procedure can be adapted to the needs of road operators and the corresponding intervention strategies by defining the road category and the trigger values of the criteria, etc., as it is a ready-to-use tool.
Author Contributions
Conceptualization, C.P.; methodology, C.P., A.A. and A.L.; formal analysis, A.A.; writing—original draft preparation, C.P. and A.A.; writing—review and editing, A.A. and A.L.; All authors have read and agreed to the published version of the manuscript.
Funding
This research received no external funding.
Institutional Review Board Statement
Not applicable.
Informed Consent Statement
Not applicable.
Data Availability Statement
The data presented in this study are available on request from the corresponding author due to confidentiality issues.
Conflicts of Interest
The authors declare no conflicts of interest.
References
- Shekharan, R.A.; Wu, Z.; Chowdhury, T. Pavement Management with a Decentralized Organizational Structure. In Proceedings of the 89th Transportation Research Board Annual Meeting, Washington, DC, USA, 10–14 January 2010. [Google Scholar]
- Scheinberg, T.; Anastasopoulos, P. Pavement Preservation Programming: A Multi-year Multi-constraint Optimization Methodology. In Proceedings of the 89th Transportation Research Board Annual Meeting, Washington, DC, USA, 10–14 January 2010. [Google Scholar]
- Peraka, N.S.; Biligiri, K.P. Pavement asset management systems and technologies: A review. Autom. Constr. 2020, 119, 103336. [Google Scholar] [CrossRef]
- Bertolini, L.; D’Amico, F.; Napolitano, A.; Bianchini Ciampoli, L.; Gagliardi, V.; Romer Diezmos Manalo, J. A BIM-Based Approach for Pavement Monitoring Integrating Data from Non-Destructive Testing Methods (NDTs). Infrastructures 2023, 8, 81. [Google Scholar] [CrossRef]
- Tosti, F.; Gagliardi, V.; D’Amico, F.; Alani, A.M. Transport infrastructure monitoring by data fusion of GPR and SAR imagery information. Transp. Res. Proc. 2020, 45, 771–778. [Google Scholar] [CrossRef]
- Loizos, A.; Plati, C.; Georgiou, P.; Armeni, A. A Practice towards Pavement Monitoring and Evaluation. In Proceeding of the TRB 90th Annual Meeting, Washington, DC, USA, 23–27 January 2011; TRB 90th Annual Meeting Compendium of Papers DVD. p. 15. [Google Scholar]
- Al-Qadi, I.L.; Lahouar, S.; Jiang, K.; McGhee, K.K.; Mokarem, D. Accuracy of Ground-Penetrating Radar for estimating rigid and flexible pavement layer thicknesses. Transp. Res. Rec. 2005, 1940, 69–78. [Google Scholar] [CrossRef]
- Wang, S.; Zhao, S.; Al-Qadi, I.L. Real-Time Density and Thickness Estimation of Thin Asphalt Pavement Overlay During Compaction Using Ground Penetrating Radar Data. Surv. Geophys. 2020, 41, 431–445. [Google Scholar] [CrossRef]
- Zaghloul, S.; Ahmed, Z.; Swan, D.J.; Jumikis, A.A.; Vitillo, N. Falling Weight Deflectometer Correlation. Transp. Res. Rec. 2005, 1905, 90–96. [Google Scholar] [CrossRef]
- Perera, R.W.; Kohn, S.D.; Bemanian, S. Comparison of Road Profilers. Transp. Res. Rec. 1996, 1536, 117–124. [Google Scholar] [CrossRef]
- El-Korchi, T.; Collura, J. Comparative Study of Ride Quality Measuring Devices. Transp. Res. Rec. 1998, 1643, 125–135. [Google Scholar] [CrossRef]
- Pomoni, M.; Plati, C.; Loizos, A.; Yannis, G. Investigation of pavement skid resistance and macrotexture on a long-term basis. Int. J. Pavement Eng. 2022, 23, 1060–1069. [Google Scholar] [CrossRef]
- Kouchaki, S.; Roshani, H.; Prozzi, J.; Zuniga-Garcia, N.; Hernandez, J. Field Investigation of Relationship between Pavement Surface Texture and Friction. Transp. Res. Rec. 2018, 2672. [Google Scholar] [CrossRef]
- Shah, U.Y.; Jain, S.S.; Tiwari, D.; Jain, M.K. Development of Overall Pavement Condition Index for Urban Road Network. Procedia Soc. Behav. Sci. 2013, 104, 332–341. [Google Scholar] [CrossRef]
- Xiao, M.; Luo, R.; Yu, X. Assessment of asphalt pavement overall performance condition using functional indexes and FWD deflection basin parameters. Con. Build. Mat. 2022, 341, 127872. [Google Scholar] [CrossRef]
- ASTM D 4748; Standard Test Method for Determining the Thickness of Bound Pavement Layers Using Short-Pulse Radar. ASTM International: West Conshohocken, PA, USA, 2020.
- Solla, M.; Pérez-Gracia, V.; Fontul, S. A Review of GPR Application on Transport Infrastructures: Troubleshooting and Best Practices. Remote Sens. 2021, 13, 672. [Google Scholar] [CrossRef]
- Noureldin, A.S.; Zhu, K.; Li, S.; Harris, D. Network Pavement Evaluation with Falling-Weight Deflectometer and Ground-Penetrating Radar. Transp. Res. Rec. 2003, 1860, 90–99. [Google Scholar] [CrossRef]
- Elseicy, A.; Alonso-Díaz, A.; Solla, M.; Rasol, M.; Santos-Assunçao, S. Combined Use of GPR and Other NDTs for Road Pavement Assessment: An Overview. Remote Sens. 2022, 14, 4336. [Google Scholar] [CrossRef]
- Al-Qadi, I.L.; Lahouar, S. Use of GPR for thickness measurement and quality control of flexible pavements. J. Assoc. Asph. Paving Technol. 2004, 73, 501–528. [Google Scholar]
- Lahouar, S.; Al-Qadi, I.L.; Loulizi, A.; Tenton, C.M.; Lee, D.T. Approach to Determining In Situ Dielectric Constant of Pavements: Development and Implementation at Interstate 81 in Virginia. Transp. Res. Rec. 2002, 1806, 81–87. [Google Scholar] [CrossRef]
- Al-Qadi, I.L.; Lahouar, S. Measuring layer thicknesses with GPR—Theory to practice. Constr. Build. Mater. 2005, 19, 763–772. [Google Scholar] [CrossRef]
- COST 336—European Cooperation in the Field of Scientific and Technical Research, Use of Falling Weight Deflectometers in Pavement Evaluation; Final Report; European Commission: The Hague, The Netherlands, 2005.
- Perrera, R.W.; Kohn, S.D. Issues in Pavement Smoothness: A Summary Report; NCHRP Web-Only Document; NCHRP: Washington, DC, USA, 2002; p. 42. [Google Scholar]
- Hajek, J.J.; Kazmierowski, T.J.; Musgrove, G. Switching to International Roughness Index. Transp. Res. Rec. 1998, 1643, 116–124. [Google Scholar] [CrossRef]
- Hakim, B.A.; Brown, S.F.; Armitage, R.J. Pavement Evaluation and Strengthening Design: Sixteen Years Experience. In Proceedings of the 9th International Conference on Asphalt Pavements, Copenhagen, Denmark, 17–20 August 2002; p. 15. [Google Scholar]
- Brunton, J.M.; Armitage, R.J.; Brown, S.F. Seven Years Experience on Pavement Evaluation. In Proceedings of the 7th International Conference on Asphalt Pavements, Nottingham, UK, 16–20 August 1992; pp. 17–30. [Google Scholar]
- Sayers, M.; Gillespie, T.; Paterson, W. Guidelines for Conducting and Calibrating Road Roughness Measurements; World Bank Technical Paper No. 46; The World Bank: Washington, DC, USA, 1986. [Google Scholar]
- Loizos, A.; Plati, C. An Alternative Approach to Pavement Roughness Evaluation. Int. J. Pavement Eng. 2008, 9, 69–78. [Google Scholar] [CrossRef]
- Swan, M.; Karamihas, S.M. Use of a Ride Quality Index for Construction Quality Control and Acceptance Specifications. Transp. Res. Rec. 2003, 1861, 10–16. [Google Scholar] [CrossRef]
- Shirazi, H.; Ayres, M.; Speir, R.; Song, W.; Hall, G. Confidence Level and Efficient Sampling Size of Roughness Measurements for Pavement Management in Maryland. In Proceedings of the 89th Transportation Research Board Annual Meeting, Washington, DC, USA, 10–14 January 2010. [Google Scholar] [CrossRef]
- Dynatest. 8002 FWD Test System: Owner’s Manual; Dynatest: Ballerup, Denmark, 2001. [Google Scholar]
- GSSI. Antennas Manual; Geophysical Survey Systems Inc.: Nashua, NH, USA, 2009. [Google Scholar]
- RoadScanners. Road Doctor User’s Guide, Manual; RoadScanners: Rovaniemi, Finland, 2001. [Google Scholar]
- Dynatest. 5051 Mark III/IV, Road Surface Profiler, Test Systems, Owner’s Manual Version 2.3.4; Dynatest: Ballerup, Denmark, 2007. [Google Scholar]
- Sayers, M.; Gillespie, T.; Queiroz, C. WTP-45: The International Road Roughness Experiment. Establishing Correlation and a Calibration Standard for Measurements; The World Bank: Washington, DC, USA, 1986. [Google Scholar]
- Findlay Irvine Ltd. Road Base Grip Tester Survey Software for Roads (User Manual); Findlay Irvine Ltd.: Penicuik, UK, 2002. [Google Scholar]
- Chakravarti, I.M.; Laha, R.G.; Roy, J. Handbook of Methods of Applied Statistics; John Wiley and Sons: Hoboken, NJ, USA, 1967; Volume 1. [Google Scholar]
Disclaimer/Publisher’s Note: The statements, opinions and data contained in all publications are solely those of the individual author(s) and contributor(s) and not of MDPI and/or the editor(s). MDPI and/or the editor(s) disclaim responsibility for any injury to people or property resulting from any ideas, methods, instructions or products referred to in the content. |
© 2024 by the authors. Licensee MDPI, Basel, Switzerland. This article is an open access article distributed under the terms and conditions of the Creative Commons Attribution (CC BY) license (https://creativecommons.org/licenses/by/4.0/).