Abstract
This study characterized the level of oxidative metabolism in skeletal muscle during whole-body activity as a percentage of the muscle’s maximum oxidative rate (mVO2max) using near-infrared spectroscopy (NIRS). Ten healthy participants completed a progressive work test and whole-body walking and lunge exercises, while oxygen saturation was collected from the vastus lateralis muscle using near-infrared spectroscopy (NIRS). Muscle oxygen consumption (mVO2) was determined using arterial occlusions following each exercise. mVO2max was extrapolated from the mVO2 values determined from the progressive exercise test. mVO2max was 11.3 ± 3.3%/s on day one and 12.0 ± 2.9%/s on day two (p = 0.07). mVO2max had similar variation (ICC = 0.95, CV = 6.4%) to NIRS measures of oxidative metabolism. There was a progressive increase in mVO2 with walking at 3.2 Km/h, 4.8 km/h, 6.4 Km/h, and with lunges (15.8 ± 6.6%, 20.5 ± 7.2%, 26.0 ± 6.6%, and 57.4 ± 15.4% of mVO2max, respectively). Lunges showed a high reliability (ICC = 0.81, CV = 10.2%). Muscle oxidative metabolism in response to whole-body exercise can be reproducibly measured with arterial occlusions and NIRS. This method may be used to further research on mitochondrial activation within a single muscle during whole-body exercise.
1. Introduction
Whole-body aerobic capacity, commonly termed VO2max, is a frequently used measure to evaluate health and athletic performance [1,2]. Skeletal muscle oxidative metabolism is a key factor that contributes to whole-body VO2max. Increasingly, the health of skeletal muscle, and in particular skeletal muscle mitochondrial function, has also been shown to be important in health and disease [3,4]. This is true for resting muscle metabolism [5], but also for muscle metabolism during exercise [6].
Traditionally mitochondrial function has been measured using biochemical approaches in vitro with muscle biopsies [7,8,9]. Because of the invasive nature of the muscle biopsy procedure and artificial conditions employed during in vitro biochemical assessments, several noninvasive methods have been developed to assess skeletal muscle oxygen consumption in vivo. Magnetic resonance spectroscopy (31P MRS) can characterize muscle oxidative metabolism and changes in muscle pH [10,11,12]. However, 31P MRS is limited to exercise that can be performed in the constraints of the magnet bore. The advancement of near-infrared spectroscopy (NIRS) provides an additional noninvasive means of monitoring skeletal muscle oxygenation [13,14]. Skeletal muscle oxygen consumption (mVO2) can be measured by NIRS at rest and during exercise using an acute arterial occlusion [15,16,17,18,19,20,21,22]. However, most studies have been performed using an exercise ergometer in a seated or supine position. Measurements of muscle oxygen levels can be made during free-standing or untethered exercise [23]. What is needed is to incorporate measurements of muscle metabolism into free-standing exercise.
The purpose of this study was to characterize muscle oxygen consumption (mVO2) in the vastus lateralis muscle during free-moving exercise: consisting of walking on a treadmill at different speeds and free-standing bodyweight lunges. Values of mVO2 during walking and lunging exercise were normalized to maximal mVO2 estimated from mVO2 measurements made during a progressive knee extension work test. We repeated the measurements on a separate day to determine day-to-day variability. We hypothesized that mVO2 would increase proportionally with walking speed and that bodyweight lunging would require great levels of mVO2 than walking.
2. Materials and Methods
- Participants
Young, healthy adults between 18 and 33 years of age were recruited to participate in this study. This study was approved by the Institutional Review Board at the University of Georgia (Athens, GA, USA). All participants provided written informed consent prior to testing. All testing was conducted in accordance with the Declaration of Helinski (2008).
- Study Design
We used a repeated-measures one group experimental design that consisted of two testing sessions on non-consecutive days within a period of seven days (Figure 1). Each testing session consisted of a progressive work knee extension protocol, an increasing intensity treadmill walking protocol, and bodyweight lunges.

Figure 1.
Experimental timeline. The order of test administration was randomized between subjects and between testing days.
- Muscle assessments
Skeletal muscle oxygen consumption (mVO2) was assessed using the change in oxygenated hemoglobin/myoglobin (O2Hb) signal during brief arterial occlusions [24]. Arterial occlusions were performed using a blood pressure cuff (Hokanson SC12D, Bellevue, WA, USA) inflated using a rapid inflation system (Hokanson E20 Cuff Inflator, Bellevue, WA, USA) powered by a 10-gallon commercially available air compressor (California Air Tools 210DLV, San Diego, CA, USA). Oxygen signals were obtained using a continuous-wave NIRS device (PortaMon, Artinis Medical Systems, Zetten, The Netherlands) with 3 LED transmitters that each emit two wavelengths (760 nm and 850 nm) of light at three set distances (30, 35, and 40 mm) from the receiver. All data analyses were performed at 40 mm separation distances. The depth of penetration of the light was assumed to be approximately half of the distance between the transmitter and receiver [25]. All NIRS data were collected at a sampling rate of 10 Hz. NIRS data were scaled (expressed as a percentage) to the maximal physiological range obtained during the ischemic calibration. NIRS signals were corrected for blood volume changes as previously described [24]. mVO2 was calculated as the rate of change in the NIRS oxygenated (O2Hb) signal during arterial occlusions using a simple linear regression [21].
B-mode ultrasound imaging (LOGIQ e: GE HealthCare, Wauwatosa, WI, USA) was used to measure the adipose tissue thickness (ATT) under the NIRS probe. ATT thickness has been shown to influence NIRS signals in previous studies [18,26,27].
Muscle electromyography (EMG) signals were collected using a Biopac Systems MP100A-CE, with the ECG100C unit). Electrodes were placed across the vastus lateralis muscle and on a bony landmark. The raw signal was collected at 200 Hz; the magnitude of the signal (squared and square root) was determined.
- Knee extension exercise protocol
The knee extension protocol consisted of performing single-leg knee extensions in the self-reported dominant leg at increasing frequencies of contraction. Resistance level was set at ~30% of the one repetition maximum. A leg extension fitness machine (Magnum Fitness Systems, Badger Fitness, South Milwaukee, WI, USA) was used to perform knee extensions (Figure 2A). The blood pressure cuff was placed as high as anatomically possible on the thigh on the self-reported dominant leg, with the NIRS device secured to the vastus lateralis muscle of the same leg using Velcro straps. The placement of the NIRS device was chosen to allow the maximum amount of distance between the device and the blood pressure cuff to attenuate any motion artifact in the NIRS signal that would be caused by inflation of the blood pressure cuff. Placement of NIRS device was recorded using measures relative to boney landmarks of the patella and hip bones to reproduce device placement as close as possible for the second day of testing. The following contraction frequencies were used: 5, 6, 7.5, 10, 12, and 15 leg extensions per minute. Single-leg knee extension exercises at each of the above contraction frequencies were performed for two minutes to ensure participants reached steady state mVO2. At the end of each two-minute bout of knee extension exercise, mVO2 was measured as the rate of change in the NIRS signal during a 10-s arterial occlusion. After the last set of knee extensions, an ischemic calibration was performed to scale NIRS data to a maximum physiological range as previously described [21]. Briefly, 5–8 leg extensions were performed immediately followed by a 5–6 min arterial occlusion and 3–5 min of reactive hyperemia after the release of the occlusion. All arterial occlusions were performed with the leg in a relaxed, fully extended position.
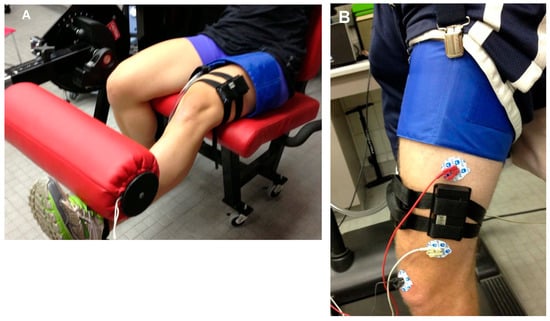
Figure 2.
(A) The experimental setup for the progressive exercise test. The NIRS device was placed on the vastus lateralis using straps. The blood pressure cuff was placed proximally to the NIRS device. The leg is shown lifting the weight. For NIRS measurements, the leg was placed on top of the padding in the horizontal position to allow the muscle to relax during the measurements. (B) Placement of the NIRS device, EMG electrodes, and ischemic cuff for the treadmill walking and lunging measurements.
- Free-moving exercise protocols
Free-moving exercise protocols consisted of both treadmill walking and bodyweight lunge exercises. A blood pressure cuff was placed as high as anatomically possible on the thigh of the self-reported dominant leg and attached to elastic suspenders to ensure the blood pressure cuff remained in place during the exercises (Figure 2B). The NIRS device was placed on the vastus lateralis of the same leg, allowing for the maximum amount of distance between the NIRS device and blood pressure cuff. Bony landmarks were used to record placement of the device to replicate placement location on the second day of testing.
Treadmill exercise consisted of walking at 3.2, 4.8, and 6.4 km/h for three minutes each to achieve close to steady level exercise. At the end of each three-minute bout of walking exercise, the treadmill was stopped to allow the participant to safely step to the side of the treadmill belt and transfer all body weight into the non-dominant leg. Once the participant was in a stable position (usually 2–3 s), a 10-s arterial occlusion was performed to measure mVO2.
Participants performed 15 bodyweight lunge exercises with the self-reported dominant leg forward to measure the level of oxidative metabolism after a short bout of exercise. Participants were instructed to perform 15 lunges, defined as a 90-degree bend in both the forward and behind leg with the back knee touching the floor, at a self-selected pace (between 0.7 and 0.9 lunges per second). Immediately following the lunges, the participant was instructed to stand with their body weight supported by their non-dominant leg and a 10 s arterial occlusion was performed to measure mVO2. After both treadmill and lunge protocols were completed, an ischemic calibration was performed as previously described [21]. Briefly, the participant was instructed to perform ~5 lunges and immediately stand with their body weight supported by the non-dominant leg. A 5–6 min arterial occlusion was performed followed by 3–5 min of reactive hyperemia after the release of the occlusion to obtain the ischemic calibration.
- NIRS data analysis
The metabolic rates of the increasing frequencies of leg extensions were plotted, producing an exponential curve (see Figure 3). The point at which the curve plateaued and no longer increased represented the mVO2max. Eadie Hoftsee plots were used to extrapolate mVO2max [28]. The metabolic rates obtained from the whole-body activities were then characterized as a percentage of mVO2max, with resting metabolism representing 0% and the calculated mVO2max representing 100%.
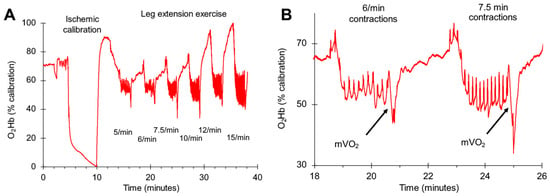
Figure 3.
Representative oxygen levels (O2Hb) for one subject during the progressive exercise test. An ischemic calibration was performed to normalize the oxygen levels to a range of 0–100%. (A) shows the complete protocol with six different exercise intensities. (B) shows an expanded view of two mVO2 slope measurements for two exercise intensities. The arrows indicate where the mVO2 measurements were made.
- Statistical analyses
All data are presented as means and standard deviations. Differences between days were assessed using paired T tests. We assumed the significant differences with p values less than 0.05. Day-to-day reproducibility was characterized by calculating the coefficient of variation (CV) and the intraclass correlation coefficient (ICC). The CV was calculated as the standard deviation of between-day tests divided by the mean of between-day tests, expressed as a percentage of the mean value. The ICC was calculated using a two-way mixed model analysis of variance. Pearson correlations were performed when examining the relationship between two variables. Equivalency plots were made for the mVO2max measurements [29].
3. Results
Ten young, healthy adults (seven male, three female) were recruited to participate in this study (22.8 ± 2.4 years of age, BMI of 24.5 ± 2.5). All participants self-reported to be recreationally active, defined as participating in physical exercise two days or more per week. Average adipose tissue thicknesses (ATT), measured by ultrasound over the vastus lateralis muscle was 0.66 mm (range = 0.35 to 0.86 mm). ATT measurements of the same location were highly correlated for day one and day two (r2 = 0.94). No significant relationships were seen between ATT and mVO2 measurements (p = 0.88).
A representative example of relative O2Hb levels during the progressive knee extension test is shown in Figure 3. A representative example of relative O2Hb levels during the whole-body activities are shown in Figure 4. Relative O2Hb levels for each of the measurements are shown in Figure 5. Relative O2Hb levels were not significantly different between day one and day two for any of the measurements (p > 0.05). The time from the last muscle contraction or step to the start of the NIRS slope measurement ranged from 2.2 to 3 s and was not different between day one and day two (Table 1).
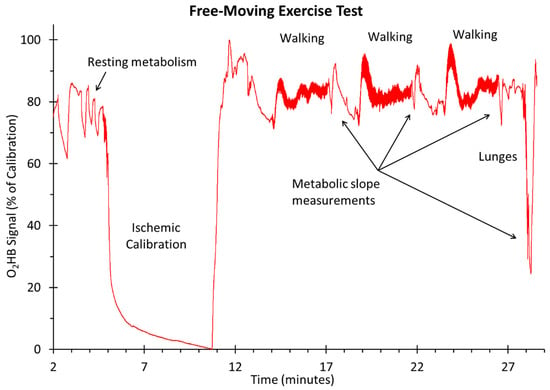
Figure 4.
Representative oxygen levels (O2Hb) for one subject during the walking and lunging exercise.

Figure 5.
(A) Oxygen levels at the start of the slope measurements for mVO2 during the progressive walking test. (B) Oxygen levels at the start of the slope measurements for mVO2 during the walking and lunging exercise. Values are means and standard deviations and have been offset on the x axis for clarity.

Table 1.
Times from the last muscle contraction to the start of the slope measurements.
Increasing the contraction frequency during the progressive work test resulted in increases in mVO2 (Figure 6). The extrapolated mVO2max was 11.3 ± 3.3%/s on day one and 12.0 ± 2.9%/s on day two (p = 0.07). For each work level, the coefficients of variation ranged from 5.1 to 10.1% of the mean value, and the ICC values varied from 0.25 to 0.79. mVO2max had a coefficient of variation of 6.4% and an ICC value of 0.95. The correlation of day one and day two for mVO2max and the equivalency plot are shown in Figure 7.
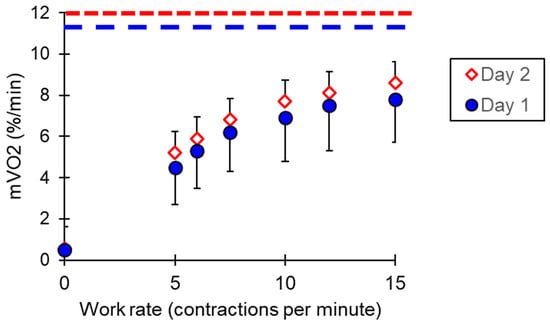
Figure 6.
mVO2 values for the progressive exercise test. The dotted lines represent the calculated mVO2max values for each test day. Values are means and standard deviations.
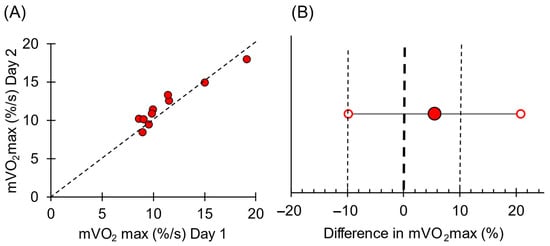
Figure 7.
(A) Individual mVO2 values for day 1 and day 2. The dotted line is the line of identity for reference. (B) Equivalency plot of mVO2max values for the two testing days. Solid circle is the mean difference; open circles are the 95% confidence interval. Bold dotted line represents zero difference between days. The light dotted lines represent a 10% difference between days.
The average percentage of mVO2max produced by walking at 3.2 km/h, 4.8 km/h, and 6.4 km/h, and for lunges is shown in Figure 8A. Average EMG signals are shown in Figure 8B. A total of 16.6 ± 0.8 lunges were completed in 23.4 ± 3.1 s on day 1 and 16.3 ± 1.2 lunges in 21.0 ± 3.1 s on day 2. Lunges showed a high reliability for percentage of mVO2max (ICC = 0.81, CV = 10.2%).
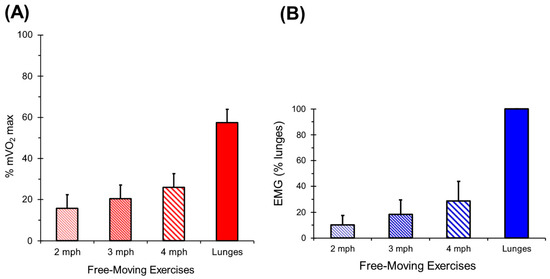
Figure 8.
(A) Values for walking and lunging exercise for mVO2. Values are means and standard deviations. (B) Valu es for walking and lunging exercise for rectified EMG. Values are means and standard deviations.
4. Discussion
This study examined the ability of NIRS to reliably measure muscle oxygen consumption in the vastus lateralis muscle during progressive walking and lunging exercises. Oxygen consumption was measured using the arterial occlusion method [15,30,31]. The uniqueness of our study was making the measurements during free-moving exercise rather than with special leg ergometers [17,32,33,34,35]. We also normalized our oxygen consumption measurements to estimated maximal oxygen consumption values. Much like the way various whole-body exercises can be presented as a percentage of whole-body maximal oxidative capacity (VO2max), we presented our muscle exercise results (walking and lunging) as a percentage of muscle maximal oxidative capacity (mVO2max). This study found the vastus lateralis had relatively low mVO2 values with walking (16–26% of mVO2max). Low mVO2 values during walking were consistent with relatively low EMG levels, indicating low muscle activation. The low EMG activation agreed with previous studies [36,37]. Lunges resulted in greater muscle activation, which produced higher mVO2 values. Our value of 57% of maximal metabolic rate during lunging is consistent with surface EMG data from Kooistra et al., who observed up to 80% muscle activation of the vastus lateralis during knee extensor exercise [38]. The agreement in relative activation levels between our mVO2 values, EMG values, and comparisons with the literature suggest the NIRS approach can successfully measure muscle metabolism during exercise (immediately post exercise).
This study calculated the maximal muscle oxidative metabolism (mVO2max) using a progress exercise protocol to extrapolate a maximal rate of oxygen consumption. The mVO2max values calculated in this study were greater than those reported by Erickson et al. and consistent with testing a younger, more physically active population [32]. This approach was similar to previous studies which used 31P MRS to measure the ratio of Pi/PCr or the calculated concentrations of ADP during progressive exercise [39,40]. NIRS measurements of muscle metabolism have been shown to provide similar metabolic relationships to 31P-MRS measurements [34,41]. The limitation of the 31P-MRS approach is that Pi/PCr ratio is influenced by muscle pH, which is known to decrease at higher work levels. NIRS measurements of muscle metabolism do not appear to have the same sensitivity to changes in muscle pH [42]. A major limitation of the progressive exercise approach to determine mVO2max is that it involves extrapolation from the work levels to determine the maximal values. Estimates of mVO2max using the recovery from exercise approach use interpolation to determine a constant rate [17,32,33,34,35]. In addition, the calculation of mVO2max from a progressive work test assumes the work measured on the ergometer is being performed by the muscle being tested. This assumes there were no significant changes in the work of synergistic muscles during the progressively increasing exercise intensities. An advantage of using the progressive work test approach to measure relative work levels (%mVO2max) is that the mVO2 and mVO2max values are in the same units, making direct comparisons possible.
This study found that the reproducibility of both the VO2max values and the values during exercise were excellent. We found the CV for our mVO2 measurements during exercise to be around ~10%, consistent with the CV reported for exercise using muscle ergometers [21,43]. Our CV for maximal mVO2 determined from recovery tests was consistent with these previous studies [21,44].
This is consistent with previous studies of muscle metabolism and of mitochondrial capacity using NIRS [15,45]. Excellent reproducibility supports the utility of measuring mVO2 during free-standing exercise. A limitation to the measurements of mVO2 during lunges was that the duration of the lunging exercise was short (17–28 s). It is possible that oxidative metabolism was not activated long enough during the lunges to ready steady levels. Thus, the mVO2 measurements during lunges could be an underestimate of the true steady-state oxidative demand for this exercise.
A key aspect of measuring muscle metabolism with the ischemic cuff method was the time between the cessation of exercise and the measurement of mVO2. In this study, the time delay from last muscle contraction to the metabolic measurement was 2.5–3 s. During this time delay, muscle metabolism is expected to be ‘recovering’ towards resting metabolism. Figure 9 shows theoretical curves illustrating this effect for people with higher and lower values of mVO2max. In both higher and lower examples, there would be a change in the metabolic values between 2 and 3% per second immediately post-exercise. With the time delays seen in this study, the actual muscle mVO2 values could be expected to be ~5% higher than the values that were measured. This study did not find significant differences in the delay times between testing days, which contributed to the excellent reproducibility values seen. However, future studies should record the actual time delays and account for potential differences in time delays when making post-exercise measurements of mVO2.
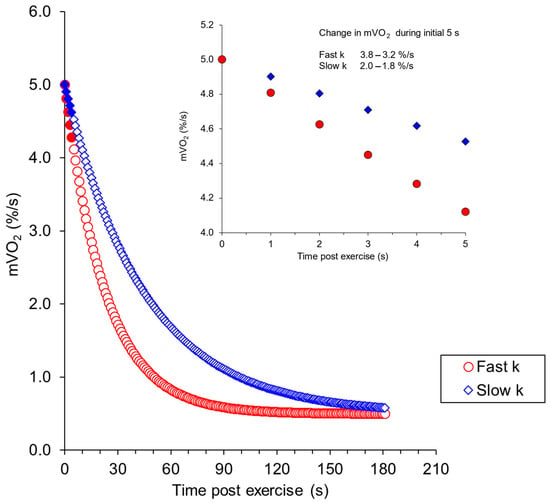
Figure 9.
Calculated values of the recovery of mVO2 starting from a metabolic rate of 5% of the ischemic range per second. The blue symbols are for a muscle with average mitochondrial capacity (rate constant of 1.33/min) and the red symbols for a muscle with higher mitochondrial capacity (2.61%/s). These values are based on previous studies [46]. The inlay shows an expanded view of the initial part of the recovery curve.
A key aspect of the ischemic slope method of measuring muscle metabolism is the presence of adequate oxygen in the muscle. Previous studies have shown that muscle metabolism is impaired when oxygen levels are low [47]. During the progressive exercise test in this study, oxygen levels did fall towards 50% or lower based on the ischemic calibration, similar to previous studies [48]. These levels could approach oxygen levels that were low enough to impair muscle metabolism. In particular, oxygen levels during the lunging exercise were potentially low enough to impair muscle metabolism. Pilotto et al. [47] reported that oxygen levels of approximately 30% of the ischemic range reduced the recovery rate constant to approximately 52% of the value with higher oxygen levels. Thus, muscle metabolism during lunges, while elevated, may have been limited by oxygen delivery. It is not clear how this can be corrected or whether changing the way lunges are performed to increase oxygen levels could increase mVO2 during this type of exercise. Low oxygen levels have been reported during high intensity exercise using NIRS [47].
Our study provides a relatively inexpensive and translatable way to characterize individual muscle metabolic responses to free-moving exercise. The results show that this technique may be suitable for evaluating the effect of varying intensities of exercise on muscle oxidative function, such as those seen in HIIT exercise. Previous studies have measured oxygen saturation levels during free-moving exercise, such as speed skating, walking, and swimming [23,49,50,51]. Hesford et al. [50] show that muscle oxygen levels varied between legs consistent with muscle activation. However, they were not able to present their results relative to maximal muscle activation. The use of an extrapolated mVO2max could allow for a normalized presentation of muscle oxidative capacity that allows comparisons across laboratories and study populations.
A limitation of the NIRS device used in this study is that only a small portion of the muscle of interest can be measured at a time. Thus, when interpreting our results, we assumed that the mVO2 of the superficial muscle fibers measured by the NIRS device is representative of the entire vastus lateralis muscle. Previous studies have reported differences in muscle activation and muscle metabolism within a muscle during exercise [26,52,53]. Future studies will need to evaluate the impact of small variations in the placement of the NIRS probe. However, the good reproducibility of the measurements in this study as well as in other studies [15,45] suggests that small variations in location are a minimal source of variability.
5. Conclusions
In conclusion, this study measured relative muscle metabolism during whole-body exercises using the arterial occlusion approach with the NIRS method to measure oxygen levels. By using a progressive knee extension work test to estimate the mVO2max, muscle metabolism during whole-body exercise was presented as a percentage of maximal muscle metabolism. The results agreed with expected muscle activation levels and showed good reproducibility. Future studies need to account for oxygen levels during the exercises, as well as the time delay between the end of exercise and the start of the NIRS measurements. Overall, the results herein support the use of the arterial occlusion NIRS method as a viable method to measure changes in muscle metabolism during exercise.
Author Contributions
K.K.M. designed the study, provided oversight for data collection, performed data analysis, and wrote the document. S.N.S. recruited research subjects, performed the data collection, performed data analysis, and wrote the document. M.A.R. assisted with data collection, assisted with data analysis, edited the document. T.E.R. provided oversight for data collection, assisted with data analysis, and edited the document. All authors have read and agreed to the published version of the manuscript.
Funding
This research received no external funding.
Institutional Review Board Statement
The study was conducted in accordance with the Declaration of Helsinki, and approved by the Institutional Review Board (or Ethics Committee) of NAME OF INSTITUTE (Modification 00001723 and 7/24/2015) for studies involving humans.
Informed Consent Statement
Informed consent was obtained from all subjects involved in the study.
Data Availability Statement
Dataset available on request from the authors.
Conflicts of Interest
K.M. has a financial interest in InfraredRx, Inc.
References
- Bouchard, C.; Daw, E.W.; Rice, T.; Perusse, L.; Gagnon, J.; Province, M.A.; Leon, A.S.; Rao, D.C.; Skinner, J.S.; Wilmore, J.H. Familial Resemblance for Vo2max in the Sedentary State: The Heritage Family Study. Med. Sci. Sports Exerc. 1998, 30, 252–258. [Google Scholar] [CrossRef] [PubMed]
- Foulds, H.J.; Bredin, S.S.; Charlesworth, S.A.; Ivey, A.C.; Warburton, D.E. Exercise Volume and Intensity: A Dose-Response Relationship with Health Benefits. Eur. J. Appl. Physiol. 2014, 114, 1563–1571. [Google Scholar] [CrossRef] [PubMed]
- Mitchell, T.; Chacko, B.; Ballinger, S.W.; Bailey, S.M.; Zhang, J.; Darley-Usmar, V. Convergent Mechanisms for Dysregulation of Mitochondrial Quality Control in Metabolic Disease: Implications for Mitochondrial Therapeutics. Biochem. Soc. Trans. 2013, 41, 127–133. [Google Scholar] [CrossRef]
- Mitchell, T.; Chacko, B.K.; Darley-Usmar, V. Controlling Radicals in the Powerhouse: Development of Mitosod. Chem. Biol. 2012, 19, 1217–1218. [Google Scholar] [CrossRef][Green Version]
- Zurlo, F.; Larson, K.; Bogardus, C.; Ravussin, E. Skeletal Muscle Metabolism Is a Major Determinant of Resting Energy Expenditure. J. Clin. Investig. 1990, 86, 1423–1427. [Google Scholar] [CrossRef]
- Boutcher, S.H. High-Intensity Intermittent Exercise and Fat Loss. J. Obes. 2011, 2011, 868305. [Google Scholar] [CrossRef]
- Bergstrom, J. Percutaneous Needle Biopsy of Skeletal Muscle in Physiological and Clinical Research. Scand. J. Clin. Lab. Investig. 1975, 35, 609–616. [Google Scholar] [CrossRef]
- Gollnick, P.D.; Armstrong, R.B.; Saubert, C.W., 4th; Piehl, K.; Saltin, B. Enzyme Activity and Fiber Composition in Skeletal Muscle of Untrained and Trained Men. J. Appl. Physiol. 1972, 33, 312–319. [Google Scholar] [CrossRef] [PubMed]
- Holloszy, J.O.; Booth, F.W. Biochemical Adaptations to Endurance Exercise in Muscle. Annu. Rev. Physiol. 1976, 38, 273–291. [Google Scholar] [CrossRef]
- Befroy, D.E.; Falk Petersen, K.; Rothman, D.L.; Shulman, G.I. Assessment of in Vivo Mitochondrial Metabolism by Magnetic Resonance Spectroscopy. Methods Enzym. 2009, 457, 373–393. [Google Scholar]
- Dawson, M.; Gadian, D.; Wilkie, D. Muscular Fatigue Investigated by Phosphorus Nuclear Magnetic Resonance. Nature 1978, 274, 861–866. [Google Scholar] [CrossRef] [PubMed]
- McCully, K.K.; Boden, B.P.; Tuchler, M.; Fountain, M.R.; Chance, B. Wrist Flexor Muscles of Elite Rowers Measured with Magnetic Resonance Spectroscopy. J. Appl. Physiol. 1989, 67, 926–932. [Google Scholar] [CrossRef] [PubMed]
- Barstow, T.J. Corp: Understanding near Infrared Spectroscopy (Nirs) and Its Application to Skeletal Muscle Research. J. Appl. Physiol. 2019, 126, 1360–1376. [Google Scholar] [CrossRef] [PubMed]
- Hamaoka, T.; McCully, K.K. Review of Early Development of near-Infrared Spectroscopy and Recent Advancement of Studies on Muscle Oxygenation and Oxidative Metabolism. J. Physiol. Sci. 2019, 69, 799–811. [Google Scholar] [CrossRef]
- Lucero, A.A.; Addae, G.; Lawrence, W.; Neway, B.; Credeur, D.P.; Faulkner, J.; Rowlands, D.; Stoner, L. Reliability of Muscle Blood Flow and Oxygen Consumption Response from Exercise Using near-Infrared Spectroscopy. Exp. Physiol. 2018, 103, 90–100. [Google Scholar] [CrossRef]
- Hampson, N.; Piantadosi, C. Near Infrared Monitoring of Human Skeletal Muscle Oxygenation during Forearm Ischemia. J. Appl. Physiol. 1988, 64, 2449–2457. [Google Scholar] [CrossRef]
- DeBlasi, R.; Ferrari, M.; Natali, A.; Conti, G.; Mega, A.; Gasparetto, A. Noninvasive Measurement of Forearm Blood Flow and Oxygen Consumption by near-Infrared Spectroscopy. J. Appl. Physiol. 1994, 76, 1388–1393. [Google Scholar] [CrossRef]
- van Beekvelt, M.C.; Borghuis, M.S.; van Engelen, B.G.; Wevers, R.A.; Colier, W.N. Adipose Tissue Thickness Affects in Vivo Quantitative near-Ir Spectroscopy in Human Skeletal Muscle. Clin. Sci. 2001, 101, 21–28. [Google Scholar] [CrossRef]
- Nagasawa, T.; Hamaoka, T.; Sako, T.; Murakami, M.; Kime, R.; Homma, T.; Ueda, C.; Ichimura, S.; Katsumura, T. A Practical Indicator of Muscle Oxidative Capacity Determined by Recovery of Muscle O 2 Consumption Using Nir Spectroscopy. Eur. J. Sport Sci. 2003, 3, 1–10. [Google Scholar] [CrossRef]
- Motobe, M.; Murase, N.; Osada, T.; Homma, T.; Ueda, C.; Nagasawa, T.; Kitahara, A.; Ichimura, S.; Kurosawa, Y.; Katsumura, T.; et al. Noninvasive Monitoring of Deterioration in Skeletal Muscle Function with Forearm Cast Immobilization and the Prevention of Deterioration. Dyn. Med. 2004, 3, 2. [Google Scholar] [CrossRef]
- Southern, W.M.; Ryan, T.E.; Reynolds, M.A.; McCully, K. Reproducibility of near-Infrared Spectroscopy Measurements of Oxidative Function and Postexercise Recovery Kinetics in the Medial Gastrocnemius Muscle. Appl. Physiol. Nutr. Metab. 2014, 39, 521–529. [Google Scholar] [CrossRef] [PubMed]
- Zhang, C.; Hodges, B.; McCully, K.M. Reliability and Reproducibility of a Four Arterial Occlusions Protocol for Assessing Muscle Oxidative Metabolism at Rest and after Exercise Using near-Infrared Spectroscopy. Physiol. Meas. 2020, 41, 065002. [Google Scholar] [CrossRef] [PubMed]
- Hesford, C.M.; Laing, S.J.; Cardinale, M.; Cooper, C.E. Asymmetry of Quadriceps Muscle Oxygenation during Elite Short-Track Speed Skating. Med. Sci. Sports Exerc. 2012, 44, 501–508. [Google Scholar] [CrossRef]
- Ryan, T.E.; Erickson, M.L.; Brizendine, J.T.; Young, H.J.; McCully, K.K. Noninvasive Evaluation of Skeletal Muscle Mitochondrial Capacity with near-Infrared Spectroscopy: Correcting for Blood Volume Changes. J. Appl. Physiol. 2012, 113, 175–183. [Google Scholar] [CrossRef]
- Jobsis, F.F. Noninvasive, Infrared Monitoring of Cerebral and Myocardial Oxygen Sufficiency and Circulatory Parameters. Science 1977, 198, 1264–1267. [Google Scholar] [CrossRef]
- Miura, H.; McCully, K.; Hong, L.; Nioka, S.; Chance, B. Regional Difference of Muscle Oxygen Saturation and Blood Volume during Exercise Determined by near Infrared Imaging Device. Jpn. J. Physiol. 2001, 51, 599–606. [Google Scholar] [CrossRef] [PubMed]
- Wolf, U.; Wolf, M.; Choi, J.H.; Levi, M.; Choudhury, D.; Hull, S.; Coussirat, D.; Paunescu, L.A.; Safonova, L.P.; Michalos, A.; et al. Localized Irregularities in Hemoglobin Flow and Oxygenation in Calf Muscle in Patients with Peripheral Vascular Disease Detected with Near-Infrared Spectrophotometry. J. Vasc. Surg. 2003, 37, 1017–1026. [Google Scholar] [CrossRef]
- Nelson, D.L.C.; Lehninger, M.M. Principals of Biochemistry; W.H. Freeman & Co.: New York, NY, USA, 2009. [Google Scholar]
- Lakens, D. Equivalence Tests: A Practical Primer for T Tests, Correlations, and Meta-Analyses. Soc. Psychol. Personal. Sci. 2017, 8, 355–362. [Google Scholar] [CrossRef]
- Jones, S.; D’Silva, A.; Bhuva, A.; Lloyd, G.; Manisty, C.; Moon, J.C.; Sharma, S.; Hughes, A.D. Improved Exercise-Related Skeletal Muscle Oxygen Consumption Following Uptake of Endurance Training Measured Using near-Infrared Spectroscopy. Front. Physiol. 2017, 8, 1018. [Google Scholar] [CrossRef]
- Rogers, E.M.; Banks, N.F.; Jenkins, N.D.M. Metabolic and Microvascular Function Assessed Using near-Infrared Spectroscopy with Vascular Occlusion in Women: Age Differences and Reliability. Exp. Physiol. 2023, 108, 123–134. [Google Scholar] [CrossRef]
- Erickson, M.L.; Ryan, T.E.; Young, H.J.; McCully, K.K. Near-Infrared Assessments of Skeletal Muscle Oxidative Capacity in Persons with Spinal Cord Injury. Eur. J. Appl. Physiol. 2013, 113, 2275–2283. [Google Scholar] [CrossRef] [PubMed]
- Ryan, T.E.; Southern, W.M.; Reynolds, M.A.; McCully, K.K. A Cross-Validation of near-Infrared Spectroscopy Measurements of Skeletal Muscle Oxidative Capacity with Phosphorus Magnetic Resonance Spectroscopy. J. Appl. Physiol. 2013, 115, 1757–1766. [Google Scholar] [CrossRef] [PubMed]
- Hamaoka, T.; Iwane, H.; Shimomitsu, T.; Katsumura, T.; Murase, N.; Nishio, S.; Osada, T.; Kurosawa, Y.; Chance, B. Noninvasive Measures of Oxidative Metabolism on Working Human Muscles by near-Infrared Spectroscopy. J. Appl. Physiol. 1996, 81, 1410–1417. [Google Scholar] [CrossRef]
- Binzoni, T.; Cooper, C.E.; Wittekind, A.L.; Beneke, R.; Elwell, C.E.; Van De Ville, D.; Leung, T.S. A New Method to Measure Local Oxygen Consumption in Human Skeletal Muscle during Dynamic Exercise Using Near-Infrared Spectroscopy. Physiol. Meas. 2010, 31, 1257–1269. [Google Scholar] [CrossRef][Green Version]
- McCully, K.K.; Turner, T.N.; Langley, J.; Zhao, Q. The Reproducibility of Measurements of Intramuscular Magnesium Concentrations and Muscle Oxidative Capacity Using 31p Mrs. Dyn. Med. 2009, 8, 5. [Google Scholar] [CrossRef]
- Ericson, M.O.; Bratt, A.; Nisell, R.; Arborelius, U.P.; Ekholm, J. Power Output and Work in Different Muscle Groups during Ergometer Cycling. Eur. J. Appl. Physiol. Occup. Physiol. 1986, 55, 229–235. [Google Scholar] [CrossRef]
- Kooistra, R.D.; Blaauboer, M.E.; Born, J.R.; de Ruiter, C.J.; de Haan, A. Knee Extensor Muscle Oxygen Consumption in Relation to Muscle Activation. Eur. J. Appl. Physiol. 2006, 98, 535–545. [Google Scholar] [CrossRef] [PubMed][Green Version]
- Chance, B.; Leigh, J.; Kent, J.; McCully, K.; Nioka, S.; Clark, B.; Maris, J.; Graham, T. Multiple Controls of Oxidative Metabolism of Living Tissues as Studied by 31-P Mrs. Proc. Natl. Acad. Sci. USA 1986, 83, 9458–9462. [Google Scholar] [CrossRef]
- McCully, K.K.; Vandenborne, K.; DeMeirleir, K.; Posner, J.D.; Leigh, J.S., Jr. Muscle Metabolism in Track Athletes, Using 31p Magnetic Resonance Spectroscopy. Can. J. Physiol. Pharmacol. 1992, 70, 1353. [Google Scholar] [CrossRef]
- Meyer, R.A. A Linear Model of Muscle Respiration Explains Monoexponential Phosphocreatine Changes. Am. J. Physiol. 1988, 254, C548–C553. [Google Scholar] [CrossRef]
- McCully, K.K.; Iotti, S.; Kendrick, K.; Wang, Z.; Posner, J.D.; Leigh, J., Jr.; Chance, B. Simultaneous In Vivo Measurements of Hbo2 Saturation and Pcr Kinetics after Exercise in Normal Humans. J. Appl. Physiol. 1994, 77, 5–10. [Google Scholar] [CrossRef] [PubMed]
- Sako, T.; Hamaoka, T.; Higuchi, H.; Kurosawa, Y.; Katsumura, T. Validity of Nir Spectroscopy for Quantitatively Measuring Muscle Oxidative Metabolic Rate in Exercise. J. Appl. Physiol. 2001, 90, 338–344. [Google Scholar] [CrossRef] [PubMed]
- Ryan, T.E.; Brizendine, J.T.; McCully, K.K. A Comparison of Exercise Type and Intensity on the Noninvasive Assessment of Skeletal Muscle Mitochondrial Function Using near-Infrared Spectroscopy. J. Appl. Physiol. 2013, 114, 230–237. [Google Scholar] [CrossRef]
- Biddulph, B.; Morris, J.G.; Lewis, M.; Hunter, K.; Sunderland, C. Reliability of near-Infrared Spectroscopy with and without Compression Tights during Exercise and Recovery Activities. Sports 2023, 11, 23. [Google Scholar] [CrossRef]
- Brizendine, J.T.; Ryan, T.E.; Larson, R.D.; McCully, K.K. Skeletal Muscle Metabolism in Endurance Athletes with near-Infrared Spectroscopy. Med. Sci. Sports Exerc. 2013, 45, 869–875. [Google Scholar] [CrossRef]
- Pilotto, A.M.; Adami, A.; Mazzolari, R.; Brocca, L.; Crea, E.; Zuccarelli, L.; Pellegrino, M.A.; Bottinelli, R.; Grassi, B.; Rossiter, H.B.; et al. Near-Infrared Spectroscopy Estimation of Combined Skeletal Muscle Oxidative Capacity and O2 Diffusion Capacity in Humans. J. Physiol. 2022, 600, 4153–4168. [Google Scholar] [CrossRef] [PubMed]
- Esaki, K.; Hamaoka, T.; Radegran, G.; Boushel, R.; Hansen, J.; Katsumura, T.; Haga, S.; Mizuno, M. Association between Regional Quadriceps Oxygenation and Blood Oxygen Saturation during Normoxic One-Legged Dynamic Knee Extension. Eur. J. Appl. Physiol. 2005, 95, 361–370. [Google Scholar] [CrossRef]
- Bennincasa, M.T.; Serra, E.; Albano, D.; Vastola, R. Comparing Muscle Oxygen Saturation Patterns in Swimmers of Different Competitive Levels. J. Phys. Educ. Sport. 2024, 24, 1920–1926. [Google Scholar]
- Hesford, C.; Cardinale, M.; Laing, S.; Cooper, C.E. Nirs Measurements with Elite Speed Skaters: Comparison between the Ice Rink and the Laboratory. Adv. Exp. Med. Biol. 2013, 765, 81–86. [Google Scholar]
- Hiroyuki, H.; Hamaoka, T.; Sako, T.; Nishio, S.; Kime, R.; Murakami, M.; Katsumura, T. Oxygenation in Vastus Lateralis and Lateral Head of Gastrocnemius during Treadmill Walking and Running in Humans. Eur. J. Appl. Physiol. 2002, 87, 343–349. [Google Scholar] [CrossRef]
- Koga, S.; Poole, D.C.; Ferreira, L.F.; Whipp, B.J.; Kondo, N.; Saitoh, T.; Ohmae, E.; Barstow, T.J. Spatial Heterogeneity of Quadriceps Muscle Deoxygenation Kinetics during Cycle Exercise. J. Appl. Physiol. 2007, 103, 2049–2056. [Google Scholar] [CrossRef] [PubMed]
- Quaresima, V.; Colier, W.N.; van der Sluijs, M.; Ferrari, M. Nonuniform Quadriceps O2 Consumption Revealed by near Infrared Multipoint Measurements. Biochem. Biophys. Res. Commun. 2001, 285, 1034–1039. [Google Scholar] [CrossRef] [PubMed]
Disclaimer/Publisher’s Note: The statements, opinions and data contained in all publications are solely those of the individual author(s) and contributor(s) and not of MDPI and/or the editor(s). MDPI and/or the editor(s) disclaim responsibility for any injury to people or property resulting from any ideas, methods, instructions or products referred to in the content. |
© 2024 by the authors. Licensee MDPI, Basel, Switzerland. This article is an open access article distributed under the terms and conditions of the Creative Commons Attribution (CC BY) license (https://creativecommons.org/licenses/by/4.0/).