Abstract
This study aims to provide the dairy industry with a direct control model focused on milk coagulation by using multifiber probes to determine parameters in the curding process, such as cutting time, at a lower cost. The main objective of the research is to confirm that a multifiber NIR light scattering probe can be used to predict the elastic modulus of curd during milk coagulation in cheese production. Two randomized complete block designs were used with a 3 × 3 factorial arrangement of three protein levels (3%, 3.5% and 4%) and three wavelengths (870 nm, 880 nm and 890 nm). Using a multifiber probe at a wavelength of 880 nm allowed obtaining a better optical response of the sensor during enzymatic milk coagulation than the 870 nm. It showed greater sensitivity to variations in the protein content of the milk and lower variation in the response. The multifiber probe at a wavelength of 880 nm generated a NIR light backscatter profile like those obtained with other systems. The results showed that the prediction model parameters had a variation as a function of the protein content, which opens the possibility of improving the prediction model’s performance substantially. Furthermore, the initial voltage obtained with the probe responded linearly to the different protein levels in milk. This fact would make it possible, at least theoretically, to estimate protein concentration with the same inline probe for G’ determination, facilitating the incorporation of a corrective protein factor in the prediction models using a single instrument.
1. Introduction
Cheese production was approximately 21.86 million metric tons worldwide, while the USA manufactured over 6 million tons, in 2021 [1]. Cheese is a dairy product that has played an important role in human nutrition for centuries. Since then, the main objective has been and is today to transform a highly perishable product, such as milk, into another that has a long life and preserves its nutrients. In essence, cheese is made by removing water or whey, allowing the solids or curds to be controlled. Cheese is a healthy and diverse dairy product regularly consumed as part of a dish, as a snack, or as a premade meal. Cheese-making is a process in which the fat and casein of milk are concentrated in five steps: acidification, coagulation, whey separation, molding, and salting [2,3]. Several parameters impact the transformation of milk into cheese, and the knowledge of such factors could represent a competitive advantage for the cheesemaker. The chemical composition of the milk plays a crucial role in cheese manufacture due to the complex biochemistry and microbiology involved [4]. Cheesemaking technology permits the production of various flavors, textures, and consistencies [5], which involves the meticulous monitorization of the curd cutting time.
Cheesemaking can be considered a sensitive process. Once the gelation point is reached, the curd’s hardness increases with time. Therefore, selecting the optimal hardness moment for the cut is necessary, which induces the drainage process [6]. The cut should be performed when the curd is sufficiently cohesive but has not reached excessive hardening [7]. The changes in the optical properties of milk during coagulation have allowed, primarily using optical fibers, the development of a series of instruments based on determinations of reflection, absorbance, dispersion, and refraction of light [8]. These are continuous and non-destructive methods. Among the properties mentioned, light scattering is one of the properties that yields the best results for the study of gel formation. In a non-absorbing medium, it is possible to directly measure the portion of incident light that is dispersed at a certain angle or indirectly measure the portion of the light that has not interacted with the medium, that is, the transmitted light [9]. In milk, near-infrared light scattering is directly related to the speed of micellar aggregation and gel hardening, so this optical sensor technology has been proven as a valuable tool to control milk coagulation [10]. In particular, the fiber optic sensor near-infrared (NIR) scattering, CoAguLite, is an inline sensor that has been well-documented for monitoring milk coagulation and predicting gelation and cutting times [11] and is currently commercially available for inline control in cheesemaking, mainly in the United States. Several previous studies have shown that such a sensor is a promising instrument for inline monitoring of optical properties during milk coagulation, providing indirect information on relevant technological parameters in cheese production. Arango et al. (2018b) [12] obtained and validated curd cutting time prediction models using optical time parameters determined by calculating derivatives from the dispersion ratio profile as a function of time. Similarly, Salvador et al. (2019) [13] found that the optical light scattering sensor predicts well the time the gel reaches values of G’ = 30 Pa.
On the other hand, Arango and Castillo (2018a) [10] developed and patented a method for real-time monitoring of gel firmness, which consists of a mathematical model that relates the NIR scattering signal obtained through the sensor optical fiber with the elastic modulus of the gel. This method does not involve time parameters and, therefore, allows the collected light scattering ratio data to be introduced directly into the model to calculate the value of G’ in real time [14].
The curd cutting time is a critical aspect that impacts the quality characteristics of cheese [15]. Cutting time can significantly affect cheese yield, and the curd can change fat, whey, and moisture contents. A high-moisture curd results from cutting the curd too late, and a poor yield could be caused by cutting the curd too early. The curd cutting time is typically monitored by instruments based on mechanical approaches, vibrational techniques, ultrasonic methods, electrical conductivity, hot wiring, and optical systems [16]. These apparatuses are used to examine the rheological characteristics of the curd. The curd cutting time could demand a more effective, inline, and non-destructive method.
The light backscatter sensor could be a possible option, and these optical systems have been suggested by various studies [17] since these systems are non-destructive, rapid, and effective. Optical technology developed by Payne et al. (1999) [18] was designed for cow milk cheese production, and Castillo (2000) [2] and Nicolau et al. (2015) [19] evaluated and adapted NIR (near-infrared) light backscatter technology, respectively, for goat and sheep milk cheese manufacture. Thus, developing an optical sensor is required in spray-dried milk cheese. When predicting the cutting time, the NIR practicality of cow’s, goat’s or sheep’s milk cheese could vary from spray-dried milk cheese. Therefore, the objective of this study was to consider if an inline fiber optic sensor with NIR could be applied to monitor the cutting time of curd hardness milk cheese produced by spray-dried milk. The study represents an innovative approach for the dairy industry to monitor milk coagulation in cheese production, as it uses multifiber probes and specific wavelengths to predict curd elasticity during milk coagulation, optimizing the process economically. The study employed randomized block designs and varying protein levels and wavelengths, with 880 nm showing superior sensitivity and stability in response.
2. Materials and Methods
2.1. Milk Preparation and Coagulation
The milk coagulation was prepared and performed according to Nicolau et al. (2015) [19], with slight modifications. Liquid milk was produced by mixing spray-dried, skim milk powder (Arla Foods company, Madrid, Spain) with distilled water at ~1:9 ratio, with small variation according to mass balance in order to achieve the target protein concentrations described in Section 2.2. The obtained milk was then vat-pasteurized at 65 °C for 30 min, and, after pasteurization, refrigerated at 4 °C until further use. For each sample, 500 mL of milk was collected and heated to 35 °C, and a calcium chloride solution (100 μL kg−1) (35%, Laboratorios Arroyo, S.A. 39011, Santander, Spain) was incorporated. The rennet solution (300 μL kg−1) (Chr. Hansen, Barcelona, Spain) (100% chymosin; CHY-MAXs EXTRA, 600 IMCU mL−1) was then incorporated and blended vigorously into the milk solution at the indicated amount after thermal equilibrium was reached. Later, the milk samples were divided into two aliquots for the optical (80 mL) and visual cutting time (remaining milk) analyses. Chemical composition (protein, moisture, ash, fat, and lactose content) of the skimmed milk powder was determined and examined according to AOAC International (2005) [20] (Table 1).

Table 1.
Chemical composition of Arla skimmed milk powder (g per 100 g).
2.2. Experimental Design
It is currently possible to monitor milk’s enzymatic coagulation using NIR light scattering optical fibers. However, their configuration is relatively expensive. Therefore, the objective of this work was to evaluate a low-cost multifiber probe for the optic determination of the elastic modulus of the gel (G’) during cheesemaking, using the prediction model proposed by Arango and Castillo (2018a) [10] on spray-dried milk. The study employed randomized block designs, and varying protein levels and wavelengths, with 880 nm showing superior sensitivity and stability in response. Before proceeding to the light scattering determinations, an experimental design in light transmission configuration was used and established to determine the impact of the cuvette wall NIR reflectance on the light backscatter measurements. Firstly, a factorial experiment (2 × 3 × 3) was selected as a first approach to examine the optical response in milk (3.5% protein using three different wavelengths of 780 nm, 880 nm, and 980 nm at IT of 100, 500, and 1000 ms under the two light conditions (presence and absence of halogen light). Any increase in the detected transmitted light, would suggest that light from the halogen source was able to reach the wall of the cell, increasing potential reflection interference when measuring light scatter. Secondly, another factorial experiment (2 × 2 × 3) was fixed and used to study the optical parameters in water and air using three different wavelengths of 780, 880, and 980 nm at 500 ms under two light conditions (presence and absence of halogen light). Here, part of the light travelling through the media (water or air) was expected to reach the detector. This ensures that absence of light detection when milk (3.5% protein) is used, rather than water or air, is due to absorption or scatter of light by the media, that prevent emitted light from reaching the cell wall in front of the light source. Once the cuvette wall reflectance was excluded, five integration times (IT) (100 ms, 150 ms, 200 ms, 500 ms, and 1000 ms) were tested and examined at 880 nm to select an adequate IT for the multifiber probe. The first evaluation of the multifiber probe for monitoring milk coagulation (3.5% protein) was performed and studied using three different wavelengths of 870, 880, and 890 nm at an IT of 150 ms. The preliminary evaluation of the multifiber probe performance for monitoring milk coagulation was accomplished using three concentrations of milk protein (3%, 3.5%, and 4%) at 880 nm and 150 ms to confirm that light backscatter profile during coagulation was as expected. Thus, two randomized complete block designs were used with a 3 × 3 factorial arrangement of three protein levels (3%, 3.5%, and 4%) and three wavelengths (870 nm, 880 nm, and 890 nm).
2.3. Temperature Control
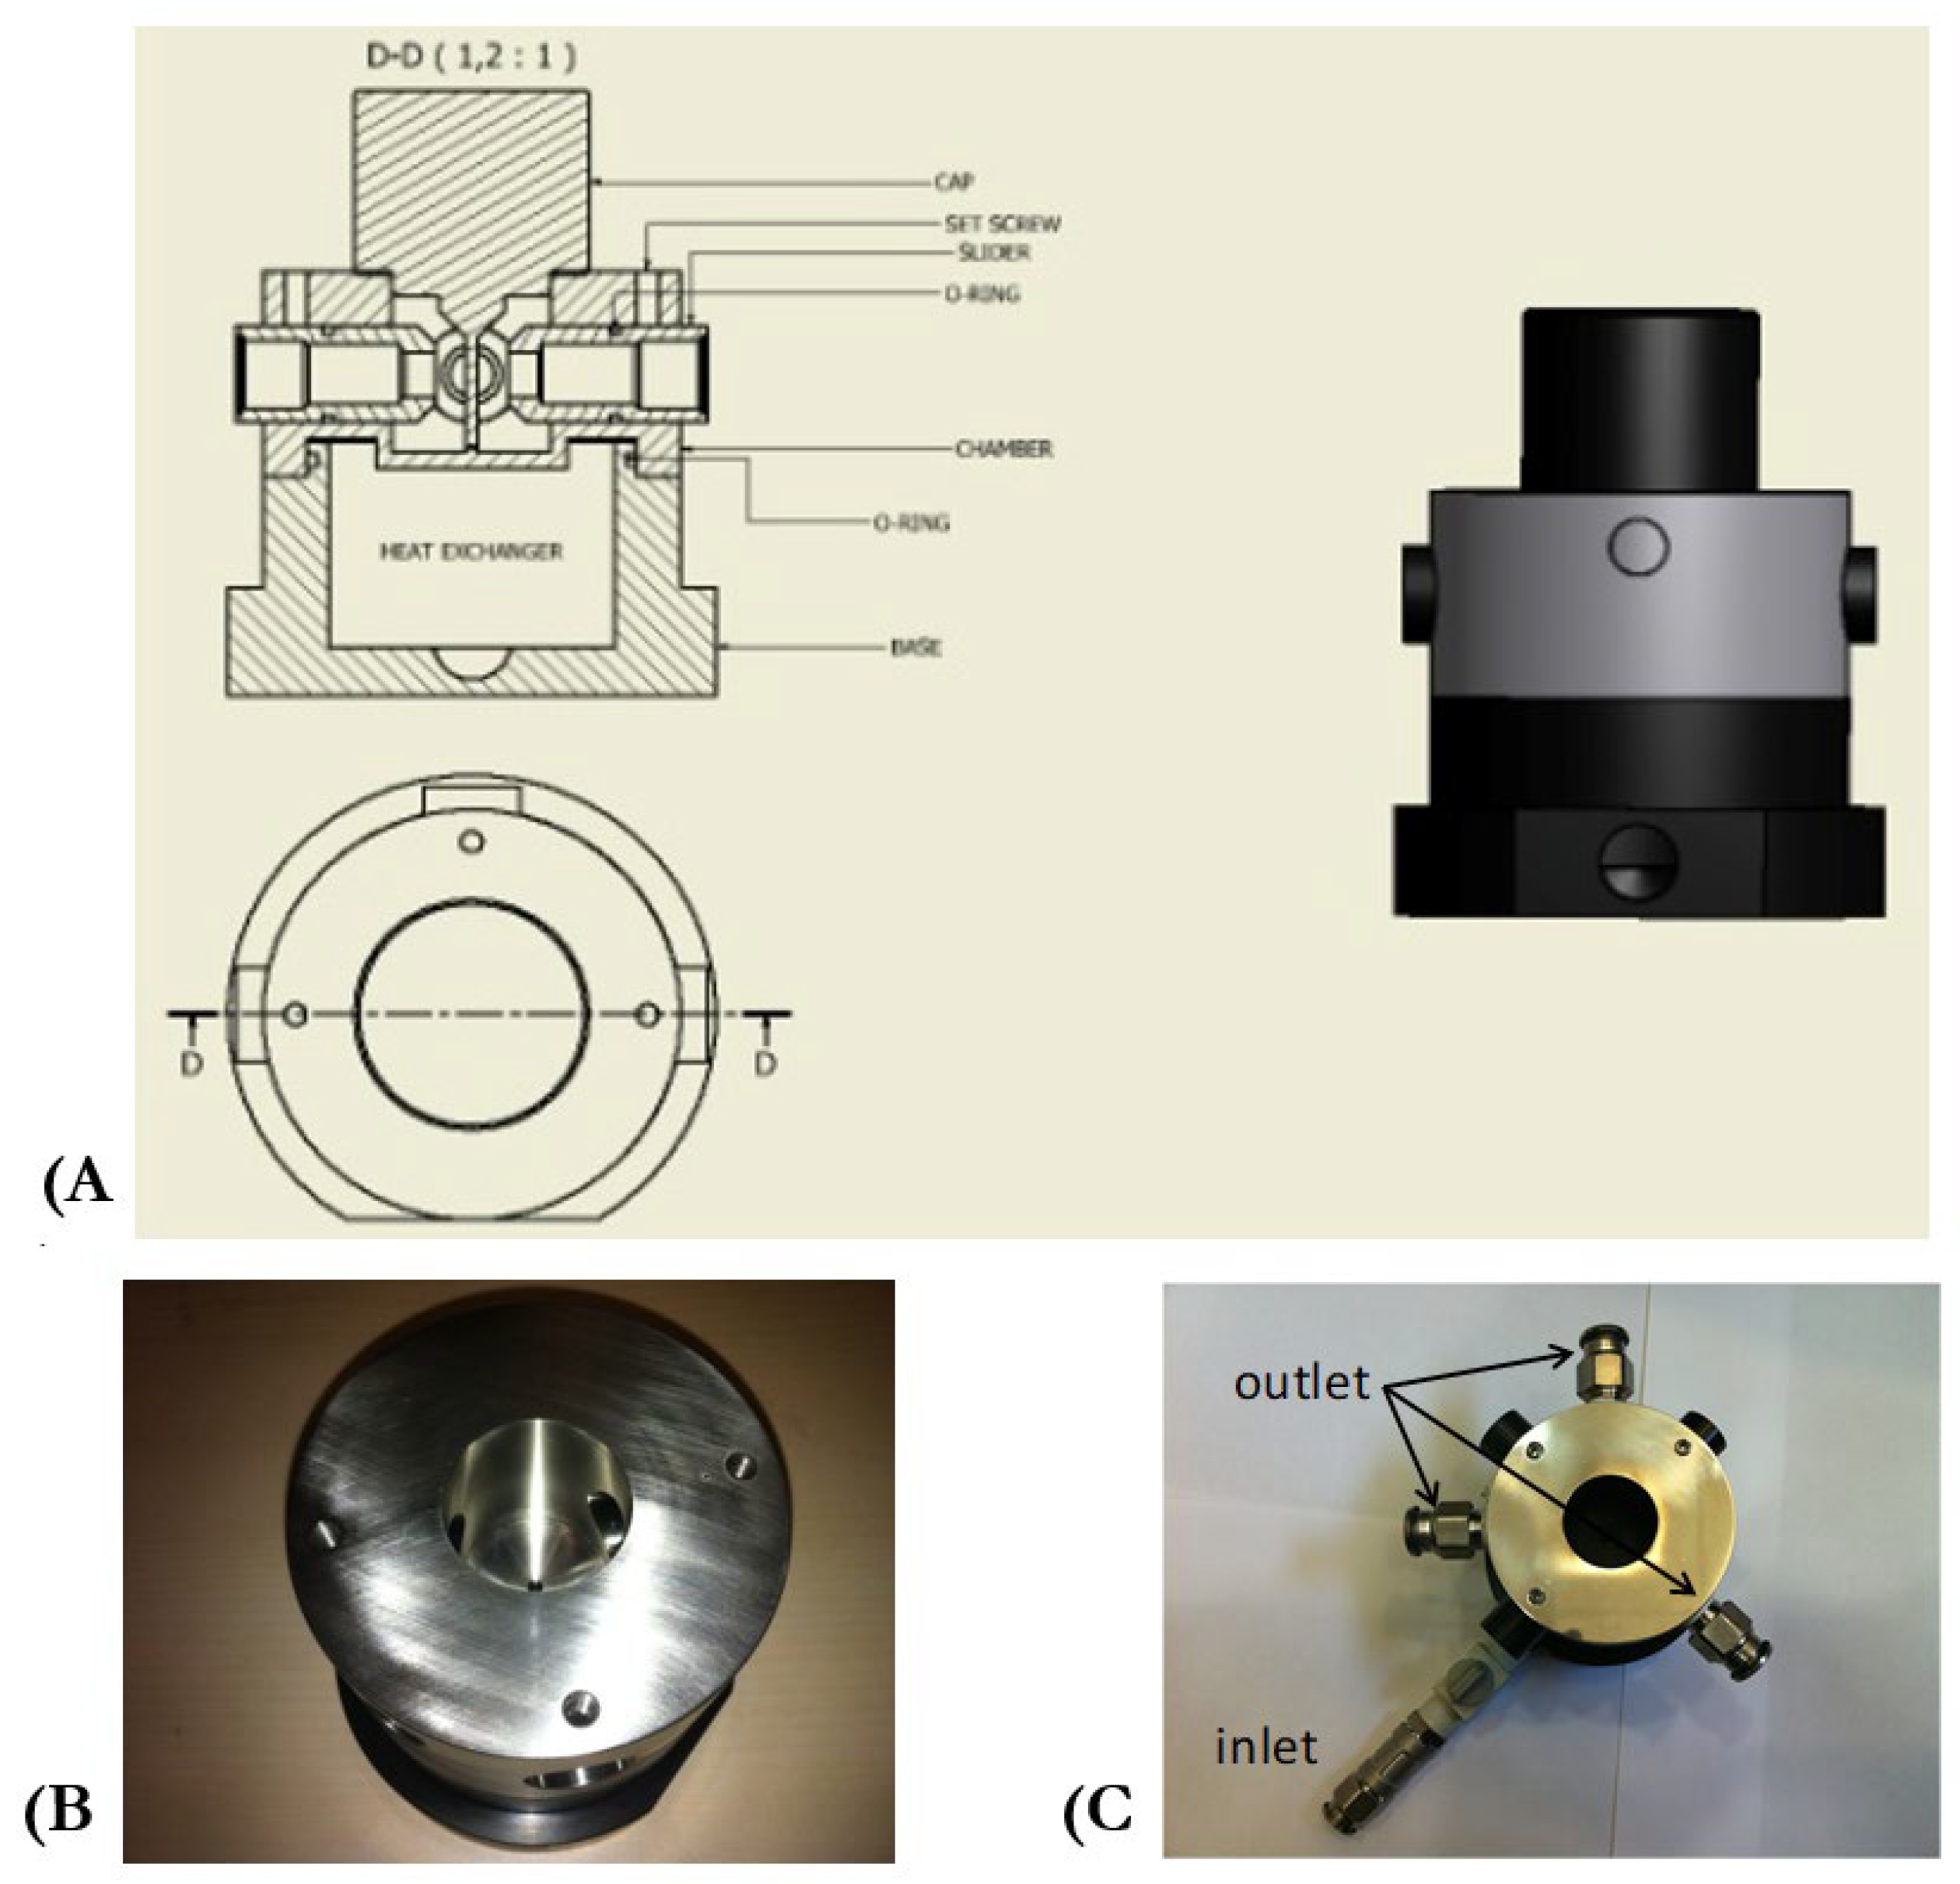
A NIR light backscatter measurement sample cell (Figure 1) consisting of a 20-mL space with a 28.96 mm diameter, equipped with a double jacked for water circulation (lateral walls and bottom) to control temperature was used in this experiment. The sample cell was designed and built at Autonomous University of Barcelona (Barcelona, Spain). The materials used for the manufacturing of the cell were AISI 316L stainless steel (sample cell space), suitable for use in contact with food (milk in this case) and delrin high density polymer (structural base of the stainless-steel measuring cell). The design allowed a large area of contact with the heated water; and the materials were selected to achieve high heat transmission efficiency using one water inlet and three outlets. A Nerinox oxidation treatment was used inside of the sample cell in order to obtain an intense matte black tone which would minimize any measurement error as a result of light reflection. To fit the pieces of the sampling cell together, stainless steel screws and viton seals were used.
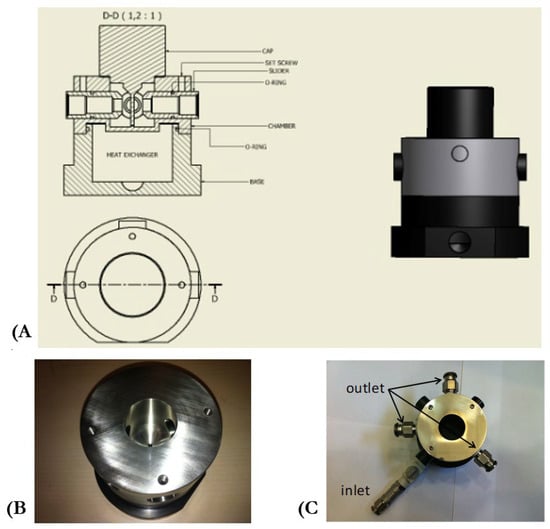
Figure 1.
(A) Sampling cell with increased heat transfer with water circulation around the sample cell walls as well as the bottom. (B) Stainless steel sample cell before treatment. (C) Sample cell after Nerinox oxidation treatment for decreased light wall reflection.
The sampling cell was assembled with optical components, as described in Section 2.4, and connected to a water bath (Cubeta Inox 27L, OVAN, Suministros Grupo Esper, S.L, USA 2011) having a temperature management accurateness of ±0.01 °C. The water bath was connected to the sample cell in order for water to flow from the bottom of the stainless steel part to the top, coming in contact with not only the bottom, but the sides of the sample cell. The temperature was verified by using a portable thermometer (RTD THERMO METER, HD 2127.2, Delta OHM, S.R.L, Italy). The water bath was furthermore utilized to hold the temperature of the milk for visual measurements of the cutting time.
2.4. Monitoring Light Backscatter Profiles
Milk coagulation was monitored coupling the temperature-controlled sample cell described above to a multifiber probe (¼ diameter QR400-7-Vis-BX, Ocean Optics, Inc., Dunedin, FL, USA) (Figure 2), a fiber optic miniature spectrotometer (Model HR4000; Ocean Optics, Inc.), and an halogen light source (LS-1; Ocean Optics, Inc.).
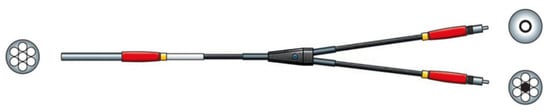
Figure 2.
Multichannel fiber optic with six illumination fiber optics and one detection optic fiber (Photo obtained from Ocean Insight: https://www.oceaninsight.com/products/fibers-and-probes/probes/reflectionbackscatter-probes/qr400-7-vis-bx/?qty=1, accessed on 24 September 2023).
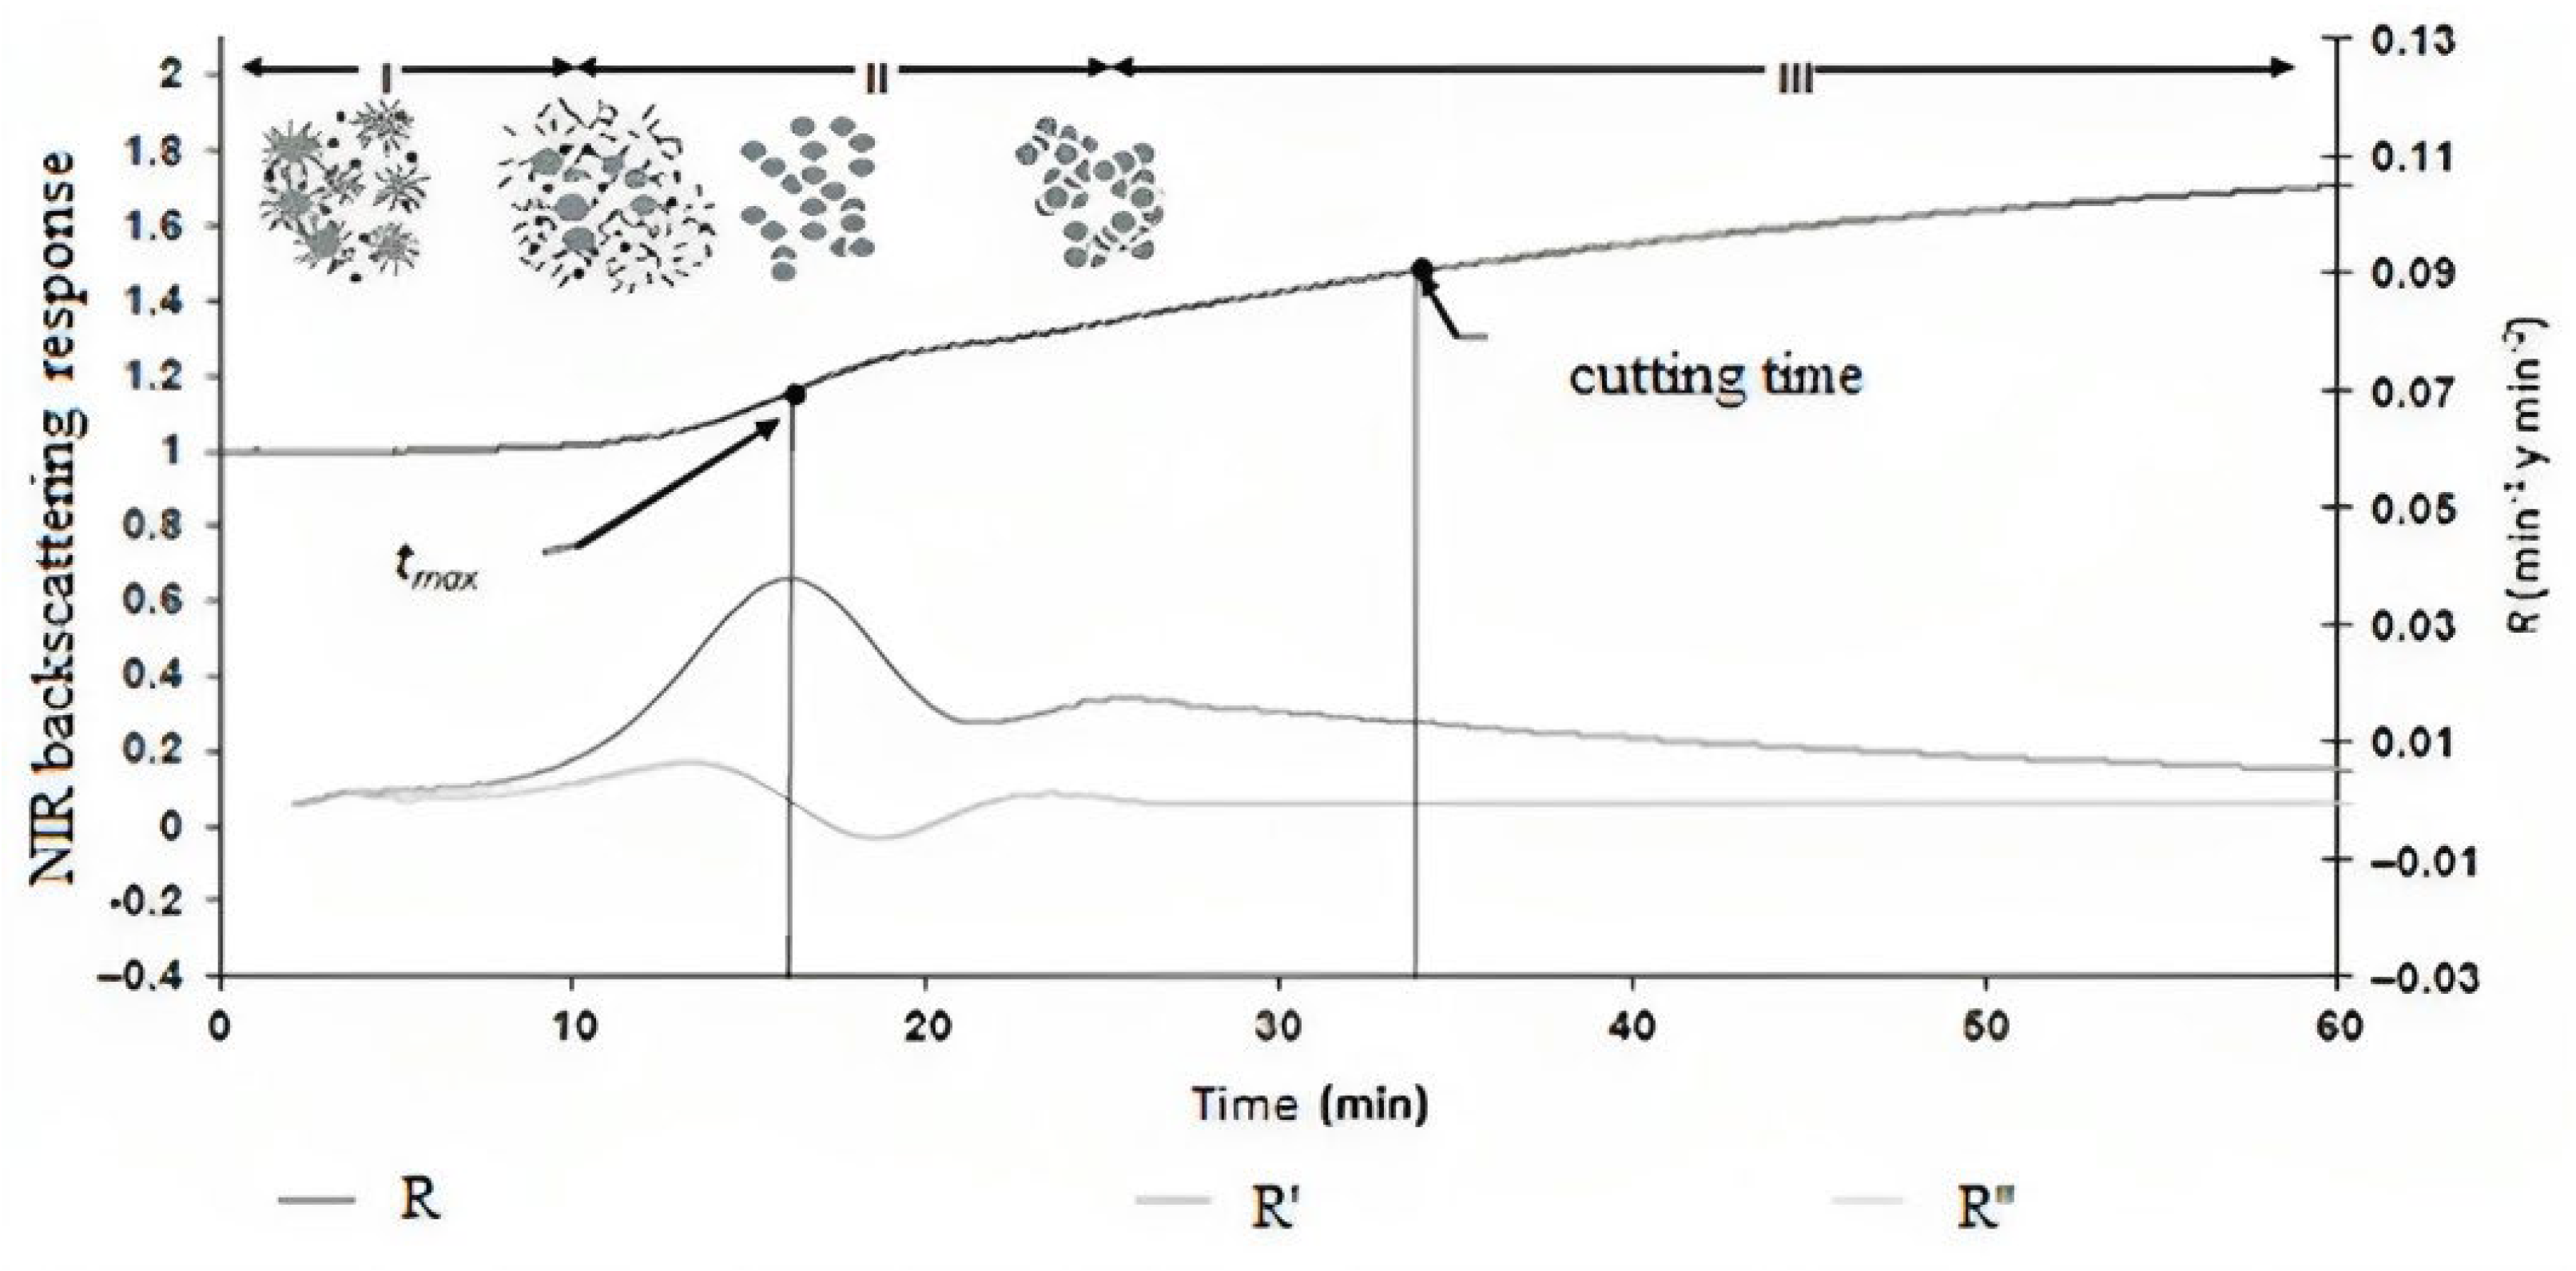
The optical parameters were determined, from the light intensity signal (bits) obtained using the spectrometer and examined similarly to Arango et al. (2018b) [12] (Figure 3) using Excel: the time passed from enzyme addition to the first maximum of the first derivative (min) (tmax), time from the enzyme addition to the first minimum of the second derivative (min) (t2min), the value of the light scattering ratio (R) at time tmax (Rmax), the value of the first derivative of R at time tmax (R1max), the value of the second derivative of R at time t2min (R2min), and the spectral data was collected using OceanView 1.65 software (Ocean Optics, Inc., Dunedin, FL, USA).
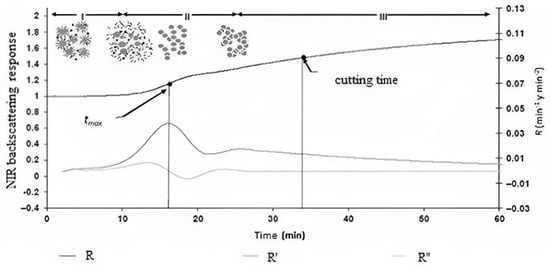
Figure 3.
Profile of the light scattering ratio with its first and second derivatives as a function of time. (I) latency period, (II) sigmoidal period, (III) asymptotic period. The light scattering ratio = R, the first derivative of R = R’, the second derivative of R = R’’, and the time elapsed from enzyme addition to the first maximum of the first derivative = t max.
2.5. Statistical Analysis
The statistical analysis was processed and analyzed using the Statistical Analysis System, SAS 9.2 (Statistical Analysis System Institute, Inc., Cary, NC, USA 27513, 2003-2008). An analysis of variance (ANOVA) was performed using the general linear model (GLM). Least square means (LSM) were statistically different when ρ < 0.05.
3. Results and Discussion
3.1. NIR Light Scattering Ratio through the Cell
Tungsten halogen light is commonly used for monitoring milk curd formation [21] because it plays a critical role in achieving a good spectrum quality [22]. According to the results, the absence and presence of tungsten halogen light did not significantly (ρ ≥ 0.05) affect the NIR light transmission (intensity; bits) in milk with 3.5% (Table 2), which shows that milk path length absorbs and scatters all the light arriving at the sample from the illuminating fiber optic and, subsequently, no light is travelling through the sample to reach the detector. On the other hand, as expected, it was observed that as the IT increases, the intensity detected by spectrometer increases. The IT of 100 ms was significantly (ρ < 0.05) lower than those of 500 ms and 1000 ms. A longer IT can lead to more electrons induced by the dark current (i.e., noise) since this current generates electron holes [23]. Additionally, longer IT also yield larger intensity response as the time during which a detector accumulates signals before they are read out is larger. Consequently, the integration of 1000 ms reported the highest intensity, and the 100 ms noted the lowest value. Although the relation between the IT and the intensity of response is, in many cases, linear, those two parameters can have a nonlinear relationship [24]. In milk, the intensity detected could be also affected by the fat/protein proportion, the fat globule size, and the milk variety [25]. The NIR transmission intensity on water and air at 780 nm, 880 nm, and 980 nm with an IT of 500 ms under two light conditions (absence and presence of halogen light) is presented in Table 3. As expected, the tungsten halogen illuminated samples had a significantly (ρ < 0.05) higher NIR light transmission intensity than the non-illuminated samples. The water samples did not significantly (ρ ≥ 0.05) differ from air samples when the tungsten halogen light was used and applied. Results were as expected since most of the incident light was transmitted through the path length of air or water. Neither of these media can absorb or scatter significant light as it travels through the short pathlength (28.96 mm), and subsequently, a significant amount of light passes through either water or air to reach the detector. The NIR transmission intensity detected at 880 nm was significantly (ρ < 0.05) higher than at 780 nm and 980 mn in milk. The use of 880 nm in milk it is recommendable when the samples do not contain considerable amounts of fat (<3%), which could generate a >90% NIR light extinction. The milk used in this study had <0.15% fat, meaning that light scatter by fat particles was at acceptable levels.
Table 2.
NIR light transmission intensity (bits) through the cell using milk with 3.5% protein.
Table 3.
NIR light transmission intensity (bits) through the cell using distilled water and air at 500 ms.
3.2. Determination of Integration Time
At 880 nm with the tungsten halogen light, the effect of IT (100 ms, 150 ms, 200 ms, 500 ms, and 1000 ms) on the intensity signal is shown in Table 4; as expected, the greater intensity was at the longer times. An extended IT could induce electron holes [23]. IT above 200 ms exceeded the limit (~ counts) intensity and generated a saturation of the detector.
Table 4.
Light backscatter intensity (bits) determinations under the presence of light at 880 mm using milk with 3.5% protein.
According to the team’s experience and the recommendation by the spectrometer manufacturer (Ocean Optics Inc.), the maximum intensity response is ~ counts, and it is recommended to have ~35% of the maximum possible signal during measurements. To sum up, the IT of 150 ms reported the best voltage value (5908 counts), and this IT was selected to perform the coagulation tests. The selected IT value left a considerable margin without saturating the detector since coagulation typically produces an increase in the voltage response of ~50% in skimmed cow’s milk [23]. The advantages of fiber optic sensors solve many of the drawbacks traditional measurement devices present. In the case of voltage and current measurement, characteristics such as the dielectric character of the optical fiber and its immunity against electromagnetic interference are fascinating, since they eliminate the need to incorporate complex insulation systems, which often include dangerous substances or contaminants.
3.3. Visual Cutting Time
A significant and linear increase (R2 = 0.999) in I0 (intensity) was observed with increasing protein concentration (Table 5). In addition, the optical parameter, t2min, decreased with increasing protein concentration, showing significant differences between 3%, 3.5%, and the same trend, but less marked, between 3.5% and 4%. At typical experimental conditions, when protein concentration is increasing at constant enzyme concentration, a decrease in the enzyme/casein ratio is expected, that causes enzyme saturation by the substrate. Thus, a longer time is required to generate sufficient hydrolysis of the κ-casein and induce micelle aggregation [26,27]. However, in this experiment, this did not appear to be the case as tmax was not significantly different as a function of protein but t2min was, in fact, decreasing significantly with increasing protein concentration. The lack of increase in tmax with the rise in protein concentration was attributed to the relatively high amount of chymosin (300 μL kg−1) that was used for the experiment (i.e., unlikely the enzyme was saturated by the substrate). On the other hand, an increasing concentration of protein was likely inducing a faster rate on aggregation on destabilized casein micelles, which is confirmed by a shorter t2min value.
Table 5.
Influence of the protein content on the evaluated light backscatter coagulation parameters at 880 mm.
A significant and linear (R2 = 0.998) decrease in I0 was observed with increasing wavelength (Table 6). In addition, the optical parameter, t2min, showed significant differences between 870 nm, 880 nm, and 890 nm. The data obtained using the selected multifiber probe to monitor milk coagulation showed that both the light scatter profiles and resulting derivatives were similar to those obtained with other devices in previous studies [28]. Therefore, it is possible to determine the optical parameters and analyze their behavior as has been done in previous works.
Table 6.
Influence of the wavelength on the evaluated optical coagulation parameters using milk with 3.5% protein.
The coagulation monitoring instruments with the most development and commercial use correspond to hot wire methods and those that use light in the near-infrared. With the help of the principle of the hot wire method, the Optiset was installed in more than 100 cheese vats in the early years of the 90s. It was noted then that the system improves quality and consistency. The other system, widely used commercially, directs infrared light at the milk through a fiber optic cable (fiber optic reflectance). The first systems using CoAgulite technology, were installed in 1993 by a company from Kentucky (USA). Fagan et al. (2008) [29] presented a “novel light backscatter” for continuous online monitoring of the coagulation and syneresis to improve the control of the moisture content of the curd. The technology proposal shows not only its usefulness to control clotting and syneresis, but also that it could be used to control the humidity of the curd, the fat losses, and curd yield, improving process control during cheesemaking [29]. Inline near-infrared sensors have been used to predict essential responses in syneresis, for example, the yield of whey, fat, and solids in whey and moisture content in curds [29]. Mateo et al. (2009) [30] reported validating a syneresis sensor in the composition range of milk and process parameters. Taifi et al. (2006) [31], using a non-intrusive ultrasonic method, studied the characterization of the syneresis and the firmness of a dairy gel. When measuring the electrical impedance, Li et al. (2010) [32] characterized the coagulation process of soy milk as having unique importance in preparing tofu. Currently, a novel system based on reflection scans (1000–1850 nm) in the near-infrared (NIR) is proposed to determine automatic cutting time [33].
4. Conclusions
In cheese, choosing the appropriate moment for cutting the curd is important due to its effects on the product’s yield, maturation, and useful shelf-life. The optical time parameters (tmax) and response parameters (Rmax, R1min and R2min) generated from the light scatter curve (R), unlike the initial intensity (I0), do not present significant statistical differences as a function of wavelength. This indicates that I0 is inversely proportional to the wavelength. This was likely because any of the three selected wavelengths corresponded to the maximum light backscatter peak (i.e., the peak of maximum light scatter response was likely located at a wavelength slightly shorter that the wavelengths at which measurements were taken). However, this inversely proportional relationship did not translate clearly into a significant effect on the parameters of the coagulation process. This circumstance is preferable when designing a coagulation sensor, as the three wavelengths generate similar coagulation parameters but with a more intense response at a shorter wavelength. However, other parameters concerning the suitability of the signal should be considered in future studies to identify the wavelength that contains the highest level of information about coagulation and the highest degree of response.
In the coagulation monitoring process as a function of protein concentration, no significant differences are seen in tmax with this new probe, but they are seen in t2min, which is close to the beginning of the hardening reaction. This indicates that hydrolysis and the beginning of aggregation did not change significantly with increasing protein concentration, likely due to the relatively high concentration of enzyme added, but the beginning of hardening did advance with increasing protein concentration, as a result of increasing rate of casein micelle aggregation with increasing protein concentration. The I0 response, increases linearly with protein concentration. This could allow the G’ estimation probe to be used to estimate the protein concentration in milk.
The multifiber probe evaluated with different protein levels represents an improvement in the inline monitoring process of milk coagulation, as it presents a lower cost and provides a coagulation profile like those of previously evaluated probes, which allows the generation of coagulation parameters. Those parameters respond as expected to a coagulation factor relevant to gel hardness as protein concentration. The light backscatter ratio obtained by the multifiber probe at the wavelengths used indicates that it can successfully adapt to the real-time prediction models of the elastic modulus of the gel, G’, previously established by other studies.
Author Contributions
Conceptualization, M.C., J.M., and R.S.A.; methodology, M.C., J.M., and R.S.A.; software, R.S.A.; formal analysis, L.M.; (most of the research), A.Y. and R.S.A.; resources, M.C., J.M., and R.S.A.; data curation, L.M. and R.S.A.; writing—original draft preparation, R.S.A.; writing—review and editing, R.S.A., M.C., and J.M.; project administration, M.C., and J.M.; funding acquisition, M.C., J.M., and R.S.A. All authors have read and agreed to the published version of the manuscript.
Funding
This research was funded by the University National of Agriculture (Honduras) with the International Development Research Center of Canada (IDRC) and the General Secretariat of the Central American Higher University Council (CSUCA) (Ref. C-DSIP-008-2023-UNAG). It was also funded by Universitat Autònoma de Barcelona with a Proof-of-Concept project (Ref. UAB PoC-2018).
Institutional Review Board Statement
Not applicable.
Informed Consent Statement
Not applicable.
Data Availability Statement
The data is within the article and corresponding authors.
Acknowledgments
We wish to thank Food Sciences, Louisiana State University Agricultural Center, and the Faculty of Technological Sciences, Universidad Nacional de Agricultura Road to Dulce, Catacamas, Olancho, Honduras.
Conflicts of Interest
The authors declare no conflict of interest.
References
- Rangel-Ortega, S.d.C.; Campos-Múzquiz, L.G.; Charles-Rodriguez, A.V.; Chávez-Gonzaléz, M.L.; Palomo-Ligas, L.; Contreras-Esquivel, J.C.; Solanilla-Duque, J.F.; Flores-Gallegos, A.C.; Rodríguez-Herrera, R. Biological control of pathogens in artisanal cheeses. Int. Dairy J. 2023, 140, 105612. [Google Scholar] [CrossRef]
- Castillo, M.; Payne, F.A.; Hicks, C.L.; Lopez, M.B. Predicting cutting and clotting time of coagulating goat’s milk using diffuse reflectance: Effect of pH, temperature and enzyme concentration. Int. Dairy J. 2000, 10, 551–562. [Google Scholar] [CrossRef]
- Fox, P.F.; Cogan, T.M.; Guinee, T.P. Factors That Affect the Quality of Cheese. In Cheese; Elsevier: Amsterdam, The Netherlands, 2017; pp. 617–641. [Google Scholar]
- Bintsis, T.; Papademas, P. The Evolution of Fermented Milks, from Artisanal to Industrial Products: A Critical Review. Fermentation 2022, 8, 679. [Google Scholar] [CrossRef]
- Johnson, M.E. A 100-Year Review: Cheese production and quality. J. Dairy Sci. 2017, 100, 9952–9965. [Google Scholar] [CrossRef] [PubMed]
- Roupas, P. Predictive modelling of dairy manufacturing processes. Int. Dairy J. 2008, 18, 741–753. [Google Scholar] [CrossRef]
- Lei, T.; Sun, D.W. Developments of nondestructive techniques for evaluating quality attributes of cheeses: A review. Trends Food Sci. Technol. 2019, 88, 527–542. [Google Scholar] [CrossRef]
- Panikuttira, B.; Payne, F.A.; O’Shea, N.; Tobin, J.T.; O’Callaghan, D.J.; O’Donnell, C.P. Investigation of an in-line prototype fluorescence and infrared backscatter sensor to monitor rennet-induced coagulation of skim milk at different protein concentrations. Int. J. Food Sci. Technol. 2020, 55, 175–182. [Google Scholar] [CrossRef]
- Fagan, C.C. Infrared Spectroscopy. In Process Analytical Technology for the Food Industry; O’Donnell, C.P., Fagan, C., Cullen, P.J., Eds.; Springer: New York, NY, USA, 2014; pp. 73–101. [Google Scholar]
- Castillo, M.; Arango, O. A Method and a System for Determining Gel Firmness Values from Inline Optical. Measurements. Patent EP3036527 B1, 8 January 2015. [Google Scholar]
- Galli, B.D.; Hamed, A.M.; Sheehan, J.J.; King, N.; Abdel-Hamid, M.; Romeih, E. Technological solutions and adaptive processing tools to mitigate the impact of seasonal variations in milk composition on Cheddar cheese production—A review. Int. J. Dairy Technol. 2023, 76, 449–467. [Google Scholar] [CrossRef]
- Arango, O.; Trujillo, A.J.; Castillo, M. Monitoring the effect of inulin, protein, and calcium on milk coagulation phases using a fibre optic sensor. Int. Dairy J. 2018, 81, 80–86. [Google Scholar] [CrossRef]
- Salvador, D.; Arango, O.; Castillo, M. In-line estimation of the elastic module of milk gels with variation of temperature protein concentration. Int. J. Food Sci. Technol. 2019, 54, 354–360. [Google Scholar] [CrossRef]
- Pérez, B. Dispersión de luz NIR Durante la Coagulación de Leche Desnatada. Efecto de la Concentración de Proteína y Temperatura Sobre el Voltaje Inicial. Bachelor’s Thesis, Universitat Autònoma de Barcelona, Barcelona, Spain, 2019. [Google Scholar]
- Dalgleish, D.G.; Corredig, M. The structure of the casein micelle of milk and its changes during processing. Annu. Rev. Food Sci. Technol. 2012, 3, 449–467. [Google Scholar] [CrossRef]
- Horne, D.S.; Lucey, J.A. Rennet-Induced Coagulation of Milk. In Cheese: Chemistry, Physics and Microbiology, 4th ed.; Elsevier Ltd.: Amsterdam, The Netherlands, 2017. [Google Scholar]
- Arango, O. Aplicación de Dispersión de Luz de Infrarrojo Próximo en la Producción de Derivados Lácteos Bajos en Grasa Con Inulina. Ph.D. Thesis, Universitat Autònoma de Barcelona, Barcelona, Spain, 2015. [Google Scholar]
- Payne, F.A.; Crofcheck, C.L.; Nokes, S.E.; Kang, K.C. Light backscatter of milk products for transition sensing using optical fibers. Trans. Am. Soc. Agric. Eng. 1999, 42, 1771–1776. [Google Scholar] [CrossRef]
- Nicolau, N.; Buffa, M.; O’Callaghan, D.J.; Guamis, B.; Castillo, M. Estimation of clotting and cutting times in sheep cheese manufacture using NIR light backscatter. Dairy Sci. Technol. 2015, 95, 495–507. [Google Scholar] [CrossRef]
- AOAC Association of Official Analytical Chemists. Official Methods of Analysis of the AOAC, 18th ed.; AOAC: Arlington, VA, USA, 2005. [Google Scholar]
- Strani, L.; Grassi, S.; De Juan, A. Effect of physicochemical factors and use of milk powder on milk rennet-coagulation: Process understanding by near infrared spectroscopy and chemometrics. Food Control 2021, 119, 107494. [Google Scholar] [CrossRef]
- Aziz, S.B.; Abdulwahid, R.T.; Rsaul, H.A.; Ahmed, H.M. In situ synthesis of CuS nanoparticle with a distinguishable SPR peak in NIR region. J. Mater. Sci. Mater. Electron. 2016, 27, 4163–4171. [Google Scholar] [CrossRef]
- Cozzolino, D. The Ability of Near Infrared (NIR) Spectroscopy to Predict Functional Properties in Foods: Challenges and Opportunities. Molecules 2021, 26, 6981. [Google Scholar] [CrossRef]
- Zhang, M.; Li, G.; Wang, S.; Fu, Z.; Guan, Y.; Lin, L. The influence of different integration time on stoichiometric analysis in near infrared grating spectrometers. Infrared Phys. Technol. 2017, 86, 130–134. [Google Scholar] [CrossRef]
- Grassi, S.; Strani, L.; Alamprese, C.; Pricca, N.; Casiraghi, E.; Cabassi, G. A FT-NIR Process Analytical Technology Approach for Milk Renneting Control. Foods 2022, 11, 33. [Google Scholar] [CrossRef] [PubMed]
- Lewis, M.J. The measurement and significance of ionic calcium in milk—A review. Int. J. Dairy Technol. 2011, 64, 1–13. [Google Scholar] [CrossRef]
- Lin, M.J.; Lewis, M.J.; Grandison, A.S. Measurement of ionic calcium in milk. Int. J. Dairy Technol. 2006, 59, 192–199. [Google Scholar] [CrossRef]
- Villaquiran, Z.Y. Evaluación de Una Sonda Multifibra Para la Determinación Óptica en Línea Del Módulo Elástico del Gel Durante la Elaboración de Queso. Master’s Thesis, Universitat Autònoma de Barcelona, Barcelona, Spain, 2020. [Google Scholar]
- Fagan, C.C.; Castillo, M.; O’Donnell, C.P.; O’Callaghan, D.J. Online prediction of cheese making indices using backscatter of near infrared light. Int. Dairy J. 2008, 18, 120–128. [Google Scholar] [CrossRef]
- Mateo, M.J.; O’Callaghan, D.J.; Everard, C.D.; Fagan, C.C.; Castillo, M.; Payne, F.A. Influence of curd cutting programme and stirring speed on the prediction of syneresis indices in cheese making using NIR light backscatter. LWT Food Sci. Technol. 2009, 42, 950–955. [Google Scholar] [CrossRef]
- Taifi, N.; Bakkali, F.; Faiz, B.; Moudden, A.; Maze, G.D.D. Characterization of the syneresis and the firmness of the milk gel using an ultrasonic technique. Maeas. Sci. Technol. 2006, 17, 281–287. [Google Scholar] [CrossRef]
- Li, X.; Toyoda, K.; Ihara, I. Coagulation process of soymilk characterized by electrical impedance spectroscopy. J. Food Eng. 2010, 105, 563–568. [Google Scholar] [CrossRef]
- Lyndgaard, C.B.; Engelsen, S.B.; Van Der Berg, F.W.J. Real-time modeling of milk coagulation using in-line near infrared spectroscopy. J. Food Eng. 2012, 108, 345–352. [Google Scholar] [CrossRef]

Disclaimer/Publisher’s Note: The statements, opinions and data contained in all publications are solely those of the individual author(s) and contributor(s) and not of MDPI and/or the editor(s). MDPI and/or the editor(s) disclaim responsibility for any injury to people or property resulting from any ideas, methods, instructions or products referred to in the content. |
© 2023 by the authors. Licensee MDPI, Basel, Switzerland. This article is an open access article distributed under the terms and conditions of the Creative Commons Attribution (CC BY) license (https://creativecommons.org/licenses/by/4.0/).