Article

The Influence of Graduate Student Mentoring Experiences on Program Completion and Career Expectations


by
Ana-Maria Topliceanu
1,* and
Margaret R. Blanchard
2
1
Department of Teaching and Leading, College of Education and Human Development, Augusta University, Augusta, GA 30912, USA
2
Department of STEM Education, College of Education, North Carolina State University, Raleigh, NC 27695, USA
*
Author to whom correspondence should be addressed.
Trends High. Educ. 2026, 5(3), 57; https://doi.org/10.3390/higheredu5030057
Submission received: 28 April 2026 / Revised: 22 June 2026 / Accepted: 24 June 2026 / Published: 30 June 2026

Abstract

Graduate STEM education in the U.S. has experienced continued growth in enrollment, due to its strong international reputation. Yet, attrition rates among students remain high. Mentoring is frequently identified as a critical factor for supporting graduate student success; however, there is limited empirical evidence regarding the most effective mentoring practices for graduate STEM students. The Mentoring Experiences of Graduate Students Survey (MEGSS) was developed and validated with data from 280 graduate STEM students enrolled in a large, public, research-intensive university in the Eastern U.S. Exploratory factor analysis was performed to examine the survey’s reliability and construct validity. A five-factor, 38-item model was developed, consisting of the following subscales: psychosocial support, program completion, research and writing support, career expectations, and career support. The findings show statistically significant differences in students’ perceptions of mentoring experiences and anticipated outcomes based on gender, citizenship, and stage in the program. Recommendations are offered for faculty mentors and institutions to strengthen mentoring practices, particularly in psychosocial areas, research and writing, and career support. Extending the distribution of MEGSS to other graduate research programs (including non-STEM) could identify mentoring gaps and inform evidence-based strategies to strengthen graduate student development.

1. Introduction

The number of graduate students in the U.S. continues to grow. Between 2023 and 2024, graduate enrollment increased by 2.1% [1]. In spring 2025, it was estimated that 3 million students were enrolled in U.S. graduate programs [2]. Despite increasing enrollment, attrition rates continue to remain high, as about half of these doctoral students do not complete their program [3,4]. Completion rates vary by discipline: the highest are in engineering (63%) and life sciences (60%), and the lowest are in the humanities (49%) [4].
There are a number of key factors that influence the completion of a doctoral program, including motivation, personal life, the relationship with the advisor, and the department [3]. Mentoring is one of the most important sources of support for graduate students [5,6]. Ample research shows that good mentors support students’ academic and psychosocial development and growth [7,8,9], strengthen their professional confidence [10], inspire them to explore and pursue career pathways [11], and encourage them to persist and complete their graduate programs [12].
Despite its recognized importance, few validated surveys measure the quality of graduate mentoring. Published surveys focus on specific populations, such as STEM and non-STEM doctoral students [13], undergraduate and graduate applied sciences students from Belgium and the Netherlands [14], or medical students [15]. No studies were found that focused specifically on the mentoring experiences of doctoral STEM students studying in the U.S. Given the essential role doctoral STEM students play in advancing innovation and scientific knowledge [16], it is important to understand the role of mentoring in supporting STEM doctoral students’ experiences and ultimately, their persistence. The purpose of this study was to understand the mentoring support doctoral STEM students received from their mentors (i.e., academic, research and writing, psychosocial, and career support) and how this mentoring support influenced their anticipated outcomes (i.e., program completion and career expectations). Concurrently, the researchers had the goal of developing a mentoring survey that could be used with any graduate research program, including non-STEM programs. Mentoring supports were measured through the development and validation of the Mentoring Experiences of Graduate Students Survey (MEGSS) and analyses of the survey findings.

2. Literature Review

2.1. Important Factors That May Influence Graduate STEM Students’ School Experiences

2.1.1. Gender

In 2022, the majority of U.S. doctoral degrees in STEM fields (64%) were awarded to men, with approximately half of them going to domestic students. More than two-thirds of the 36% of STEM doctoral degrees earned by women were awarded to domestic students [17]. Gender representation varies by field [18]. Women are underrepresented in mathematics, physical sciences, engineering, and computer science. For example, only 36% of the mathematics master’s degrees and 25% of the doctoral degrees were awarded to women. Twenty-nine percent of the master’s and 28% of the doctoral degrees were awarded to women in engineering. In computer science, 29% of the master’s and 23% of the doctoral degrees were earned by women [18].
Miner [19] reported that gender gaps in engineering enrollment are present among domestic students but are not evident among international students, whose participation rates are comparable across genders. He drew on survey responses from 2322 graduate students (1535 domestic and 787 international) representing 74 countries who were pursuing degrees in physical sciences, mathematics, engineering, and computer science at U.S. institutions. Miner [19] reported that international men enroll in computer science at more than three times the rate of domestic men. Additionally, international women tend to be concentrated in life science fields rather than in the physical sciences when compared with their male international counterparts [19].
Research on gender enrollment patterns is important to understand the representation of men and women across STEM fields. However, there is a need for more nuanced insight into the factors that shape students’ educational experiences, persistence, and motivations. In a qualitative study, Hernandez and Posselt [20] investigated the experiences of 17 women and other underrepresented students in STEM doctoral programs from four U.S. universities. The authors found that just increasing representation is not sufficient to create inclusive and supportive academic environments. The participants described insufficient advising and academic support, harmful interactions with faculty members, including perpetuating sexism and racism, and institutional inaction. These results highlight the importance of promoting supportive cultures for student development and success [20].
Tal et al. [21] conducted a mixed-methods study with approximately 800 final-year undergraduate and graduate STEM students and alumni at a research university in Israel. The authors investigated how male and female participants described the characteristics of their STEM role models. Overall, women were more likely than men to report finding a STEM role model and to describe being inspired by that individual. While both groups frequently characterized their role models as empathetic and encouraging, women placed greater emphasis on professional and personal inspiration and were more likely to identify ambition as a desirable mentor characteristic [21]. These results suggest that role models may play an important role in supporting women’s motivation, sense of belonging, and persistence in STEM fields, particularly in STEM disciplines where women are underrepresented.

2.1.2. Citizenship

Citizenship representation varies in STEM fields. In 2020, out of the 40,000 doctoral degrees in science and engineering conferred in the U.S., more than half (57%) went to domestic students [22]. International students were overrepresented in computer science and engineering, where they received 60% of doctoral degrees, while U.S. domestic students were overrepresented in the life and physical sciences [19,23]. Within the health and biological sciences, domestic graduate students accounted for more than two-thirds of the overall graduate student population [23].
The number of international students studying in the U.S. has grown. Most international graduate STEM students come from China (36%) and India (13%). Smaller percentages come from South Korea, Turkey, and Taiwan [24]. Students’ countries of origin influence their likelihood of remaining in the U.S. after completing their degrees. Graduates from China and India report higher anticipated stay rates compared to those from Europe and South Korea [25]. Citizenship status impacts the graduate program experience even after its completion. Empirical evidence from a qualitative study with 22 science and engineering postdoctoral researchers, five administrators, and 22 faculty members from the U.S. and the United Kingdom suggests that international postdoctoral experiences varied by national background [26]. Asian postdocs reported the highest levels of isolation, discrimination, and performance-related pressure. Additionally, faculty hiring these scholars held different expectations shaped by the nationality of the postdocs. Postdocs from North America and Europe were often described as creative and innovative, and those from developing nations were viewed as hard-working and committed. European and Australian postdocs were commonly perceived as having stronger theoretical preparation and greater readiness for faculty roles, while East Asian postdocs were regarded as having superior technical expertise, making them more suitable candidates for postdoctoral appointments [26].
Rodriguez et al. [27] conducted a qualitative study of 22 international graduate students enrolled in STEM programs at two primary White U.S. research universities. The participants were from Asia and Central and South America. Similar to the patterns reported among postdoctoral researchers [26], students’ experiences varied according to the representation of their national backgrounds within their STEM programs. Participants who were the only individuals of their ethnicity or gender studying in their program reported feelings of isolation, compared to participants from more highly represented groups [27]. For example, participants from India and China, who constituted the largest groups within their computer science program, reported easier access to peer networks and advisors from their home countries. In contrast, international students from less represented countries of origin described greater perceptions of isolation and fewer opportunities to integrate socially in their programs than those from more represented countries of origin [27]. Together these findings suggest that citizenship shapes students’ access to support networks, sense of belonging, and professional opportunities.

2.1.3. Stage in Program

The stage in the doctoral program (early, middle, or late-stage) has been shown to impact students’ perceptions of their graduate school experience. For example, McCulloch and Bastalich [28] investigated the expectations of 199 commencing domestic and international doctoral students at an Australian university. Their findings indicate that the students entering the doctoral program anticipated their doctoral experience to be challenging and uncertain, with obstacles along the way. Participants emphasized the importance of personal attributes. Persistence, hard work, and being focused on research productivity were perceived as critical for successfully navigating the doctoral journey. These findings draw attention to how early-stage doctoral students perceive the challenges and personal attributes required at the beginning of the program.
Recent evidence from the U.S. demonstrates that students’ experiences shift as they advance through their programs. Jwa and Berdanier [29] conducted a quantitative study of 468 doctoral engineering students. Early-stage students expressed the most support and advisor satisfaction compared to middle and late-stage students. Middle-stage students reported the highest mean scores in their intention to leave the program, and the lowest mean scores for quality of life and work, productivity, support network, and motivation. The authors found it concerning that the late-stage students were less likely than students in other stages to indicate that pursuing the PhD was worthwhile [29]. These findings diverge from the assumption that students progressively adjust throughout doctoral programs and highlight the importance of providing continued support to middle and late-stage doctoral students.
McCain et al. [30] conducted a qualitative study with 83 late-stage fifth-year doctoral students in the biological sciences to analyze students’ perceptions of their relationship with their advisors. The relationships with the advisors were described as ranging from “strained, evolving, supportive, … [to] equal” [30] (p. 1). Strained relationships with the advisors were marked by conflict, tension, and challenges. Evolving relationships were described as continuing to change over time, progressing through challenges, and improving. Supportive relationships with advisors focused on students’ academic and professional support and development, and equal relationships reflected collaborative partnerships in which the advisor and the advisee were perceived as equal partners. Taken together, the literature indicates that doctoral students’ experiences are not static, but evolve throughout the program.

2.2. Mentoring

Decades-long research shows that faculty advising has long been identified as a critical factor in graduate student persistence and success. Lovitts and Nelson [31] concluded that students’ decisions to continue or leave graduate programs are driven more by their relationships with advisors than by their academic ability. Similarly, Zhai [32] found that advisors are a key support for international graduate students, after family, friends, and international student offices. In a recent study, Bahnson and Abane [33] analyzed the responses of 269 engineering doctoral programs from 26 U.S. universities regarding their intentions to leave the program, relationship with their advisor, and whether to change their research lab. The authors reported that students’ relationship with their advisor was a significant predictor of doctoral students’ consideration to leave the program.
Research done in undergraduate and graduate programs shows that mentoring relationships influence students’ decisions to attend graduate school and participate in research [34,35]. Effective advisors provide academic guidance, but also personal support, career development, and professional socialization, especially for students from underrepresented groups [10]. Frequent interactions between advisor and advisee are associated with stronger perceived support; however, meeting frequency and expectations differ by discipline, program stage, and advisor experience [36,37].
Perceptions of advising quality are also shaped by race, gender, and student status. While same-race advising is often valued, most Black doctoral students in Barker’s [38] qualitative study did not believe racial matching was needed to form effective relationships and did not prefer a certain advisor’s race. Rose [39] reported that international graduate students in STEM and non-STEM fields preferred mentors who are personally involved in their lives, possibly due to challenges associated with cultural adjustment.
In a recent qualitative study involving eight STEM professors and twenty of their recent doctoral graduates, both domestic and international, Topliceanu and Blanchard [40] found that all of the participants predominantly focused on academic support either provided by mentors or received by mentees. For example, mentors helped mentees learn skills, become integrated into their field, provided resources, and tailored and implemented unique strategies to their individual needs. Mentors also provided psychosocial support, including encouragement and affirmation, checking on mentees’ well-being, and protecting them from additional work [40]. Studies have shown disparities in perceived respect and support; women of color reported the greatest disadvantages in relationships with their advisors [41]. Recent findings from a quantitative study with 648 graduate students indicated that mentoring support also varies by residency, degree level, and enrollment status, with international and doctoral STEM students reporting higher levels of mentor support than domestic, master’s, or part-time students [42]. In general, compared to non-STEM majors, the graduate STEM students reported that their mentors cared more about their well-being [42].

2.3. Mentoring Surveys

At the time of this study, there were no validated surveys that examined mentoring experiences of graduate STEM students. Very few other studies that reported validated mentoring surveys were found, but they included different populations. For example, Granner et al. [13] revalidated a PhD mentorship quality survey, previously developed with nursing students, with 819 doctoral STEM and non-STEM students from 19 departments at a public university. The initial survey items were reduced in number and grouped into 6 components: “working together, mentor availability, mentoring teams and goals, shared research interests, mutual respect, and mentor benefit” [13] (p. 1). In another study of 294 STEM and non-STEM doctoral students at a research university, Bell and Dedrick [43] reported on the construct validity of the Ideal Mentor Scale [44] when examining whether differences exist between male and female doctoral students’ views of their ideal mentor’s attributes. Attributes studied included: integrity, guidance, and relationship. They found that male and female participants had similar views of the qualities of their ideal mentor. The largest difference between male and female doctoral students was reported in one question (Believe in me); this item seemed to be more important to female students [43]. Neither of these studies drew upon theoretical frameworks.
Nuis et al. [14] developed and validated a 35-item mentoring support questionnaire with 534 applied sciences undergraduate and graduate students from Belgium and the Netherlands. The authors drew upon a systematic literature review to identify the following factors: “trust and availability, emotional support, networking support, autonomy support, similarity, and empathy” [14] (p. 899). Another study developed by Hyun et al. [45] included the revalidation of a survey that measured the skills of U.S. mentors for postsecondary Science, Technology, Engineering, Mathematics, and Medicine research, as the original survey was validated with a small number of mainly White male faculty in senior roles [46,47]. Hyun et al.’s [45] survey drew upon a previously validated survey and included the following eight components: aligning expectations, promoting professional development, maintaining effective communication, assessing understanding, mentee self-efficacy, addressing diversity, fostering independence, and navigating mentoring networks. No theoretical underpinnings were described in these studies.
Fedesco et al. [48] carried out an iterative pilot study in the U.S. to test and evaluate mentorship assessment with life sciences doctoral students and their research advisors at the University of Georgia using a survey followed by two rounds of semi-structured interviews. The survey’s goal was to give graduate students and their advisors an opportunity to reflect on the career and psychosocial support provided and received. Fedesco et al.’s [48] and University of Georgia’s [49] Graduate Student-Research Advisor Feedback Survey included 21 career and 19 psychosocial support items measured on a 5-point Likert scale, along with two open-ended questions. These items assessed research advisor support from both student and advisor perspectives. Five additional confidential questions measured satisfaction with the mentorship relationship. Interviews with international students regarded their experiences with their mentorship, but they did not complete the survey. No theoretical framework was reported in Fedesco et al.’s [48] research at the University of Georgia.

2.4. Frameworks

Yob and Crawford’s [9] conceptual theory of mentoring is the first framework that guided this study. Yob and Crawford conducted a literature review and grouped all the mentoring behaviors they found into academic and psychosocial domains. Academic mentoring behaviors include the mentor’s competence, availability, induction of mentees into the field and their professions, and challenge. Mentor’s competence refers to their knowledge of the field, programs, and resources. The mentor’s availability refers to the time outside of the classroom that they dedicate to discussing students’ professional and non-professional concerns. Induction refers to helping students learn skills and design, conduct, and report research; adjusting to the requirements of the field, program, and department; or connecting with others in the field. Challenge refers to providing constructive criticism and feedback.
Psychosocial mentoring behaviors include three attributes: the mentor’s personal qualities, communication, and emotional support. A mentor’s personal qualities refer to, for example, being friendly, patient, and trusted. Communication refers to practices such as active listening. Emotional support involves encouraging students, increasing their self-esteem and confidence, and modeling self-care to help students navigate the demands of a doctoral program and complete it successfully.
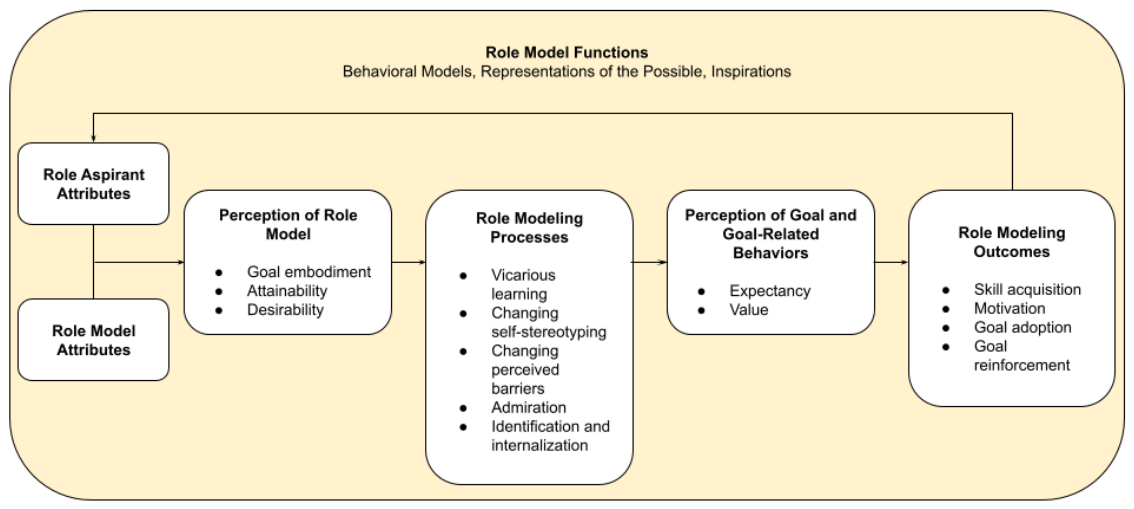
Although Yob and Crawford [9] describe characteristics of good mentors, their conceptual theory does not include outcomes. Therefore, a framework was sought that would address outcomes from good mentoring: students’ anticipated program completion and career expectations. Morgenroth’s Motivational Theory of Role Modeling [50] included role modeling outcomes. Their framework was generated from a literature review on role models from occupational and educational settings. The authors sought to synthesize the fragmented literature on role models to develop a new conceptual understanding of role modeling and establish a unified theoretical framework. In their model, role models (e.g., mentors) provide behavioral examples for role aspirants (e.g., graduate STEM students) and have a positive influence on students’ development of their professional identity and career choices [50,51]. Morgenroth et al. [50] defined role models as “individuals who influence role aspirants’ achievements, motivation, and goals by acting as behavioral models, representations of the possible, and/or inspirations” (p. 468). The framework takes the perspective of the role aspirants (e.g., graduate students) and connects the three role model functions (behavioral models, representations of the possible, and inspirations) to corresponding variables, such as role model attributes (success and competence), role aspirant attributes (pre-existing goals), perception of role model, role modeling processes, perceptions of goals, and outcomes (Figure 1).
The Motivational Theory of Role Modeling was not used to derive the study hypotheses. It was used as a conceptual framework to interpret the findings related to mentoring strategies that supported the development of graduate STEM students and their program completion and career expectations outcomes. The Motivational Theory of Role Modeling provides a lens for interpreting the findings.

2.5. Research Questions

Because no validated surveys existed to assess mentoring experiences of domestic and international doctoral STEM students, the goal of this study was to develop a valid and reliable instrument to measure them. Another goal was to measure the underlying factors influencing graduate students’ differences in their perceptions. The guiding questions of this study are:
  • Is MEGSS a valid and reliable instrument for assessing graduate STEM students’ perceptions of mentoring experiences that facilitate their development?
  • Are there differences in graduate STEM students’ perceptions of their mentoring experiences based on gender, citizenship status, and stage in the program?
  • Do the survey constructs predict graduate STEM students’ expected program completion and career expectations?

3. Methods

3.1. Scale Development

This study’s survey development followed the scale development procedures outlined by Hinkin [54], including item generation, questionnaire administration, and initial item reduction.

3.1.1. Item Generation

To generate survey items, findings from Topliceanu and Blanchard’s [40] qualitative study involving 28 domestic and international STEM graduates and their domestic and international former mentors were used (see Appendix A). Survey items from Fedesco et al. [48] and the University of Georgia [49] were adapted and revised based upon constructs that were salient with international and domestic graduate students in Topliceanu and Blanchard’s [40] qualitative study’s findings. The term “advisor” was exchanged with “mentor” throughout the survey. A number of changes were made to the original survey following the interviews in the prior study [40] either because the items were not described by the graduate students or were described and had not been a part of the original Fedesco et al. [48] survey. Out of the career support items, four were eliminated, and four new items were added in the academic/career support section. One survey item was split into two separate items. Out of the psychosocial support items, seven were eliminated, and one new item was added. The final survey included 44 academic and psychosocial items, nine demographic questions, and one open-ended question (there were no labels on the administered survey for the type of item). At the beginning of the survey, the text said “We ask you questions to help us understand your experiences with your graduate mentor.” The intention was for students to respond based on who their official graduate mentor was, either assigned or chosen by the student. The survey items were measured on a 5-point Likert scale; strongly disagree was given a value of 1, disagree 2, neither agree nor disagree 3, agree 4, and strongly agree 5. Face and content validity were assessed following the recommendations of Taherdoost [55]. Ten domestic and international doctoral STEM and STEM education students completed the survey and noted potential issues with items. The instrument was also evaluated by a survey methods expert and a STEM education professor to identify unclear or leading questions. Their feedback was used to refine the items’ wording and their sequence.

3.1.2. Questionnaire Administration

Institutional IRB approval was obtained before the administration of the questionnaire. To administer it, convenience sampling [56] was used. This study’s participants were graduate STEM students enrolled in a large, public, research-intensive university in the southeastern U.S. The graduate school’s dean was contacted to obtain email addresses for all the graduate STEM students in master’s and doctoral programs that required a thesis or dissertation. The dean of the graduate school shared a list of 2888 emails. Only 2739 student emails were used after excluding emails of students enrolled in STEM education, teacher education, and learning sciences programs. The survey was administered through Qualtrics. Email invitations to participate were sent in January and February 2025. Also, three reminder emails were sent at intervals of approximately 7–14 days to nonrespondents. Data collection stopped at the end of February 2025. A total of 362 responses were received and stored in Qualtrics. An informed consent form was distributed through Qualtrics to all the participants. Consistent with Schafer’s [57] guideline that missing data of 5% or less is unlikely to affect the results significantly, the dataset was cleaned by removing responses of participants who did not complete the survey in its entirety. Eleven participant responses were also removed as they did not consent to participate in the study. The final sample included 280 survey responses, each with at least 95% of items completed, yielding a completion rate of 77.4%.
  • Demographic Statistics
Participants provided self-reported demographic information, including gender, race, ethnicity, citizenship status, enrollment status (full-time or part-time), stage in the program, number of years working with the mentor, program of study, program type (thesis master’s, or doctoral), and field of study (Table 1). The majority of respondents were male (51.43%), White (51.07%), doctoral (99.6%), enrolled in engineering programs (43.6%), and domestic students (56.4%). Most were full-time students (95.7%), had been working for 3 years with their current mentor (24.6%), and were in the late stage of the program, engaged in preparing their dissertation or thesis work (46.4%).

3.1.3. Initial Item Reduction

To validate an instrument, factor analysis is commonly used to examine its internal structure [56]. When limited or no prior knowledge exists about the instrument’s latent structure, exploratory factor analysis (EFA) is suitable for identifying complex patterns and also testing predictions [58,59]. In this study, EFA was conducted using SPSS software version 29.0.1.0 (2023) to examine the survey’s structure, with 44 items included in the analysis.

3.1.4. Testing the Suitability of Data Set for Factor Analysis

Before EFA, preliminary analyses were performed to determine the suitability of the data set for factor analysis, such as the Kaiser–Meyer–Olkin (KMO) Measure of Sampling Adequacy and Bartlett’s Test of Sphericity. A KMO value above 0.50 and a significant Bartlett’s Test of Sphericity (p < 0.05) indicate that the data set is suitable for EFA [60]. In this study, the KMO was 0.956, and Bartlett’s Test of Sphericity was significant (p < 0.01), confirming that the data set was suitable for factor analysis.

3.1.5. Factor Extraction, Rotation, Retention, and Other Analysis

The distributional properties of this study’s dataset were examined before factor analysis. The Kolmogorov–Smirnov test indicated statistically significant deviations from normality (p < 0.001). Given the sensitivity of normality tests to large sample sizes, skewness and kurtosis were also examined to examine the data’s deviation from normality. Based on Orcan’s [61] recommendations, the obtained skewness and kurtosis values exceeded the threshold values, indicating that the assumption of normality was violated.
Given these results, Principal Axis Factoring was used as the extraction method as it doesn’t assume multivariate normality and is therefore considered appropriate when the normality assumption is not met [60]. Because the latent constructs were expected to be correlated, an oblique rotation, Oblimin rotation with Kaiser Normalization, was applied to achieve a simpler factor structure [60]. To determine the number of significant factors, eigenvalues were used [60]. There were six factors with eigenvalues greater than 1. The inspection of the scree plot also supported a six-factor solution.
Items with communalities less than 0.20 were considered for elimination following recommendations from Child [58], Fabrigar et al. [62], and Yong & Pearce [60]. No items had communalities less than 0.20; therefore, no items were excluded at this stage. Factors can be identified by the largest loadings [60]. Factor loadings greater than 0.4 are considered stable [63], while factor loadings less than 0.33 indicate that the items ought to be removed [64]. No factor loadings had values less than 0.33. The item I am experiencing an acceptable level of stress was eliminated because it did not load on any factor. Cross-loading values were analyzed next, with items exceeding 0.32 on multiple factors removed [65]. Items were removed one by one, starting with the highest value of cross-loading. EFA was re-run after each item removal, and the cross-loadings were re-examined. Six items were removed through this iterative process. Although the extraction suggested a six-factor solution, the structure was not retained in the original form. Consistent with recommendations that factors be defined by at least three items to support stable interpretation [66], the sixth factor was not retained because it contained only two items. The EFA was therefore re-estimated. The revised solution yielded a stable and interpretable five-factor structure. The five factors were: (1) psychosocial support, (2) program completion, (3) research and writing, (4) career expectations, and (5) career support.
The factor correlation matrix (see Table 2) indicated that the highest correlation, 0.584, was between factors 1 (psychosocial support) and 5 (career support). According to Cohen [67], correlation coefficients of 0.50 or higher indicate large effects, values close to 0.3 reflect moderate effects, and coefficients of 0.10 or less represent weak relationships. Most correlations fell within the moderate range. The correlations between factors 1 (psychosocial support) and 5 (career support), factors 3 (research and writing) and 5 (career support), and factors 1 (psychosocial support) and 3 (research and writing) exceeded the threshold of 0.5. Psychosocial support was strongly correlated with research and writing support (r = 0.545) and career support (r = 0.584) indicating that participants who reported higher levels of mentor’s psychosocial support also tended to report strong research and writing and career support received from their mentor. Research and writing support was strongly associated with career support (r = 0.552) indicating that graduate STEM students who reported higher levels of research and writing support their mentors provided also reported higher perceived levels of career support. There was a moderate correlation between program completion and research and writing (r = 0.276) and career support (r = 0.243). In contrast, between career expectations and all the other factors there was a negatively moderate correlation, including psychosocial support (r = −0.277), program completion (r = −0.302), research and writing (r = −0.281), and career support (r = −0.247). These negative correlations indicate that even if participants reported higher levels of psychosocial, research and writing, and career support and higher perceptions of program completion, they reported lower levels of career expectations. These lower levels of career expectations suggest that career expectations operate independently from the other dimensions.
The eigenvalues for the 5-factor model varied between 16.650 and 1.006, and accounted for 60.18% of the variance. After the factors and their corresponding items were identified, Cronbach’s alpha, a widely used statistic of internal consistency, was calculated to assess the reliability of each factor. Generally, values of 0.70 are considered acceptable, and those equal to 0.80 or greater are preferred [68]. In this study, Cronbach’s alpha values varied between 0.80 and 0.96, suggesting reliability in the scales. The 5-factor model has Cronbach’s alpha values that are considered good across all five factors (Table 3). The psychosocial factor (14 items) explained 43.82% of the total variance, emerging as a predominant factor. The program completion factor (5 items) accounted for 6.18% of the variance. The third factor, research and writing (9 items), explained 3.95 of the variance. The fourth factor, career expectations, (3 items) accounted for 3.58% of the variance. The fifth factor, career support, (7 items) explained 2.65% of the variance in this study.

3.1.6. Differences in Graduate STEM Students’ Perceptions of Mentoring

To determine significant differences in item responses for different subgroups, item analyses were carried out using self-reported demographic characteristics. Because of the ordinal nature of the Likert-type items and the deviations from normality, the Kruskal–Wallis test, a non-parametric alternative to one-way ANOVA test with Bonferroni corrections for pairwise comparisons, was employed to examine if there were significant differences in items between different subgroups. Statistical significance was set at α = 0.05. The Kruskal–Wallis test is appropriate for independent samples with small sizes that are equal to or greater than 5 [69].

4. Results

4.1. Testing the Validity and Reliability of the MEGSS

From the EFA, a 5-factor, 38-item model was determined with the following subscales: (1) psychosocial support, (2) program completion, (3) research and writing, (4) career expectations, and (5) career support. The subscales contained from 3 to 14 items. Factor loadings above 0.32 were considered meaningful, following Tabachnick and Fidell’s [66] recommendations. In this study, factor loadings varied between 0.897 and 0.353 (see Table 4). Three items (I expect to obtain a desired job, I expect to achieve my career goals, and I feel prepared for my career) had negative loadings, indicating an inverse relationship to the factor [60,70,71]. The negative loadings were kept and interpreted as a lack of expectation of obtaining employment and achieving career goals, as well as a perceived lack of career preparedness.

4.2. STEM Students’ Perceptions of Their Mentoring Experiences Based on Gender, Citizenship Status, and Stage in the Program

4.2.1. Gender

Gender differences were analyzed using the Kruskal–Wallis test due to non-normal distributions. Overall, few differences were found (see Table 5), and the majority of the differences were found with nonbinary students (n = 8). Compared with male and female students, nonbinary students reported greater mentor encouragement (psych 7, H (3) = 13.648, p = 0.03), their mentor worked with them more to set research goals (res4, H (3) = 10.881, p = 0.013), provided more useful feedback (res5, H (3) = 9.916, p = 0.019), helped them develop professional relationships (carsupp1, H (3) = 8.315, p = 0.040), and provided more useful information about various career paths outside academia (carsupp4, H (3) = 14.273, p = 0.003), with male students reporting the least amount of information about career paths outside academia. Nonbinary students also reported that their mentor provided more information about resources relevant to their work (res9, H (3) = 14.421, p = 0.02) compared to male students.
Within the psychosocial support domain, male students reported receiving a more appropriate level of independence from their mentors (psych10, H (3) = 12.753, p = 0.005) compared to female students. For psych11, H (3) = 18.668, p < 0.001, female students reported lower levels of mentor advocacy compared to male and nonbinary students.

4.2.2. Citizenship Status

Item analyses examined statistical differences between international and domestic graduate students. Given the non-normal distribution of data, group differences were analyzed with the independent-samples Mann–Whitney U test, a non-parametric alternative to the independent t-test. A significant difference emerged for the career expectation item (carexp1), U = 10,909.00, p = 0.048. International students (n = 122, M = 3.24, SD = 1.021) reported feeling less prepared for their careers compared to domestic students (n = 158, M = 3.49, SD = 1.033), with both groups’ mean responses slightly positive.

4.2.3. Stage in the Program

The Kruskal–Wallis test revealed significant differences across graduate program stages within the psychosocial support, program completion, research and writing, and career support factors (Table 6). Early-stage students perceived that their mentor cared more about them as a whole person, not just as a researcher (psych1, H (2) = 6.357, p = 0.042), that they were more likely to complete the thesis/dissertation (progr1, H (2) = 7.042, p = 0.030), and reported that their mentor provided less information about resources relevant to their work (res9, H (2) = 9.062, p = 0.011) than late-stage students. Early-stage students reported that their mentor helped them more to develop professional relationships (carsupp1, H (2) = 8.264, p = 0.016), but reported less mentor availability (res6, H (2) = 11.916, p = 0.003), their mentor worked less with them to align their expectations on the mentoring relationship (psych13, H (2) = 13.242, p = 0.01), and their mentor challenged them less to grow professionally (carsupp7, H (2) = 11.909, p = 0.003) compared to middle and late-stage students. In addition, early-stage students reported fewer opportunities to learn about career paths outside academia (carsupp4, H (2) = 7.192, p = 0.027) compared to late-stage students.
Late-stage students reported that their mentor had more reasonable expectations of their workload (psych3, H (2) = 7.564, p = 0.023), perceived their mentor as more of a role model (psych12, H (2) = 11.059, p = 0.04), and reported receiving more timely feedback (res2, H (2) = 6.853, p = 0.032) than the early-stage students.

4.3. Predictive Factors of Program Completion and Career Expectations

Composite scores were calculated for each latent construct (psychosocial support, program completion, research and writing, career expectations, and career support) by averaging the scores of the subscales’ items (e.g., avg. psych 1–14 for composite score for psychosocial support). Each item was rated using a 5-point Likert scale, where 5 represented strongly agree, 3 indicated a neutral response, and 1 represented strongly disagree. Across the five subscales, all composite mean scores fell between a neutral response (3) and agree (4) (Table 7). The subscales with the highest composite scores were program completion (M = 3.99) and psychosocial support (M = 3.92), while career support had the lowest mean score (M = 3.50).
This study examined program completion and career expectations as distinct outcomes, based on Roach and Sauermann’s [72] finding that graduate students’ career interests evolve throughout the doctoral program, independently of program progress. Composite scores for psychosocial support, research and writing, and career support were used as predictive factors in two separate multiple regression analyses. The first regression assessed the relationship between these mentoring factors and program completion, while the second examined their relationship with career expectations.

4.3.1. Predictor of Program Completion

According to the regression analysis (Table 8), the research and writing latent construct was a significant predictor of program completion, while neither psychosocial support nor career support were statistically significant predictors. The Pearson correlation revealed a moderate relationship between program completion and research and writing, with r = 0.276. According to the regression coefficient, a 1-point increase in the research and writing composite score would increase the program completion score by 0.22 points, suggesting that research and writing are supportive factors for program completion.

4.3.2. Predictor of Career Expectations

According to the multiple regression model (Table 9), career support was the only significant predictor. Neither psychosocial support nor research and writing constructs emerged as statistically significant predictors of career expectations. Although the Pearson correlation between career support and career expectations indicated a moderate negative correlation (r = −0.247), the multiple regression analysis indicated that career support was a significant positive predictor of graduate students’ career expectations after controlling for psychosocial support and research and writing. According to the regression coefficient, a 1-point increase in the career support was associated with a 0.18-point increase in the career expectations composite score after controlling for the other predictors in the model.

4.4. Limitations

A convenience sampling approach was used, with all participants drawn from a single large, public, research–intensive university in the Southeastern U.S. The sample had a majority of White (51%), male (51%), engineering (44%), domestic (56%), and full-time graduate students (96%), with 46% in the late stages of their doctoral programs, which may limit the generalizability of the findings to universities with different graduate STEM student populations. Additionally, the survey response rate was approximately 10%, which is below historically recommended levels (e.g., [73,74]). It is possible that the completion rate of approximately 77% would have improved if the survey had been set up to display multiple items on each page, rather than one at a time, which may have included a larger sample of students. This survey focused on the mentoring support of the graduate student’s main advisor. It is likely that there were other mentors (e.g., peers, other faculty members and staff) that were not measured by this survey. Because this was not a random sample of graduate students, it is possible that those who selected to participate had different characteristics than those who did not complete the survey or chose not to participate. Another limitation is that one comparison group (nonbinary students) had a small sample size (n = 8). The authors found it important to represent the experiences of these students, although the results involving this group should be interpreted with caution. Only one Master’s student, who was full-time and mid-program, completed the survey. Therefore, this student’s responses may not represent the responses of a larger sample of STEM Master’s students in thesis programs. The authors were a part-time doctoral student (first author) and a full-time graduate faculty member, both in STEM Education, who work closely with STEM faculty in shared grants. It is possible that there are other mentoring aspects that would have been included or omitted if other researchers had developed this work. In light of these limitations, the findings will be discussed in the next section.

5. Discussion

5.1. Validity and Reliability of the MEGSS

The Mentoring Experiences of Graduate Students Survey (MEGSS) developed in this study addressed several important gaps in the literature. There were no validated surveys measuring graduate STEM students’ perceptions of their mentors, and none for this population in the U.S. context, nor were they built on theoretical constructs [9,50]. Exploratory factor analysis was performed to examine the validity of the survey with responses from 280 graduate STEM students at a public U.S. university. A 5-factor, 44-item model was determined, with items ranging from three to fourteen. Three factors (psychosocial support, research and writing support, and career support) focused on students’ perceptions of their mentors and the other two (program completion and career expectations) on the students’ expectations for themselves. The moderate positive correlations (see Table 2 for all correlations) among the mentoring dimensions suggest that the constructs are related yet distinct aspects of the mentoring experiences, consistent with prior research demonstrating that mentoring encompasses multiple, interconnected domains of support (e.g., [42,75]). Psychosocial support was strongly correlated with both research and writing support and career support, indicating that mentors who provide psychosocial support also tend to offer higher levels of academic and professional guidance, consistent with prior research indicating that mentoring functions often co-occur [76].
Despite its prominence (nearly 40% of the variance), psychosocial support did not significantly predict program completion or career expectations in the regression analyses. This finding indicates that specific, instrumental mentoring functions (i.e., research and writing, career support) are more directly related to concrete outcomes than broader relational support. Psychosocial support appeared to shape the overall mentoring experience. However, specific forms of mentoring played a more decisive role in influencing students’ academic progress and career outlooks. Research and writing emerged as a significant predictor of program completion, consistent with prior research showing that mentoring is positively correlated with academic outcomes such as research development and self-efficacy [77]. Similarly, career support significantly predicted career expectations, consistent with Sim et al.’s [78] study of faculty members who reported that mentorship quality was significantly correlated to academic self-efficacy which was significantly associated with career satisfaction.
The moderate negative correlations between career expectations with the other mentoring dimensions (see Table 2) offer some possible interpretations. The first is that career expectations are focused on the student and their belief about their own abilities, rather than the mentor. Even with good graduate mentoring, the onus to obtain a job is primarily on the student. Another possible explanation is that high levels of mentoring support, particularly in psychosocial, academic, and career domains still may not lead to high expectations for graduate students to find a career. Prior meta-analytic research indicates that while mentoring is associated with positive outcomes, its effects on career-related outcomes are generally modest and influenced by Eby et al. [79]. Program completion occurs in the context of one’s personal circumstances, including family and mental health issues [6]. Prior to graduating and obtaining a job, students may still perceive career planning and awareness as elusive, particularly given the long journey of a STEM doctoral program [80]. These findings also suggest that obtaining a desired career is influenced by broader factors that are largely outside the control of both mentors and mentees [79,81]. Job market conditions, the availability of positions in a given field, economic fluctuations, visa policies, or even global conflicts all play a significant role in shaping career trajectories. Following the global pandemic, the reduction in the federal government, and the job market at the time of this study, it seems even more likely that students would have concerns about post-graduate school employment [82]. Even highly mentored students may face limited opportunities to find an academic or non-academic job. In this context, mentoring may function more as a resource that helps the students navigate the graduate school and research field and grow as a researcher and less as a direct determinant of career outcomes. The stress of the uncertainty of a job following the PhD, unclear career pathways, and increasingly competitive academic job markets are major concerns for students as they navigate graduate school [16]. Collectively, the findings of this study demonstrate that while psychosocial support is structurally central to how mentoring is experienced by mentees, it is the more targeted, instrumental forms of mentoring that exert greater influence on concrete academic and career outcomes.

5.2. Differences in Graduate STEM Students’ Perceptions of Their Mentoring Experiences Based on Gender, Citizenship Status, and Stage in the Program

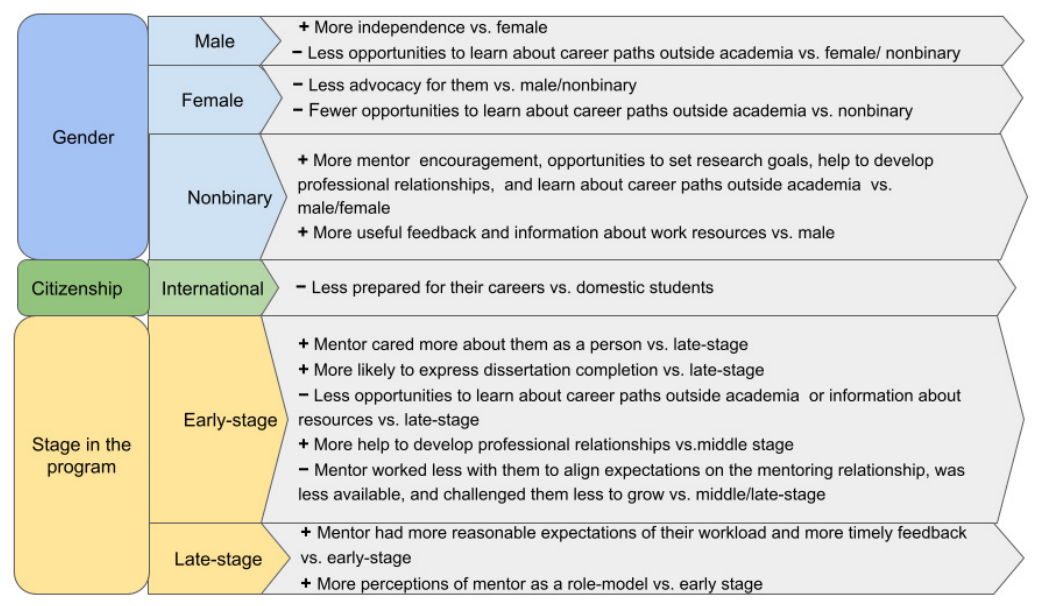
The second research question used regression analyses to look for differences in survey responses across different subgroups of graduate STEM students. Figure 2 summarizes key differences found based on gender, citizenship status, and stage in the program.

5.2.1. Gender

Findings from the Mentoring Experiences of Graduate Students Survey (MEGSS) revealed gender-based differences in graduate STEM students’ perceived mentoring experiences. Male students reported more psychosocial support compared to female students, as they reported perceptions of having more independence from their mentors. Female students reported less psychosocial, research and writing, and career support compared to male and nonbinary students. For example, they reported that their mentors advocated less for them. These findings are consistent with Collier and Blanchard [42], whose quantitative study of 648 graduate students from 23 U.S. universities found that female students in STEM fields perceived less mentor support.
Although nonbinary students represented a small portion of the sample (n = 8), they reported higher levels of perceived psychosocial support, research and writing guidance, and career support than male and female students. For all statistically significant differences (see Table 5), the nonbinary students’ mean responses ranged from 4.50 (agree) to 5.00 (strongly agree), reflecting strong perceptions of mentor support. All nonbinary participants strongly agreed that their mentors provided encouragement. Although the subgroup size was small and results should be interpreted with caution, this result is particularly relevant for retention in STEM programs, and adds their positive experiences to the literature. These findings contrast with a recent study by [83] showing that transgender and gender nonconforming students persist in STEM disciplines at rates approximately 10% lower than the male and female students’ rates.

5.2.2. Citizenship Status

International students reported lower career expectations than their domestic peers. This finding aligns with the work of Steele et al. [84], who reported that sometimes international students are unfamiliar with U.S. norms, rules, and institutional processes. Although many (74%) international graduate students pursue education in the U.S to enhance their career prospects and almost half of them (48%) have the intention to remain in the U.S. for employment [85], they are still uncertain about future career options. These results suggest a need for stronger mentoring support related to career development. Similarly, Choe and Borrego [86], in a study of 249 graduate engineering students, reported that international doctoral students expressed strong interest in careers across academia, industry, and government, and they were more likely than domestic students to pursue academic careers. Both the high interest in U.S. employment and the lower confidence in career opportunities observed in this study point out that there are gaps in the communication or availability of career-related information for international students. Addressing these gaps may be critical to supporting their transition in the workforce and ultimately strengthening the STEM pipeline.

5.2.3. Stage in the Program

The findings indicated stage-based differences in graduate STEM students’ mentoring experiences. Early-stage students reported higher scores for three items in the psychosocial and career support and program completion compared to middle or late-stage graduate students. Early-stage students reported that their mentor cared more about them as a whole person, not just as a researcher, and that they received more help to develop professional relationships. Early-stage students also expressed that they were more likely to complete the thesis/dissertation than late-stage students. At the same time, they reported less mentor availability, less timely feedback, and less information about resources relevant to their work, and were challenged less to grow professionally. These findings suggest that while early-stage students may experience some psychosocial and academic support, they might receive less developmental guidance during the initial stages of a doctoral program. Less guidance during the initial years of the doctoral program was documented by Topliceanu and Blanchard [40], who reported that recent STEM doctoral graduates wished for more direction from their mentor in the early stages when they were working to establish a research trajectory. These findings resonate with those reported by Zhang [87], that the needs of women doctoral chemistry students varied through the program stages, with the most difficult year being the first one, due to adjusting to the new academic environment, moving away from family and friends, and heavy teaching assignment workloads and coursework load.
This study highlights which mentoring behaviors have the potential to improve the retention of early-stage STEM students. Research indicates that this student population leaves STEM programs for academic reasons [88]. Morris et al. carried out a quantitative study of first-year engineering students and reported that the top three reasons for leaving the program were academic challenges, excessive effort required, and diminished interest in the field [88]. This study’s findings suggest that mentoring practices related to availability, feedback, and challenge to grow professionally may also play an important role in supporting the early-stage students’ persistence in doctoral programs.
In contrast, students in late stages of the doctoral program reported higher scores for three items in the psychosocial support factor, one in the career support, and three in the research and writing. The late-stage students gave that their mentor had more reasonable workload expectations, received more timely feedback, worked with them to align their expectations on the mentoring relationship, and provided more information about resources relevant to their work. They viewed their mentor primarily as a role model. These findings are in contrast with the Collier and Blanchard [42] quantitative study, which reported that the late-stage students perceived less mentor support, less access and opportunity, and less persistence. This divergence may be influenced by the institutional context. All together, these findings highlight the importance of the doctoral stage as an essential factor in mentoring experiences and suggest that mentoring needs shift as the graduate students progress in their program.

5.3. Predictive Factors of Program Completion and Career Expectations

Two regression analyses examined the influence of survey variables (psychosocial support, research and writing, and career support) on two students’ outcomes: program completion and career expectations. The results of the first regression analysis revealed that research and writing was the only significant predictor of students’ expectations of program completion. The psychosocial and career support provided by the mentor did not have a significant effect on students’ expectations of program completion. Students’ ability to achieve program milestones, finalize their thesis/dissertation, and ultimately graduate appeared to be dependent on the research and writing support provided by their mentors. These findings align with the conclusions of Collier and Blanchard [6], who reported that mentor support plays a crucial role in students’ persistence within academic programs. Also, these results aligned with Bahnson and Abane [33], who documented that the relationship with the advisor is a predictor of students’ decisions to leave the doctoral program.
The second regression analysis revealed that only the career support the mentor provided significantly predicted the graduate STEM students’ career expectations. When mentors offered career development guidance, took time to learn about graduate students’ career goals, and shared information about potential career paths within and outside academia, mentees tended to perceive that they were likely to achieve their career expectations. The psychosocial and research and writing support provided by the mentor did not have a significant effect on students’ career expectations. Prior research in STEM fields confirmed similar findings. In his literature review study, Harshman [89] reported that doctoral students in chemistry programs are “overly specialized in their training” but “ill-prepared” (p. 259) for both academia and non-academia careers. Despite progress over the past ten years, increasing diversity in the U.S. STEM workforce continues to be both a national priority and a significant challenge [18]. This leads to the idea that graduate STEM students may feel more confident in finding their desired careers if early in the graduate program they gain exposure to career planning, receive information about career paths, and have opportunities to connect with other professionals in the field.

5.4. Connection of Survey’s Constructs to the Conceptual Theory of Mentoring and the Theory of Role Modeling

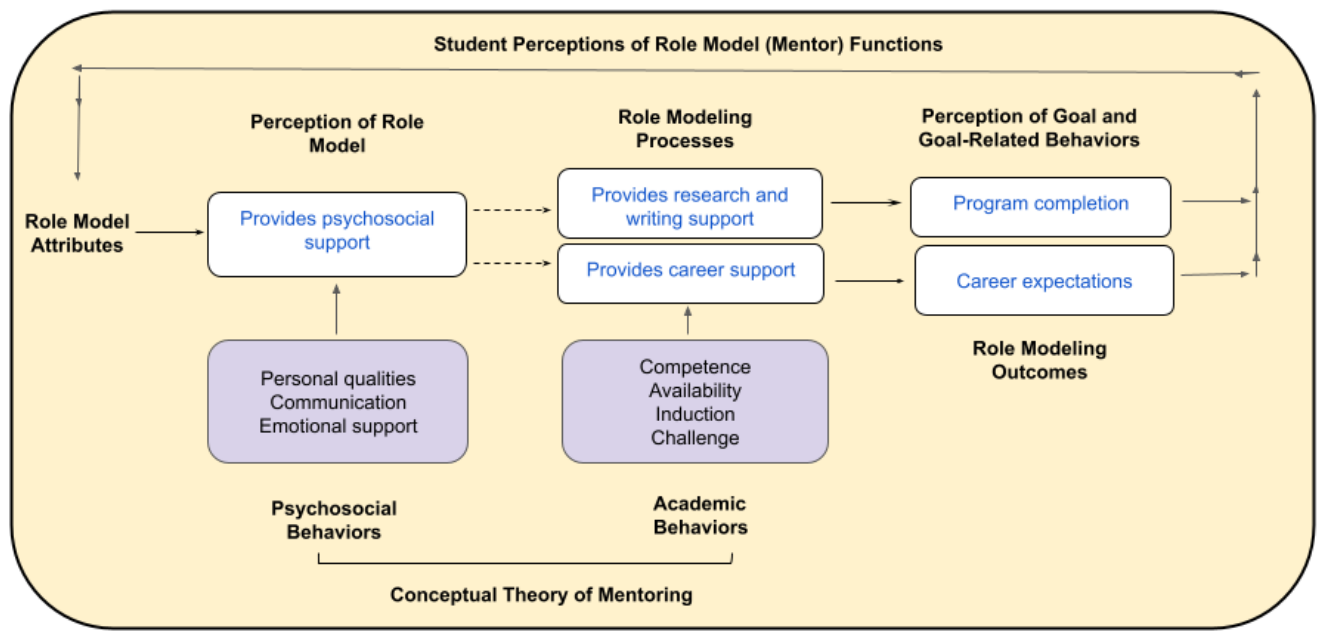
This study draws on Yob and Crawford’s [9] conceptual theory of mentoring and Morgenroth et al.’s [50] theory of role modeling. The MEGSS, validated as a part of this study, was developed based on Yob and Crawford’s [9] academic and psychosocial behaviors. The psychosocial support subscale (14 items) captured mentors’ behaviors, such as personal qualities, communication, and emotional support. The research and writing (9 items) and the career support (7 items) represented the academic mentoring behaviors, such as mentor competence, induction into the field, challenge, and availability. This study extends the framework by examining whether these mentoring behaviors are associated with student outcomes, such as program completion and career expectations.
The Motivational Theory of Role Modeling [50] was used as a conceptual framework to interpret the findings related to mentoring strategies that supported the development of graduate STEM students and their program completion and career expectations outcomes. Mentors function as role models for graduate students. In this study, psychosocial mentoring behaviors contributed to students’ perceptions of mentors as role models. Doctoral students viewed their mentor as encouraging and advocating for them, while displaying personal qualities such as trustworthiness, friendliness, understanding, being a role model, and providing independence. These psychosocial behaviors correspond to Morgenroth et al.’s [50] perception of role models as attainable and desirable (see Figure 3). Also, the mentors supported graduate students’ research and writing development, shared information about career support, provided timely and useful feedback, challenged them to grow, and were available. These practices correspond with the academic behaviors described by Yob and Crawford [9] (competence, availability, induction, and challenge), and align with the role modelling processes outlined by Morgenroth et al. [50].
The survey outcome variables of program completion and career expectations examined in this study align with key elements of Morgenroth et al.’s [50] framework. Program completion reflects students’ perceptions of their academic goals and goal-related behaviors, including expectations of completing program milestones, finishing the thesis or dissertation, and graduating. Career expectations represent anticipated role modeling outcomes, including students’ perceptions of career preparedness and their expectations of achieving desired career goals.
Together, these two frameworks, with additional outcomes from the Mentoring Experiences of Graduate Students Survey (MEGSS), provide a nuanced perspective on the multifaceted nature of mentoring. Yob and Crawford’s [9] theory emphasizes academic and psychosocial mentoring behaviors of mentors, while Morgenroth et al.’s [50] role modeling framework explains how these mentoring behaviors may influence graduate students’ anticipated outcomes. In this study, psychosocial support, research and writing, and career support represent perceptions of role models and role modeling processes, while program completion and career expectations represent perceptions of goals and role modeling outcomes.

6. Conclusions and Recommendations

This study developed, administered, and validated the Mentoring Experiences of Graduate Students Survey (MEGSS) to better understand graduate STEM students’ perceptions of mentoring experiences. The findings lead to the following conclusions:
  • There were statistically significant differences among groups of graduate STEM students in their perceptions of psychosocial, research and writing, and career support provided by mentors.
  • Mentoring experiences are not uniform. They varied across personal and academic characteristics, such as gender, citizenship, and stage in the program.
  • Research and writing support was the only mentoring factor that significantly predicted program completion; psychosocial and career support were not significant predictors.
  • Career support was the only mentoring factor that significantly predicted students’ career expectations; psychosocial and research and writing support had no significant effects.
  • Research and writing and career support were the mentoring factors most closely associated with positive outcomes.
  • Psychosocial mentoring behaviors were generally perceived positively by students but did not significantly predict the outcomes measured in this study.

6.1. Recommendations

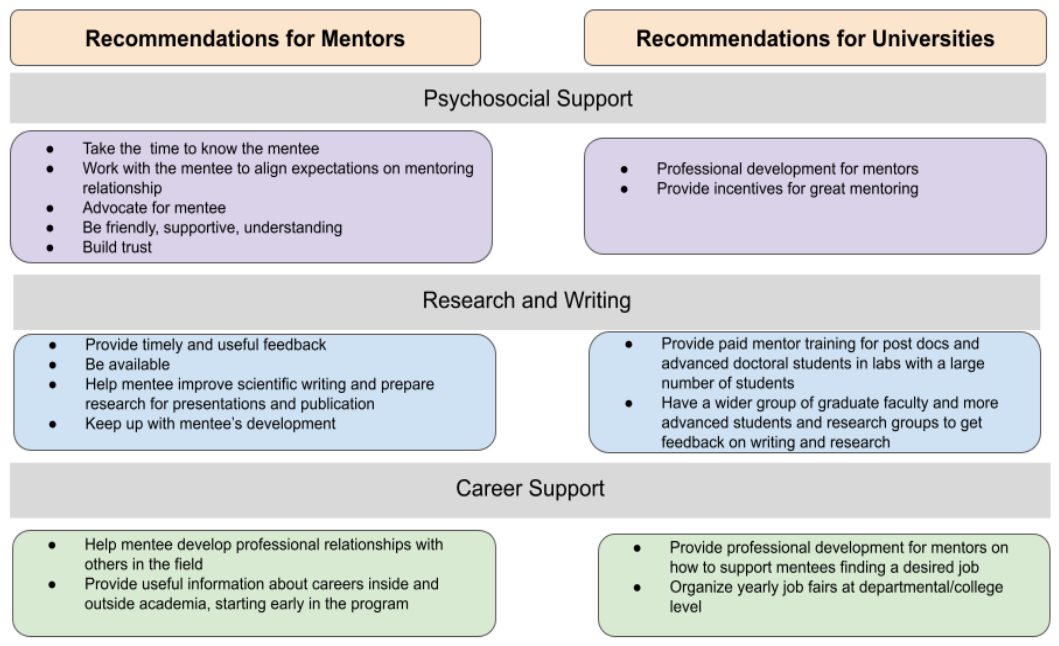
The MEGSS findings highlight the need for targeted mentoring support for graduate STEM students, particularly in relation to demographic characteristics (e.g., gender) and stage in the program. Effective mentoring can enhance students’ development across psychosocial, research and writing, and career support. Recommendations for mentors and universities are offered to strengthen the development of graduate STEM students, based on this study’s findings (Figure 4).

6.1.1. Psychosocial Support

Mentors should understand students’ goals, take the time to know the mentees, work with the mentee to align expectations on the mentoring relationship, demonstrate personal qualities such as being friendly, caring, supportive, and understanding of their needs as graduate students, and foster trust. Institutions can support this through professional development opportunities for mentors to share effective mentoring strategies.

6.1.2. Research and Writing Support

Given that research and writing support was a predictor of program completion, mentors should provide timely and constructive feedback on research projects, manuscripts, and presentations, and guide students in skill development. Sometimes mentors have a high number of mentees. To prevent faculty overload and ensure high-quality, individualized guidance, institutions should provide paid mentor training for post-docs and advanced doctoral students in labs with a large number of students, allowing them to offer research and writing support to mentees, as well.

6.1.3. Career Support

Career support significantly influenced students’ career expectations. Mentors can help discuss career goals early, provide information on academic and non-academic careers, and connect students with others in professional networks. Universities can complement this with departmental or college-level career events that expose students to diverse opportunities.
Extending the distribution of MEGSS to other programs (STEM and non-STEM) can identify mentoring gaps and inform evidence-based strategies to strengthen graduate student development. Aligning mentoring practices with this empirical evidence has the potential to enhance retention in graduate programs, career preparedness, and overall student success.

Author Contributions

Conceptualization, A.-M.T. and M.R.B.; methodology, A.-M.T. and M.R.B.; formal analysis, A.-M.T. and M.R.B.; data curation, A.-M.T. and M.R.B.; writing—original draft preparation, A.-M.T. and M.R.B.; writing—review and editing, A.-M.T. and M.R.B.; visualization, A.-M.T. and M.R.B.; funding acquisition, M.R.B. All authors have read and agreed to the published version of the manuscript.

Funding

This research was funded by National Science Foundation, grant number 731 2134664.

Institutional Review Board Statement

The study was conducted in accordance with the Declaration of Helsinki, and approved by the Institutional Review Board of NORTH CAROLINA STATE UNIVERSITY (27176 and 17 June 2024).

Informed Consent Statement

Informed consent was obtained from all subjects involved in the study.

Data Availability Statement

The datasets generated and analyzed during the current study are not publicly available due to the potential to compromise the individuals’ privacy but are available from the corresponding author upon reasonable request.

Acknowledgments

We are grateful to the graduate students who took the time to share their perceptions of their mentoring experiences. A special thank you to Peter Harries for his support in the survey distribution. We are grateful to Karen Marie Collier who participated in the analysis process.

Conflicts of Interest

The authors declare no conflicts of interest.

Appendix A

Survey Questions (Note: This was reproduced from Topliceanu [53].)
In this survey, we ask you questions to help us better understand your experiences with your graduate mentor. By providing additional information about yourself, such as your major, enrollment and discipline, we will be able to uncover the role of demographic factors on your and other graduate students’ experiences.
This survey should take you approximately 10 min or less.
Demographic characteristics
  • My academic discipline is
Agriculture and/or Natural Resources
Architecture
Biological and/or Biomedical Sciences
Computer and/or Information Sciences
Engineering
Geosciences, Atmospheric Sciences, and Ocean Sciences
Health Professions
Mathematics and/or Statistics
Physical Sciences
Other [Open response]
2.
The level of my graduate program is:
M.S. degree (thesis)
Ph.D. degree (doctoral dissertation)
Non-thesis degree program [these will be routed to a “Thank you. This survey is only intended for thesis and dissertation granting degrees.”]
3.
My enrollment status is:
Part time
Full time
4.
I am in this stage of my doctoral/master’s program:
Early (beginning coursework)
Middle (finishing coursework)
Late (working on dissertation/thesis)
5.
What is your international status?
International
My country of citizenship is__________ [Open response]
Not international
Please consider your key graduate mentor as you respond to the following items.
For the next questions, please provide a response from the following 5-point Likert scale: strongly disagree, 1; disagree, 2; neither agree nor disagree, 3; agree, 4; strongly agree, 5.
[Career/Academic Support—not labeled on survey]
6.
My mentor takes time to learn about my career goals.
7.
My mentor is available when I need them.
8.
My mentor works with me to set research goals.
9.
My mentor helps me improve my scientific writing.
10.
My mentor helps me write my research for publication.
11.
My mentor helps me prepare to present my research.
12.
My mentor provides opportunities for me to learn about grant proposal writing.
13.
My mentor helps me secure the resources I need for academic success.
14.
My mentor helps me develop professional relationships with others in the field.
15.
My mentor provides useful information about various career paths inside academia.
16.
My mentor provides useful information about various career paths outside academia.
17.
My mentor provides guidance on career development.
18.
My mentor challenges me to grow and develop professionally.
19.
My mentor provides me with information about resources relevant to my work.
20.
My mentor advocates for me when necessary.
21.
My mentor has reasonable expectations for my workload.
22.
My mentor gives me an appropriate level of independence.
23.
My mentor provides the right amount of support.
24.
My mentor keeps up with my development.
25.
My mentor provides me timely feedback.
26.
My mentor provides me useful feedback.
[Psychosocial Support—not labeled on survey]
27.
My mentor is someone I trust.
28.
My mentor is supportive of my personal identity.
29.
My mentor serves as a role model for me.
30.
My mentor cares about me as a whole person, not just as a researcher.
31.
My mentor is friendly to me.
32.
My mentor acts in my best interests.
33.
My mentor is understanding of my needs as a graduate student.
34.
My mentor and I communicate effectively.
35.
My mentor works with me to set clear expectations on our mentoring relationship.
36.
My mentor works with me to align our expectations on our mentoring relationship.
37.
My mentor and I feel comfortable talking about things other than research.
38.
My mentor encourages me.
39.
My mentor motivates me.
40.
For how many years (approximately) have you been working with your mentor?
1 (or less)
2
3
4
5
6
7+
For the following items, focus on your perceptions of your progress in your graduate program.
[Outcomes—not labeled on survey]
41.
I am productive in my research.
42.
I am productive in my academic writing.
43.
I am experiencing an acceptable level of stress.
44.
I expect to achieve my masters/doctoral program milestones in a timely manner.
45.
I expect to complete my thesis/dissertation.
46.
I expect to graduate.
47.
I am building strong professional relationships.
48.
I feel prepared for my career.
49.
I expect to obtain a desired job.
50.
I expect to achieve my career goals.
51.
My gender identity is:
Male
Female
Non-binary
Prefer to describe [Open response]
52.
My racial identity is:
American Indian or Alaskan Native
Asian
Black or African American
Hawaiian or Native Pacific Islander
Middle Eastern
Indian
White
Prefer to self-describe [Open response]
53.
What is your ethnic identity?
Hispanic or Latino/a
Not Hispanic or Latino/a
Prefer to self-describe [Open response]
[Open response]
54.
Are there other things you would like to share about your mentoring experiences? Please, explain.

References

  1. Kim, H.; Cohen, H.J.; Ibrahim, M.; Randolph, B.; Holsapple, M.; Shapiro, D. Stay Informed Fall 2024; National Student Clearinghouse Research Center: Herndon, VA, USA, 2024. [Google Scholar]
  2. Welding, L.; Bryant, J. College Enrollment Trends and Statistics: 2024–2025. Available online: https://www.bestcolleges.com/research/college-enrollment-statistics/ (accessed on 1 August 2025).
  3. Breitenbach, E. Factors Influencing Doctoral Program Completion. In Academic Performance—Students, Teachers and Institutions on the Stage; Dias, D., Candeias, T., Eds.; BoD-Books on Demand: Hamburg, Germany, 2023. [Google Scholar]
  4. Sowell, R.; Zhang, T.; Bell, N.; Redd, K.; King, M.F. Ph.D. Completion and Attrition: Analysis of Baseline Demographic Data from the Ph.D. Completion Project; Council of Graduate School: Washington, DC, USA, 2012. [Google Scholar]
  5. Thiry, H.; Laursen, S.; Loshbaugh, H. “How Do I Get from Here to There?” An Examination of Ph.D. Science Students’ Career Preparation and Decision. Int. J. Dr. Stud. 2015, 10, 237–256. [Google Scholar] [CrossRef] [PubMed]
  6. Collier, K.; Blanchard, M. Historically Underrepresented Graduate Students’ Experiences at a U.S. Majority Serving Institution: A Narrative Analysis. Int. J. Dr. Stud. 2024, 19, 1. [Google Scholar] [CrossRef] [PubMed]
  7. Antonio, A.; Baek, C. Beyond Survey Measures: Exploring International Male Graduate Students’ Sense of Belonging in Electrical Engineering. Stud. Grad. Postdr. Educ. 2021, 13, 132–150. [Google Scholar] [CrossRef]
  8. Kumar, S.; Coe, K. Mentoring and Student Support in Online Doctoral Programs. Am. J. Distance Educ. 2017, 31, 128–142. [Google Scholar] [CrossRef]
  9. Yob, I.; Crawford, L. Conceptual Framework for Mentoring Doctoral Students. High. Learn. Res. Commun. 2012, 2, 34–47. [Google Scholar] [CrossRef]
  10. Lechuga, V. Faculty-Graduate Student Mentoring Relationships: Mentors’ Perceived Roles and Responsibilities. High. Educ. 2011, 62, 757–771. [Google Scholar] [CrossRef]
  11. Karalis Noel, T.; Miles, M.; Rida, P. Stressed-out of STEM: Examining Mentoring Experiences of Women, People of Color, and International Postdocs. Educ. Stud. 2022, 58, 435–457. [Google Scholar] [CrossRef]
  12. Janssen, S.; van Vuuren, M.; de Jong, M. Sensemaking in Supervisor-Doctoral Student Relationships: Revealing Schemas on the Fulfillment of Basic Psychological Needs. Stud. High. Educ. 2021, 46, 2738–2750. [Google Scholar] [CrossRef]
  13. Granner, J.; Shuman, C.; Smith, A.; Umberfield, E.; Smith, E. Psychometric Evaluation of the Collaboration for Leadership and Innovation in Mentoring Survey: An Instrument of PhD Student Mentorship Quality. Nurse Educ. Today 2025, 153, 106794. [Google Scholar] [CrossRef] [PubMed]
  14. Nuis, W.; Segers, M.; Beausaert, S. Measuring Mentoring in Employability-Oriented Higher Education Programs: Scale Development and Validation. High. Educ. 2024, 87, 899–921. [Google Scholar] [CrossRef] [PubMed]
  15. Schäfer, M.; Pander, T.; Pinilla, S.; Fischer, M.; Von der Borch, P.; Dimitriadis, K. The Munich-Evaluation-of-Mentoring-Questionnaire (MEMeQ)—A novel instrument for evaluating protégés’ satisfaction with mentoring relationships in medical education. BMC Med. Educ. 2015, 15, 201. [Google Scholar] [CrossRef] [PubMed]
  16. National Academies of Sciences, Engineering, and Medicine. Graduate STEM Education for the 21st Century; National Academies Press: Cambridge, MA, USA, 2018. [Google Scholar]
  17. Institute of Education Sciences. Science, Technology, Engineering, and Mathematics (STEM) Education, by Gender; National Center for Education Statistics: Washington, DC, USA, 2025.
  18. Fry, R.; Kennedy, B.; Funk, C. STEM Jobs See Uneven Progress in Increasing Gender, Racial and Ethnic Diversity; Pew Research Center: Washington, DC, USA, 2021. [Google Scholar]
  19. Miner, M.A. Unpacking the Monolith: Intersecting Gender and Citizenship Status in STEM Graduate Education. Int. J. Sociol. Soc. Policy 2019, 39, 661–679. [Google Scholar] [CrossRef]
  20. Hernandez, T.E.; Posselt, J. “They Don’t Really Care”: STEM Doctoral Students’ Unsupportive Interactions with Faculty and Institutions. Educ. Sci. 2024, 14, 392. [Google Scholar] [CrossRef]
  21. Tal, M.; Lavi, R.; Reiss, S.; Yehudit, J. Gender Perspectives on Role Models: Insights from STEM Students and Professionals. J. Sci. Educ. Technol. 2024, 33, 699–717. [Google Scholar] [CrossRef]
  22. National Science Board. The State of U.S. Science and Engineering 2024; National Science Foundation: Alexandria, VA, USA, 2024.
  23. Zwetsloot, R.; Feldgoise, J.; Dunham, J. Trends in U.S. Intention-to-Stay Rates of International Ph.D. Graduates across Nationality and STEM Fields; Center for Security and Emerging Technology: Washington, DC, USA, 2020. [Google Scholar]
  24. National Center for Science and Engineering Statistics. Most U.S.-Trained Science and Engineering Doctorate Recipients on Temporary Visas Remain in the United States; U.S. National Science Foundation: Alexandria, VA, USA, 2025.
  25. National Science Board; National Science Foundation. Higher Education in Science and Engineering. Science and Engineering Indicators; National Science Foundation: Alexandria, VA, USA, 2022.
  26. Cantwell, B.; Lee, J. Unseen Workers in the Academic Factory: Perceptions of Neoracism among International Postdocs in the United States and the United Kingdom. Harv. Educ. Rev. 2010, 80, 490–517. [Google Scholar] [CrossRef]
  27. Rodriguez, M.; Roman, B.; Mohamed, M.; Barthelemy, R. Social and Cultural Barriers Reported by STEM International Graduate Students of Color. J. Int. Stud. 2024, 14, 276–302. [Google Scholar] [CrossRef]
  28. McCulloch, A.; Bastalich, W. Commencing Research Students’ Expectations and the Design of Doctoral Induction: Introducing Inflections of Collaboration and Pleasure. High. Educ. Res. Dev. 2023, 47, 687–698. [Google Scholar] [CrossRef]
  29. Jwa, K.; Berdanier, C. Witnessing “De-Socialization”: Investigating Unexpected Longitudinal Trends in Engineering Doctoral Socialization. J. Eng. Educ. 2026, 115, e70040. [Google Scholar] [CrossRef]
  30. McCain, J.; Roksa, J.; Breen, S. Support without Status: Inequities in Student–Advisor Relational Dynamics between First-Generation and Continuing-Generation Doctoral Students. Educ. Sci. 2024, 14, 441. [Google Scholar] [CrossRef]
  31. Lovitts, B.; Nelson, C. The Hidden Crisis in Graduate Education: Attrition from Ph.D. Programs. Academe 2000, 86, 44. [Google Scholar] [CrossRef]
  32. Zhai, L. Studying International Students: Adjustment Issues and Social Support. J. Int. Agric. Ext. Educ. 2004, 11, 20. [Google Scholar] [CrossRef]
  33. Bahnson, M.; Abane, T.A. Beyond Attrition: Advisor Relationships, Progress Clarity, and Laboratory Switching in Engineering Doctoral Programs. Front. Educ. 2026, 11, 1770054. [Google Scholar] [CrossRef]
  34. Houser, C.; Lemmons, K.; Cahill, A. Role of the Faculty Mentor in an Undergraduate Research Experience. J. Geosci. Educ. 2013, 61, 297–305. [Google Scholar]
  35. Hawthorne, M.; Zhang, A.; Cooper, A. Advising Undergraduate Students: An Exploration of How Academic Advising Impacts Student Success. Res. High. Educ. J. 2022, 41, 10. [Google Scholar]
  36. Young-Jones, A.; Burt, T.; Dixon, S.; Hawthorne, M. Academic Advising: Does It Really Impact Student Success? Qual. Assur. Educ. 2013, 21, 7–19. [Google Scholar] [CrossRef]
  37. Marijanovic, N.; Lee, J.; Teague, T.; Means, S. Advising Experiences of First Year International Doctoral Students. J. Int. Stud. 2021, 11, 417–435. [Google Scholar] [CrossRef]
  38. Barker, M. Racial Context, Currency and Connections: Black Doctoral Student and White Advisor Perspectives on Cross-Race Advising. Innov. Educ. Teach. Int. 2011, 48, 387–400. [Google Scholar] [CrossRef]
  39. Rose, G. Group Differences in Graduate Students? Concepts of the Ideal Mentor. Res. High. Educ. 2005, 46, 53–80. [Google Scholar] [CrossRef]
  40. Topliceanu, A.-M.; Blanchard, M. Graduate STEM Mentoring in the United States: A Qualitative Study of Domestic and International Mentor-Mentee Perspectives. Int. J. Dr. Stud. 2026, 21, 7. [Google Scholar] [CrossRef] [PubMed]
  41. Noy, S.; Ray, R. Graduate Students’ Perceptions of Their Advisors: Is There Systematic Disadvantage in Mentorship? J. High. Educ. 2012, 83, 876–914. [Google Scholar] [CrossRef]
  42. Collier, K.; Blanchard, M. Graduate Student Resilience: Exploring Influential Success Factors in U.S. Graduate Education through Survey Analysis. Trends High. Educ. 2024, 3, 637–680. [Google Scholar] [CrossRef]
  43. Bell, B.; Dedrick, R. What Do Doctoral Students Value in Their Ideal Mentor? Res. High. Educ. 2008, 49, 555–567. [Google Scholar] [CrossRef]
  44. Rose, G.L. Enhancement of Mentor Selection Using the Ideal Mentor Scale. Res. High. Educ. 2003, 44, 473–494. [Google Scholar] [CrossRef]
  45. Hyun, S.H.; Rogers, J.; House, S.; Sorkness, C.; Pfund, C. Revalidation of the Mentoring Competency Assessment to Evaluate Skills of Research Mentors: The MCA-21. J. Clin. Transl. Sci. 2022, 6, e46. [Google Scholar] [CrossRef] [PubMed]
  46. Fleming, M.; House, S.; Hanson, V.S.; Yu, L.; Garbutt, J.; McGee, R.; Kroenke, K.; Abedin, Z.; Rubio, D. The Mentoring Competency Assessment: Validation of a New Instrument to Evaluate Skills of Research Mentors. Acad. Med. 2013, 88, 1002–1008. [Google Scholar] [CrossRef] [PubMed]
  47. Pfund, C.; House, S.C.; Asquith, P.; Fleming, M.F.; Buhr, K.A.; Burnham, E.L.; Eichenberger Gilmore, J.; Huskins, C.; McGee, R.; Schurr, K.; et al. Training Mentors of Clinical and Translational Research Scholars: A Randomized Controlled Trial. Acad. Med. 2014, 89, 774–782. [Google Scholar] [CrossRef] [PubMed]
  48. Fedesco, H.; Kraner, E.; Dolan, E. Evaluating the Feasibility, Utility, and Impact of Engaging in Mentorship Assessment to Improve Doctoral Mentoring Relationships. New Dir. Teach. Learn. 2023, 176, 95–105. [Google Scholar] [CrossRef]
  49. University of Georgia Assessing Graduate Student Mentorship. Available online: https://spree.franklinresearch.uga.edu/research/content/assessing-graduate-student-mentorship (accessed on 1 May 2024).
  50. Morgenroth, T.; Ryan, M.; Peters, K. The Motivational Theory of Role Modeling: How Role Models Influence Role Aspirants’ Goals. Rev. Gen. Psychol. 2015, 19, 465–483. [Google Scholar] [CrossRef]
  51. Passi, V.; Johnson, N. The Impact of Positive Doctor Role Modeling. Med. Teach. 2016, 38, 1139–1145. [Google Scholar] [CrossRef] [PubMed]
  52. Topliceanu, A.-M.; McCance, K.; Blanchard, M.; Sollinger, J. Graduate STEM Students as Role Models for High School Students. Front. Educ. 2025, 10, 1547938. [Google Scholar] [CrossRef]
  53. Topliceanu, A.-M. Mentoring Experiences of Graduate STEM Students. Doctoral Dissertation, North Carolina State University, Raleigh, NC, USA, 2025. [Google Scholar]
  54. Hinkin, T. A Brief Tutorial on the Development of Measures for Use in Survey Questionnaires. Organ. Res. Methods 1998, 1, 104–121. [Google Scholar] [CrossRef]
  55. Taherdoost, H. Validity and Reliability of the Research Instrument; How to Test the Validation of a Questionnaire/Survey in a Research. SSRN Electron. J. 2016, 5, 28–36. [Google Scholar] [CrossRef]
  56. Mertens, D. Research and Evaluation in Education and Psychology: Integrating Diversity with Quantitative, Qualitative, and Mixed Methods; SAGE Publications: Thousand Oaks, CA, USA, 2019. [Google Scholar]
  57. Schafer, J. Multiple Imputation: A Primer. Stat. Methods Med. Res. 1999, 8, 3–15. [Google Scholar] [CrossRef] [PubMed]
  58. Child, D. The Essentials of Factor Analysis, 3rd ed.; Continuum International Publishing Group: New York, NY, USA, 2006. [Google Scholar]
  59. Finch, W.H. Exploratory Factor Analysis; SAGE Publications: Thousand Oaks, CA, USA, 2019. [Google Scholar]
  60. Yong, A.G.; Pearce, S. A Beginner’s Guide to Factor Analysis: Focusing on Exploratory Factor Analysis. Tutor. Quant. Methods Psychol. 2013, 9, 79–94. [Google Scholar] [CrossRef]
  61. Orcan, F. Parametric or Non-Parametric: Skewness to Test Normality for Mean Comparison. Int. J. Assess. Tools Educ. 2020, 7, 255–265. [Google Scholar] [CrossRef]
  62. Fabrigar, L.; Wegener, D.; MacCallum, R.; Strahan, E. Evaluating the Use of Exploratory Factor Analysis in Psychological Research. Psychol. Methods 1999, 4, 272–299. [Google Scholar] [CrossRef]
  63. Guadagnoli, E.; Velicer, W.F. Relation to Sample Size to the Stability of Component Patterns. Psychol. Bull. 1988, 103, 265–275. [Google Scholar] [CrossRef] [PubMed]
  64. Field, A. Discovering Statistics Using SPSS: Introducing Statistical Method, 3rd ed.; SAGE Publications: Thousand Oaks, CA, USA, 2009. [Google Scholar]
  65. Costello, A.; Osborne, J. Best Practices in Exploratory Factor Analysis: Four Recommendations for Getting the Most from Your Analysis. Pract. Asses. Res. Eval. 2005, 10, 1–9. [Google Scholar] [CrossRef]
  66. Tabachnick, B.; Fidell, L. Using Multivariate Statistics, 7th ed.; Pearson Education: Hoboken, NJ, USA, 2019. [Google Scholar]
  67. Cohen, J. Set Correlation and Contingency Tables. Appl. Psychol. Meas. 1988, 12, 425–434. [Google Scholar] [CrossRef]
  68. Cortina, J. What Is Coefficient Alpha? An Examination of Theory and Applications. J. Appl. Psychol. 1993, 78, 98–104. [Google Scholar] [CrossRef]
  69. Ostertagova, E.; Ostertag, O.; Kováč, J. Methodology and Application of the Kruskal-Wallis Test. Appl. Mech. Mater. 2014, 611, 115–120. [Google Scholar] [CrossRef]
  70. Asnawi, A.; Gravell, A.; Wills, G. Factor Analysis: Investigating Important Aspects for Agile Adoption in Malaysia; IEEE: New York, NY, USA, 2012; pp. 60–63. [Google Scholar] [CrossRef][Green Version]
  71. De Vaus, D. Surveys in Social Research, 6th ed.; Routledge: Oxfordshire, UK, 2013. [Google Scholar]
  72. Roach, M.; Sauermann, H. The Declining Interest in an Academic Career. PLoS ONE 2017, 12, e0184130. [Google Scholar] [CrossRef] [PubMed]
  73. Johnson, R.; Christensen, L. Educational Research: Quantitative, Qualitative, and Mixed Approaches, 3rd ed.; SAGE: Thousand Oaks, CA, USA, 2008. [Google Scholar]
  74. Wu, M.-J.; Zhao, K.; Fils-Aime, F. Response Rates of Online Surveys in Published Research: A Meta-Analysis. Comput. Hum. Behav. Rep. 2022, 7, 100206. [Google Scholar] [CrossRef]
  75. Deng, H.; Wu, W.; Zhang, Y.; Yu, Z.; Xu, H.; Wu, W. Exploring the Differential Effects of Career and Psychosocial Mentoring on Newcomer Socialization. Front. Psychol. 2022, 13, 975064. [Google Scholar] [CrossRef] [PubMed]
  76. Hagler, M. Mentoring First-generation College Students: Examining Distinct Relationship Profiles Based on Interpersonal Characteristics, Support Provision, and Educational Capital. J. Community Psychol. 2023, 51, 3103–3120. [Google Scholar] [CrossRef] [PubMed]
  77. Amador-Campos, J.; Peró-Cebollero, M.; Feliu-Torruella, M.; Pérez-González, A.; Cañete-Massé, C.; Jarne-Esparcia, A.; Triadó-Ivern, X.; Guàrdia-Olmos, J. Mentoring and Research Self-Efficacy of Doctoral Students: A Psychometric Approach. Educ. Sci. 2023, 13, 358. [Google Scholar] [CrossRef]
  78. Sim, L.A.; Vickers, K.S.; Croarkin, P.E.; Williams, M.D.; Clark, M.M.; Derscheid, D.J.; Lapid, M.I. The Relationship of Mentorship to Career Outcomes in Academic Psychiatry and Psychology: A Needs Assessment. Acad. Psychiatry J. Am. Assoc. Dir. Psychiatr. Resid. Train. Assoc. Acad. Psychiatry 2023, 47, 521–525. [Google Scholar] [CrossRef] [PubMed]
  79. Eby, L.T.; Allen, T.D.; Evans, S.C.; Ng, T.; Dubois, D. Does Mentoring Matter? A Multidisciplinary Meta-Analysis Comparing Mentored and Non-Mentored Individuals. J. Vocat. Behav. 2008, 72, 254–267. [Google Scholar] [CrossRef] [PubMed]
  80. Sinche, M.; Layton, R.; Brandt, P.D.; O’Connell, A.; Hall, J.; Freeman, A. An Evidence-Based Evaluation of Transferrable Skills and Job Satisfaction for Science PhDs. PLoS ONE 2017, 12, e0185023. [Google Scholar] [CrossRef] [PubMed]
  81. Chandler, D.; Kram, K.; Yip, J. An Ecological Systems Perspective on Mentoring at Work: A Review and Future Prospects. Acad. Manag. Ann. 2011, 5, 519–570. [Google Scholar] [CrossRef]
  82. The Employment Situation—March 2026. Available online: https://www.bls.gov/news.release/empsit.htm (accessed on 25 March 2026).
  83. Maloy, J.; Kwapisz, M.; Hughes, B. Factors Influencing Retention of Transgender and Gender Nonconforming Students in Undergraduate STEM Majors. CBE—Life Sci. Educ. 2022, 21, ar13. [Google Scholar] [CrossRef] [PubMed]
  84. Steele, L.M.; Johnson, J.F.; Watts, L.L.; Macdougall, A.E.; Mumford, M.D.; Connelly, S.; Lee Williams, T.H. A Comparison of the Effects of Ethics Training on International and US Students. Sci. Eng. Ethics 2016, 22, 1217–1244. [Google Scholar] [CrossRef] [PubMed]
  85. Han, X.; Appelbaum, R. Will They Stay or Will They Go? Ewing Marion Kauffman Foundation: Kansas City, MI, USA, 2016. [Google Scholar]
  86. Choe, N.H.; Borrego, M. Master’s and Doctoral Engineering Students’ Interest in Industry, Academia, and Government Careers. J. Eng. Educ. 2020, 109, 325–346. [Google Scholar] [CrossRef]
  87. Zhang, Q. Navigating Barriers and Mentoring Support: The Career Goals of Women Doctoral Students in Chemistry. J. Chem. Educ. 2024, 101, 319–327. [Google Scholar] [CrossRef]
  88. Morris, M.; Hensel, R.; Dygert, J. Why Do Students Leave? An Investigation into Why Well-Supported Students Leave a First-Year Engineering Program. In Proceedings of the 2019 ASEE Annual Conference & Exposition, Tampa, FL, USA, 15–19 June 2019. [Google Scholar] [CrossRef]
  89. Harshman, J. Review of the Challenges That Face Doctoral Education in Chemistry. J. Chem. Educ. 2020, 98, 259–269. [Google Scholar] [CrossRef]
Figure 1. Overview of the Motivational Theory of Role Modelling (adapted from Morgenroth et al. [50], Topliceanu et al. [52], and Topliceanu [53]).
Higheredu 05 00057 g001
Figure 2. Significant differences in students’ perceptions of their mentoring experiences based on gender, citizenship status, and stage in the program.
Higheredu 05 00057 g002
Figure 3. Alignment between Yob and Crawford [9] (in purple boxes), Outcome Variables from MEGSS (in white boxes, blue font), and Morgenroth et al.’s [50] Frameworks. (Note: This figure was adapted from Topliceanu, Topliceanu et al., Morgenroth et al., Yob & Crawford [9,50,52,53]).
Higheredu 05 00057 g003
Figure 4. Recommendations for Mentors and University Programs (This figure was reproduced from Topliceanu [53]).
Higheredu 05 00057 g004
Table 1. Graduate STEM students’ self-reported demographic information.
GenderTotal (N = 280)Percent (%)
Male14451.4
Female12745.4
Non-binary82.9
Prefer to describe10.4
Racial identity
American Indian or Alaskan Native10.4
Asian6021.4
Black or African American176.1
Middle Eastern93.2
Indian2910.4
White14351.1
Prefer to self-describe217.5
Ethnic Identity
Hispanic or Latino/a227.9
Not Hispanic or Latino/a24186.1
Prefer to self-describe176.1
International Status
International12243.6
Not international15856.4
Enrollment Status
Part time124.3
Full time26895.7
Level of Graduate Program
M.S. degree (thesis)10.4
Ph. D. (doctoral thesis)27999.6
Stage of the doctoral/master’s program
Early (beginning coursework)5519.6
Middle (finishing coursework)9533.9
Late (working on dissertation)13046.4
Number of years working with the mentor
16523.2
25820.7
36924.6
44917.5
5217.5
693.2
7+93.2
Academic Discipline
Agriculture and/or Natural Resources3813.6
Biological and/or Biomedical Sciences3211.4
Computer and/or Information Sciences207.1
Engineering12243.6
Geosciences, Atmospheric Sciences, and Oceanic Sciences113.9
Mathematics and/or Statistics186.4
Physical Sciences258.9
Other145
Note: This table was reproduced from Topliceanu [53].
Table 2. Factor Correlation Matrix.
FactorPsychosocial SupportProgram CompletionResearch and WritingCareer ExpectationsCareer Support
Psychosocial Support1
Program Completion0.2171
Research and Writing0.5450.2761
Career Expectations−0.277−0.302−0.2811
Career Support0.5840.2430.552−0.2471
Note: This table was reproduced from Topliceanu [53].
Table 3. Cronbach’s alpha for the 5-factor model.
FactorNumber of ItemsEigenvaluesExplained Variance (%)Cumulative Explained Variance (%)Cronbach’s Alpha
Psychosocial Support1416.65043.81643.8160.96
Program Completion52.3496.18249.9980.80
Research and Writing91.5003.94853.9460.91
Career Expectations31.3623.58457.5310.81
Career Support71.0062.64760.1770.89
Note: This table was reproduced from Topliceanu [53].
Table 4. Pattern Matrix.
Factor 1Psychosocial SupportLoading
psych1My mentor cares about me as a whole person, not just as a researcher.0.798
psych2My mentor is friendly to me.0.784
psych3My mentor has reasonable expectations for my workload.0.761
psych4My mentor is supportive of my personal identity.0.753
psych5My mentor is understanding of my needs as a graduate student.0.730
psych6My mentor is someone I trust.0.722
psych7My mentor encourages me.0.693
psych8My mentor acts in my best interest.0.614
psych9My mentor and I feel comfortable talking about things other than research.0.613
psych10My mentor gives me an appropriate level of independence.0.580
psych11My mentor advocates for me when necessary.0.554
psych12My mentor serves as a role model for me.0.533
psych13My mentor works with me to align our expectations on our mentoring relationship.0.428
psych14My mentor helps me secure the resources I need for academic success.0.353
Factor 2 Program Completion
progr1I expect to complete my thesis/dissertation.0.897
progr2I expect to graduate.0.824
progr3I am productive in my academic writing.0.484
progr4I am productive in my research.0.475
progr5I expect to achieve my master’s/doctoral program milestones in a timely manner.0.458
Factor 3 Research and Writing
res1My mentor helps me improve my scientific writing.0.726
res2My mentor provides me timely feedback.0.667
res3My mentor helps me write my research for publication.0.663
res4My mentor works with me to set research goals.0.643
res5My mentor provides me useful feedback.0.621
res6My mentor is available when I need them.0.567
res7My mentor helps me prepare to present my research.0.495
res8My mentor keeps up with my development.0.464
res9My mentor provides me with information about resources relevant to my work.0.447
Factor 4 Career Expectations
carexp1I feel prepared for my career.−0.897
carexp2I expect to obtain a desired job.−0.840
carexp3I expect to achieve my career goals.−0.566
Factor 5 Career Support
carsupp1My mentor helps me develop professional relationships with others in the field.0.680
carsupp2My mentor provides guidance on career development.0.661
carsupp3My mentor provides useful information about various career paths inside academia.0.658
carsupp4My mentor provides useful information about various career paths outside academia.0.621
carsupp5My mentor provides opportunities for me to learn about grant proposal writing.0.455
carsupp6My mentor takes time to learn about my career goals.0.397
carsupp7My mentor challenges me to grow and develop professionally.0.376
Note: This table was reproduced fromTopliceanu [53].
Table 5. Mean scores of significant items by gender.
Male (n = 144)Female (n = 127)Nonbinary (n = 8)Prefer to Self-Describe (n = 1)
ItemMSDMSDMSDMSD
psych74.03 *1.0133.98 *0.9845.00 *0.003.00N/A
psych104.28 *0.9044.00 *0.9764.750.4633.00N/A
psych114.15 *0.9933.77 *1.1004.88 *0.3544.00N/A
res43.93 *1.0693.89 *1.0334.88 *0.3543.00N/A
res54.05 *0.9853.911.004.75 *0.4633.00N/A
res94.08 *0.9933.910.9354.88 *0.3543.00N/A
carsupp13.81 *1.1423.68 *1.1744.75 *0.4634.00N/A
carsupp42.93 *1.1813.24 *1.2504.50 *1.0693.00N/A
Note. * denotes significant relationship (p < 0.05). M represents mean value. SD stands for standard deviation. This table was reproduced from Topliceanu [53].
Table 6. Mean scores of significant items by stage in the program.
Early (n = 55)Middle (n = 95)Late (n = 130)
ItemMSDMSDMSD
psych14.00 *1.3483.971.1313.97 *1.139
psych33.25 *1.1383.821.1053.79 *1.110
psych123.42 *1.3113.691.2233.68 *1.226
psych133.50 *1.3143.52 *1.0893.52 *1.097
progr14.67 *0.6514.380.7734.40 *0.769
res23.33 *1.4353.761.1243.74 *1.139
res63.92 *1.2404.04 *0.9374.04 *0.950
res93.83 *0.9374.030.9694.03 *0.967
carsupp13.83 *1.1153.77 *1.1573.781.153
carsupp42.92 *1.3113.121.2353.11 *1.236
carsupp73.67 *0.9853.94 *0.9933.93 *0.992
Note. * denotes significant relationship (p < 0.05). Comparison groups are outlined in the text. M represents mean value. SD stands for standard deviation. This table was reproduced from Topliceanu [53].
Table 7. Composite scores for the five subscales.
SubscaleMSD95% Confidence Interval
Psychosocial Support3.920.873.824.02
Program Completion3.990.623.914.06
Research and Writing3.880.793.793.97
Career Expectations3.730.763.633.82
Career Support3.500.873.393.60
Note. M represents mean value. SD stands for standard deviation. This table was reproduced from Topliceanu [53].
Table 8. Regression of Psychosocial Support, Research and Writing, and Career Support on Program Completion.
PredictorCoefficientSEp95% Confidence Interval
Intercept2.73 *0.18<0.012.383.06
Psychosocial Support0.070.070.327−0.070.210
Research and Writing0.22 *0.070.0020.080.38
Career Support0.040.0700.507−0.0860.18
Note: * denotes significant relationship (p < 0.05). This table was reproduced from Topliceanu [53].
Table 9. Regression of psychosocial support, research and writing, and career support on career expectations.
PredictorCoefficientSEp95% Confidence Interval
Intercept2.25 *0.22<0.011.812.69
Psychosocial Support0.100.090.26−0.760.28
Research and Writing0.120.090.19−0.060.29
Career Support0.18 *0.090.040.010.34
Note. * denotes significant relationship (p < 0.05). This table was reproduced from Topliceanu [53].
Disclaimer/Publisher’s Note: The statements, opinions and data contained in all publications are solely those of the individual author(s) and contributor(s) and not of MDPI and/or the editor(s). MDPI and/or the editor(s) disclaim responsibility for any injury to people or property resulting from any ideas, methods, instructions or products referred to in the content.