3.1. Feature Analysis
In
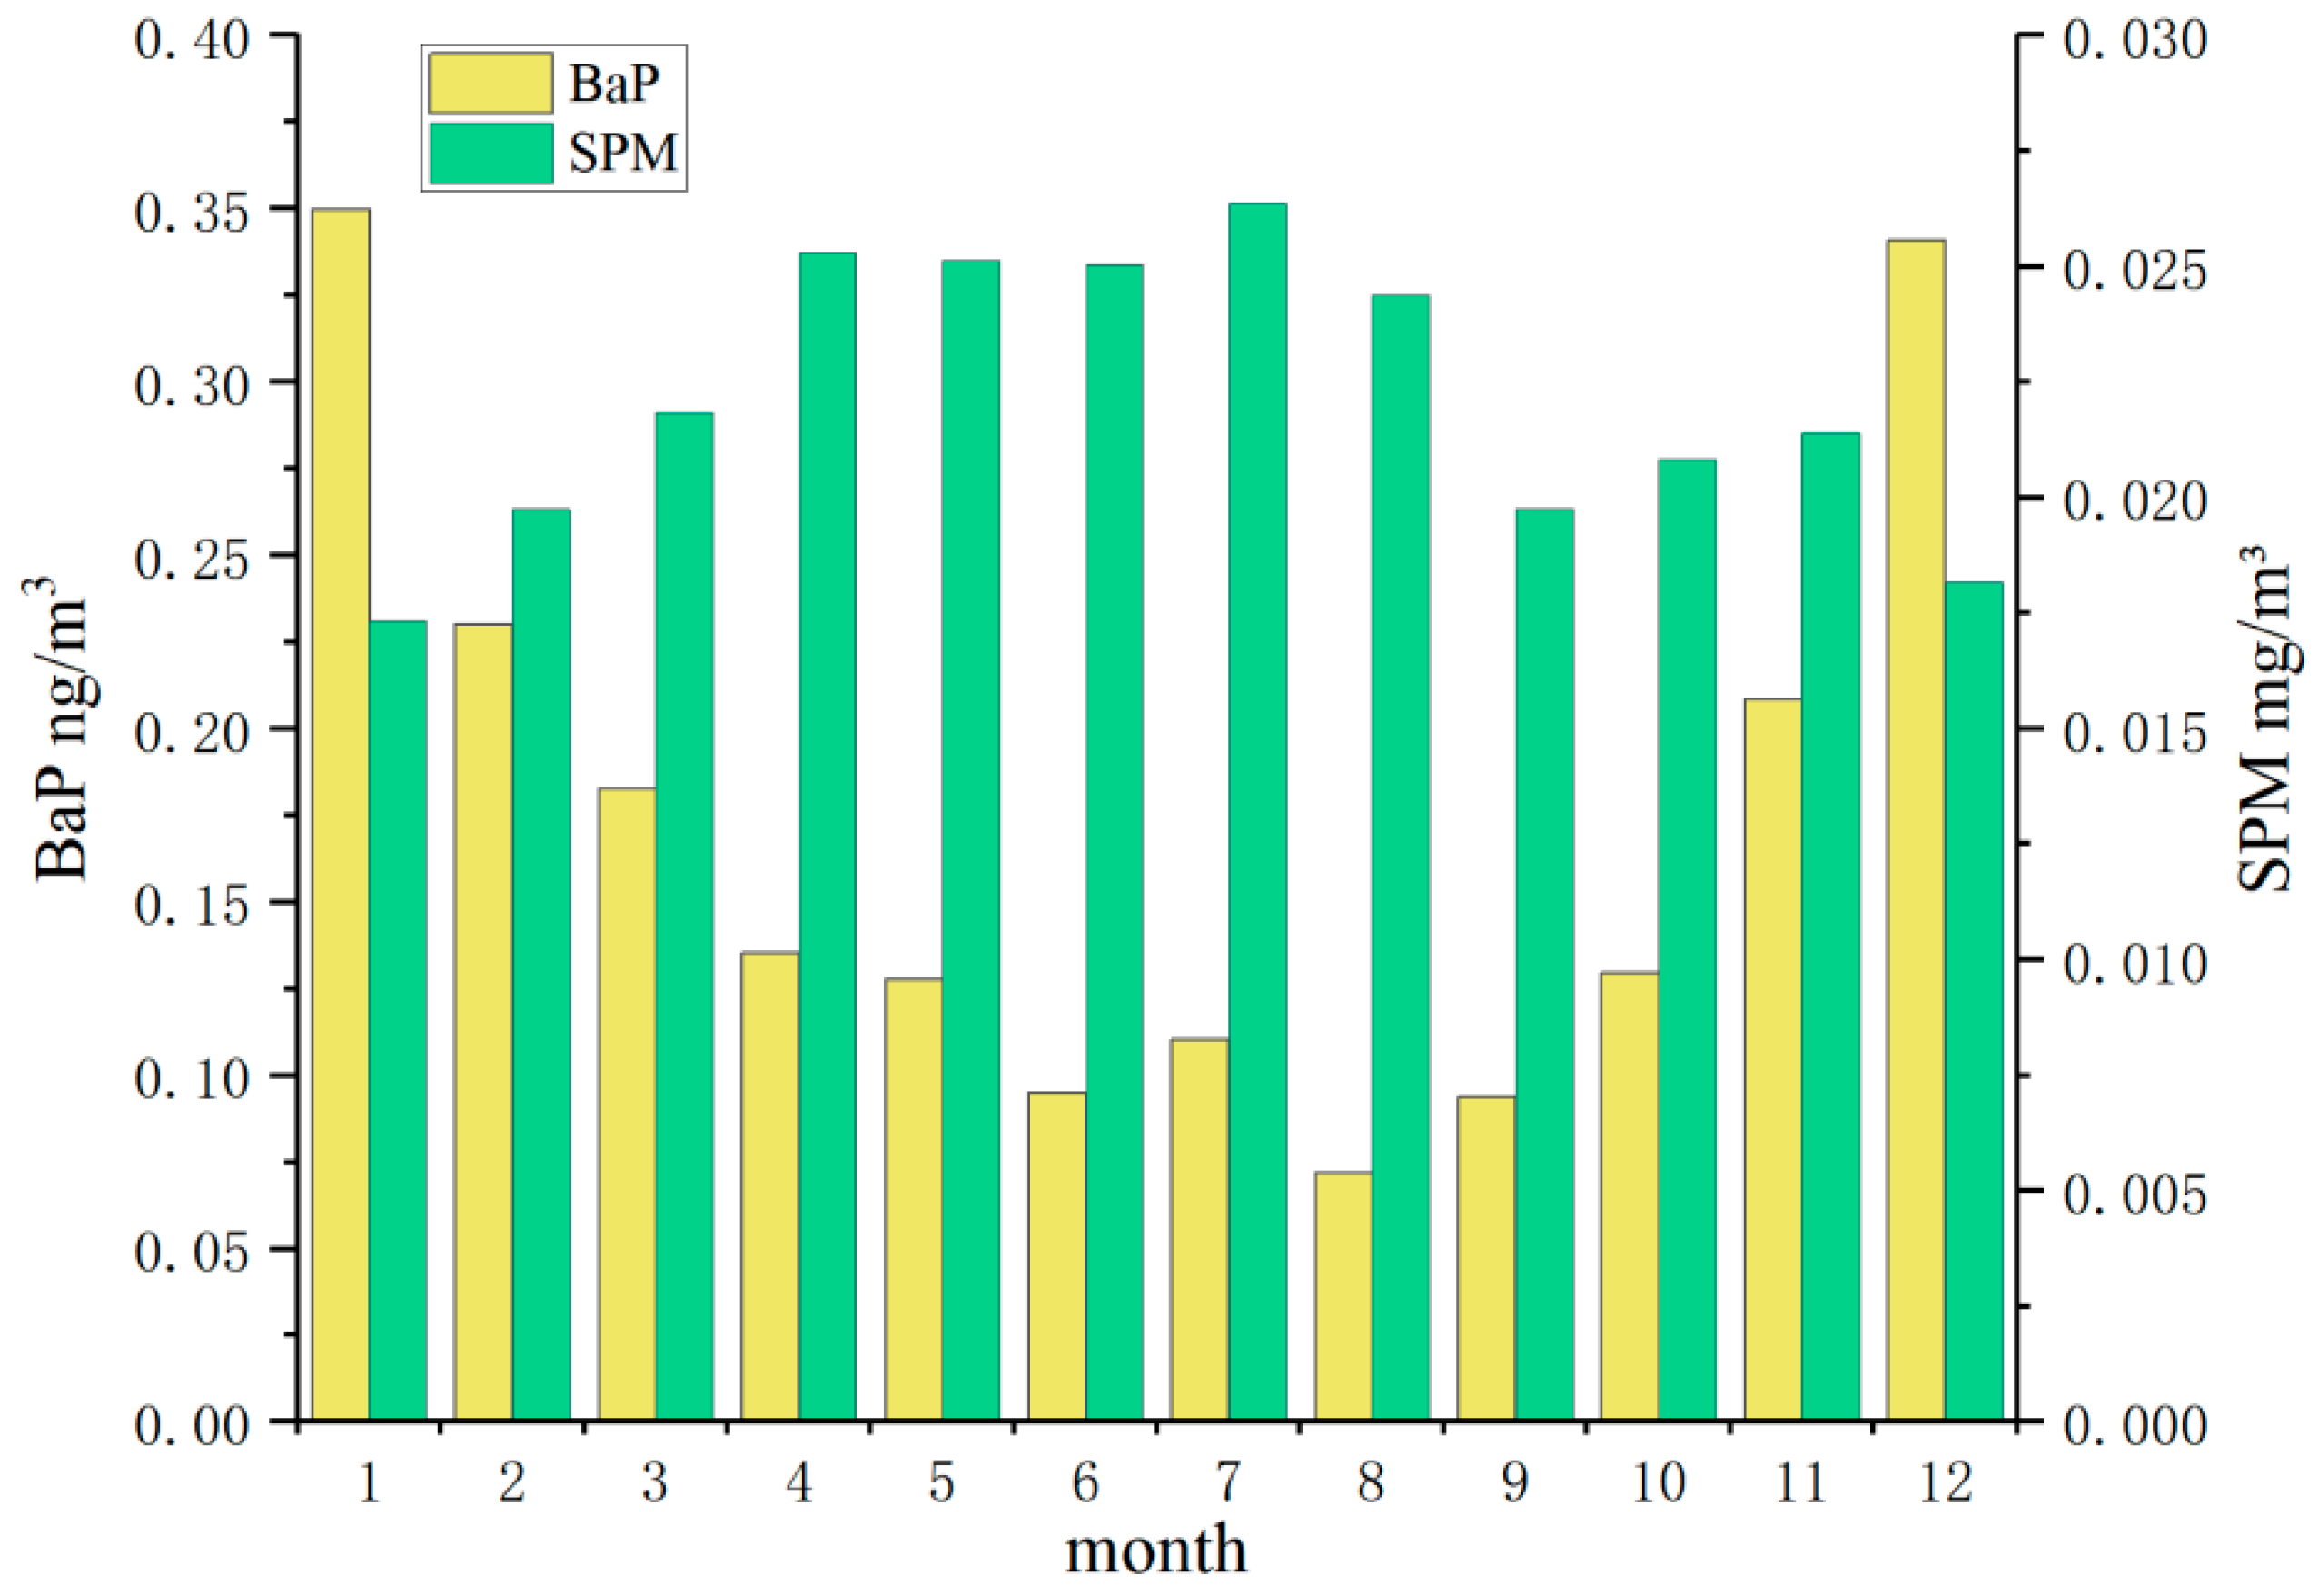
Figure 4, the overall monthly average of B(a)P was approximately twofold lower during the warm seasons (spring–summer: March–August) compared with that during the cold season (autumn–winter: September–February). From November to February, the monthly averages of B(a)P were relatively high, ranging from ~0.2 to 0.35 ng/m
3. During summer, the lowest value was reported in August, ~0.07 ng/m
3. This pronounced seasonal variation is primarily attributed to the enhanced atmospheric degradation of B(a)P during the warmer months, which is driven by two key mechanisms:
Photodegradation: Strong summer UV irradiation promotes B(a)P decomposition, as reflected by the significantly lower BaP/BeP ratio in warm seasons (0.66) compared with that in winter (1.08) [
36]. To quantify this effect, a vapor-phase reaction model incorporating stepwise repartitioning was applied. This revealed that B(a)P’s atmospheric half-life decreases to 8 h under summer conditions (high OH radical concentration: 5 × 10
6 cm
−3; 99% vapor-phase reaction), whereas it extends to 770 h in winter (low OH: 0.5 × 10
6 cm
−3; 90–99% particle-bound) [
37]. These results align with the observed August minimum (0.07 ng/m
3) and explain B(a)P’s persistence in cold seasons.
Ozonolysis: Elevated ozone levels from spring to summer [
38] further accelerate B(a)P degradation as its molecular structure is particularly vulnerable to ozone-induced oxidative cleavage. The synergy between photolysis and ozonolysis dominates over potential emission source variations, considering Kyoto’s reliance on electric heating in winter, which minimizes combustion-related B(a)P emissions.
In contrast to B(a)P, SPM exhibited an opposite seasonal trend, with higher monthly averages in warm seasons. This divergence arises from the following distinct physicochemical drivers:
Secondary aerosol formation: Active photochemical reactions in summer promote the oxidation of SO2 and NOx to sulfate and nitrate aerosols, significantly increasing the SPM mass.
Non-combustion contributions:
Biogenic secondary organic aerosols (SOA): Warm-season emissions of biogenic volatile organic compounds are oxidized to SOA, contributing to SPM.
Resuspended dust: Increased wind speeds and anthropogenic activities in spring/summer promote dust resuspension.
Regional transport: Prevailing wind patterns in Kyoto during warm seasons may import aerosols from industrial/urban areas.
Suppressed winter combustion sources: Unlike coal-dependent regions, Kyoto reduces its direct SPM emissions in winter through its electric heating practices, decoupling its seasonality from B(a)P.
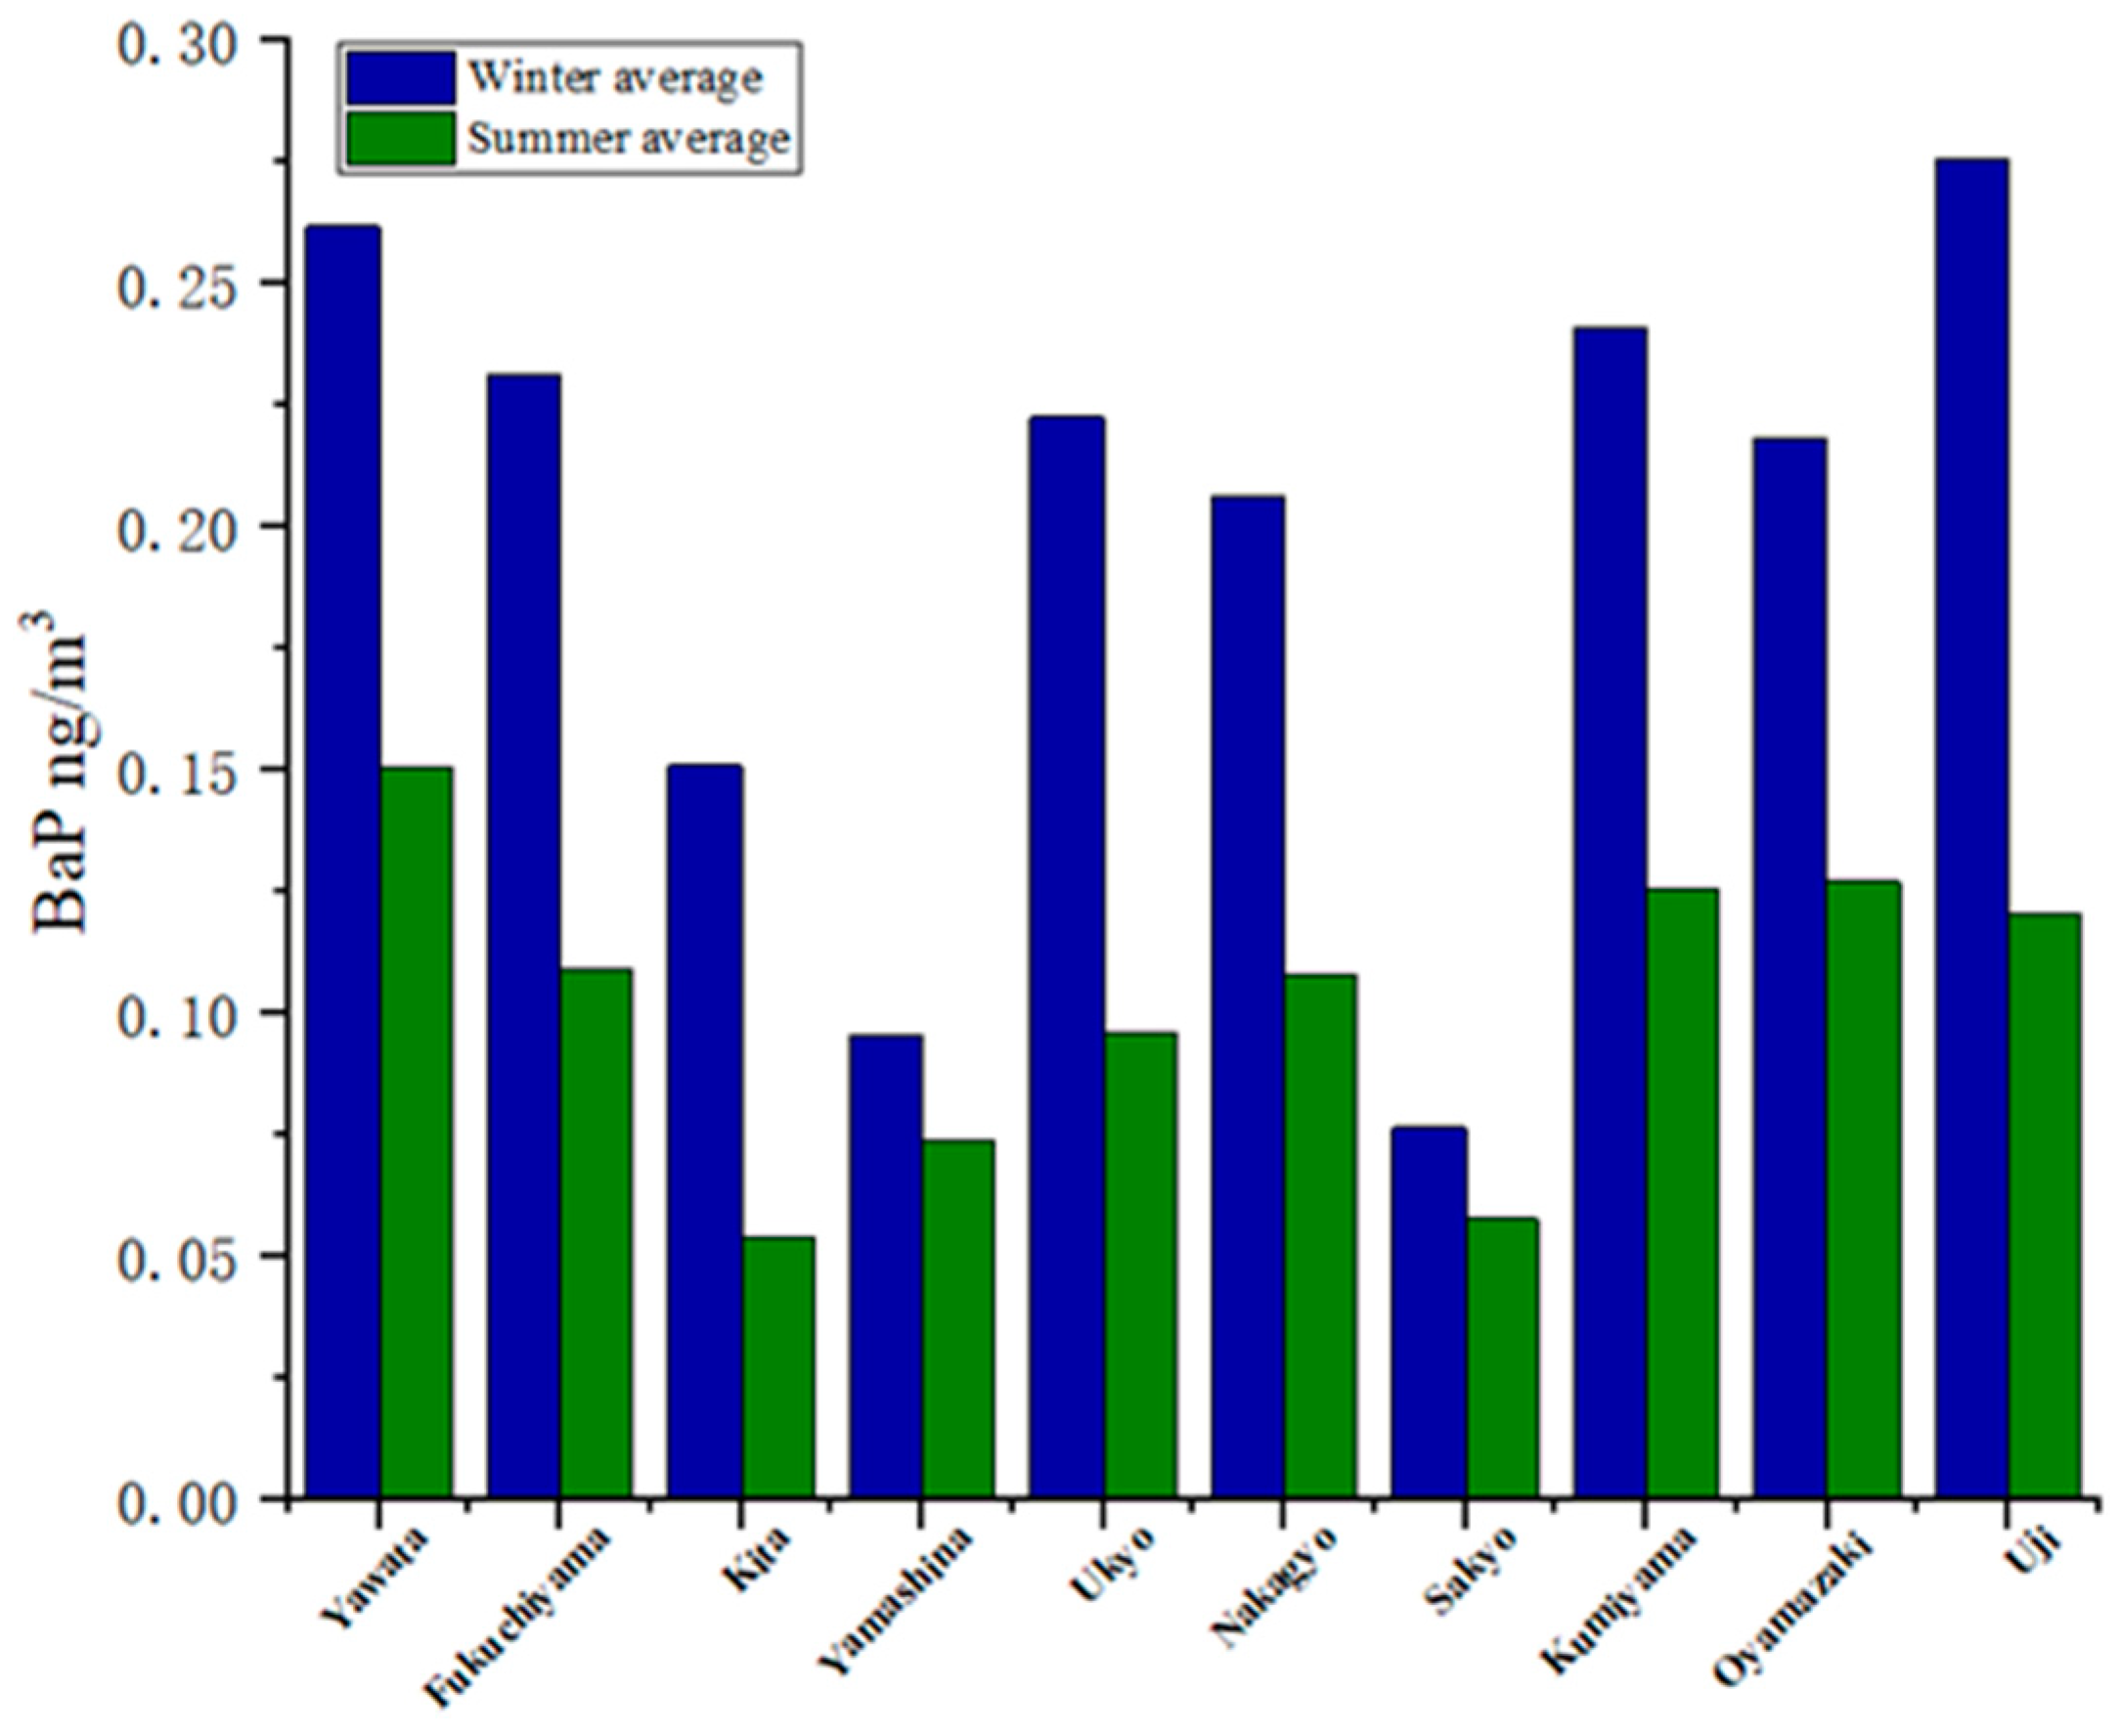
Figure 5 and
Figure 6 show the seasonal variations in the B(a)P and SPM concentrations during warm and cold seasons across various regions, as detailed in
Table A1 and
Table A2 of
Appendix A.2. The average B(a)P concentration was higher in the cold season than that in the warm season by ~1.3–3 times; similar results were reported in previous studies [
39,
40].
High B(a)P concentrations were observed because industrial parks in cities such as Yahata City and Fukuchiyama City generate high amounts of pollutants. These industrial parks are surrounded by abundant transportation hubs, and transportation logistics rely more on heavy-duty trucks that use diesel fuel. These factors are accompanied by unfavorable meteorological conditions such as atmospheric stability layers, low wind speed, or lack of precipitation during the cold season. In contrast, the average SPM was lower (by approximately half) in the cold season than in the warm season. The seasonal variations in B(a)P and SPM concentration were mainly due to differences in their sources and atmospheric behavior mechanisms. The seasonal variations in B(a)P were highly influenced by fuel combustion emissions and photochemical degradation, whereas those in SPM were influenced by secondary particulate matter generation and dust lifting.
3.2. Association Relationships
The influence mechanism of SPM and meteorological factors over low, medium, and high B(a)P concentrations was determined based on 69 strong association rules. These rules were analyzed and arranged in an ascending order based on the dimensionality of influencing factors in the antecedent. A total of 58 strong association rules were mined at low B(a)P concentration (<0.185 ng/m
3), spanning from one-dimensional to two-dimensional association rules.
Table 3 shows the 1 one-dimensional association rule and 18 2D association rules.
Numbers 0 and 4 indicate that adding humidity to high temperatures increases the confidence by 3%, suggesting that humidity considerably influences B(a)P concentrations for maintaining it at low levels. A comparison of numbers 8, 9, 16, and 19 reveals that rising temperatures increase the likelihood of B(a)P remaining at a low concentration by 7%. Numbers 11 and 12 show that higher pressure decreases the confidence by 3%, highlighting an inverse relationship. Numbers 17 and 18 indicate that as the wind speed increases, the confidence increases by 8%. These findings indicate that low humidity, low pressure, high wind speed, and high temperatures contribute to maintaining B(a)P at low concentrations.
In one-dimensional association rules, the probability of B(a)P being at a low concentration (B1) is 91.95% at high temperatures (T3). By integrating additional factors, this rule evolves into a 2D association rule. Excluding the influence of SPM and focusing solely on meteorological factors, numbers 1 and 4 reveal that transitioning from low pressure (P1) to high temperature (T3) reduces the confidence from 100% to 92.85% under low humidity (H1). This indicates that low pressure is more sensitive to B(a)P concentrations than high temperatures (P > T). A comparison of numbers 1 and 9 indicates that, at low pressure and when transitioning from low humidity to high temperature, confidence decreases from 100% to 93.42%; this suggests that humidity has higher sensitivity than temperature (H > T). A comparison of numbers 4 and 9 shows that at constant temperatures, confidence increases when transitioning from low humidity to low pressure. This further emphasizes that pressure is more influential than humidity (P > H). Therefore, the sensitivity ranking of meteorological factors is as follows: pressure > humidity > temperature.
A comparison of numbers 4, 5, 9, 11, 13, and 14 revealed that high wind speed consistently exhibits higher confidence than high temperature. Thus, temperature sensitivity was lower than wind speed sensitivity (T < WS). A comparison of numbers 1 and 11 under constant pressure conditions showed that low humidity demonstrated a 5% higher confidence than high wind speed, suggesting that humidity sensitivity exceeded wind speed sensitivity (WS < H). Based on these findings, the preliminary sensitivity ranking of meteorological factors is pressure > humidity > wind speed > temperature.
By transitioning to three-dimensional association rules, the conclusions drawn from the two-dimensional association rule mining are further compared in
Table 4. By incorporating the influence of SPM into the association rules, phenomena contrary to those reported in
Table 3 were observed. Analyzing the relationships captured in rules (23, 34, 40) and (29, 37) revealed that as humidity increased to the highest level and SPM remained at medium or high concentrations under high temperatures, the confidence decreased from 100% to 90.91% and 94.74%. This high humidity reduced the likelihood of B(a)P remaining at a low concentration. Similarly, when pressure was analyzed alongside SPM and temperature in rules 41 and 48, increasing pressure increased the confidence level from 96.15% to 100%. This trend contradicted the findings of the 2D association rules. This discrepancy can be attributed to the low SPM concentration in the air and high temperatures, which facilitated the volatilization, dispersion, and photochemical degradation of B(a)P.
A comparison of rule pairs (20, 21), (38, 39), (45, 46), and (55, 56) revealed that, with the other two factors held constant, an increase in wind speed increased the confidence by ~6% to −10%. This indicated that wind speed positively influenced the dispersion of B(a)P. A comparison of rules 51, 52, 54, and 56 indicated that the effect of temperature on B(a)P was consistent with the findings of 2D association rules. As the temperature increased, the confidence level increased by ~10%. By integrating the influence of SPM into the association rules, varying confidence levels were observed under different meteorological conditions, even when the B(a)P concentration was constant. A comparison of rules 33, 34, and 35 revealed that high SPM concentrations, high temperature, and moderate humidity gradually decreased the confidence levels. This observation indicated that meteorological conditions facilitated the dispersion of pollutants, thereby maintaining consistently low B(a)P concentrations. A different pattern was evident in rules 41 and 44, where low-pressure conditions combined with high temperatures indicated that B(a)P concentrations were affected by SPM concentrations.
The sensitivity of meteorological factors was evaluated using 3D association rules rather than the 2D association rules. Specifically, rules 19–21 along with rules 35 and 36 demonstrated that wind speed sensitivity surpassed that of temperature, with higher confidence levels of 7–10% (T < WS). Moreover, rules 37 and 53 indicated that pressure sensitivity exceeded humidity sensitivity, with confidence levels higher by ~5% (P > H). A comparison of rules 32 and 47 revealed that the confidence level for humidity was 97.56%, slightly higher than that for wind speed at 97.06%. This indicated that humidity sensitivity marginally surpassed wind speed sensitivity (WS < H). The findings from the 3D association rules are consistent with those from the 2D association rules, which confirmed the following sensitivity ranking: pressure > humidity > wind speed > temperature.
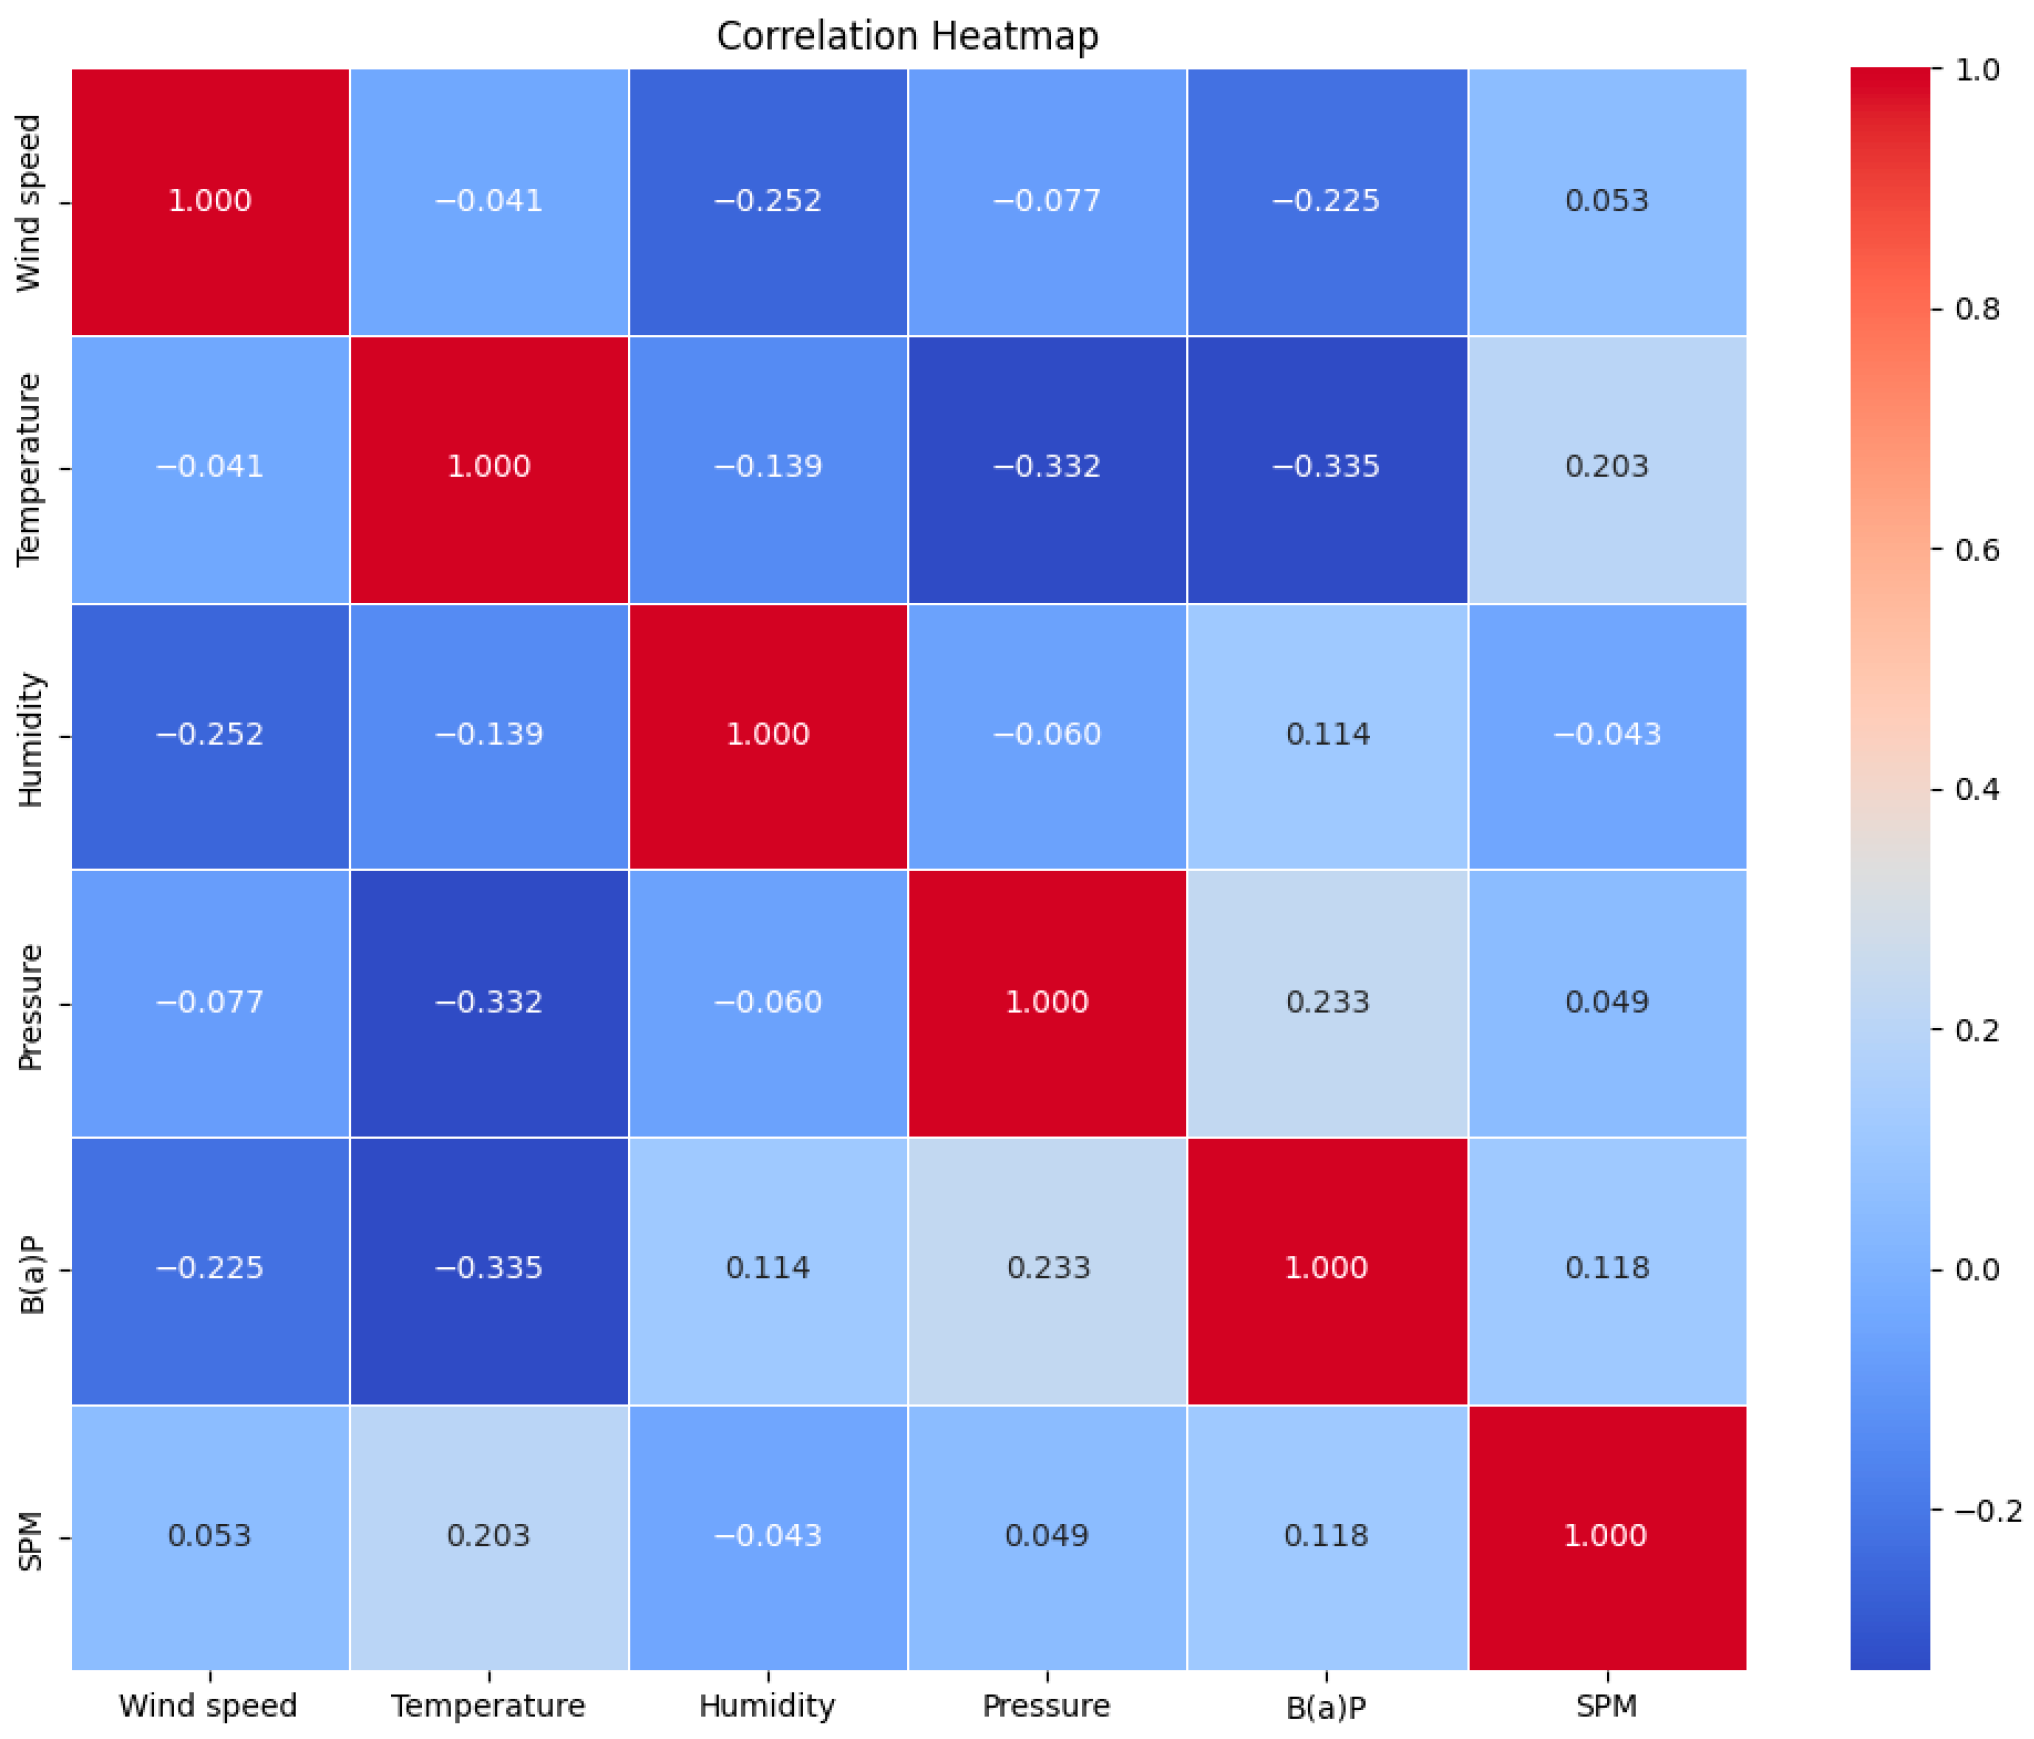
Empirical observations and meteorological mechanisms support the dominant role of atmospheric pressure in driving the correlations between PAHs and pollutants. Specifically, PAHs concentrations exhibit a highly significant positive correlation with atmospheric pressure compared with other meteorological parameters (e.g., r = 0.868,
p < 0.01) [
41]. This can be explained by contrasting pressure-driven dispersion patterns:
Importantly, the sensitivity to pressure variations is most pronounced under the low-concentration B(a)P conditions in our study. This differential response highlights the critical regulatory role of pressure-driven suppression of atmospheric dispersion in governing the dynamics of low-concentration PAHs.
When the B(a)P concentration was at a low level (B1), the antecedents of the 3D association rules comprised all influencing factors, thereby rendering the further analysis of the four-dimensional association rules unnecessary.
At medium and high B(a)P concentrations (>0.185 ng/m
3), two strong 2D, three 3D, and four 4D association rules were identified at the B2 level and two strong association rules were identified at the B3 level in
Table 5, completely encompassing the complete set of influencing factors. Compared with the low B(a)P concentrations, these rules primarily highlight the meteorological conditions of increasing pressure, decreasing temperature, and decreasing wind speed. High pressure stabilizes the atmosphere, reduces pollutant dispersion, and causes pollutant accumulation in localized areas. Lower temperatures enhance air stability, decrease convection, and promote the deposition and accumulation of pollutants. Lower wind speeds weaken the diffusion of particulate matter, resulting in higher B(a)P concentrations in the air. Moreover, lower temperatures may enhance B(a)P adsorption, further increasing B(a)P concentrations.
A comparison of rules 22 and 23 in
Table 4 with rule number 60 in
Table 5 revealed that a decrease in the temperature from high to low corresponded to an increase in the B(a)P concentration level. This finding highlighted the inverse relationship between temperature and B(a)P concentration, suggesting that lower temperatures contributed to higher B(a)P concentration. A comparison of rule number 19 (
Table 4) with rule number 63 (
Table 5) revealed that adding the SPM (SP3) influence to the association rules increased B(a)P concentrations. The combination of these results and the phenomenon of lower B(a)P concentrations indicated that SPM exerted a certain effect on the B(a)P concentration.
