Abstract
This paper describes an innovative method that recursively applies the machine learning Random Forest to an assumed homogeneous aerographic domain around measurement sites to predict concentrations and emissions of ammonia, an atmospheric pollutant that causes acidification and eutrophication of soil and water and contributes to secondary PM2.5. The methodology was implemented to understand the effects of weather and emission changes on atmospheric ammonia concentrations. The model was trained and tested by hourly measurements of ammonia concentrations and atmospheric turbulence parameters, starting from a constant emission scenario. The initial values of emissions were calculated based on a bottom-up emission inventory detailed at the municipal level and considering a circular area of about 4 km radius centered on measurement sites. By comparing predicted and measured concentrations for each iteration, the emissions were modified, the model’s training and testing were repeated, and the model converged to a very high performance in predicting ammonia concentrations and establishing hourly time-varying emission profiles. The ammonia concentration predictions were extremely accurate and reliable compared to the measured values. The relationship between NH3 concentrations and the calculated emissions rates is compatible with physical atmospheric turbulence parameters. The site-specific emissions profiles, estimated by the proposed methodology, clearly show a nonlinear relation with measured concentrations and allow the identification of the effect of atmospheric turbulence on pollutant accumulation. The proposed methodology is suitable for validating and confirming emission time series and defining highly accurate emission profiles for the improvement of the performances of chemical and transport models (CTMs) in combination with in situ measurements and/or optical depth from satellite observation.
1. Introduction
Atmospheric emissions of ammonia (NH3) can react with nitrogen and sulfur oxides, contributing significantly to the formation of secondary inorganic PM2.5 and leading to the acidification and eutrophication of soil and water [1]. The importance of monitoring atmospheric ammonia is well recognized, defining ammonia as one of the most crucial substances to monitor among greenhouse gases and particulate matter [2,3,4,5]. International and national regulations on air pollution require a reduction in atmospheric emissions of ammonia, as for nitrogen oxides (NOx), non-methane volatile organic compounds (NMVOCs), sulfur dioxide (SO2), and fine particulate matter (PM2.5) [6,7,8]. Emission inventories play a fundamental role in the estimation of emission reduction; their accuracy is a determinant in supporting air quality plans and policy makers [9,10].
In Europe, the agriculture sector contributes around 94% of total ammonia emissions [11], and this datum is confirmed in Italy [12] and in the Po River area, where the level is 97% [13]. The Po Valley, located in the northern part of Italy, is surrounded by mountains and is often affected by atmospheric stagnation and thermal inversion conditions. It is characterized by areas with high population density interspersed with heavily industrialized and intensive farming areas [14]. According to the national veterinary records office [15], about 80% of cows, swine, and poultry are bred in the regions of the Po Basin, determining a higher relative emission density of ammonia compared to the rest of Italy and EU-27 [13]. In northern Italy, livestock contribute around 83% of the total ammonia emissions, and the use of mineral fertilizers contributes 15%. NH3 emissions from livestock occur during animal housing, manure storage, spreading, and grazing, though the latter phase is relatively negligible, considering the intensive level of farming in northern Italy. The contribution of NH3 emissions to the formation of secondary particulate matter is highlighted for the Po Basin by different studies [16,17].
In national and local emission inventories, the estimates of total annual NH3 emissions are based on animal numbers, fertilizer consumption, and emission factors. Emission factors aim to describe how nitrogen (N) in manure and in fertilizers is lost as NH3 in the atmosphere. Several factors, including the concentration of N components in manure, the concentration of NH3 at the exchanging surface and in the atmosphere above the manure, air turbulence conditions, temperature, and pH, can influence the rate of NH3 emission. Emissions occur primarily after spreading and are also influenced by the viscosity and dry matter content of the manure applied on a land surface [13]. Emissions from synthetic fertilizers are influenced by the application technique, chemical composition, and atmospheric turbulence conditions, which can affect the interphase NH3 concentration [18]. As a matter of fact, atmospheric turbulence seems to affect the release of ammonia in more than one way. The time modulation of ammonia emissions in a chemistry transport model (CTM) can be estimated based on time-varying meteorological variables, as reported by different studies [1,19,20,21,22,23,24,25].
The above-mentioned variables are used in several detailed models [26,27,28,29,30,31,32], and the use of machine learning approaches has been investigated for estimating time-varying ammonia emissions [2,33,34,35]. As reported by Hempel et al. [2], the development and release of new algorithms and the increase in data availability also support the implementation of machine learning approaches in different sectors of agriculture [36].
Machine learning has been employed to differentiate the effects of weather and emission changes on air quality, such as PM1 composition alterations due to Beijing’s Clean Air Action Plan [37]. It has also been used to study the variation in NO2, O3, and PM2.5 levels during the COVID-19 lockdown [38,39,40]. This methodology can be extended to reactive species like NH3, enabling the analysis of atmospheric impacts and gas-to-particle conversion influences on NH3 concentration [41].
Neural-network-based chemical transport models learn the complex correlation between emissions and atmospheric concentrations, and they have been used to enhance the accuracy of emission inventories and the performance of air quality models through a back-propagation approach that adjusts the gradient of the loss function, which measures the deviation between predicted and observed contaminant concentrations [42].
As previously mentioned, there are two primary ways for predicting ammonia concentrations: physical methods and machine learning techniques. Physical techniques involve a lot of variables and can be used at the farm level or for specific manure management tasks. CTMs are defined from a physical perspective as well and are used on a bigger scale. They include the chemical reactions and the transport of pollutants, emission models, and all available information regarding emissions provided by various inventories, but, generally, they simplify data on emission temporal variation. The estimations of ammonia emissions for the entire year are disaggregated in CTMs based on overall temporal profiles. Only in a subsequent reanalysis phase can the emissions be recalculated by comparing simulation results with observed data. Machine learning has been used in both CTM combinations [37,38,39,40,41] and single farm resolutions [2].
To estimate ammonia concentrations and emissions with high accuracy, this work introduces a novel approach that applies the machine learning Random Forest iteratively to an assumed homogenous aerographic region surrounding measurement sites. This method is interesting since, to our knowledge, there is not a forecast model for emissions and concentrations relating to this subject that is as accurate and that can still preserve complete compatibility with atmospheric turbulence parameters. The proposed model will be used to estimate ammonia emission trends, allowing the validation of the annual emission estimates of emission inventories and the obtainment of useful temporal profiles for CTMs.
This paper is divided into five sections, beginning with this introduction. Section 2 provides information on the ground theory of the methodology, presenting the main physical hypothesis, the inputs to the model, and the methods of iterating Random Forest. The validity and reliability of the methodology are shown in Section 3. In Section 4, the relations between ammonia concentrations, emissions, and atmospheric turbulence parameters are widely discussed. Finally, the conclusion, limitations, and future direction of the study are summarized in Section 5.
2. Materials and Methods
The implemented approach is based on some physical and phenomenological assumptions about ammonia emission rates and dispersion. As stated in the fundamental principles of pollutant dispersion modeling, the observed concentrations of ammonia at the measuring stations were determined by emissions from various sources close to the stations, by pollutant transport, deposition, and reactions, as well as meteorological conditions.
It is well known that gaseous ammonia in the atmosphere tends to convert very rapidly to ammoniacal compounds (NH4+) and that NH3 concentrations decrease quickly within the first 1–2 km from the sources [15]. Therefore, it is conceivable that relatively nearby sources determined the gaseous ammonia quantities that were detected.
The following fundamental assumptions form the basis of this work. Firstly, an area with a radius of 3.6 km was considered for each measurement site, due to the maximum distance that air travels in an hour with a wind velocity of 1 m/s, which is typical for the region (Table 1). Secondly, a Random Forest model was trained and tested on the measured hourly ammonia concentrations, using measured turbulence parameters and a first guess of the total emission of NH3 as input variables. The first-guess emission value was defined from the local emission inventory, considering an average local value within the circled area around the site. Finally, the testing and training of the Random Forest model was reiterated, correcting the hourly emissions by the ratio between the measured and estimated concentrations.

Table 1.
Ammonia measurement sites, average measured ammonia and wind velocity, annual surrounding emissions estimates, and main emissions macrosectors. NH3 emissions refer to the total amounts emitted per year (2014, 2017, and 2019) in each circular area with a radius of 3.6 km.
2.1. Measurement Sites and Data
In this work, a dataset for ten measurement sites located in the Po Basin was developed, considering the following:
- Hourly measured ammonia concentrations;
- Hourly measured meteorological variables;
- Ammonia emission estimates.
The dataset covers a nine-year period (start of 2014—end of 2022), except for the location of Moggio (7_RB), where the time series is from 2014 to the beginning of 2021 due to a lack of data.
Table 1 presents the identification codes for the different measurement sites, along with the average values of ammonia concentration and wind speed measured for the entire dataset. For each site, the table also reports the emission estimates for the surrounding area of the measurement station for the years 2014, 2017, and 2019. The locations of the sites are shown in Figure 1.
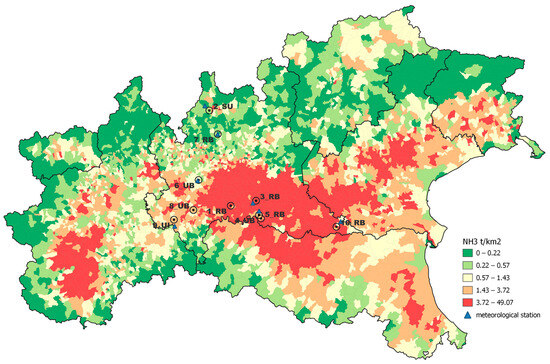
Figure 1.
Emission density map in northern Italy and ammonia concentrations at the measurement sites considered in this study.
2.1.1. Ammonia Measurement Sites
The ammonia measurement sites considered in this study belong to the Air Quality Monitoring Network of the Regional Environmental Protection Agency of Lombardy (ARPA Lombardia). The Monitoring Network consists of both permanent stations and mobile samplers, the former providing, by means of automatic analyzers, continuous data at regular time intervals. Ammonia atmospheric concentrations are mainly detected by NOx analyzers, which are based on the principle of chemiluminescence. Thus, starting from the standardized method (UNI EN 14211:2012) for NOx, besides the molybdenum converter heated to 315–325 °C to convert NO2 into NO, an ammonia analyzer was also equipped with a converter heated to 750–825 °C, which transformed NH3 into NO.
The ten measuring stations differed according to type, including rural background (RB) (i.e., Bertonico, Corte de Cortesi, Cremona via Gerre Borghi, and Schivenoglia), urban background (UB) (i.e., Cremona via Fatebenefratelli, Milano Pascal Città Studi, and Pavia via Folperti), suburban background (SU) (i.e., Colico), and urban industrial (UI) (Sannazzaro de’ Burgondi), as well as altitude, ranging from 16 m asl (i.e., 10_RB, Schivenoglia) to 1197 m asl (i.e., 7_RB, Moggio).
2.1.2. Meteorological Parameters of the Measurement Sites
In this study, several meteorological variables were considered that could potentially affect the accumulation processes of ammonia in the atmosphere. These variables include wind direction [°], precipitation [mm], global solar radiation [W/m2], ambient temperature [°C], relative humidity [%], and wind velocity [m/s]. These data were obtained from the monitoring network of ARPA Lombardia.
Since not all the ammonia monitoring sites had the complete set of meteorological parameters, it was necessary to consider those from the closest meteorological station/stations if meteorological data were not available.
Figure 1 also shows the meteorological stations used for the possible completion of the data. They can be considered representative for the ammonia measurement sites because they are all located a few kilometers away and are characterized by homogeneous conditions of use and land cover and altimetry. No additional stations were indicated for the ammonia measurement sites for which the meteorological dataset was already complete.
Therefore, for the locations of Bertonico (1_RB), Cremona Via Fatebenefratelli (4_UB), Cremona Via Gerre Borghi (5_RB), and Pavia Via Folperti (8_UB), meteorological data were downloaded together with ammonia concentration data. On the other hand, for the locations of Colico (2_SU), Corte de Cortesi (3_RB), Milano Pascal Città Studi (6_UB), Moggio (7_RB), Sannazzaro (9_UI), and Schivenoglia (10_RB), it was necessary to integrate the missing data from the nearest meteorological station/stations.
2.1.3. Annual Emission Estimates
Annual emission estimates in the surrounding NH3 measurement sites refer to the years 2013, 2017, and 2019 and were obtained from the common air emission datasets developed by ARPA Lombardia in the frame of the “LIFE PREPAIR inventory” (LPi) [13]. Since no emission assessment was available for 2014, the year of the beginning of the time series considered in this study, the closest data from the inventory edition for 2013 were used for this year.
The work of updating Po Basin inventories with a high spatial resolution scale at the municipal level was carried out by environmental protection agencies and the regions of Lombardy, Emilia-Romagna, Piedmont, Veneto, Friuli Venezia Giulia, Valle d’Aosta, and Bolzano and the province of Trento. Figure 1 shows the emission density map of NH3 of the LPi referred to 2017 and the positions of the ten ammonia measurement sites.
NH3 emission sources in the LPi are described according to the SNAP (Selected Nomenclature for sources of Air Pollution) classification, where several categories may be identified as: fertilizer application, livestock, traffic, residential/commercial, industry, and other; and several subcategories may be identified as: animal subcategories, vehicle subcategories, domestic combustion, agricultural soils, etc.
In the present study and in Table 1, the ammonia sources of interest are grouped into three categories: “agriculture”, “road transport”, and “other sources”. Other sources include minor contributions to ammonia emissions from: other sources and absorptions, non-industrial combustion, waste treatment and disposal, energy production, and fuel transformation. The bottom-up emission inventory was obtained by very detailed geographic data (e.g., municipal number of livestock units); these were then implicitly considered in the emission estimates, with more details reported in Marongiu et al. [13]. The LPi was obtained by multiplying the activity levels by the corresponding emission factors and aggregating the values for all municipalities, all sources, and all fuel types during a full year. The specific equation is reported in the following:
where:
- Em = NH3 annual emission for the municipality;
- s = source type;
- f = fuel type;
- Is,f,m = activity indicator;
- EFs,f = NH3 emission factor.
The compilation of inventories on a municipal scale is comparable, despite the many subjects involved, thanks to the use of the same “INEMAR database” modeling system, which follows the guidelines of the EEA [9,10].
An estimation of emissions was possible thanks to high-resolution maps from the LPi, developed at a municipal level. A circle with a radius of 3.6 km was set around the measuring station, and the quantity of ammonia emitted relative to that area was extracted. By intersecting the map of the LPi municipal areas with the circle area, it was possible to calculate the portion of the municipal area reported that is located within the area of the measuring station. The total emission for each station (Em) is given by the sum of the LPi emissions of individual municipalities calculated in proportion to how much of their territorial area falls within the area around the measuring station:
where:
- = emission for each station;
- = total municipal NH3 emission;
- = total municipal area;
- = municipal area within circle area station.
The overall dataset examined in the present study was characterized, with respect to previous experiences of data collection for Agrimonia [43], for the use of the bottom-up LPi, together with the hourly data on ammonia concentrations and the main meteorological parameters, in long-term time series.
2.1.4. Machine Learning Method and Random Forest
The entire dataset encompasses 626,646 valid hourly observations of ammonia concentrations and atmospheric turbulence parameters. The correlation parameters were calculated both for the entire dataset and considering each site separately. This analysis was extended by considering different quartiles for both single stations and the entire dataset (Table S1 in the Supplementary Materials). The correlation analysis did not reveal any important correlation between concentrations and atmospheric turbulence indicators. This suggested the implementation of a more sophisticated machine learning approach.
Hempel et al. have investigated how the selection of training data and modelling approach affects the estimation of ammonia emissions from a naturally ventilated dairy barn [2]. In their work, they concluded that ensemble methods of gradient boosting and Random Forest gave the best predictions for emissions, confirming that machine learning approaches can improve emissions predictions.
This study was based on the Random Forest method: randomForestSRC [44,45,46], implemented in a CRAN-compliant R-package [47], using fast OpenMP parallel processing to construct forests for regression; classification; survival analysis; competing risk analysis; multivariate, unsupervised, quantile regression; and class imbalanced q-classification [47]. The package implements Breiman Random Forests [48] in a variety of problems.
The approach called Random Forest (RF) can improve ensemble learning by injecting randomization into the base learning process [48]. In RF, the predictions are obtained by means of the trees on feature subsets [49]. This approach has been extended in Random Survival Forest (RSF), developed by Ishwaran et al. [46,47,48,49,50]. RF is a method that averages trees and develops an ensemble by a randomization in the learning process in two ways: random sampling of the data to grow a tree and random feature selection.
2.1.5. Sampling of Training Data and Cross-Validation
The hourly emission flux of ammonia F_NH3 [kg/h] must be considered as an input variable of the machine learning model together with atmospheric turbulence parameters. The Random Forest was applied, simulating each measuring site, as reported in Figure 1, considering measured hourly values of: NH3 concentration, temperature, precipitation, wind intensity and direction, solar radiation, humidity, and first-guess hourly ammonia emissions. The initial value for the ammonia emission flux was estimated for each location by the LPi in 2017, as detailed in Section 2.1.3, and is reported in Table 1. The dataset was filtered, omitting missing values and according to NH3 concentrations less than the 99th percentile. For training and testing operations, the dataset was randomly divided into two subsets: one containing 70% of the data for training and the other containing the remaining 30% for testing. Figure 2, for the Schivenoglia site (10_RB), illustrates the initial assumption and subsequent nine iterations of the estimated ammonia flux, “emi_1”, during a sample period. The iterations adjust the initial ammonia flux, which is multiplied by the ratio between the measured and predicted concentrations for each iteration, as displayed in the lower section.
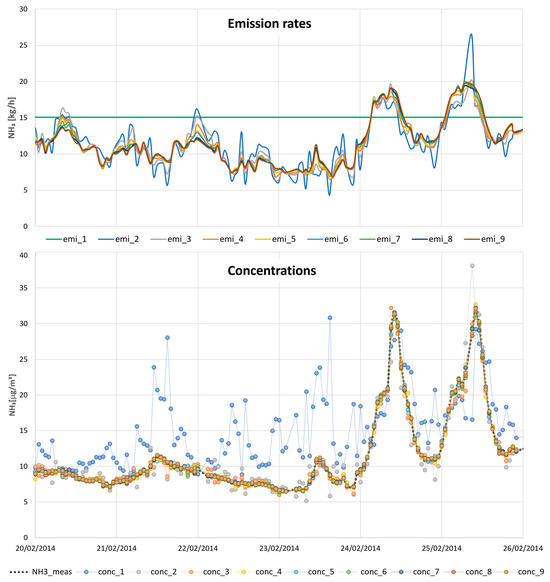
Figure 2.
Focus on a short period for station 10_RB. Emission rates: illustrate the variation in the estimated emission flux for each model iteration. Concentrations: comparison between the predicted and measured concentrations of NH3 for each model iteration.
The procedure develops as previously described, selecting and reincorporating new random subsets for training and testing. With each iteration, the predictive performance progressively enhances due to the refinement of the emissive input. During the first iteration, the algorithm identifies a set of atmospheric turbulence parameters favorable to ammonia accumulation in the atmosphere. Consequently, the concentrations, “conc_1”, in some cases tend to overestimate the concentration compared to the measured values.
The predictions estimated in the first iteration depend only on the variability in the atmospheric conditions and do not consider real activity levels and other source-specific variables. From the second iteration, the model corrects the hourly varying emissions, and the predictions vary, smoothing some peaks.
3. Results
Figure 3 illustrates the iterative enhancement of the correlation between predicted and observed concentrations at each of the ten stations. The starting point is the constant emission scenario, and it is clear that all sites exhibit similar trends through the model’s iterations. Notably, the accuracy of the comparison between calculated and predicted values significantly improves by the second and third iterations. In the elaboration of training and testing for each measurement site, the model performances for the predictions on the test subsets were quite like those obtained in the training phases.
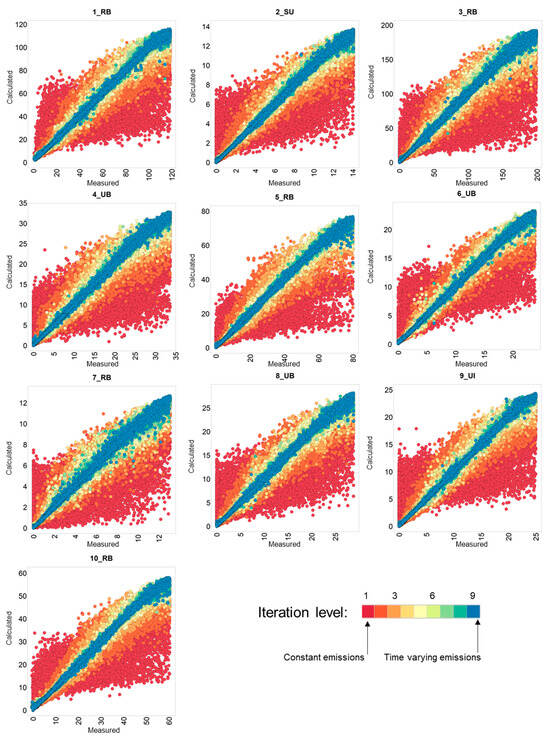
Figure 3.
Comparison between the measured NH3 atmospheric concentrations and the predicted ones [μg/m3] at each step of the iteration for the different sites. Each color corresponds to an iteration.
Table 2 presents the model’s performance metrics, including R-squared estimates and error rates, for each monitoring site, the training and testing datasets, and each iterative step. The data clearly show a very similar behavior for all the monitoring sites, with R-squared values higher than 0.9 from the second or third iteration.

Table 2.
Performance indicators at each iteration step for training and testing in each site.
The ammonia daily mean concentrations during the years 2014–2022 in site 3_RB are shown in Figure 4. The comparison of the predictions and the data obtained by the measurements shows very good agreement. On the other hand, the decoupling between emission rates and concentrations is more evident in some periods of the years 2020 and 2021. The comparison between emission rates and concentrations is based on real valid data; no data completion procedures are applied in Figure 4. The developed methodology is not affected by the absence of valid data, which can be a more relevant issue in the calculation of annual and monthly total emission rates.
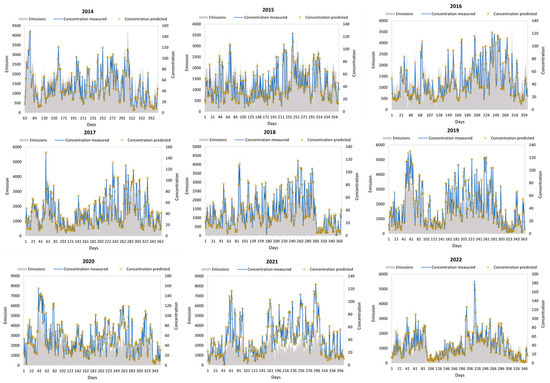
Figure 4.
Time series of daily average concentrations of measured and predicted ammonia [μg/m3] and total daily emissions for 3_RB [kg NH3/day].
The proposed methodology allows the calculation of annual, monthly, and daily variation in emission rates. As reported by Asman et al. [51], emission rates can show a peak in the afternoon related to warmer temperatures and higher turbulence. Farming operations can vary during the year, reasonably showing peaks in Spring and Autumn.
The estimated hourly emission rates and measured mean concentrations for all the sites are reported in Figure 5 and in Figure S1 of the Supplementary Materials and clearly show a maximum during the afternoon or late morning in a majority of the sites. The emissions profiles can also be more complex, considering that ammonia emissions can occur several times after specific operations in livestock activities.
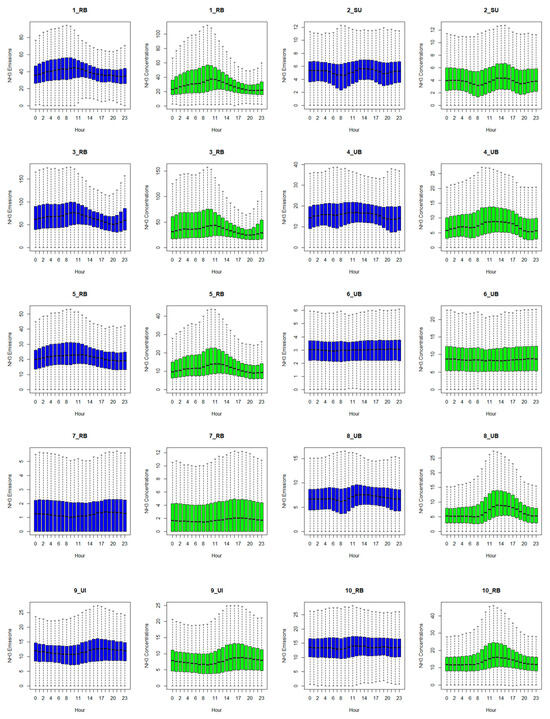
Figure 5.
Average hourly emission flux [kg/h] for each hour of the day compared to average measured ammonia concentrations [μg/m3]. Elaboration on quantiles.
In Figure 6 and in Figure S2 of the Supplementary Materials are shown the monthly average emissions profiles for each site compared with similar elaborations for measured ammonia concentrations, confirming the presence of the peaks in Spring and Autumn.
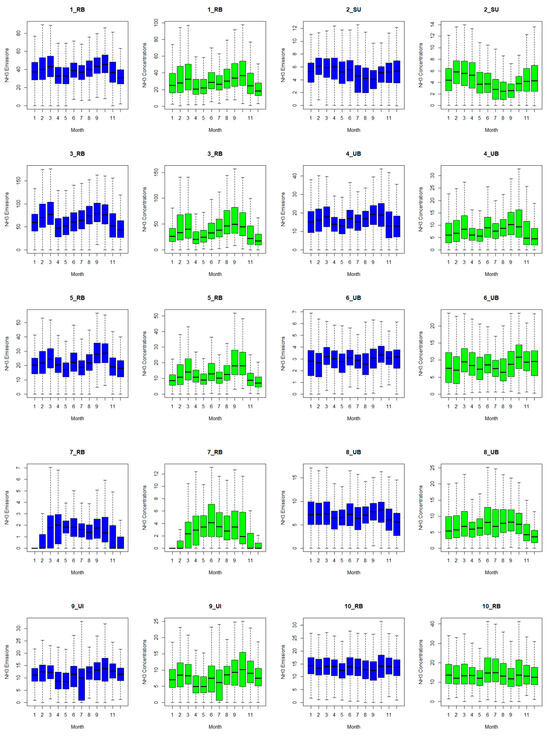
Figure 6.
Average hourly emission flux [kg/h] for each month of the year compared to average measured ammonia concentrations [μg/m3]. Elaboration on quantiles.
A data completion calculation is considered in Figure 7. The total annual emission rate is calculated by applying a coefficient defined as the ratio between the total hours in the year and the number of valid data. Figure 7 clearly shows how the calculated emissions obtained by the methodology described in Section 2 are in very good agreement with the LPi. The spatial variation in emissions seems to show a better agreement than time series for certain sites.
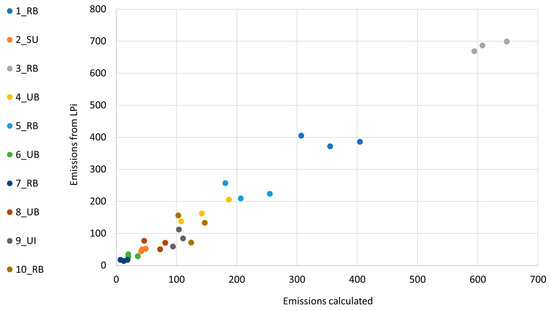
Figure 7.
Total annual emissions of ammonia [t/year] in different sites for three years: 2013, 2017, and 2019; comparison of calculated data from this study and the LPi.
The motivation can be difficult to define; the emission inventory is affected by different levels of uncertainties regarding emission factors and by the annual and intra-annual fluctuation in the number of animals bred. The field application of manure can occur in different days of the year, even confined to the cultivation seasons, but can also occur not in the same municipality of the farm in which the animals have produced the excreta nitrogen flow.
CTMs need the allocation of the annual emission inventory to hourly timesteps. The applied temporal patterns play an important role, affecting the simulation results both in diagnostic and scenario elaborations. Veratti et al. [17] report an overview of the temporal distribution in northern Italy of NH3 emissions, applying four different air quality modelling systems based on three chemical transport models (CHIMERE, FARM, and CAMx) [52,53,54,55,56,57,58]. The minimum and maximum monthly NH3 emissions are reported in Figure 8 and compared to the calculations obtained by this study for the site 3_RB, considering the whole time series. Table 3 summarizes all the data used for the comparison and the details about the different sources.
The site 3_RB can be considered as representative of the area with a higher emission density in the domain. The modelling emission profiles are in quite good agreement with the calculations obtained by this study. The main peaks are visible according to the period of field application of manure. The emissions calculated in this paper can show a wide variability in the years with the same order of magnitude as the range reported in the CTM modelling systems.

Table 3.
Summary of characteristics of data employed in the monthly ammonia emission flow comparison.
Table 3.
Summary of characteristics of data employed in the monthly ammonia emission flow comparison.
| Data | Spatial Resolution | Time Resolution | Years | Method | Source | Ref. |
|---|---|---|---|---|---|---|
| DECSO v6.1 | 0.2° × 0.2° | Monthly | 2020–2022 | Satellite observation (CrIS) and chemical transport model (DECSO v6.1) | (SEEDS website): https://www.seedsproject.eu/data/monthly-nh3-emissions (accessed on 5 May 2023) | [59] |
| VERATTI et al., 2023 | All grids | Monthly | 2019 | Four air quality modelling systems based on three chemical transport models | Veratti, G. et al. (2023) Impact of NOx and NH3 Emission Reduction on Particulate Matter across Po Valley: A LIFE-IP-PREPAIR Study | [17] |
| CAMS-GLOB v6.1 | 0.1° × 0.1° | Monthly | 2000–2022 | Annual emission (EDGAR v4.3.2) with temporal profile from CAMS-GLOB-TEMPO (2000–2012) or a linear trend fit to the 2012–2014 data from the CEDS inventory | Emissions of Atmospheric Compounds and Compilation of Ancillary Data website [60] | [61] |
| HTAPv3 | 0.1° × 0.1° | Monthly | 2000–2018 | Ad hoc global mosaic of anthropogenic inventories that use EMEP data (CAMS-REG) for Europe | Emissions of Atmospheric Compounds and Compilation of Ancillary Data website [60] | [62] |
| EDGAR v4.3.2 | 0.1° × 0.1° | Monthly | 2010 | The Emissions Database for Global Atmospheric Research uses the same anthropogenic sectors, covers the same period (1970–2012), and utilizes the same international activity data that are used for greenhouse gas emissions | Emissions of Atmospheric Compounds and Compilation of Ancillary Data website [60] | [63] |
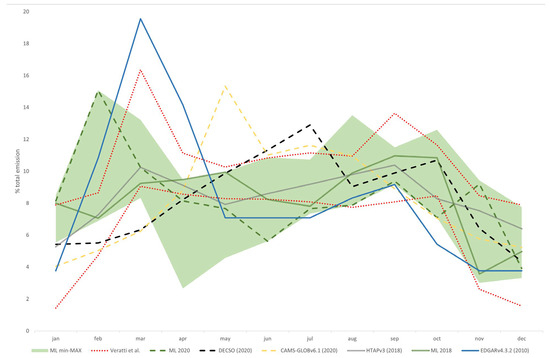
Figure 8.
Comparison of NH3 monthly emissions variability between this study and different available sources [17,59,61,62,63]. Values are expressed as ratios between monthly and annual emissions for a fixed year.
Guevara et al. report that the CAMS-REG-TEMPO monthly and daily profiles for livestock are assumed to be dependent on temperature and ventilation rates, while the hourly profiles are based on fixed weight factors due to a data limitation issue [64]. Figure S3 shows for each measurement site the comparison of NH3 monthly emissions variability between this study (2014–2022) (blue bars), CAMS-GLOB-ANT (2014–2022) (orange) [61,65,66], and Livestock CAMS-REG-TEMPO (2014–2020) (black) [64,65]. The comparison demonstrates how the profiles derived in this study using in situ measurements have greater variability for each month and can exhibit multiple relative peaks throughout the year. The temporal profiles reported by Veratti et al. [17] were obtained from four different air quality modelling systems applied to the Po Basin. They are fixed temporal profiles derived from an estimation of the potential activities associated with livestock and manure management throughout a given year. In comparison to the findings of this study, the presence of a double peak during the year appears to be confirmed at numerous sites. The substantial variability in ammonia emissions found in this work shows that developing modelling systems with dynamic emission input will lead to improved modelling of ammonia concentrations and, in the future, a better understanding of the formation mechanisms of particulate matter.
4. Discussion
The developed methodology consists in the solution of the inverse problem of estimating the ammonia emission rate in a restricted area nearby a monitoring station. The approach of inverse modelling allows the quantification of ammonia emissions using observed atmospheric concentrations and turbulence parameters.
The calculation of the emission rates in conjunction with measured atmospheric concentrations is a common goal in solving inverse problems using a Bayesian framework [67]. Also, in this case, the authors restricted the domain to short-range transport using a Gaussian plume-type solution as a forward solver for the transport of particles from fugitive sources. In the application of a Bayesian framework, it was reported that the authors would avoid so-called “inverse crimes” [68]. Inverse crimes happen when numerical methods yield unrealistically optimistic results.
To evaluate the reliability of the estimates, the link between emissions and concentrations was examined, showing that the NH3 concentrations and the calculated emissions are compatible with physical atmospheric turbulence parameters.
A decision tree was applied for describing observed concentrations with air turbulence parameters time-varying with NH3 emission rates. The applied methodology is available in the R package: “rpart” [69]. The decision tree learning method applied to each site aims to construct a model that describes ammonia concentration using atmospheric turbulence parameters. In the simulated tree structures, leaves represent class labels for various NH3 concentrations, while branches reflect feature combinations on atmospheric turbulence parameters that result in those class labels. Each point in Figure 9 is defined by ammonia atmospheric concentrations and the estimated emission rate. The tree learning was applied, assigning to each point the corresponding class labels due to the range of possible turbulence parameters.
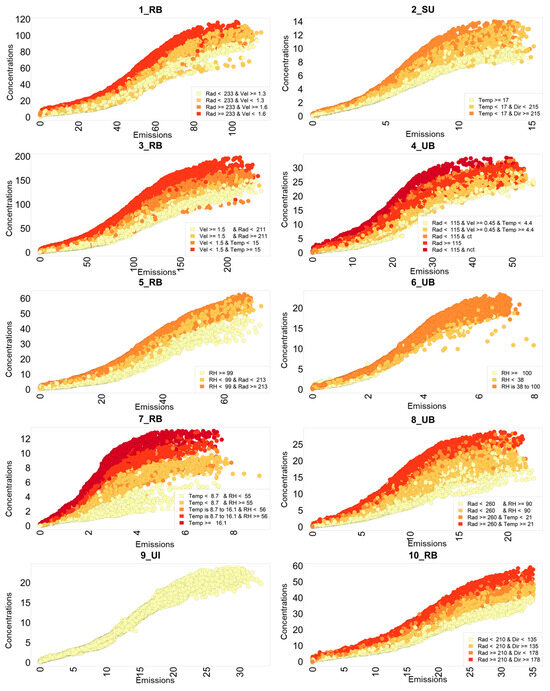
Figure 9.
Relation between estimated ammonia emissions expressed in kg NH3/h and predicted ammonia concentrations [μg/m3] as a function of turbulence atmospheric parameters (for site 4_UB ct: lower than wind calm threshold; nct: higher than wind calm threshold).
Figure 9 shows for each site the variation in atmospheric concentrations of ammonia with the increase in the calculated emission rates. The decision tree identified different levels of possible NH3 atmospheric accumulation at a fixed emission level, highlighting the possible role of meteorological conditions. As will be discussed below, the results are reasonable from a physical point of view.
The data in Figure 9 are most dispersed, with an increase in the importance of the atmospheric turbulence parameters with respect to emissions. This analysis is also confirmed by the correlation between measured ammonia concentrations and ammonia emissions reported in Table S2 in the Supplementary Materials. An R-squared value around 0.9 was calculated for station 9_UI (industrial sites), which confirms, in Figure 9, a direct relation between emissions and concentrations. In the case of the industrial site 9_UI, the analysis was not able to identify a specific turbulence pattern.
The lowest correlation between emissions and concentrations was obtained for station 7_RB (R2 = 0.2), which shows a very wide dispersion of data in Figure 9. Considering the results of the LPi in Table 1, sites 7_RB and 9_UI have specific peculiarities: the first is placed in the lower emission density area of the domain and the second is characterized by very different emissions sources (industrial) compared to the other sites (agriculture).
For the remaining measuring stations, higher temperatures, higher solar radiations, and lower wind velocities seem to favor the accumulation of gaseous ammonia in the atmosphere.
Considering station 1_RB, an emission rate of 40 kg NH3/h determines atmospheric concentrations in the range of 10–40 μg/m3. This variation can be explained considering the role of solar radiation and wind velocity. Higher values of solar radiation seem to determine higher concentrations with constant emissions. The role of wind velocity was identified, as a second actor, playing in a different way. At a fixed range of thermal radiation, higher wind strength will decrease the concentrations, allowing a better atmospheric dispersion.
The main variables identified show that, for the same emission, the meteorological parameters that allow a greater accumulation in the atmosphere are very similar to those used for the definition of atmospheric stability classes. Atmospheric turbulence can be categorized into six stability classes, ranging from the most unstable or turbulent (low wind speed and high thermal radiation) to the most stable or least turbulent (high wind speed and low insolation, as during the night). The results of the study do not allow us to assess whether the Gaussian plume-type solution can be used to further optimize the results, even if the low influence of wind direction is confirmed, this having been found only in two sites, 2_SU and 10_RB, and suggesting the presence of a specific source of ammonia emissions.
The scarce impact of wind direction partially confirms the lower influence of emissions at the outer range of 3.6 km around the site or the homogeneity of the emission fluxes in all the immediate neighboring areas. Also, the nature of the emissions from livestock and manure management can play a relevant role, these being emitted at ground level without stack velocity and with time delay after agriculture activities, as in manure field applications.
Calculations have shown that there are no distinct correlations between variables of atmospheric turbulence and the measured concentrations of ammonia, and these variations occur unpredictably depending on the considered site (Table S1, Supplementary Materials). Local geographical conditions and activities mainly in agriculture, as well as proximity to emission sources, play a pivotal role in atmospheric ammonia concentrations. The correlation of concentrations with emission rates (Table S2, Supplementary Materials) varies significantly based on these factors at each site. This confirms the reactive nature of ammonia, whose concentration rapidly fluctuates, which is also due to its easy conversion into NH4+ and then into particulate matter.
The implemented methodology normalizes the input variables: atmospheric turbulence variables and emission rates. Figure 10 depicts a sensitivity analysis of the final computed concentrations and emissions achieved with two alternative first values of emissions. The results are displayed for station 3_RB with beginning emissions of 668 t/year (C_High and E_High) and 0.1 t/year (C_Low and E_Low).
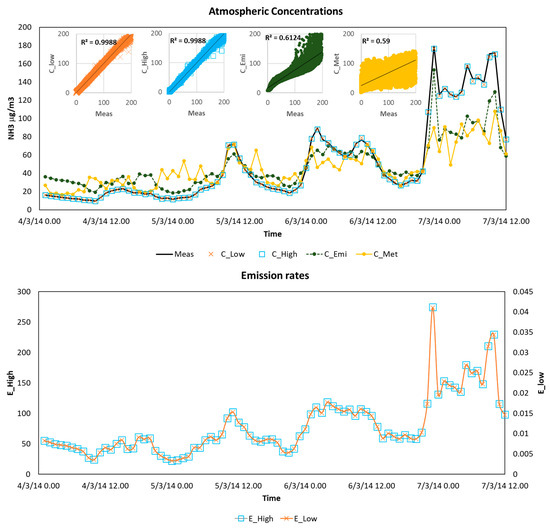
Figure 10.
Sensitivity analysis on station 3_RB with two different starting emissions: lev1 = 668 t/year and lev2 = 0.1 t/year. Atmospheric concentrations in [μg/m3] and emission estimates of NH3 in [kg/h]. Concentrations: C_Low starting emission on lev2, C_High starting emission on lev1, C_Emi calculated concentrations only considering emissions obtained from RF, C_Met calculated by RF only considering atmospheric turbulence parameters. Emissions: E_High calculated with starting value lev1 and E_low calculated with staring value lev2.
The atmospheric concentrations are predicted with the same accuracy regardless of the initial inventory, confirming the reliability of the proposed approach and the high accuracy compared to predictions obtained using only meteorological parameters (C_Met) and emission rates (C_Emi).
The computed emission rates shown in Figure 10 were obtained from different first emission inventories and exhibit the same temporal trend, but with a proportionate factor due to the variable normalization. A calibration curve based on annual average measured concentrations and annual emissions could provide a plausible scaling and forecast of the initial values for emissions.
Figure S4 in the Supplementary Materials depicts the link between the measured data and the emission estimations from the LPi utilized in this work, revealing a strong linear correlation, with an R2 greater than 0.93.
5. Conclusions
In this study, a machine learning methodology for estimating atmospheric concentrations and emission rates based on atmospheric turbulence parameters has been implemented by recursive application of Random Forest. The proposed iterative process for the determination of the emission rates of NH3 separates the effects of meteorology from the variation in space and time of the overall effects of the emission sources.
Each subsequent iteration improves the ability to predict ammonia concentrations, that is, gradually, the self-learning process inherent in the methodology unfolds and is strengthened from time to time by analyzing new data.
The proposed methodology provides very good accuracy in predicting time-varying ammonia concentrations compared with measured data in different sites of the considered domain.
The emission rates calculated in this study are compared with the main results of the emission inventories estimated for the investigated area, considering both their spatial and temporal variation. This comparison, with very encouraging results, is very important to ensure consistency between the estimated data, determined on an hourly basis, with the available and estimated independent data extracted at the same site but on an annual scale.
The goal of an emissions Inventory is to offer the most complete assessment of the sources present in a given area and year. However, it does not account for the unpredictability of emissions caused by meteorological conditions or oscillations in activity levels. The approach in this study uses data collected in situ or via satellite to estimate the variability in emissions (pressure) in relation to modulations of observed concentrations (state).
Further analysis involved the monthly emission profiles estimated by the study, which agree with the main assumptions documented in air quality modeling or in inverse calculations from satellite observations and modeling simulations and with the main physical features from previous studies. The predicted emission rate profiles are reasonable, considering seasonal variation in temperature and solar rations and the possible programs in agriculture activities.
Considering the hourly time resolution, the emission profiles can show very high variability. Only a minor part of this variability can be explained by atmospheric turbulence parameters, and it can be reasonably linked to changes in the emission sources. At a very local scale, the field application of manure can occur in a different period of the year even in the same season and can also be affected by different parameters. The local presence of a certain number of livestock units cannot be always linked to the emissions of ammonia in all the manure management phases, the possible treatment and field application not always being located in proximity to the housing structure.
As a matter of fact, the analysis of measured ammonia concentrations does not show a recursive pattern, suggesting that, at a very local scale, the ammonia emission rate and its time series can be very variable. This aspect must be considered in the development of bottom-up emission inventories and in their use and application in air quality simulations.
The presented methodology considers relevant hypotheses on the chemical and physical behavior of ammonia in the atmosphere, assuming that the measured concentrations of gaseous NH3 were determined by sources relatively close by. The presence of transport fluxes of this pollutant outside or inside the considered area could affect the calculation of the emission rates. A possible solution of this limitation is to consider in the calculation the effect of transport fluxes for those stations showing an effect of wind direction. As reported in Figure 9, wind direction has been identified only in a very limited number of sites: 2_SU (placed in a valley) and 10_RB (probably affected by a specific source).
The method developed in this paper could be applied to CTM simulated concentrations together with in situ measurements and/or optical depth from satellite observations (e.g., Copenicus Atmospheric Monitoring Services). The proposed methodology can be extended to the points of an entire area considering the data collected by the satellite and is suitable for being extended to further applications considering the interactions of gaseous ammonia with atmospheric acid gases in the formation of ultrafine particulate matter. CTM models could benefit by applying this methodology because they could use a dynamic emissive input obtained from in situ measurements or satellite data processing, as opposed to the more common approach, which uses average monthly, weekly, and hourly time profiles. It could be used to determine time series for specific tracers or contaminants, including levoglucosan, for biomass burning sources and heavy metals.
Supplementary Materials
The following supporting information can be downloaded at: https://www.mdpi.com/article/10.3390/air2010003/s1, Table S1: For each reference site, the correlation matrix percentages between meteorological turbulence variables and ammonia concentrations, divided into quartiles; Figure S1: Average emission fluxes [kg/h] for each hour of the day compared to average measured ammonia concentrations [μg/m3]; Figure S2: Average emission fluxes [kg/h] for each month of the year compared to average measured ammonia concentrations [μg/m3]; Figure S3: Comparison of NH3 monthly emissions variability between this study (2014–2022) (blue bars), CAMS-GLOB-ANT (2014–2022) (orange) [61,65,66], and Livestock CAMS-REG-TEMPO (2014–2020) (black) [64,65]. Values are expressed as ratios between monthly and annual totals for each year; Table S2: Correlation test between ammonia flux estimates and measured ammonia concentrations; Figure S4: Calibration curve of the initial values of the emissions with the annual average concentrations of measured ammonia in different sites.
Author Contributions
Conceptualization, A.M. and E.A.; methodology, A.M.; software, A.M. and G.G.D.; validation, A.M., A.G.C. and G.G.D.; formal analysis, A.M.; investigation, A.M., G.G.D. and A.G.C.; resources, A.M.; data curation, A.M., G.G.D. and A.G.C.; writing—original draft preparation, A.M., G.G.D. and A.G.C.; writing—review and editing, E.A. and A.M.; visualization, A.M., G.G.D. and A.G.C.; supervision, A.M.; project administration, E.A.; funding acquisition, E.A. All authors have read and agreed to the published version of the manuscript.
Funding
This research was funded by LIFE-IP PREPAIR (Po Regions Engaged to Policies of AIR) project, grant number LIFE15 IPE/IT/000013, and by REGIONE LOMBARDIA with “Progetto di monitoraggio ammoniaca dal comparto agricolo 2022/2023”, identification code number 2022.0043891—18/03/2022.
Institutional Review Board Statement
Not applicable.
Informed Consent Statement
Not applicable.
Data Availability Statement
The dataset with updated emission estimates for Lombardy is available to the public: https://www.inemar.eu/xwiki/bin/view/Inemar/HomeLombardia (accessed on 1 September 2023). Details on methodologies and emission factors are available to the public: http://www.inemar.eu/xwiki/bin/view/FontiEmissioni/ (accessed on 1 September 2023).
Acknowledgments
Acknowledgments are given to all the beneficiaries of LIFE-IP PREPAIR: Emilia-Romagna Region (Project Coordinator) Veneto Region, Lombardy Region, Piedmont Region, Friuli Venezia Giulia Region, Autonomous Province of Trento, Regional Agency for the Environment of Emilia-Romagna (ARPAE), Regional Agency for the Environment of Veneto, Regional Agency for the Environment of Piedmont, Regional Agency for the Environmental Protection of Lombardy, Environmental Protection Agency of Valle d’Aosta, Environmental Protection Agency of Friuli Venezia Giulia, Slovenian Environment Agency, Municipality of Bologna, Municipality of Milan, City of Turin, ART-ER, and Lombardy Foundation for the Environment. Acknowledgments are also given to ECCAD for the archiving and distribution of the data on emissions.
Conflicts of Interest
The authors declare no conflicts of interest.
References
- Backes, A.; Aulinger, A.; Bieser, J.; Matthias, V.; Quante, M. Ammonia emissions in Europe, part I: Development of a dynamical ammonia emission inventory. Atmos. Environ. 2016, 131, 55–66. [Google Scholar] [CrossRef]
- Hempel, S.; Adolphs, J.; Landwehr, N.; Janke, D.; Amon, T. How the Selection of Training Data and Modeling Approach Affects the Estimation of Ammonia Emissions from a Naturally Ventilated Dairy Barn—Classical Statistics Versus Machine Learning. Sustainability 2020, 12, 1030. [Google Scholar] [CrossRef]
- Amon, B.; Kryvoruchko, V.; Amon, T.; Zechmeister-Boltenstern, S. Methane, nitrous oxide and ammonia emissions during storage and after application of dairy cattle slurry and influence of slurry treatment. Agric. Ecosyst. Environ. 2006, 112, 153–162. [Google Scholar] [CrossRef]
- Monteny, G.J.; Groenestein, C.M.; Hilhorst, M.A. Interactions and coupling between emissions of methane and nitrous oxide from animal husbandry. Nutr. Cycl. Agroecosyst. 2001, 60, 123–132. [Google Scholar] [CrossRef]
- Hristov, A.N. Technical note: Contribution of ammonia emitted from livestock to atmospheric fine particulate matter (PM2.5) in the United States. J. Dairy Sci. 2011, 94, 3130–3136. [Google Scholar] [CrossRef]
- Sutton, M.A.; Bleeker, A.; Howard, C.M.; Erisman, J.W.; Abrol, Y.P.; Bekunda, M.; Datta, A.; Davidson, E.; de Vries, W.; Oenema, O.; et al. Our Nutrient World: The Challenge to Produce More Food and Energy with Less Pollution; The Centre for Ecology and Hydrology (CEH): Edinburgh, UK, 2013. [Google Scholar]
- Hempel, S.; Menz, C.; Pinto, S.; Galán, E.; Janke, D.; Estellés, F.; Müschner-Siemens, T.; Wang, X.; Heinicke, J.; Zhang, G.; et al. Heat stress risk in European dairy cattle husbandry under different climate change scenarios-uncertainties and potential impacts. Earth Syst. Dyn. 2019, 10, 859–884. [Google Scholar] [CrossRef]
- EU. DIRECTIVE (EU) 2016/2284—On the Reduction of National Emissions of Certain Atmospheric Pollutants, Amending Directive 2003/35/EC and Repealing Directive 2001/81/EC; European Parliament; EUR-Lex: Luxembourg, 2016. [Google Scholar]
- European Environment Agency. EMEP/EEA Air Pollutant Emission Inventory Guidebook 2016: Technical Guidance to Prepare National Emission Inventories; Publications Office of the European Union: Luxembourg, 2016. [Google Scholar]
- European Environment Agency. EMEP/EEA Air Pollutant Emission Inventory Guidebook 2019: Technical Guidance to Prepare National Emission Inventories; Publications Office of the European Union: Luxembourg, 2019. [Google Scholar]
- European Environment Agency. European Union Emission Inventory Report 1990/2019; Publications Office of the European Union: Luxembourg, 2021. [Google Scholar]
- Italian Emission Inventory 1990–2019. Informative Inventory Report 2021; ISPRA IIR: Roma, Italy, 2021. Available online: www.isprambiente.gov.it (accessed on 10 May 2023).
- Marongiu, A.; Angelino, E.; Moretti, M.; Malvestiti, G.; Fossati, G. Atmospheric Emission Sources in the Po-Basin from the LIFE-IP PREPAIR Project. Open J. Air Pollut. 2022, 11, 70–83. [Google Scholar] [CrossRef]
- Raffaelli, K.; Deserti, M.; Stortini, M.; Amorati, R.; Vasconi, M.; Giovannini, G. Improving air quality in the Po valley, Italy: Some results by the LIFE-IP-PREPAIR project. Atmosphere 2020, 11, 429. [Google Scholar] [CrossRef]
- BDN—Anagrafe Nazionale Zootecnica. Available online: https://www.vetinfo.it/j6_statistiche/#/ (accessed on 12 April 2023).
- Thunis, P.; Clappier, A.; Beekmann, M.; Putaud, J.P.; Cuvelier, C.; Madrazo, J.; de Meij, A. Non-linear response of PM2.5 to changes in NOx and NH3 emissions in the Po basin (Italy): Consequences for air quality plans. Atmos. Chem. Phys. 2021, 21, 9309–9327. [Google Scholar] [CrossRef]
- Veratti, G.; Stortini, M.; Amorati, R.; Bressan, L.; Giovannini, G.; Bande, S.; Bissardella, F.; Ghigo, S.; Angelino, E.; Colombo, L.; et al. Impact of NOx and NH3 Emission Reduction on Particulate Matter across Po Valley: A LIFE-IP-PREPAIR Study. Atmosphere 2023, 14, 762. [Google Scholar] [CrossRef]
- Asman, W.A. Ammonia Emission in Europa: Updated Emission and Emission Variations; Report No. 228471008; National Institute for Public Health and Environmental Protection: Biltoven, The Netherlands, 1992. [Google Scholar]
- Gon, H.D.; Hendriks, C.; Kuenen, J.; Segers, A.; Visschedijk, A. Description of Current Temporal Emission Patterns and Sensitivity of Predicted AQ for Temporal Emission Patterns EU FP7 MACC Deliverable Report D_D-EMIS_1.3; TNO: Utrecht, The Netherlands, 2011. [Google Scholar]
- Reis, S.; Ambelas-Skjoth, C.; Vieno, M.; Geels, C.; Steinle, S.; Lang, M.; Sutton, M.A. Why time and space matters-arguments for the improvement of temporal emission profiles for atmospheric dispersion modeling of air pollutant emissions. In Proceedings of the 19th International Congress on Modelling and Simulation, Perth, Australia, 12–16 December 2011. [Google Scholar]
- Sutton, P.; Chemel, C.; Griffiths, S.; Sokhi, R.S. Investigation, using CMAQ, of sensitivity of air quality modelling to input ammonia emissions. In Air Pollution Modeling and its Application XXII; Springer International Publishing: Cham, Switzerland, 2012; Volume 96. [Google Scholar]
- Huang, X.; Song, Y.; Li, M.; Li, J.; Huo, Q.; Cai, X.; Zhu, T.; Hu, M.; Zhang, H. A high-resolution ammonia emission inventory in China. Glob. Biogeochem. Cycles 2012, 26, GB1030. [Google Scholar] [CrossRef]
- Gyldenkærne, S.; Skjøth, C.A.; Hertel, O.; Ellermann, T. A dynamical ammonia emission parameterization for use in air pollution models. J. Geophys. Res. Atmos. 2005, 110, D07108. [Google Scholar] [CrossRef]
- Ambelas SkjøTh, C.; Hertel, O.; GyldenkæRne, S.; Ellermann, T. Implementing a dynamical ammonia emission parameterization in the large-scale air pollution model ACDEP. J. Geophys. Res. Atmos. 2004, 109, D06306. [Google Scholar] [CrossRef]
- Hutchings, N.J.; Sommer, S.G.; Andersen, J.M.; Asman, W.A.H. A detailed ammonia emission inventory for Denmark. Atmos. Environ. 2001, 35, 1959–1968. [Google Scholar] [CrossRef]
- Arogo, J.; Zhang, R.H.; Riskowski, G.L.; Christianson, L.L.; Day, D.L. Mass Transfer Coefficient of Ammonia in Liquid Swine Manure and Aqueous Solutions. J. Agric. Eng. Res. 1999, 73, 77–86. [Google Scholar] [CrossRef]
- Cortus, E.L.; Lemay, S.P.; Barber, E.M.; Hill, G.A. Modelling ammonia emission from swine slurry based on chemical and physical properties of the slurry. Can. Biosyst. Eng. 2009, 51, 6–9. [Google Scholar]
- De Visscher, A.; Harper, L.A.; Westerman, P.W.; Liang, Z.; Arogo, J.; Sharpe, R.R.; Van Cleemput, O. Ammonia Emissions from Anaerobic Swine Lagoons: Model Development. J. Appl. Meteorol. Climatol. 2002, 41, 426–433. [Google Scholar] [CrossRef]
- Sommer, S.G.; Christensen, M.L.; Schmidt, T.; Jensen, L.S. (Eds.) Animal Manure Recycling—Treatment and Management; John Wiley & Sons Ltd.: West Sussex, UK, 2013. [Google Scholar]
- Sommer, S.G.; Zhang, G.Q.; Bannink, A.; Chadwick, D.; Misselbrook, T.; Harrison, R.; Hutchings, N.J.; Menzi, H.; Monteny, G.J.; Ni, J.Q.; et al. Algorithms determining ammonia emission from buildings housing cattle and pigs and from manure stores. Adv. Agron. 2006, 89, 261–335. [Google Scholar] [CrossRef]
- Teye, F.K.; Hautala, M. Adaptation of an ammonia volatilization model for a naturally ventilated dairy building. Atmos. Environ. 2008, 42, 4345–4354. [Google Scholar] [CrossRef]
- Wang, Z.; Zhang, R.; Mansell, G.; Fadel, J.; Rumsey, T.; Xin, H.; Arogo, J. Development of an Improved Process-Based Ammonia Model for Agricultural Sources; Report for Lake Michigan Air Directors Consortium; Lake Michigan Air Directors Consortium: Des Plaines, IL, USA, 2005; Available online: https://www.researchgate.net/publication/265880715 (accessed on 9 May 2023).
- Wang, C.Y.; Li, B.M.; Zhang, G.Q.; Rom, H.B.; Shi, Z.X. Comparison between the Statistical Method and Artificial Neural Networks in Estimating Ammonia Emissions from Naturally Ventilated Dairy Cattle Buildings. In Livestock Environment VIII, Proceedings of the 8th International Symposium, Iguassu Falls, Brazil, 31 August–4 September 2008; American Society of Agricultural and Biological Engineers: St. Joseph, MI, USA, 2009; p. 7. [Google Scholar] [CrossRef]
- Boniecki, P.; Dach, J.; Pilarski, K.; Piekarska-Boniecka, H. Artificial neural networks for modeling ammonia emissions released from sewage sludge composting. Atmos. Environ. 2012, 57, 49–54. [Google Scholar] [CrossRef]
- Stamenković, L.J.; Antanasijević, D.Z.; Ristić, M.; Perić-Grujić, A.A.; Pocajt, V.V. Modeling of ammonia emission in the USA and EU countries using an artificial neural network approach. Environ. Sci. Pollut. Res. Int. 2015, 22, 18849–18858. [Google Scholar] [CrossRef]
- Liakos, K.G.; Busato, P.; Moshou, D.; Pearson, S.; Bochtis, D. Machine Learning in Agriculture: A Review. Sensors 2018, 18, 2674. [Google Scholar] [CrossRef]
- Zhang, Y.; Vu, T.V.; Sun, J.; He, J.; Shen, X.; Lin, W.; Zhang, X.; Zhong, J.; Gao, W.; Wang, Y.; et al. Significant Changes in Chemistry of Fine Particles in Wintertime Beijing from 2007 to 2017: Impact of Clean Air Actions. Environ. Sci. Technol. 2020, 54, 1344–1352. [Google Scholar] [CrossRef]
- Petetin, H.; Bowdalo, D.; Soret, A.; Guevara, M.; Jorba, O.; Serradell, K.; García-Pando, C.P. Meteorology-normalized impact of the COVID-19 lockdown upon NO2 pollution in Spain. Atmos. Chem. Phys. 2020, 20, 11119–11141. [Google Scholar] [CrossRef]
- Wang, Y.; Wen, Y.; Wang, Y.; Zhang, S.; Zhang, K.M.; Zheng, H.; Xing, J.; Wu, Y.; Hao, J. Four-Month Changes in Air Quality during and after the COVID-19 Lockdown in Six Megacities in China. Environ. Sci. Technol. Lett. 2020, 7, 802–808. [Google Scholar] [CrossRef]
- Shi, Z.; Song, C.; Liu, B.; Lu, G.; Xu, J.; Van Vu, T.; Elliott, R.J.R.; Li, W.; Bloss, W.J.; Harrison, R.M. Abrupt but smaller than expected changes in surface air quality attributable to COVID-19 lockdowns. Sci. Adv. 2021, 7, eabd6696. [Google Scholar] [CrossRef]
- Lyu, Y.; Zhang, Q.; Sun, Q.; Gu, M.; He, Y.; Walters, W.W.; Sun, Y.; Pan, Y. Revisiting the dynamics of gaseous ammonia and ammonium aerosols during the COVID-19 lockdown in urban Beijing using machine learning models. Sci. Total Environ. 2023, 905, 166946. [Google Scholar] [CrossRef]
- Huang, L.; Liu, S.; Yang, Z.; Xing, J.; Zhang, J.; Bian, J.; Li, S.; Sahu, S.K.; Wang, S.; Liu, T.-Y. Exploring deep learning for air pollutant emission estimation. Geosci. Model Dev. 2021, 14, 4641–4654. [Google Scholar] [CrossRef]
- Fassò, A.; Rodeschini, J.; Moro, A.F.; Shaboviq, Q.; Maranzano, P.; Cameletti, M.; Finazzi, F.; Golini, N.; Ignaccolo, R.; Otto, P. Agrimonia: A dataset on livestock, meteorology and air quality in the Lombardy region, Italy. Sci. Data 2023, 10, 143. [Google Scholar] [CrossRef]
- Ishwaran, H.; Kogalur, U.B. Fast Unified Random Forests for Survival, Regression, and Classification (RF-SRC). 2023. Available online: https://www.randomforestsrc.org/ (accessed on 1 April 2023).
- Ishwaran, H.; Kogalur, U.B. Random Survival Forests for R. R News 2007, 7, 25–31. [Google Scholar]
- Ishwaran, H.; Kogalur, U.B.; Blackstone, E.H.; Lauer, M.S. Random Survival Forests. Ann. Appl. Stat. 2008, 2, 841–860. [Google Scholar] [CrossRef]
- Ishwaran, H.; Lu, M.; Lauer, M.S.; Blackstone, E.H.; Kogalur, U.B. randomForestSRC: Getting Started with randomForestSRC Vignette. 2021. Available online: http://randomforestsrc.org/articles/survival.html (accessed on 22 June 2023).
- Breiman, L. Random Forests. Mach. Learn. 2001, 45, 5–32. [Google Scholar] [CrossRef]
- Ho, T.K. Random decision forests. Proc. Int. Conf. Doc. Anal. Recognit. ICDAR 1995, 1, 278–282. [Google Scholar] [CrossRef]
- Liaw, A.; Wiener, M. Classification and Regression by randomForest. R News 2002, 2, 18–22. Available online: https://CRAN.R-project.org/doc/Rnews/ (accessed on 17 April 2023).
- Asman, W.A.H.; Sutton, M.A.; Schjørring, J.K. Ammonia: Emission, atmospheric transport and deposition. New Phytol. 1998, 139, 27–48. [Google Scholar] [CrossRef]
- Mailler, S.; Menut, L.; Khvorostyanov, D.; Valari, M.; Couvidat, F.; Siour, G.; Turquety, S.; Briant, R.; Tuccella, P.; Bessagnet, B.; et al. CHIMERE-2017: From urban to hemispheric chemistry-transport modeling. Geosci. Model Dev. 2017, 10, 2397–2423. [Google Scholar] [CrossRef]
- Menut, L.; Bessagnet, B.; Briant, R.; Cholakian, A.; Couvidat, F.; Mailler, S.; Pennel, R.; Siour, G.; Tuccella, P.; Turquety, S.; et al. The CHIMERE v2020r1 online chemistry-transport model. Geosci. Model Dev. 2021, 14, 6781–6811. [Google Scholar] [CrossRef]
- Gariazzo, C.; Silibello, C.; Finardi, S.; Radice, P.; Piersanti, A.; Calori, G.; Cecinato, A.; Perrino, C.; Nussio, F.; Cagnoli, M.; et al. A gas/aerosol air pollutants study over the urban area of Rome using a comprehensive chemical transport model. Atmos. Environ. 2007, 41, 7286–7303. [Google Scholar] [CrossRef]
- Silibello, C.; Calori, G.; Brusasca, G.; Giudici, A.; Angelino, E.; Fossati, G.; Peroni, E.; Buganza, E. Modelling of PM10 concentrations over Milano urban area using two aerosol modules. Environ. Model. Softw. 2008, 23, 333–343. [Google Scholar] [CrossRef]
- Dalla-Fontana, A.; Pillon, S.; Patti, S. A performance evaluation of the CAMx air quality model to forecast ozone and PM10 over the Italian region of Veneto. Tethys 2021, 18, 177–185. [Google Scholar] [CrossRef]
- Ciarelli, G.; Aksoyoglu, S.; Crippa, M.; Jimenez, J.L.; Nemitz, E.; Sellegri, K.; Äijälä, M.; Carbone, S.; Mohr, C.; O’Dowd, C.; et al. Evaluation of European air quality modelled by CAMx including the volatility basis set scheme. Atmos. Chem. Phys. 2016, 16, 10313–10332. [Google Scholar] [CrossRef]
- Nopmongcol, U.; Koo, B.; Tai, E.; Jung, J.; Piyachaturawat, P.; Emery, C.; Yarwood, G.; Pirovano, G.; Mitsakou, C.; Kallos, G. Modeling Europe with CAMx for the Air Quality Model Evaluation International Initiative (AQMEII). Atmos. Environ. 2012, 53, 177–185. [Google Scholar] [CrossRef]
- Sentinel EO-based Emission and Deposition Service—SEEDS. Available online: https://www.seedsproject.eu/data/monthly-nh3-emissions (accessed on 5 May 2023).
- Emissions of Atmospheric Compounds and Compilation of Ancillary Data—ECCAD. 2023. Available online: https://eccad.sedoo.fr/#/catalogue (accessed on 8 May 2023).
- Granier, C.; Darras, S.; van Der Gon, H.D.; Jana, D.; Elguindi, N.; Bo, G.; Michael, G.; Marc, G.; Jalkanen, J.-P.; Kuenen, J.; et al. The Copernicus Atmosphere Monitoring Service Global and Regional Emissions (April 2019 Version); Copernicus Atmosphere Monitoring Service: Toulouse, France, 2019; Available online: https://hal.science/hal-02322431v2 (accessed on 18 April 2023).
- Crippa, M.; Guizzardi, D.; Butler, T.; Keating, T.; Wu, R.; Kaminski, J.; Kuenen, J.; Kurokawa, J.; Chatani, S.; Morikawa, T.; et al. HTAP_v3 emission mosaic: A global effort to tackle air quality issues by quantifying global anthropogenic air pollutant sources. Earth Syst. Sci. Data Discuss. 2023, 1–34. [Google Scholar] [CrossRef]
- Crippa, M.; Guizzardi, D.; Muntean, M.; Schaaf, E.; Dentener, F.; van Aardenne, J.A.; Monni, S.; Doering, U.; Olivier, J.G.J.; Pagliari, V.; et al. Gridded emissions of air pollutants for the period 1970–2012 within EDGAR v4.3.2. Earth Syst. Sci. Data 2018, 10, 1987–2013. [Google Scholar] [CrossRef]
- Guevara, M.; Jorba, O.; Tena, C.; van der Gon, H.D.; Kuenen, J.; Elguindi, N.; Darras, S.; Granier, C.; García-Pando, C.P. Copernicus Atmosphere Monitoring Service TEMPOral profiles (CAMS-TEMPO): Global and European emission temporal profile maps for atmospheric chemistry modelling. Earth Syst. Sci. Data 2021, 13, 367–404. [Google Scholar] [CrossRef]
- Emissions of Atmospheric Compounds and Compilation of Ancillary Data—ECCAD. 2024. Available online: https://eccad.sedoo.fr/#/catalogue (accessed on 7 February 2024).
- Soulie, A.; Granier, C.; Darras, S.; Zilbermann, N.; Doumbia, T.; Guevara, M.; Jalkanen, J.P.; Keita, S.; Liousse, C.; Crippa, M.; et al. Global Anthropogenic Emissions (CAMS-GLOB-ANT) for the Copernicus Atmosphere Monitoring Service Simulations of Air Quality Forecasts and Reanalyses. Earth Syst. Sci. Data 2023, 1–45. [Google Scholar] [CrossRef]
- Hosseini, B.; Stockie, J.M. Bayesian estimation of airborne fugitive emissions using a Gaussian plume model. Atmos. Environ. 2016, 141, 122–138. [Google Scholar] [CrossRef]
- Kaipio, J.; Somersalo, E. Statistical and Computational Inverse Problems. In Applied Mathematical Sciences; Springer: New York, NY, USA, 2006. [Google Scholar]
- Therneau, T.; Atkinson, B.; Ripley, B. Recursive Partitioning and Regression Trees. 2022. Available online: https://cran.r-project.org/package=rpart (accessed on 1 April 2023).
Disclaimer/Publisher’s Note: The statements, opinions and data contained in all publications are solely those of the individual author(s) and contributor(s) and not of MDPI and/or the editor(s). MDPI and/or the editor(s) disclaim responsibility for any injury to people or property resulting from any ideas, methods, instructions or products referred to in the content. |
© 2024 by the authors. Licensee MDPI, Basel, Switzerland. This article is an open access article distributed under the terms and conditions of the Creative Commons Attribution (CC BY) license (https://creativecommons.org/licenses/by/4.0/).