Communication

Short-Term Forage Responses, Soil Nitrogen Availability, and Greenhouse Gas Fluxes Under Contrasting Nitrogen Sources in Cool-Season Forage Systems

1
Animal and Veterinary Sciences Department, Clemson University, 64 Research Rd., Blackville, SC 29817, USA
2
Plant and Environmental Sciences Department, Clemson University, Florence, SC 29506, USA
3
Plant and Environmental Sciences Department, Clemson University, Clemson, SC 29638, USA
*
Author to whom correspondence should be addressed.
Grasses 2026, 5(3), 32; https://doi.org/10.3390/grasses5030032
Submission received: 3 July 2026 / Revised: 10 August 2026 / Accepted: 14 August 2026 / Published: 25 August 2026
(This article belongs to the Special Issue Feature Papers in Grasses)

Highlights

  • Legume integration enhanced forage CP and labile soil N without increasing CH4 flux.
  • Inorganic fertilizer and poultry litter had limited effects on most forage and soil health responses.
  • Cattle dung increased early CH4 flux without changing soil or forage responses.

Abstract

Nitrogen (N) sources affect forage production, soil N dynamics, and greenhouse gas (GHG) emissions. This study evaluated short-term effects of contrasting N sources on forage responses, soil health indicators, and GHG emissions in a cool-season oat (Avena sativa L.) and annual ryegrass (Lolium multiflorum L.) system. Treatments were T1 (grass only), T2 (grass + N), T3 (grass + legume), T4 (grass + poultry litter), and T5 (grass + cattle dung). Crude protein was greater in T3 than in T4 (18% versus 13%; p = 0.02). In May, T3 had the greatest microbial C:N ratio (60.6) and soil inorganic N (45.5 mg N kg−1; p < 0.01). Potentially mineralizable N was greater in T3 than in T1, T2 and T4 (3.96 versus ≤ 2.71 mg NH4-N kg−1 day−1; p < 0.01). Mean daily CH4 fluxes were greater (p < 0.01) under T5 (1106 g CH4-C ha−1 day−1) than under T1 and T3 (≤−3.59 g CH4-C ha−1 day−1). Mean daily CO2 fluxes were lower in T3 and T4 than in T1, T2, and T5. There were no effects on N2O emissions. Legume integration enhanced short-term N cycling and forage nutritive value, without N2O emissions, over a 60-day experiment.

1. Introduction

Livestock operations in the southeastern United States are primarily based on perennial grasses such as bahiagrass (Paspalum notatum Flueggé), bermudagrass (Cynodon dactylon L.), and tall fescue (Festuca arundinaceae (Schreb.) Dumort.). Because forage production from perennial grasses is highly seasonal, producers commonly incorporate annual forage species to extend the grazing season [1,2]. Cool-season annual forages, such as annual ryegrass, oat, and clovers (Trifolium spp. L.) are commonly used in the region due to their productivity, seasonal distribution, and nutritive value [1,3]. The performance of these species is strongly affected by nitrogen (N) management and by forage species composition [4,5,6].
Nitrogen in forage systems can be supplied through various management strategies, including inorganic fertilizer application, organic amendments, localized deposition of cattle dung, and biological N fixation by legumes. These strategies differ in how N is introduced into the system, its spatial distribution, release patterns, and interactions with soil biological and physical processes [7,8]. As a result, they can influence forage production and nutritive value, soil carbon (C) and N dynamics, and the magnitude and pathways of greenhouse gas (GHG) emissions [9,10,11,12]. A clear understanding of how these management strategies influence forage systems is therefore essential for developing practices that optimize forage productivity and environmental sustainability while improving chemical, physical, and biological soil properties commonly used as indicators of soil health.
Inorganic N fertilization is widely used to improve forage production and nutritive value in annual cool-season forage systems [13,14], supporting animal performance and carrying capacity [15,16]. When appropriately managed, N inputs can increase crude protein and reduce fiber concentrations [17,18,19]. However, higher or poorly synchronized N inputs can also increase N losses and contribute to GHG emissions [20]. In contrast, systems that incorporate legume or organic amendments often exhibit a more closed N cycle, characterized by lower inorganic N and potentially lower emission intensity, relative to conventional fertilizer-based systems [21,22].
Legume integration is a key biological strategy for supplying N in forage ecosystems. Common cool-season forage legumes in the region include crimson clover (Trifolium incarnatum L.), arrowleaf clover (Trifolium vesiculosum Savi), and hairy vetch (Vicia villosa Roth) [23,24]. Through biological N fixation, legumes can reduce reliance on inorganic fertilizer while enhancing forage nutritive value [25,26]. In addition, legume inclusion can increase biomass and litter inputs, an important pathway for returning C and N to soils and supporting longer-term nutrient cycling [27,28].
Beyond forage responses, N source selection can influence soil properties associated with soil health. Nitrogen inputs influence soil C and N pools, soil aggregation, and microbial activity [29]. Studies have reported greater soil C accumulation, higher potentially mineralizable N, and improved aggregation in systems that receive organic amendments or legumes compared with systems that rely on inorganic N fertilizers [30,31,32]. Conversely, inorganic fertilizers can increase soil inorganic N and nitrate concentrations [33,34], which may elevate risks of runoff and deterioration of water quality. Soil biological properties, including microbial biomass and related responses, can also be sensitive to N management, with several properties responding more strongly to organic inputs than to inorganic fertilizers [35,36,37].
Many studies in cool-season grazing systems have evaluated the effects of N management on forage production, soil properties, or GHG emissions; however, these responses have often been assessed separately or over longer time scales. Consequently, limited information is available on the short-term responses of forage production, soil health indicators, and GHG emissions to contrasting N management strategies evaluated simultaneously under field conditions. Although short-term studies cannot capture long-term changes in soil health, they can identify early responses of chemical, physical, and biological soil indicators following N application.
Therefore, we hypothesized that N management strategies differing in N source, the rate of mineral N release, and spatial distribution would produce contrasting short-term responses in forage production, soil health indicators, and GHG emissions. To test this hypothesis, the objectives of this study were to (i) evaluate the short-term effects of contrasting N sources, including inorganic fertilizer, poultry litter, cattle dung, and a grass–legume mixture, on forage mass and nutritive value, soil chemical, physical, and biological indicators, and GHG fluxes in a cool-season forage system in South Carolina, and (ii) assess relationships among soil, forage, and GHG variables using correlation analyses.

2. Materials and Methods

2.1. Site Description

A 2-month study was carried out at a commercial beef cattle farm in Calhoun County, South Carolina, USA, during the 2025 growing season. The study site is in a humid subtropical climate (Köppen Cfa [38]), typical of the southeastern USA, with gently rolling topography and elevations ranging from approximately 90 to 130 m above sea level. The annual rainfall at the experimental site in 2025 was 798 mm, and the average monthly temperature ranged from 5 °C in winter to 28 °C in summer. Climatic data were obtained from the National Oceanic and Atmospheric Administration (NOAA) dataset for the research site (NOAA, 2025; Available at https://www.weather.gov/wrh/climate, accessed on 10 December 2025).
The soil at the experimental site is classified as an Orangeburg series sandy loam (fine-loamy, kaolinitic, thermic Typic Paleudults) according to the USDA Web Soil Survey (Available at https://websoilsurvey.nrcs.usda.gov/app/, accessed on 10 December 2025). Initial soil chemical properties (0–15 cm), determined by the Clemson University Agricultural Service Laboratory following standard analytical procedures, included organic matter of 1.25%, soil pH (1:1 soil:water) of 6.2, cation exchange capacity of 10 meq 100 g−1, sum of bases of 2.4 cmol kg−1, available P of 34.5 mg kg−1, available K of 161 mg kg−1, Ca of 1296 mg kg−1, and Mg of 158 mg kg−1. Soil bulk density was 1.4 g cm−3. The site had been managed under a forage–livestock production system for more than a decade prior to the establishment of the study.

2.2. Experimental Design and Management

The experiment was established in an annual cool-season forage mixture consisting of oat (Avena sativa L.), annual ryegrass (Lolium multiflorum L.), and cool-season legumes. In late October 2024, this grass mixture was planted using a no-till drill (Kincaid–Great Plains Compact Drill, model 3P606NT; Great Plains Manufacturing Inc., Salina, KS, USA) with 10 cm row spacing. The seeding rate used was 65 and 12 kg pure live seed (PLS) ha−1 for oat and annual ryegrass, respectively. No fertilizer was applied before planting.
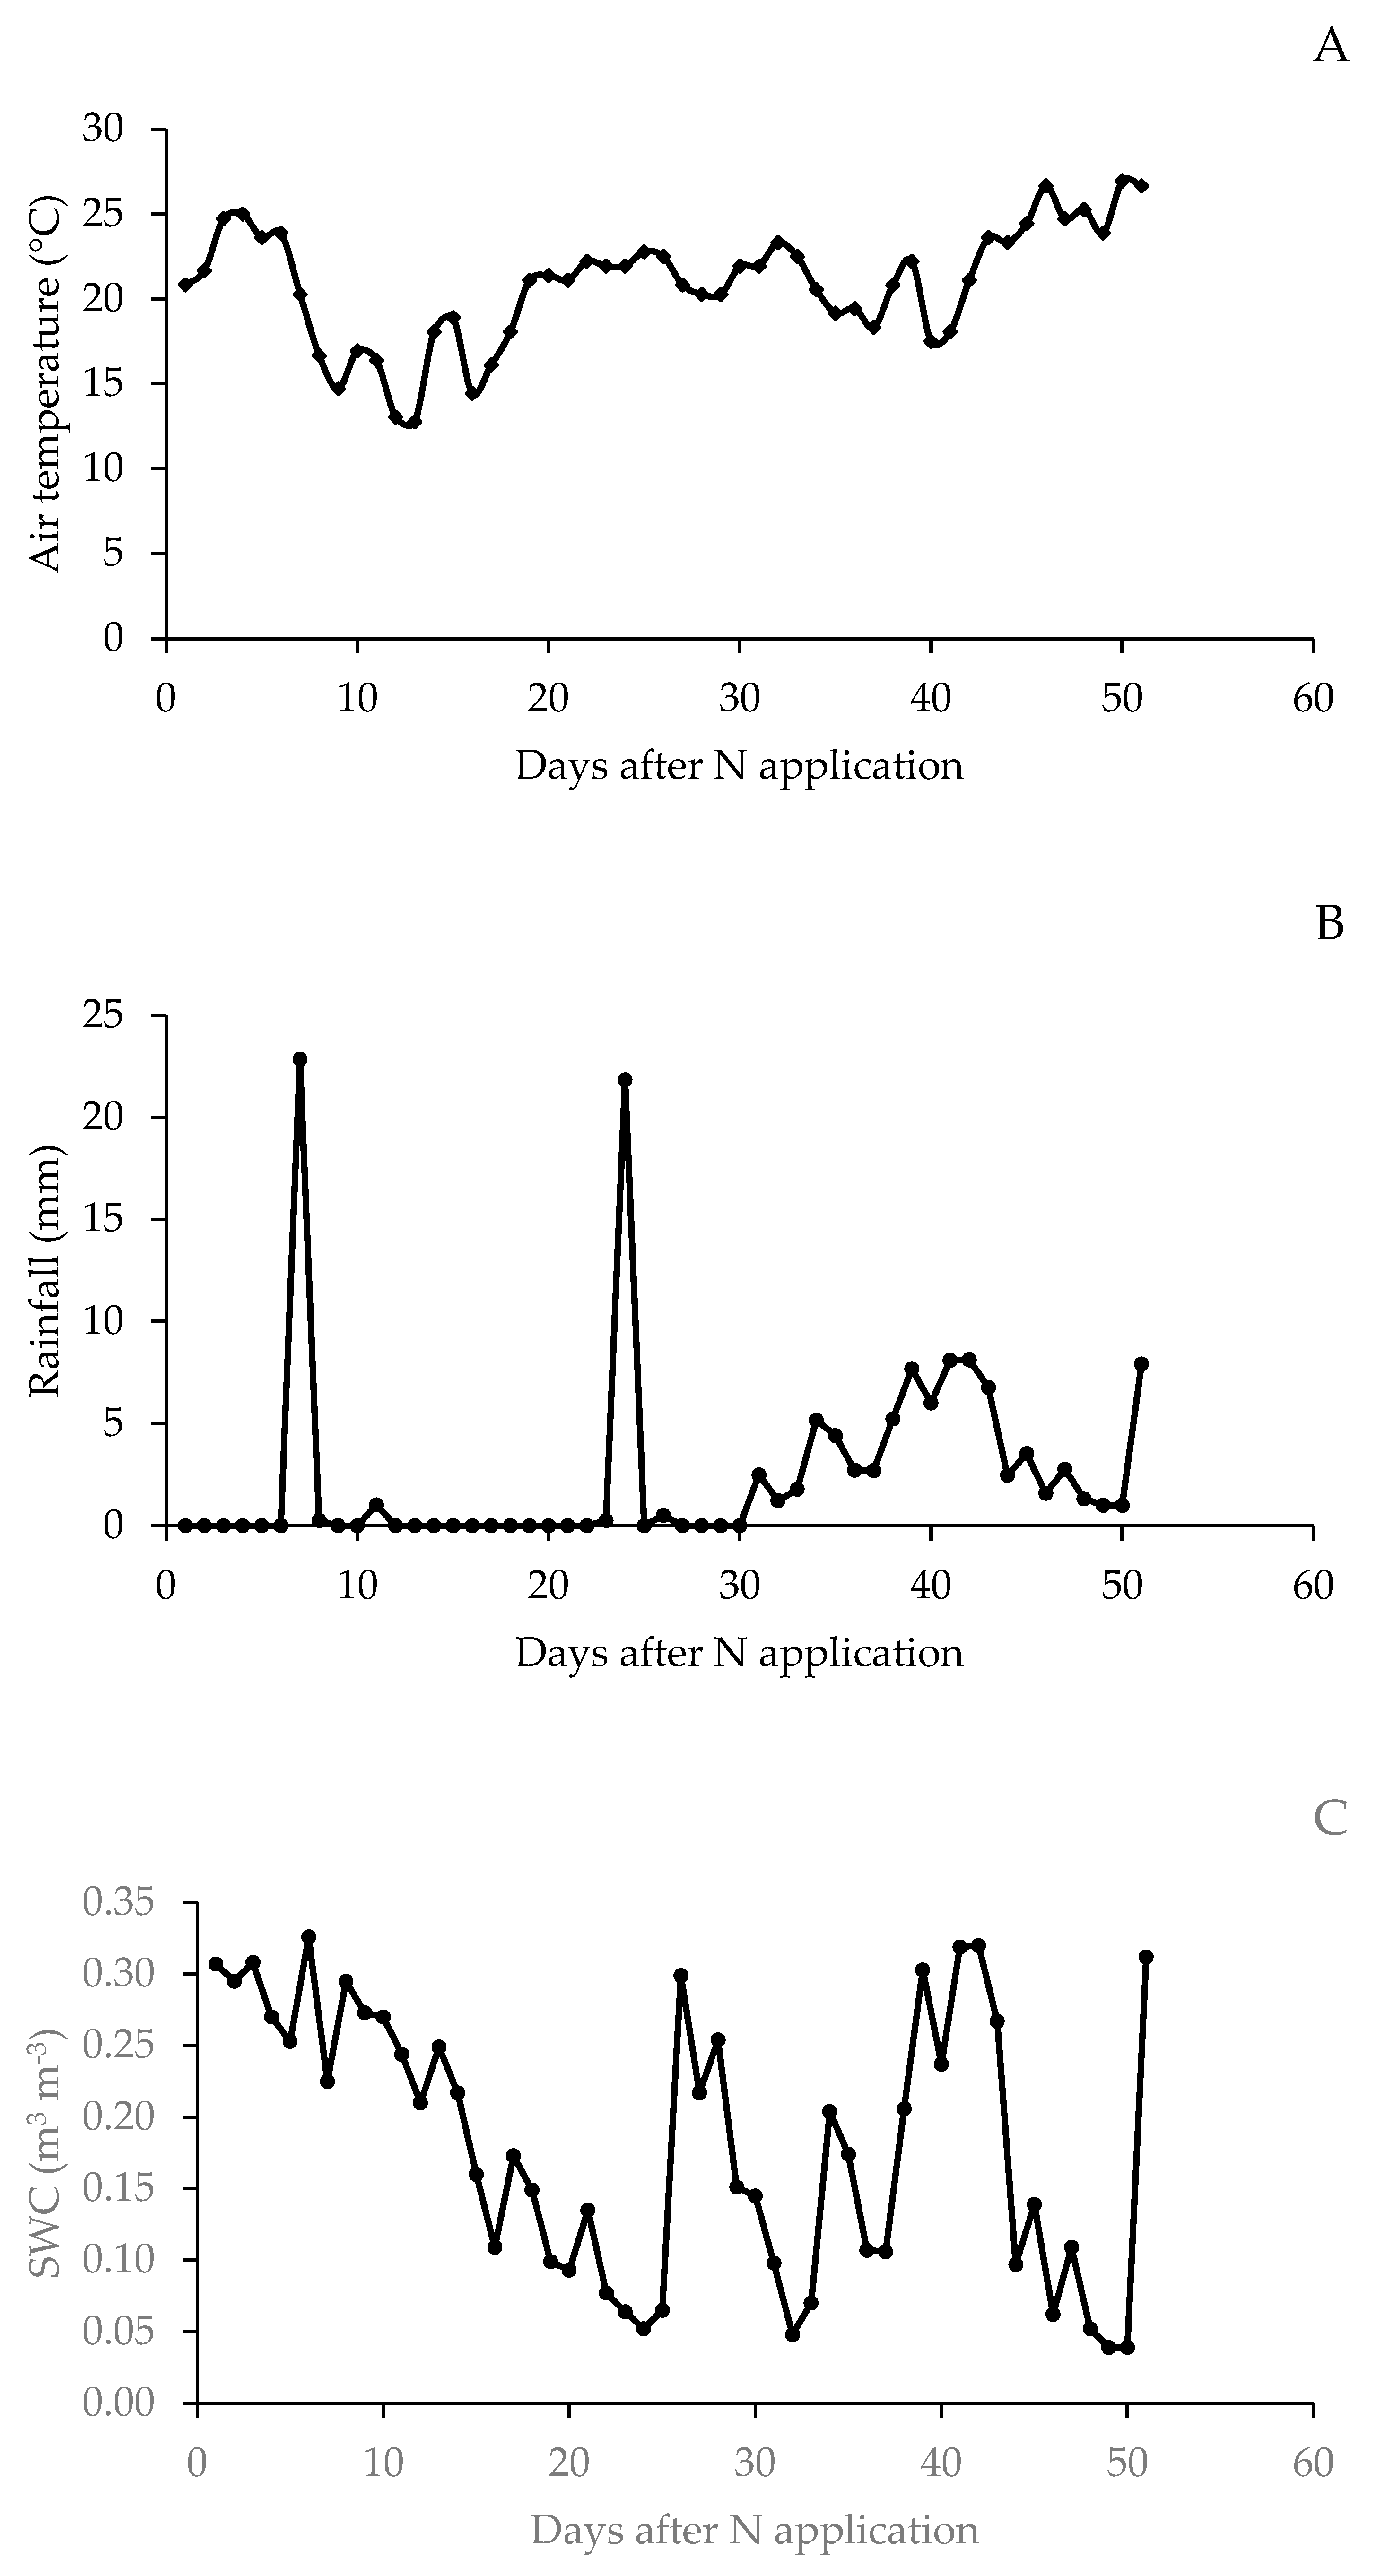
Daily air temperature, rainfall, and volumetric soil water content recorded during the experimental period are presented in Figure 1A–C. These environmental conditions provide the climatic context for interpreting temporal variation in forage responses and greenhouse gas fluxes.
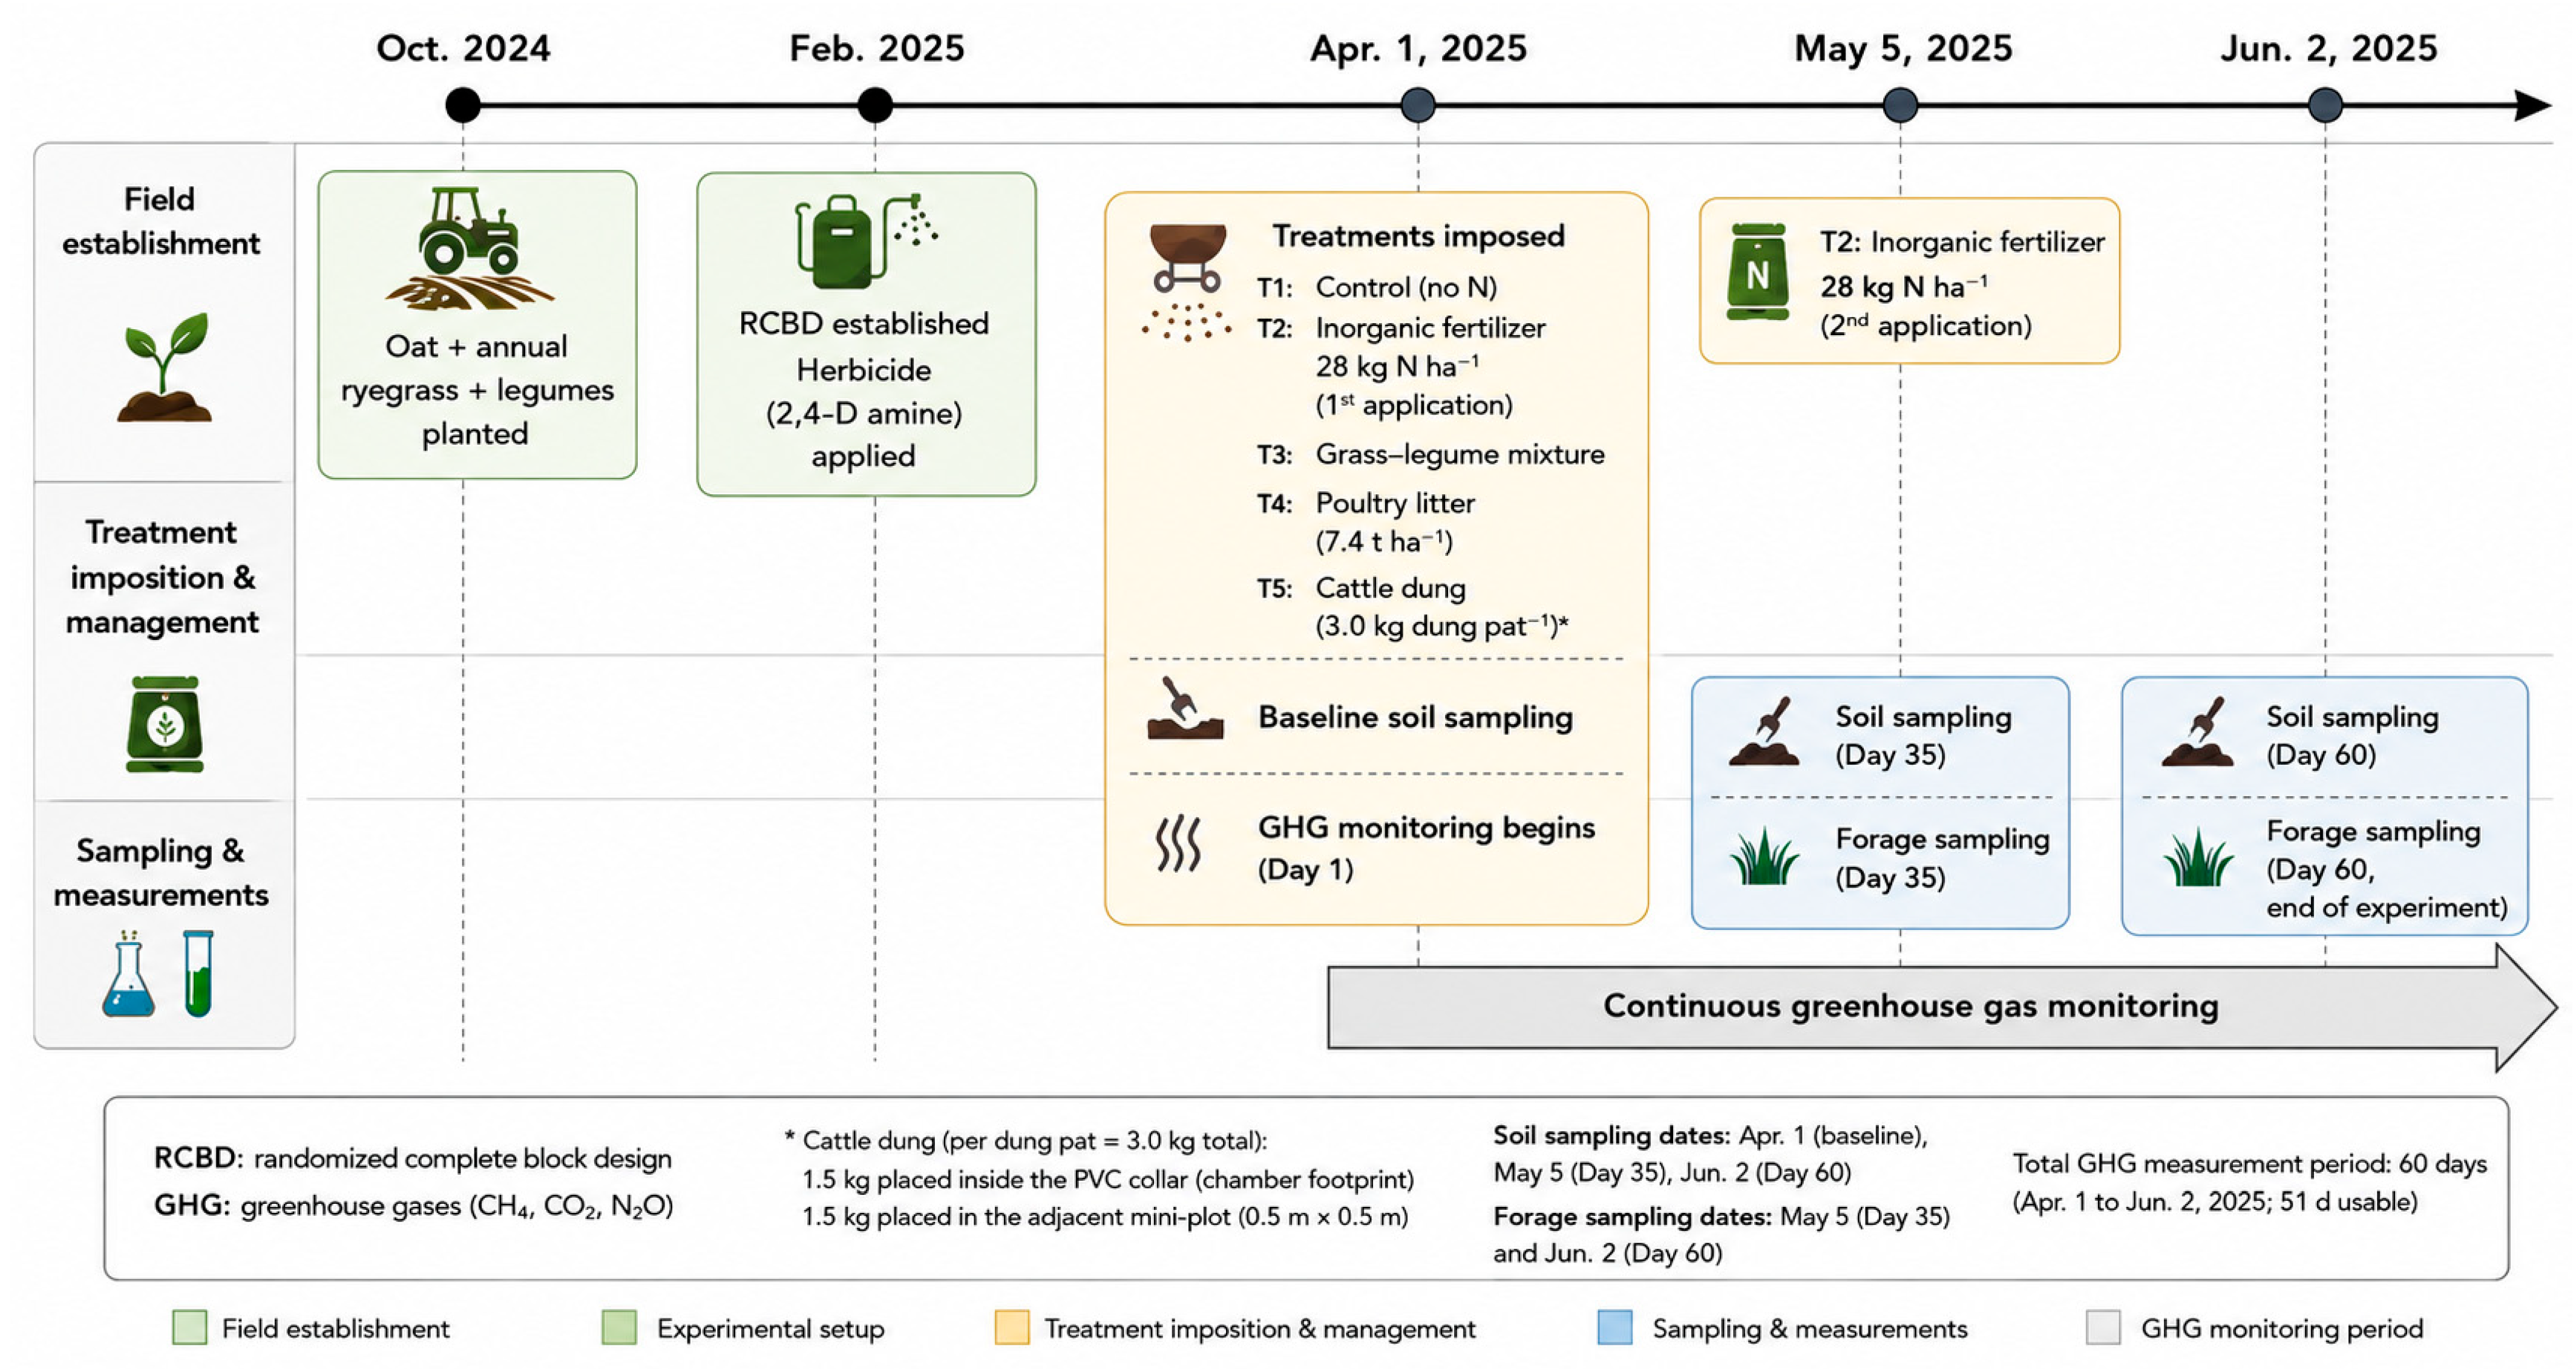
In February 2025, a randomized complete block design was established using five treatments [control (no N fertilizer) and four N management strategies] and three replicates (15 experimental units in total). Each experimental unit (plot) measured 3 × 3 m with 1.2 m alleys. Treatments consisted of control (T1; no N fertilizer), inorganic fertilizer at 56 kg N ha−1 (T2), grass–legume mixture (T3), poultry litter application at 7.4 t ha−1 (T4), and cattle dung (T5). The experimental area was initially established as a uniform grass–legume mixture. Prior to treatment imposition, legumes were selectively removed (using herbicide) from T1, T2, T4, and T5 to establish the intended treatment contrasts, whereas T3 retained the original grass–legume mixture. The sequence of experimental establishment and treatment imposition is summarized in Figure 2.
Broadleaf control was achieved using 2,4-D amine (active ingredient: 2,4-dichlorophenoxyacetic acid; Nufarm Americas Inc., Alsip, IL, USA) at 0.7 kg a.e. ha−1 applied with a backpack sprayer calibrated for uniform coverage according to label recommendations. Herbicide application was performed only once in February, before treatment imposition (in April; Figure 2), to establish the intended forage composition of each treatment (T1, T2, T4 and T5). The treatment chemical composition is presented in Table 1.
The inorganic N (T2) rate mimics a low-input fertilization strategy typical of regional forage production systems. The total N rate (56 kg N ha−1) was split into two hand-broadcast surface applications of 28 kg N ha−1 each (on 1 April and 5 May). The first application used a granular 19–19–19 (N–P2O5–K2O) fertilizer to supply N, P, and K according to the site’s soil fertility recommendations, whereas the second application used a granular 13–0–0 fertilizer to supply N only (Table 1). Split N application was adopted to better synchronize N availability with forage demand while reducing potential N losses. No rainfall occurred during the first seven days following the initial fertilizer application, allowing the fertilizer to remain on the soil surface. Application timing, rates, and the experimental timeline are summarized in Figure 2.
The legume treatment (T3) included a mixture of crimson clover (Trifolium incarnatum L.), arrowleaf clover (Trifolium vesiculosum Savi), and hairy vetch (Vicia villosa Roth). All legume species were established using commercially available pre-inoculated seeds containing the appropriate Rhizobium strains. The seeding rates for each legume were 10, 5.6, and 3.9 kg PLS ha−1, respectively. Poultry litter (T4) was sourced from a local commercial poultry house and applied at the recommended rate [39]. A poultry subsample was collected at the time of application for laboratory analysis of chemical composition (Table 1).
Cattle dung (T5) was collected from the collaborator’s farm pastures in accordance with biosecurity protocols (e.g., long-sleeve gloves and boot covers). Fresh dung from adult Angus cattle was collected immediately after defecation. The amount applied (1.5 kg on areas ranging from 0.05 to 0.09 m2) was based on the reported fecal deposition characteristics of adult cattle [40,41]. The 1.5 kg dung pat was placed in a PVC collar with an area of 0.07 m2, which closely matches a deposition area of a single defecation by an adult beef cow. This PVC collar was used for greenhouse gas measurements. To minimize contamination and N losses, the dung was processed as described by Garcia et al. [42]. Another 1.5 kg of dung pat was placed within a separate 0.5 × 0.5 m mini-plot for forage and soil sampling (Figure 2). The dung treatment represented a single natural cattle defecation event, with 1.5 kg of fresh dung applied as a localized patch rather than uniformly across the plot; therefore, the treatment was expressed on a per-patch basis rather than as a field-scale application rate (t ha−1).
For T1, T2, T3, and T4, treatments were uniformly established across the entire 3 × 3 m plot, and PVC collars were randomly inserted for greenhouse gas measurements. Thus, the collars represented the surrounding treatment conditions and did not receive separate applications. All treatments were imposed simultaneously during active vegetative cool-season growth, when plants have high N demand and uptake. Each N source was applied according to its typical field management or natural deposition pattern (e.g., uniform fertilizer application or localized cattle dung deposition), rather than being standardized to an equivalent N application rate, thereby representing realistic management conditions commonly found in grazing systems (Figure 2).

2.3. Response Variables

2.3.1. Forage Mass, Nutritive Value, Litter Biomass and Chemical Composition

On 5 May (34 days after treatment application) and June 2 (28 days after the first harvest), forage mass (FM) was determined by harvesting two 0.12-m2 samples per plot to a 10 cm stubble height using polyvinyl chloride (PVC) quadrats. The two subsamples were processed separately, and their mean value was used as the experimental unit for statistical analyses. Sampling locations were relocated within each plot at the second harvest to avoid resampling previously harvested areas. Fresh weight was recorded in the field, oven-dried at 55 °C until a constant weight, and ground to pass a 1 mm screen using a Wiley Mill (Model T3700.002; Thomas Scientific, Swedesboro, NJ, USA). Fiber concentrations were determined using a Delta Fiber Analyzer (ANKOM Technology, Macedon, NY, USA) according to the procedures described by ANKOM Technology [43,44]. Crude protein concentration was determined by automated digestion and distillation using a Kjeltec™ 9 analyzer (FOSS Analytical, Hillerød, Denmark), based on Kjeldahl chemistry according to AOAC Official Method 2001.11.
In vitro dry matter digestibility (IVDDM) was assessed using an ANKOM Daisy II incubator (ANKOM Technology, Macedon, NY, USA). Care and handling of donor animals were approved by the Clemson University Committee on Animal Use (AUP2022-0464). A composite inoculum was prepared from rumen fluid and solids collected before the morning feeding from two rumen-fistulated lactating dairy cows fed a corn silage-, barley silage-, bermudagrass hay-, and concentrate-based diet. Samples were incubated in duplicate for 30 h following the procedures of Ferreira and Mertens [45], who describe more details about the process (e.g., fluid storage method, etc.). All forage nutritive value variables (CP, NDF, ADF, and IVDDM) were expressed on a dry matter basis.
Litter was defined as the dead aboveground plant tissue no longer attached to a stem. Litter was sampled only in June using 2 PVC quadrats (0.12 m2), oven-dried at 55 °C until a constant weight, ground to pass a 1 mm screen, and analyzed for C and N concentrations with a LECO CN 828 Analyzer (LECO Corporation, St. Joseph, MI, USA). Concentrations were used to calculate the C:N ratio.

2.3.2. Soil Health Indicators

A baseline composite sample from the experimental area was taken on 1 April 2025, prior to treatment application. Subsequent sampling occurred on 5 May and 2 June, following approximately 30-day intervals, aiming to capture short-term soil responses to N inputs. In each plot, five soil cores (200 g) were collected at 0–15 cm depth, composited, placed in plastic bags on ice, transported to the laboratory at the Clemson University Pee Dee Research and Education Center, and stored at 4 °C until analyzed within one week.
Microbial biomass C (MBC) and N (MBN) were determined using the chloroform fumigation–extraction method following Voroney et al. [46], applying conversion factors of 0.37 and 0.54 for MBC and MBN, respectively. The microbial C:N ratio was calculated by dividing MBC by MBN. Extractable ammonium (NH4+; EA) and nitrate (NO3; EN) were determined colorimetrically after extraction with 1 M KCl as described by Verdouw et al. [47] and Doane and Horwath [48]. Potentially mineralizable N (PMN) was determined by anaerobic incubation at 30 °C for 7 d followed by 1 M KCl extraction. Activity of N-acetyl-β-D-glucosaminidase (NAG) was determined fluorometrically using 5 g (dry-equivalent) soil incubated in triplicate according to Ye et al. [49]. Soil organic carbon (SOC) and soil organic N (SON) were measured by dry combustion using a CN analyzer (Carlo Erba NA 1500, Carlo Erba Strumentazione, Milan, Italy). Wet soil aggregate stability (WAS) was determined by wet sieving using 20 g of sieved soil and expressed as mean weight diameter (MWD) following Six et al. [50] and Márquez et al. [51]. Basal soil respiration (BSR) was measured as CO2 production by incubating rewetted soil samples for 24 h [52]. Detailed analytical procedures for each assay are described in the corresponding references cited above.

2.3.3. Greenhouse Gas Fluxes Measurements

Soil GHG fluxes were measured using an automated static chamber system installed on permanent PVC collars. Fifteen automated chambers (LI-8200-104, LI-COR Inc., Lincoln, NE, USA) were deployed on April 1, immediately following treatment application. Each chamber enclosed a soil surface area of 317.8 cm2 with an internal volume of 4076.1 cm3. Gas concentrations were measured using an LI-7810 analyzer for CO2 and CH4 and an LI-7820 analyzer for N2O, controlled by an LI-8250 multiplexer (LI-COR Inc., Lincoln, NE, USA), following the manufacturer’s specifications and the methodology described by LI-COR [53]. Soil temperature (ST) and soil water content (SWC) were simultaneously monitored using Stevens Hydra Probe sensors installed approximately 10 cm from each PVC collar at a depth of 10 cm.
Each chamber remained closed for 5 min, consisting of 3 min of gas concentration measurements followed by 2 min of chamber ventilation before the next chamber was sampled. A complete measurement cycle across the 15 chambers required approximately 75 min and was repeated continuously throughout the 24 h period. Gas concentration data were processed using SoilFluxPro software (version 4.2, LI-COR Inc., Lincoln, NE, USA) and only measurements with R2 ≥ 0.75 were retained for statistical analyses. Initial chamber conditions were estimated from the first measurements following chamber closure, and gas fluxes were subsequently calculated using the manufacturer’s non-linear regression algorithm, which accounts for the non-linear change in gas concentration during chamber deployment [53].
Greenhouse gas fluxes were monitored continuously for 60 consecutive days following treatment application. A technical malfunction caused by a short circuit in the LI-8250 multiplexer prevented reliable measurements during the final nine days of monitoring. Consequently, statistical analyses were performed using data from Days 1, 2, 3, 4, 7, 14, 21, 28, 35, 42, and 51. These evaluation intervals were defined a priori to capture both the rapid responses immediately following treatment application and the subsequent longer-term dynamics, while maintaining representative temporal resolution and reducing redundancy associated with the large number of high-frequency measurements generated by the automated chamber system.

2.4. Statistical Analysis

Plant, soil and GHG data were analyzed separately in R v4.4.0 (R Core Team, Vienna, Austria) using linear mixed-effects models. Treatment, harvest, month or day, and their interaction were considered fixed effects, whereas block was considered a random effect. LSMEANS were compared using Tukey’s test (p < 0.05). Pairwise associations among variables were further evaluated using Pearson correlation analysis.

3. Results

3.1. Forage Mass, Nutritive Value, Litter Biomass and Chemical Composition

There was no treatment × harvest interaction for FM, NDF, ADF and IVDDM concentrations; therefore, results are presented as treatment means averaged across harvest time and the average of harvest across treatments (Table 2). Treatment differences were not significant (p > 0.05) for FM, NDF, ADF and IVDDM concentrations, with values averaging from 3325 kg DM ha−1, 52%, 30% and 64%, respectively, across treatments. Forage mass was greater (p < 0.01) in June than in May (4446 vs. 1546 kg DM ha−1). No significant difference was found in NDF, ADF, and IVDDM concentrations among treatments (p > 0.05). However, in June, NDF and ADF concentrations were greater (p < 0.01) than in May (Table 2).
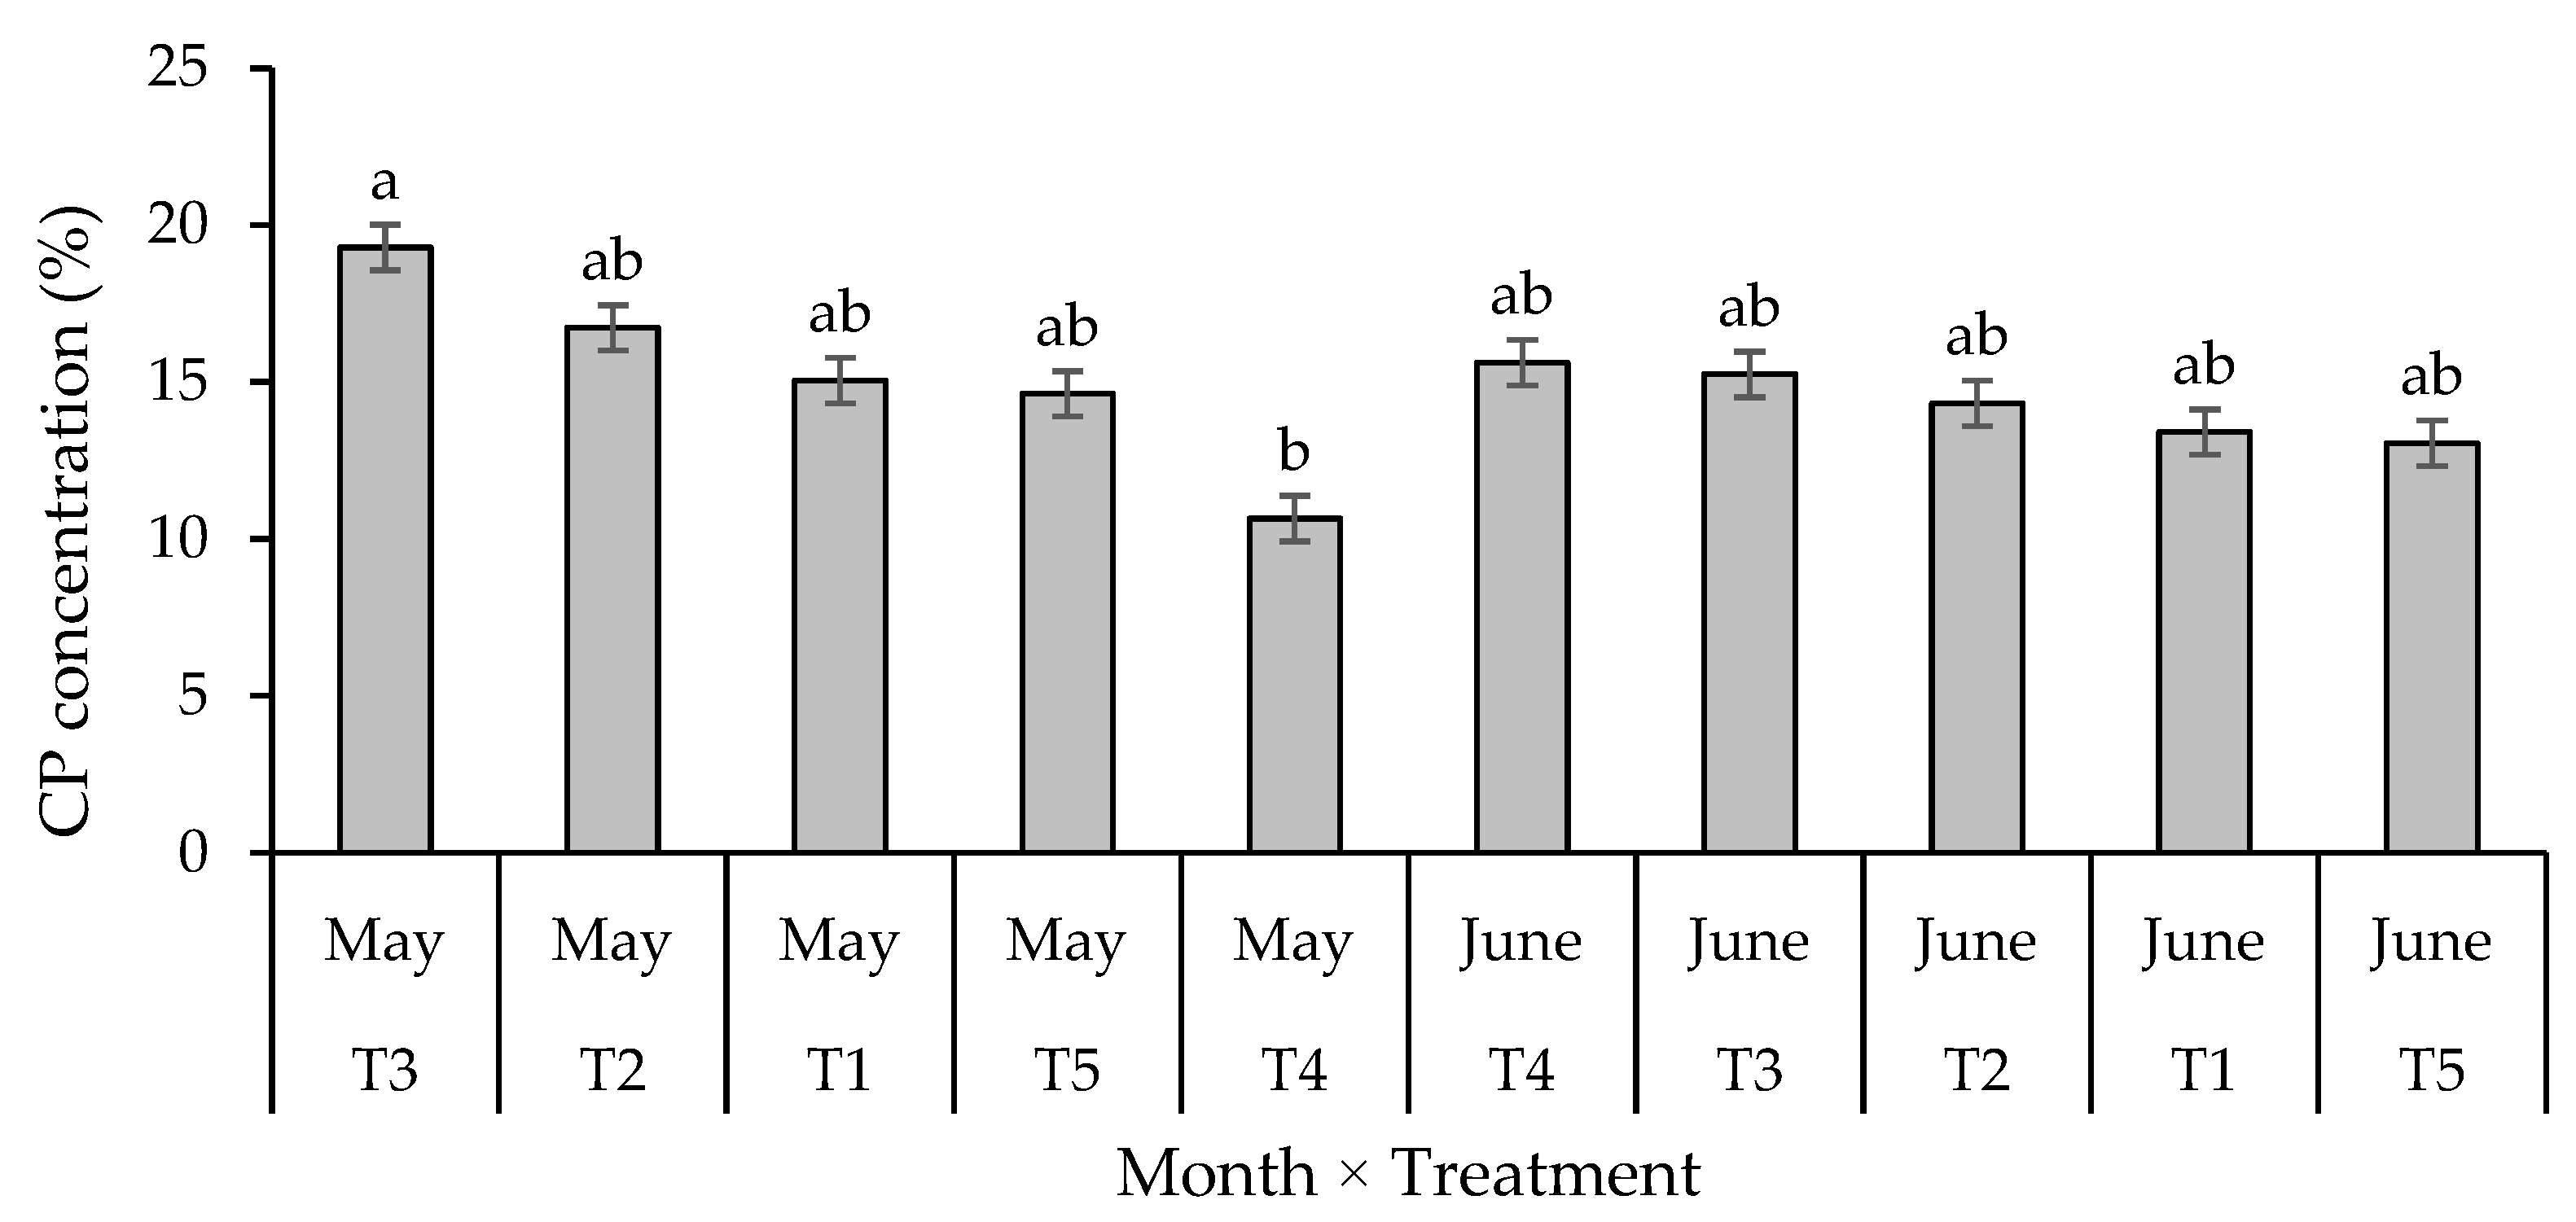
There was a treatment × harvest interaction (p = 0.01; SE = 1.19) for CP concentration. In May, T3 had greater CP concentration (19.2%) than T4 (10.6%), but did not differ from other treatments (Figure 3). No statistically significant difference was found for Litter C:N ratio among treatments (p > 0.05), and values ranged from 21.4 to 24.8 across treatments (Table 2).

3.2. Soil Health Indicators

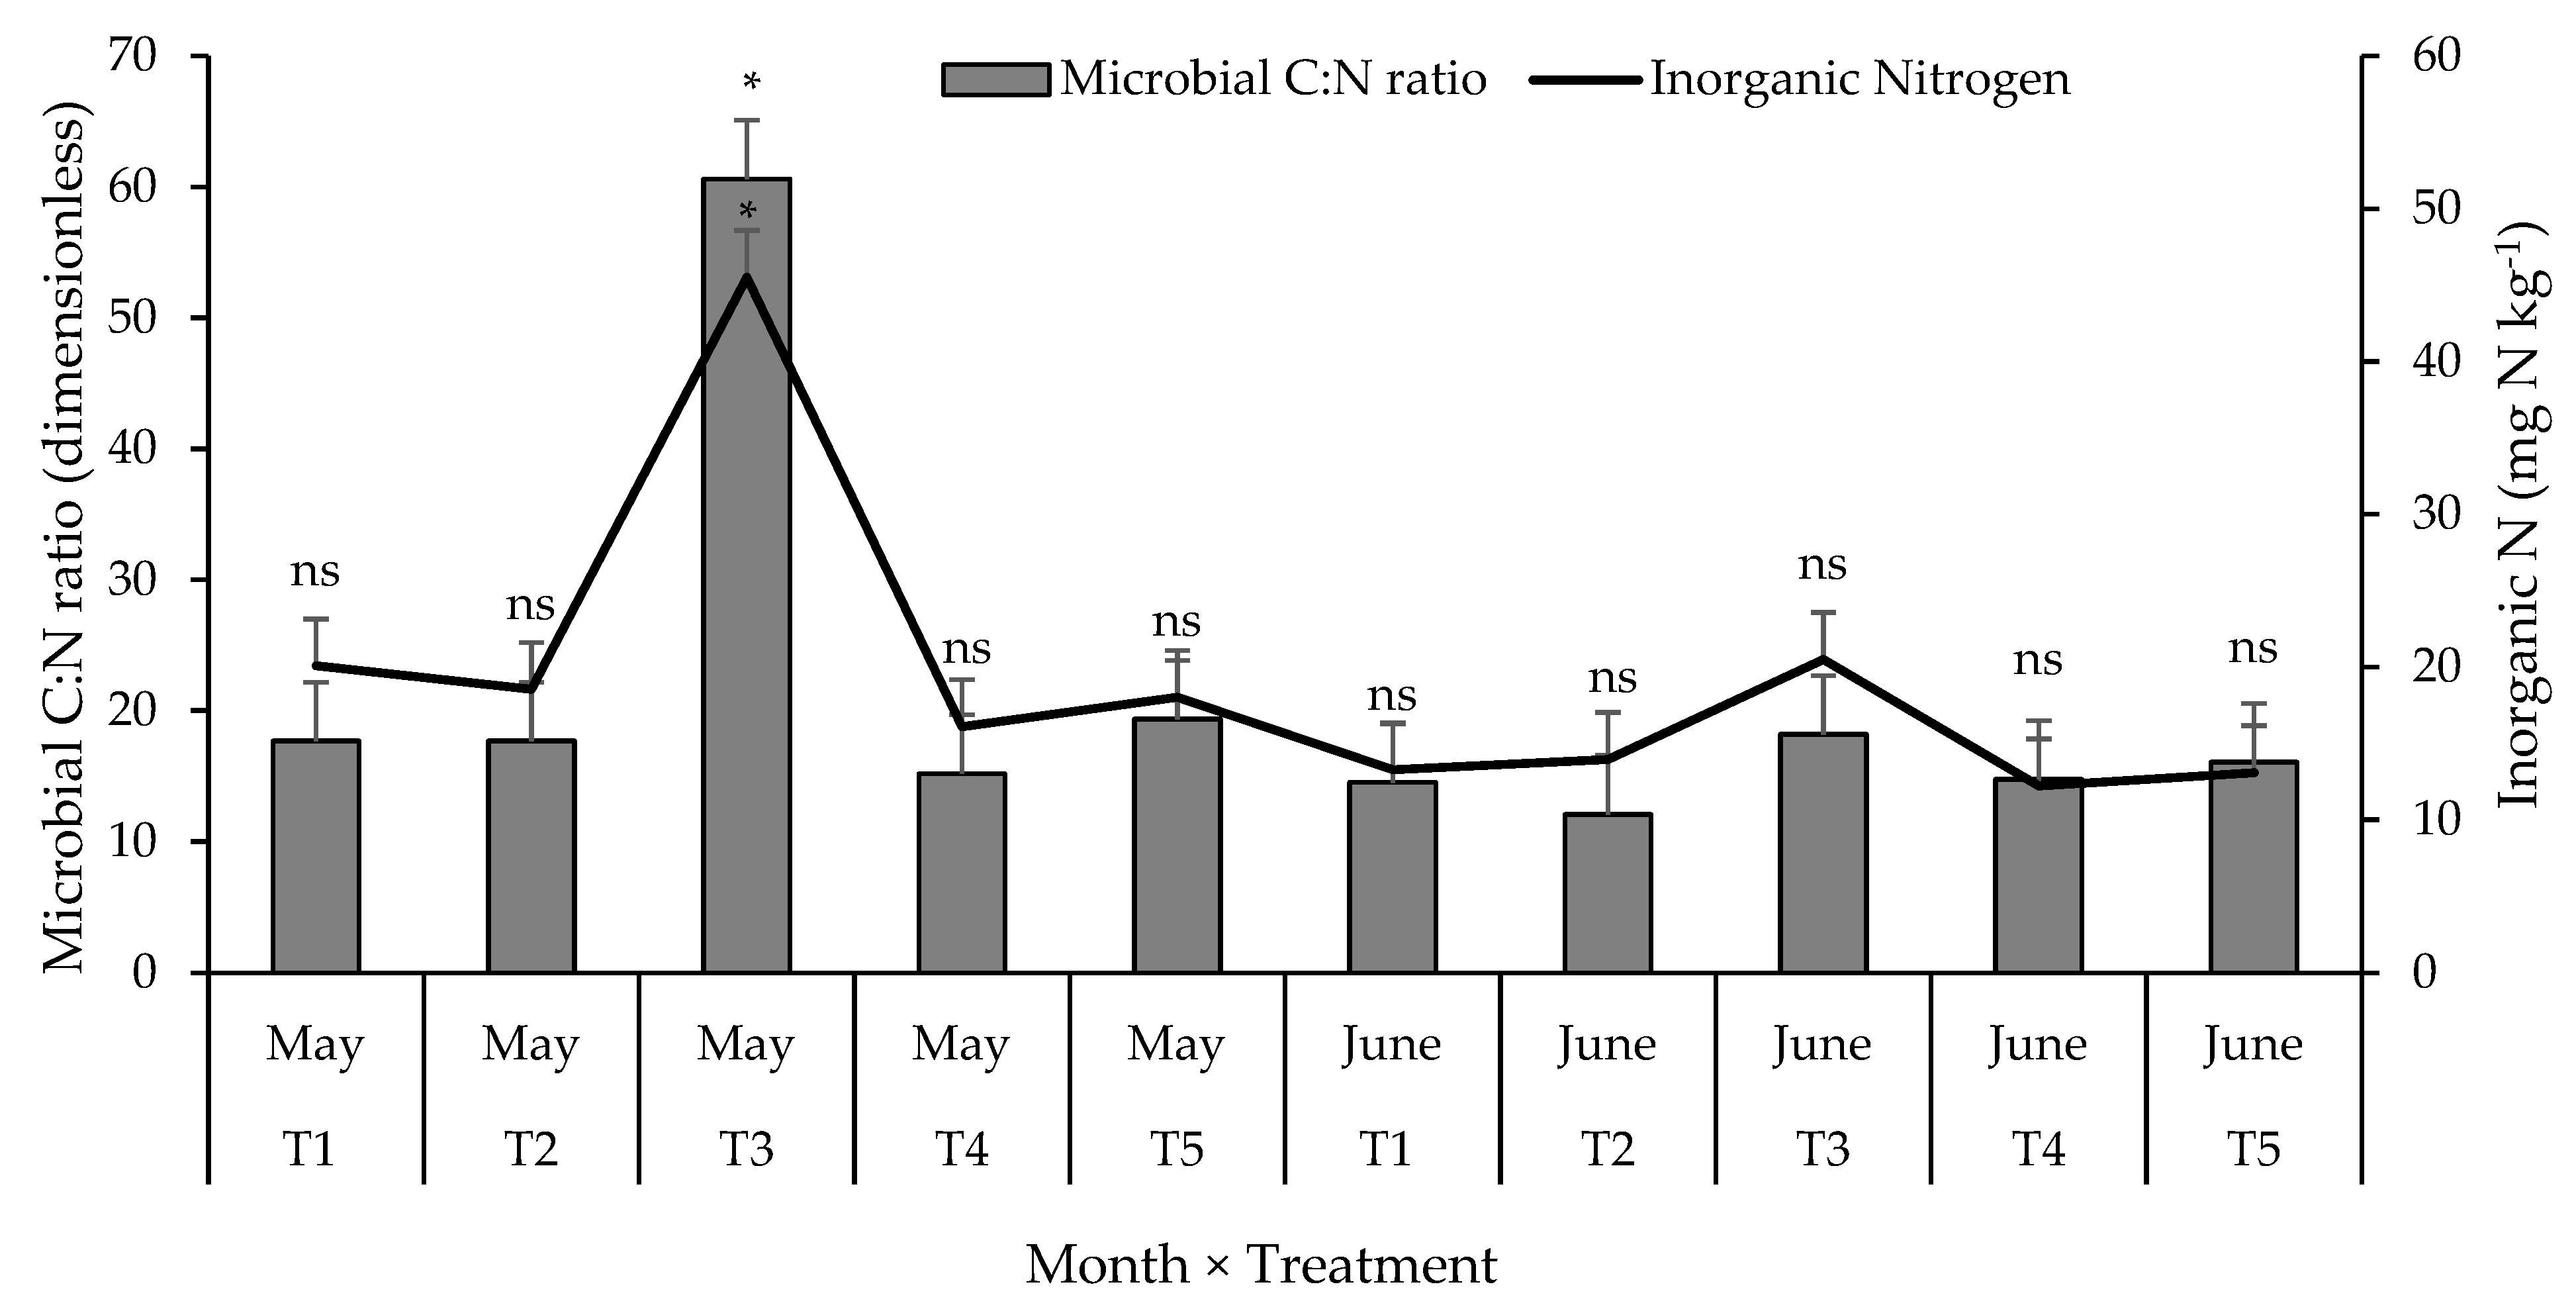
There was a treatment × month interaction for microbial C:N ratio and inorganic N (Figure 4). In May, T3 had a greater (p < 0.01) Microbial C:N ratio and inorganic N than all other treatments, with values of 60.6 and 45.51 mg kg−1, respectively. The remaining treatments showed similar values for microbial C:N ratio (15.2–19.4) and inorganic N concentration (16.09–20.07 mg kg−1). In June, microbial C:N ratio and inorganic N did not differ among treatments.
There was no treatment × month interaction for PMN, EA, EN, SOC, SON, MBC, MBN, BSR and NAG activity. The T3 treatment had greater (p < 0.01) PMN than T1, T2, and T4, with increases ranging from 46 to 103% (Table 3). Similarly, EA under T3 was greater than in other treatments (p = 0.02), exceeding them by 436 to 596%. T3 also had greater (p < 0.01) EN than T1, T2, T4 and T5, representing an increase of 44 to 68% for EN. A lack of significance was observed for SOC, SON, MBC, MBN, BSR, and NAG activity (p > 0.05), and values ranged from 17.95 to 26.75 g C kg−1, 1.46 to 2.31 g N kg−1, 273.27 to 339.21 mg C kg−1, 14.12 to 24.71 mg N kg−1, 24.91 to 40.87 mg CO2-C kg−1 day−1 and 2745.93 to 3893.61 µM MUB kg−1 h−1, respectively (Full values per treatment are in Table A1).

3.3. Greenhouse Gas Fluxes

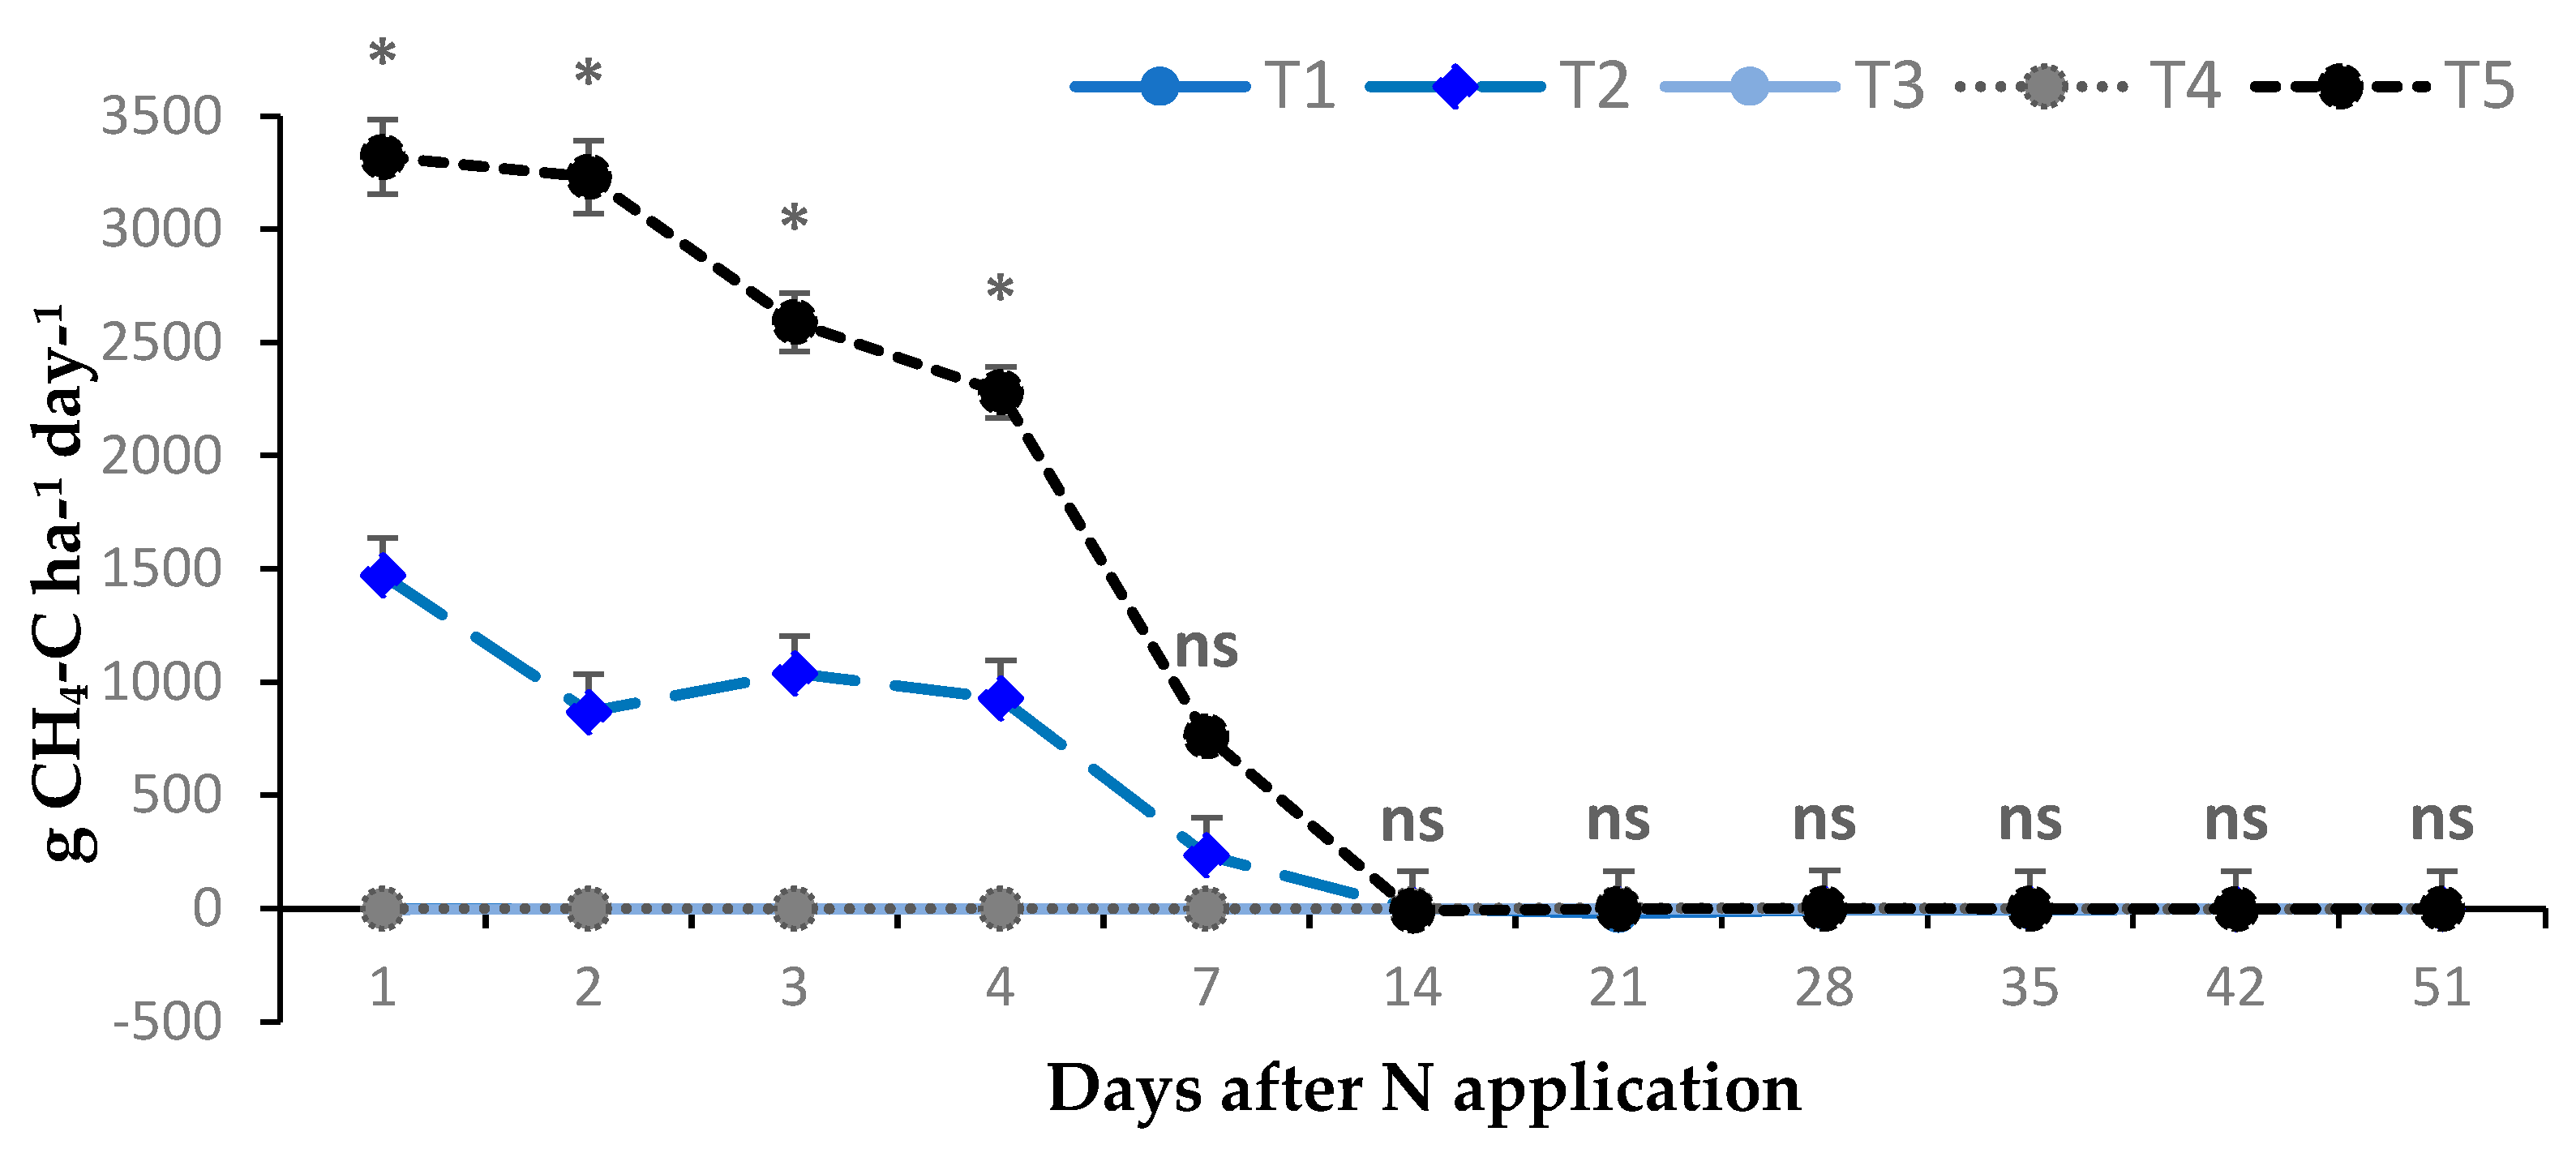
There was a treatment × day interaction (p < 0.001) for soil methane fluxes over time. Methane fluxes were greater (p < 0.001) in T5 than in T1, T3, and T4 from Day 1 to Day 4 (Figure 5). On Day 1, CH4 flux reached 3319 g CH4-C ha−1 day−1 in T5, whereas T1 had a flux of 0.93 g CH4-C ha−1 day−1. The T1, T3, and T4 treatments did not differ from each other and exhibited the lowest CH4 fluxes during this period, ranging from −0.99 to 1.36 g CH4-C ha−1 day−1. From Day 7 to Day 51, CH4 fluxes remained low across all treatments, ranging from −2.26 to −0.57 g CH4-C ha−1 day−1 (Figure 5).
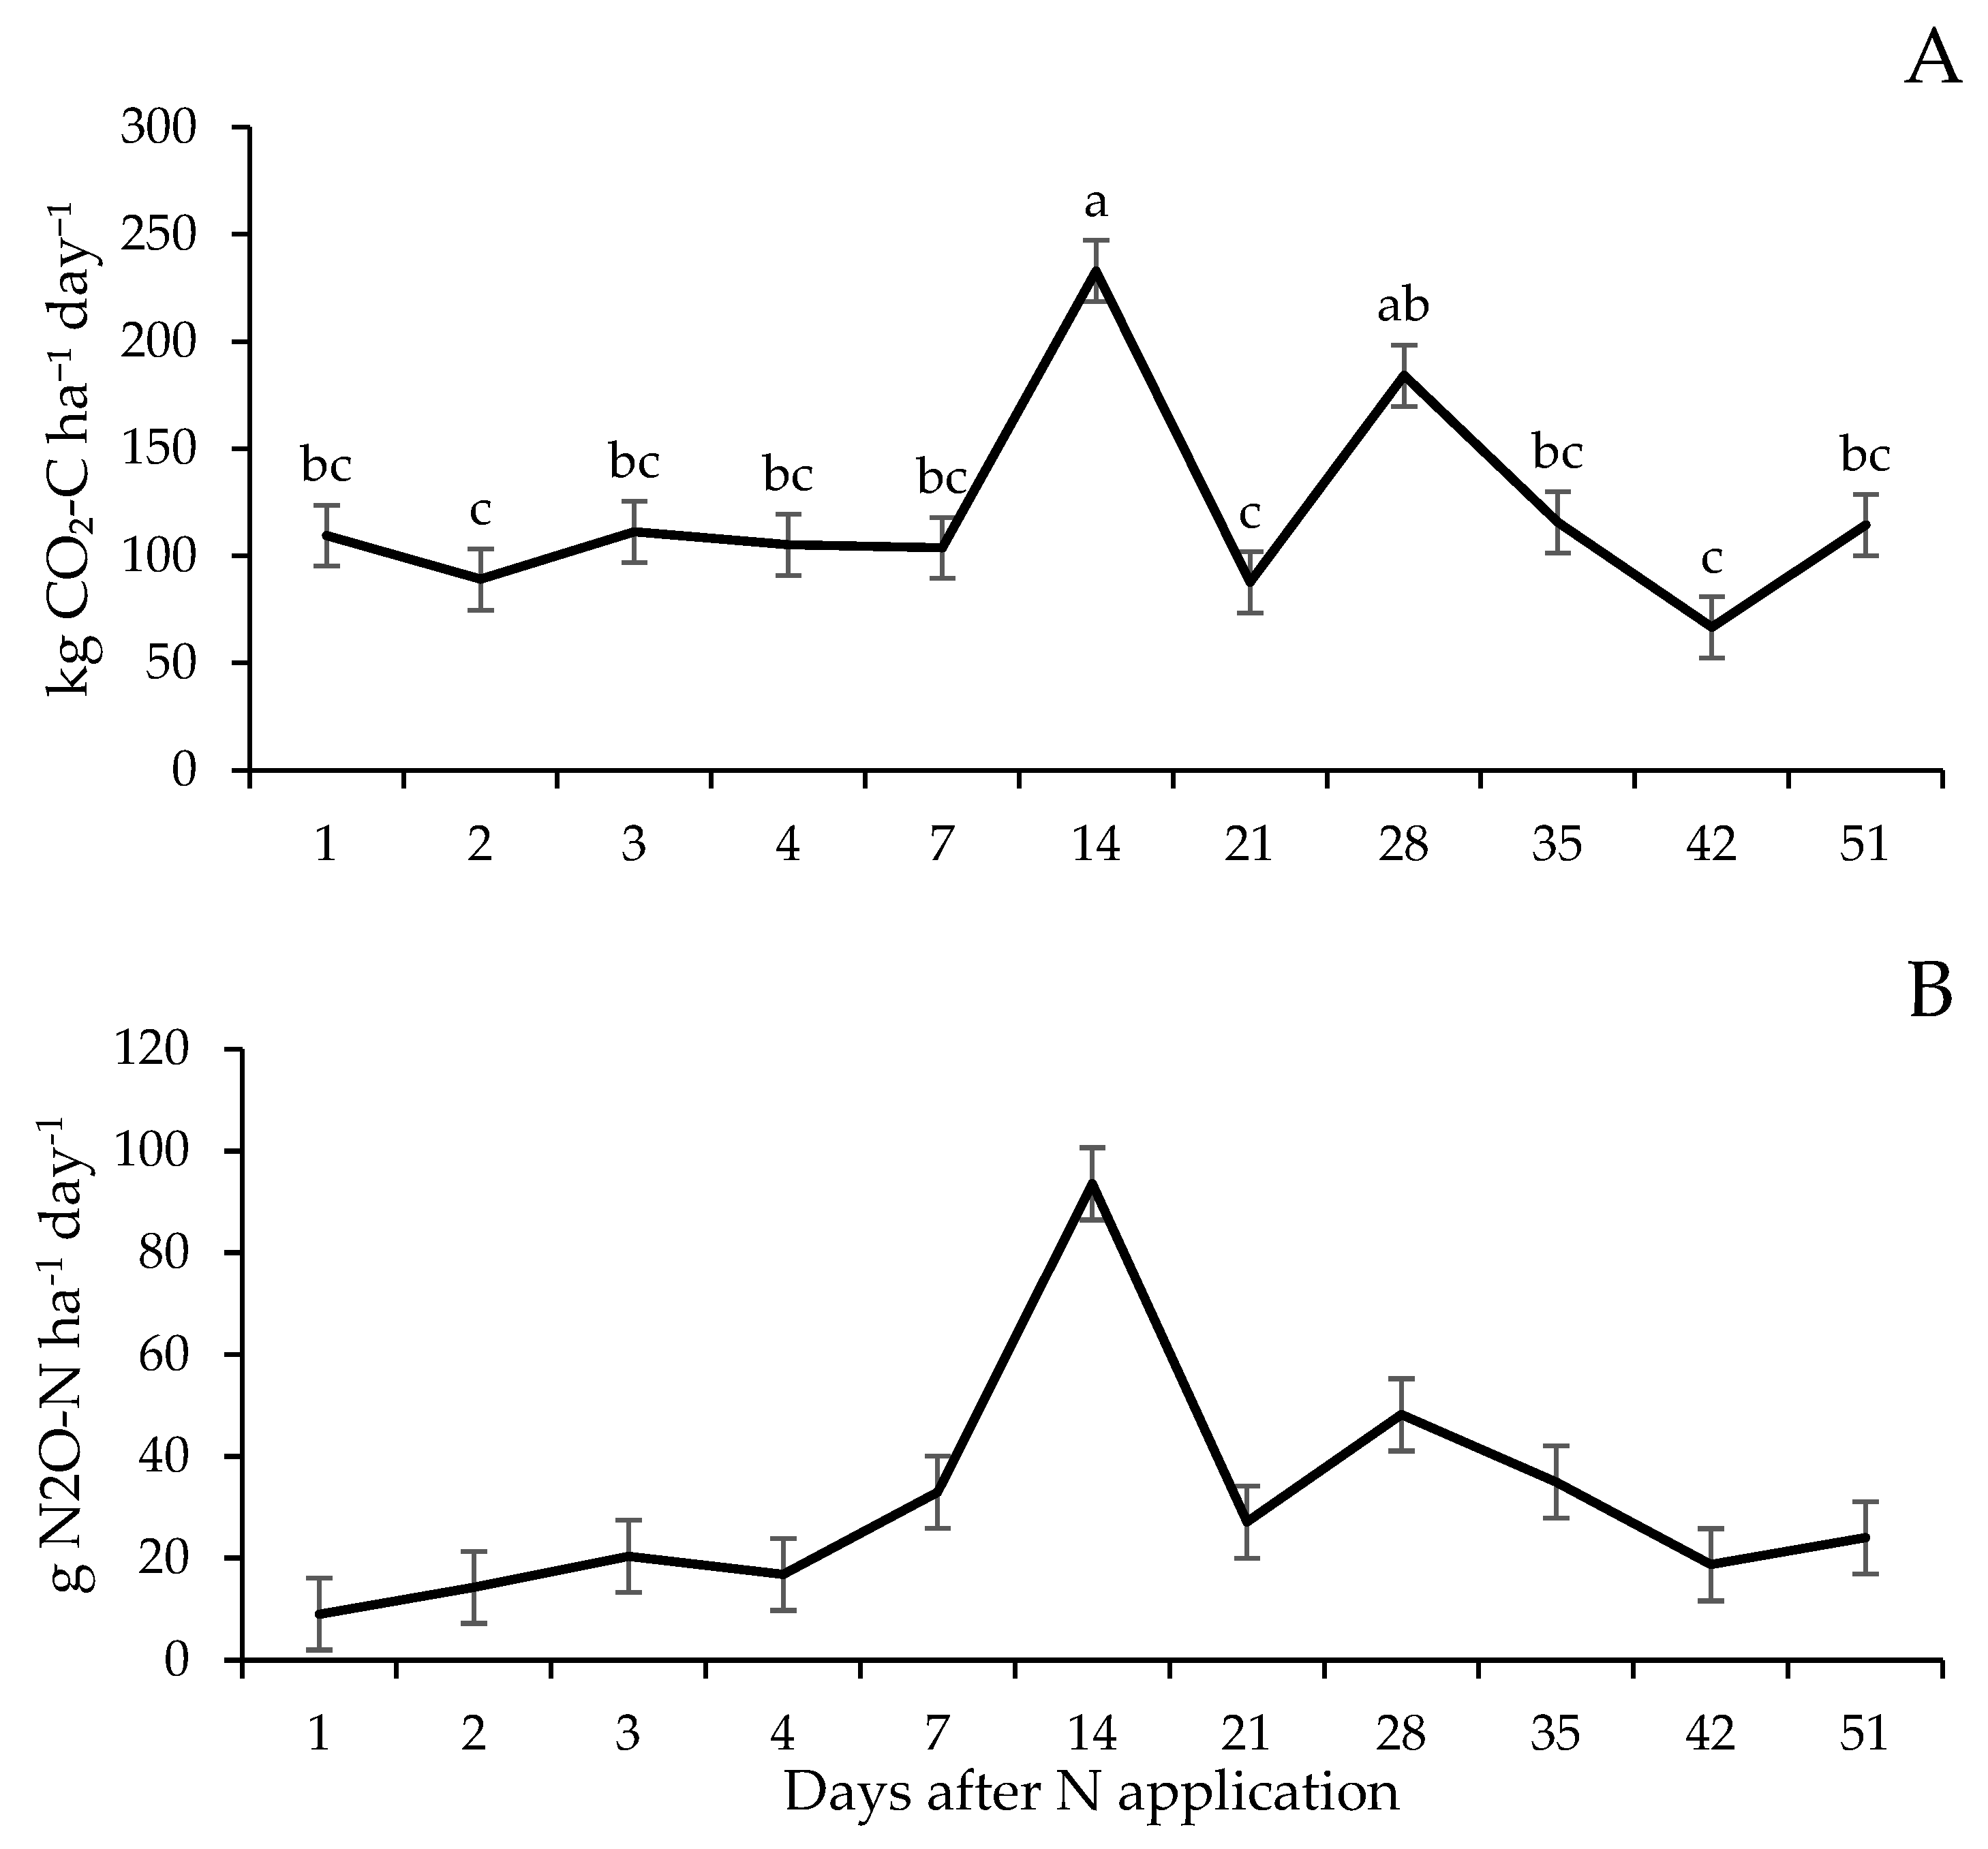
No treatment × day interaction was observed for CO2 or N2O fluxes (p > 0.05). Across the evaluation period, CO2 and N2O fluxes ranged from 75 to 192 kg CO2-C ha−1 day−1 and from 7 to 17 g N2O-N ha−1 day−1, respectively (Figure 6). Carbon dioxide fluxes differed over time (p < 0.001), reaching their highest values on Day 14, whereas fluxes on Day 14 did not differ from those on Day 28 (Figure 6A). Although N2O fluxes reached their highest numerical values on Day 14, differences among days were not statistically significant (p = 0.087; Figure 6B).
Mean daily N2O fluxes did not differ among treatments (p = 0.10), whereas mean daily CH4 and CO2 fluxes were affected by treatment (p < 0.01). Greater (p < 0.01) mean daily CH4 fluxes were observed under T5 than under T1, T2, T3, and T4. Negative CH4 fluxes were observed under T1 and T3, whereas T4 exhibited similarly low CH4 fluxes (Table 4). Lower (p < 0.01) mean daily CO2 fluxes were observed under T3 and T4 than under T1, T2, and T5 (Table 4).

3.4. Correlation Analysis

During May, potentially mineralizable nitrogen (PMN) was positively correlated with EA, EN, IN, SOC, SON, BSR, and NAG (Table 5). Inorganic nitrogen (IN) was positively correlated with EA, EN, SOC, SON, the microbial C:N ratio, BSR, and NAG, but negatively correlated with MBN. Forage mass (FM) was positively correlated with NDF, CP, and N2O, whereas IVDDM was negatively correlated with NDF and ADF. Methane (CH4) was positively correlated with CO2. During June, PMN was positively correlated with EN, IN, SOC, SON, and BSR (Table 6). Extractable nitrate (EN) was positively correlated with IN, SOC, SON, MBC, and BSR, whereas MBC was positively correlated with MBN and CH4 but negatively correlated with CO2. Forage mass was positively correlated with NDF and ADF and negatively correlated with IVDDM. In addition, IVDDM was negatively correlated with NDF and ADF but positively correlated with CP. In contrast to May, CH4 was negatively correlated with CO2 during the June sampling period.

4. Discussion

4.1. Nitrogen Sources Effects on Forage Responses

In the Southeastern USA, cool-season annuals’ growth generally extends through May/June and is determined by changes in photoperiod and temperature [25,54]. In this study, N treatments were applied in April, likely limiting FM responses due to the short evaluation period, the advanced phenological stage of the system, and the relatively low inorganic N rate [13,39,55]. In addition, pre-existing soil N availability may also have reduced the magnitude of the forage response to inorganic fertilization. Furthermore, the first harvest evaluated forage responses approximately 34 days after the initial N application, whereas the second split application was applied on the day of the first harvest. Therefore, only the second harvest reflected the complete split-N fertilization strategy. Under these conditions, T3 (grass + legume) increased CP concentration rather than FM. Although legumes were pre-inoculated and may have supported biological N fixation (BNF), the effectiveness of commercial inoculation remains variable [56,57].
Although BNF was not directly measured in this study, the responses observed in T3 were consistent with legume inclusion; therefore, the underlying mechanisms cannot be confirmed. Legume-derived N is strongly influenced by environmental conditions, species interactions, and time, and does not consistently exceed that supplied by other N sources [58,59]. For instance, grass–legume mixtures have been shown to increase CP by approximately 2 to 5 percentage units [60,61], while effects on FM are variable and context-dependent because responses differ with species composition, environmental conditions, and management intensity [62,63]. Consequently, the responses observed in T3 should be interpreted as effects associated with legume inclusion rather than direct evidence of biological N fixation.
Consistent with this, T3 increased CP relative to poultry litter but did not differ from other N sources, indicating limited short-term benefits of legume inclusion under the conditions of this study. In contrast, T2 (inorganic N) did not increase crude protein to the same extent, suggesting that late-season plant demand and rapid uptake limited its short-term effect [64,65]. The first fertilizer application also supplied P and K according to soil fertility recommendations, which may have contributed to forage responses in T2. Therefore, responses to this treatment cannot be attributed exclusively to inorganic N. Similarly, T4 and T5 (organic amendments) did not affect any forage variable; this may be due to organic N requiring a longer period for mineralization [66,67], while part of the N from these sources may also have been lost through ammonia volatilization because of their high moisture content [42,68].
Overall, legumes were not a superior short-term N source but rather a complementary, time-dependent input, with greater effects on forage nutritive value than on biomass. The benefits of legume integration are generally more evident over longer periods as residues decompose and nutrients are gradually recycled within the system [69,70].
The correlation patterns reinforce the well-established trade-off between forage accumulation and nutritive value. As forage maturity advances, structural carbohydrates accumulate, increasing fiber concentrations while reducing digestibility through changes in cell wall composition [71,72,73]. Consequently, greater forage mass did not necessarily translate into improved forage quality, suggesting that forage maturity exerted a stronger influence on forage nutritive value than N source under the conditions of this study.

4.2. Soil Health Indicators

Nitrogen inputs differed across treatments in both quantity and form, particularly in plant- and soil available N. While T2 supplied a defined amount of readily available N, T3 relied on biological N fixation, and T4 and T5 provided N primarily in organic forms requiring mineralization. Therefore, soil responses reflect differences in N availability rather than total N applied.
The high demand for N by the plants during the evaluation period likely limited detectable changes in soil carbon and nitrogen concentrations [55]. Relative to the T1, T2, T4 and T5, only T3 increased labile nitrogen indicators (PMN, EA, EN, IN) and microbial C:N ratio, reflecting a more active nitrogen cycle [74,75]. This response is consistent with the increase in crude protein concentration observed under T3 and suggests that pre-inoculated legumes may have contributed to nitrogen inputs through biological fixation, although the effectiveness of commercial inoculation remains variable [76,77,78].
The N input from treatments T4 and T5 would be expected to affect soil biological activity, since the application of poultry litter and cattle dung in agricultural systems increases soil organic matter concentration [79,80], especially in sandy soils [81,82], such as the soil of this study. However, neither T4 nor T5 differed from the control, indicating that N from these sources did not contribute to labile soil N pools within the evaluation period. This is consistent with the slower mineralization of organic amendments [83,84] and the spatially localized and short-lived nature of dung deposition [85,86], which could limit their detection [42,87].
Similarly, no significant differences were observed in soil physical, chemical, and biological indicators, including WAS, SOC, SON, MBC, MBN, BSR, and NAG (Table A1) following the application of organic amendments T4 and T5. The short evaluation period and the high plant N demand limited detectable changes in soil organic matter pools, microbial biomass, and soil structure. Likewise, SON remained unchanged because organic N pools generally respond more slowly than labile mineral N fractions, while MBC responses often require sustained changes in carbon inputs and substrate availability beyond the 60-day evaluation period. Comparable responses have been reported in systems receiving organic inputs, where microbial biomass and soil physical indicators remained unchanged despite increased nutrient availability [88]. Changes in SOC and associated soil aggregation are primarily linked to long-term management rather than short-term inputs [83,89]. In addition, microbial and enzymatic responses depend on substrate availability and mineralization dynamics, which may not be expressed within short timeframes.
The observed correlation patterns are consistent with the conceptual framework of soil N cycling, where microbial activity regulates the transformation of organic N into plant-available mineral forms. Potentially mineralizable N represents the biologically active fraction of soil organic N, whereas extractable ammonium, nitrate, and inorganic N reflect successive products of microbial mineralization and nitrification [90,91]. Likewise, the positive association with NAG agrees with its recognized role in the depolymerization of organic N compounds and subsequent N release [92]. Together, these relationships support the close coupling between microbial activity and short-term N cycling under the conditions of this study, rather than indicating direct treatment effects on stable soil C and N pools.
Although SOC and SON were associated with indicators of N cycling, these relatively stable soil pools are not expected to change substantially over 60 days. Consequently, the observed relationships likely reflect the inherent linkage between stable and labile soil N pools rather than treatment-induced changes in soil organic matter [89].
In addition, herbicides such as 2,4-D may influence root exudation patterns and microbial community composition; these changes would ultimately be expected to affect soil microbial biomass and activity. In the present study, however, no consistent differences were observed among the non-legume treatments for microbial biomass or activity indicators (MBC, MBN, BSR, and NAG), suggesting no detectable short-term effects on the measured soil biological functions. Nevertheless, microbial community composition and root exudation were not directly evaluated and therefore remain beyond the scope of this study.

4.3. Greenhouse Gas Emissions

The high CH4 flux in treatment T5 (cattle dung) during the first few days after application and in the mean daily values is likely due to the formation of anaerobic microsites (with high moisture concentration) favorable for methanogenesis, as well as the availability of C and N substrates [42,93]. According to Saggar et al. [94] and Chadwick et al. [95], most of the CH4 emitted from dung occurs during the first week, which explains the initial peaks and subsequent decrease in fluxes from day 1 to 4 and from day 7 to 51; this is probably because the dung was losing moisture and labile C and N. In contrast, treatments T1, T2, T3, and T4 exhibited low CH4 fluxes, with values remaining close to zero and occasionally negative. These results indicate that dung application, rather than the N fertilization source, was the primary factor associated with the greater CH4 fluxes observed in T5. However, unlike inorganic fertilizer and poultry litter, cattle dung represents an internal nutrient recycling process in grazing systems through localized nutrient return [42].
Furthermore, although the N fertilization sources affected CH4 fluxes from day 1 to 4, this was not the case for CO2, which varied over time, indicating that environmental conditions and short-term microbial activity primarily influenced soil respiration rather than the N source [96]. In contrast, the N source has affected the mean daily CO2 values, which reached their highest peaks under T2 and T5, suggesting rapid microbial respiration driven by readily available, more labile carbon substrates. However, soil CO2 fluxes in vegetated systems largely represent biogenic respiration and may reflect differences in root activity and microbial decomposition rather than environmental impacts per se. Therefore, these responses should not be interpreted as a direct measure of overall environmental performance. In field studies, cattle dung has been shown to substantially increase CO2 emissions relative to urea, with daily fluxes 42% higher under solid dung applications [97]. Based on field measurements in temperate wheat–maize–soybean rotations, legume systems typically emit 2.6 to 3.0 kg CO2–C ha−1 day−1, compared with 3.4 kg CO2–C ha−1 day−1 under mineral N fertilization [98], a pattern consistent with the lower CO2–C emissions observed under the legume treatment in this study.
In contrast, the lack of significance in N sources and over time in N2O fluxes likely indicates that rapid plant uptake and N microbial immobilization limited nitrate accumulation and the denitrification process [99,100]. A study in winter annual pastures reported temporary N2O peaks within 2 to 5 days of application, with daily emissions generally remaining below 1 kg N2O–N ha−1 over multi-week periods [101].
The contrasting correlation patterns between CH4 and CO2 across sampling dates suggest that the processes regulating these gases changed during the experimental period. Early in the experiment, both gases likely reflected the intense microbial activity associated with fresh dung deposition, whereas later their responses became less synchronized as dung patches decomposed. Similar temporal patterns have been reported for cattle dung, where CH4 emissions decline progressively following deposition and soils beneath decomposed dung pats may eventually shift to net CH4 oxidation. These findings reinforce that CH4 emissions from localized dung patches are primarily governed by short-term biophysical conditions during dung decomposition.
The CH4 fluxes reported for T5 represent emissions measured directly over individual fresh dung patches enclosed by the automated LI-COR chambers. Therefore, although expressed per unit area following standard chamber methodology, these values should not be interpreted as whole-pasture methane emissions because fresh dung occupies only a small fraction of the grazed area.
While this study provides important information on short-term soil–plant interactions under different nitrogen fertilization sources in cool-season forage systems, it is important to acknowledge some limitations that may have influenced the observed responses of the studied indicators. The short time frame of this study may not allow for changes in some slowly responding soil properties. The lack of interpretation of nitrogen and carbon dynamics is restricted by the inability to directly measure biological nitrogen fixation or the treatment-specific soil organic matter fractions. Thus, future research should build on this information by evaluating several seasons over a more extended time period, obtaining direct measurements of biological nitrogen fixation, assessing the composition of soil organic matter fractions, and conducting a longer-term comparative evaluation of greenhouse gas fluxes.
Finally, although none of the treatments increased forage mass in the short term, T3 increased forage crude protein and several indicators of labile soil N without increasing CH4 or N2O fluxes during the evaluation period. These findings highlight the potential contribution of legume inclusion to short-term N cycling, while longer-term studies are required to evaluate whole-system environmental performance.


5. Conclusions

Alternative N sources may help diversify N management strategies in cool-season forage systems. Under the conditions of this 60-day field study, the grass–legume system improved forage crude protein concentration and enhanced selected indicators of soil N availability without increasing mean daily CH4 or N2O fluxes. Inorganic N and poultry litter produced limited short-term effects on forage nutritive value and soil biological indicators. Cattle dung was associated with greater CH4 fluxes immediately after application but showed no consistent differences from the other N sources during the remainder of the evaluation period. These findings demonstrate that different N sources produce distinct short-term responses in forage nutritive value, soil N dynamics, and greenhouse gas fluxes. However, this study evaluated only the initial 60-day response, longer-term and multi-season; thus, future long-term studies are needed to determine the persistence of these effects and their implications for soil C and N dynamics, nutrient cycling, and overall system sustainability.

Author Contributions

Conceptualization: C.G. and L.S.d.S.; methodology: C.G. and L.S.d.S.; software: C.G.; validation: C.G.; formal analysis: C.G.; investigation: C.G. and L.S.d.S.; resources: P.A., L.S.d.S. and R.Y.; data curation: C.G.; writing—original draft preparation: C.G.; writing—review and editing: C.G., L.S.d.S. and R.Y.; visualization: L.S.d.S., C.G. and R.Y.; supervision: L.S.d.S. and C.G.; project administration: L.S.d.S. and C.G.; funding acquisition: L.S.d.S., C.G. and R.Y. All authors have read and agreed to the published version of the manuscript.

Funding

This work was supported by the Clemson University Program 1-Project Initiation, grant number #001608.

Data Availability Statement

The original contributions presented in the study are included in the article, further inquiries can be directed to the corresponding author.

Acknowledgments

During the preparation of this manuscript, the authors used ChatGPT v. 5.5 via Clemson University to develop the schematic timeline presented in Figure 2. The prompts were used to generate visual representations based on the study information provided by the authors. The authors reviewed and edited the outputs and take full responsibility for the content of this publication.

Conflicts of Interest

The authors declare no conflicts of interest.

Abbreviations

The following abbreviations are used in this manuscript:
ADFAcid detergent fiber
BSRBasal soil respiration
CH4Methane
CO2Carbon dioxide
CPCrude protein
C:NMicrobial biomass carbon-to-nitrogen ratio
EAExtractable ammonium
ENExtractable nitrate
FMForage mass
GHGGreenhouse gas
INInorganic nitrogen
IVDDMIn vitro dry matter digestibility
MBCMicrobial biomass carbon
MBNMicrobial biomass nitrogen
NNitrogen
N2ONitrous oxide
NAGN-acetyl-β-D-glucosaminidase
NDFNeutral detergent fiber
NOAANational Oceanic and Atmospheric Administration
PLSPure live seed
PMNPotentially mineralizable nitrogen
PVCPolyvinyl chloride
RCBDRandomized complete block design
SOCSoil organic carbon
SONSoil organic nitrogen
WASWet aggregate stability

Appendix A

Table A1 presents the complete treatment means for soil physical, chemical, and biological properties that showed no significant treatment effects (p > 0.05).
Table A1. Physical, chemical, and biological soil properties of a cool-season forage system under contrasting nitrogen sources.
Treatment+WASSOCSONMBCMBNBSRNAG
mmg C kg−1g N kg−1mg C kg−1mg N kg−1mg CO2-C kg−1 day−1µM MUB kg−1 h−1
T1 *0.5923.081.92339.2123.5830.453893.61
T20.5721.371.69344.1524.7125.33297.81
T30.5226.752.31334.6514.1240.874149.02
T40.4917.951.46273.2718.9424.912745.93
T50.5323.411.98356.121.2426.733306.51
SE0.052.640.2332.214.144.63607.94
p value0.660.240.150.420.40.10.52
* T1, grass only; T2, grass + N; T3, grass + legume; T4, grass + poultry litter; T5, grass + cattle dung. +WAS, Wet aggregate stability; SOC, Soil organic carbon; SON, soil organic nitrogen; MBC, microbial biomass carbon; MBN, microbial biomass nitrogen; BSR, short-term carbon mineralization; NAG, N-acetyl-β-glucoaminidase. SE, Standard error.

References

  1. Mullenix, M.K.; Rouquette, F.M., Jr. Cool-season annual grasses or grass–clover management options for extending the fall–winter–early spring grazing season for beef cattle. Prof. Anim. Sci. 2018, 34, 231–239. [Google Scholar] [CrossRef] [Scilit]
  2. Silva, L.S.; Mullenix, M.K.; Wallau, M.O.; Vasco, C.; Tucker, J.J.; Keishmer, K.; Russell, D.; Kelley, K.; Runge, M.; Gamble, A.; et al. Concepts and Research-Based Guidelines for Forage-Livestock Systems in the Southeast Region; Sustainable Agriculture Research and Education: College Park, MD, USA, 2022; Volume 1. [Google Scholar]
  3. Ball, D.M.; Hoveland, C.S.; Lacefield, G.D. Southern Forages: Modern Concepts for Forage Crop Management, 5th ed.; International Plant Nutrition Institute: Peachtree Corners, GA, USA, 2015. [Google Scholar]
  4. Abraha, A.B.; Truter, W.F.; Annandale, J.G.; Fessehazion, M.K. Forage yield and quality response of annual ryegrass (Lolium multiflorum) to different water and nitrogen levels. Afr. J. Range Forage Sci. 2015, 32, 125–131. [Google Scholar] [CrossRef] [Scilit]
  5. Contreras-Govea, F.E.; Albrecht, K.A. Forage production and nutritive value of oat in autumn and early summer. Crop Sci. 2006, 46, 2382–2386. [Google Scholar] [CrossRef] [Scilit]
  6. Varol, I.S.; Ciftci, B.; Kaymaz, E.; Kaplan, M. Water and nitrogen impacts on water use, forage yield and quality of annual ryegrass. Sci. Rep. 2025, 15, 34143. [Google Scholar] [CrossRef] [Scilit] [PubMed]
  7. Crews, T.E.; Peoples, M.B. Legume versus fertilizer sources of nitrogen: Ecological tradeoffs and human needs. Agric. Ecosyst. Environ. 2004, 102, 279–297. [Google Scholar] [CrossRef] [Scilit]
  8. Pereira, L.E.T.; Herling, V.R.; Tech, A.R.B. Current scenario and perspectives for nitrogen fertilization strategies on tropical perennial grass pastures: A review. Agronomy 2022, 12, 2079. [Google Scholar] [CrossRef] [Scilit]
  9. Vásquez, H.V.; Valqui, L.; Valqui-Valqui, L.; Bobadilla, L.G.; Reyna, M.; Maravi, C.; Pajares, N.; Altamirano-Tantalean, M.A. Influence of nitrogen fertilization and cutting dynamics on the yield and nutritional composition of white clover (Trifolium repens L.). Plants 2025, 14, 2765. [Google Scholar] [CrossRef] [Scilit] [PubMed]
  10. Umeri, C.; Omoregie, A.U.; Agbonlahor, C. Effect of cow dung on the growth and forage yield of two varieties of sorghum (Sorghum bicolor (L.) Moench.) in Ekpoma, Edo State, Nigeria. Niger. J. Agric. Agric. Technol. 2025, 5, 19–30. [Google Scholar]
  11. Xu, Y.; Sheng, J.; Zhang, L.; Sun, G.; Zheng, J. Organic fertilizer substitution increased soil organic carbon through the association of microbial necromass C with iron oxides. Soil Tillage Res. 2025, 248, 106402. [Google Scholar] [CrossRef] [Scilit]
  12. Zhao, K.; Zhao, X.; He, L.; Wang, N.; Bai, M.; Zhang, X.; Chen, G.; Chen, A.; Luo, L.; Zhang, J. Comprehensive assessment of straw returning with organic fertilizer on paddy ecosystems: A study based on greenhouse gas emissions, C/N sequestration, and risk health. Environ. Res. 2025, 266, 120519. [Google Scholar] [CrossRef] [Scilit] [PubMed]
  13. Nave, R.L.G.; de Almeida, O.G.; Tucker, J.; Xiong, V.; Griffith, A. Nutritive value and economic responses under different restoration strategies of cool-season grass pastures. Crop Forage Turfgrass Manag. 2025, 11, e70039. [Google Scholar] [CrossRef] [Scilit]
  14. Šidlauskaitė, G.; Kadžiulienė, Ž. The Effect of Inorganic Nitrogen Fertilizers on the Quality of Forage Composed of Various Species of Legumes in the Northern Part of a Temperate Climate Zone. Plants 2023, 12, 3676. [Google Scholar] [CrossRef] [Scilit] [PubMed]
  15. Euclides, V.P.B.; Montagner, D.B.; de Araújo, A.R.; de Aragão Pereira, M.; dos Santos Difante, G.; de Araújo, I.M.M.; Barbosa, L.F.; Barbosa, R.A.; Gurgel, A.L.C. Biological and economic responses to increasing nitrogen rates in Mombaça guinea grass pastures. Sci. Rep. 2022, 12, 1937. [Google Scholar] [CrossRef] [Scilit] [PubMed]
  16. Beck, P.; Hess, T.; Hubbell, D.; Gadberry, M.S.; Jennings, J.; Sims, M. Replacing synthetic N with clovers or alfalfa in bermudagrass pastures. 1. Herbage mass and pasture carrying capacity. Anim. Prod. Sci. 2017, 57, 539–546. [Google Scholar] [CrossRef] [Scilit]
  17. Coblentz, W.K.; Akins, M.S.; Cavadini, J.S.; Jokela, W.E. Net effects of nitrogen fertilization on the nutritive value and digestibility of oat forages. J. Dairy Sci. 2017, 100, 1739–1750. [Google Scholar] [CrossRef] [Scilit] [PubMed]
  18. Vaughn, K.; Adeyemi, O.; Zandvakili, O.R.; Battaglia, M.L.; Babaei, S.; Nair, J.; Still, S.; Burkett, G.; Sadeghpour, A. Nitrogen rate and harvesting time based on growing degree days influenced winter cereal rye morphological traits, forage yield, quality, and farm profit in poorly drained Alfisols. Grass Forage Sci. 2024, 79, 239–253. [Google Scholar] [CrossRef] [Scilit]
  19. Rotz, C.A.; Asem-Hiablie, S.; Place, S.; Thoma, G. Environmental footprints of beef cattle production in the United States. Agric. Syst. 2019, 169, 1–13. [Google Scholar] [CrossRef] [Scilit]
  20. Van Beek, C.L.; Pleijter, M.; Jacobs, C.M.J.; Velthof, G.L.; Van Groenigen, J.W.; Kuikman, P.J. Emissions of N2O from fertilized and grazed grassland on organic soil in relation to groundwater level. Nutr. Cycl. Agroecosyst. 2010, 86, 331–340. [Google Scholar] [CrossRef] [Scilit]
  21. Sánchez-Navarro, V.; Zornoza, R.; Faz, A.; Fernandez, J.A. A comparative greenhouse gas emissions study of legume and non-legume crops grown using organic and conventional fertilizers. Sci. Hortic. 2020, 260, 108902. [Google Scholar] [CrossRef] [Scilit]
  22. Dubeux, J.C., Jr.; Jaramillo, D.M.; Santos, E.R.; Garcia, L.; Queiroz, L.M.; Bretas, I.L.; de Souza, C.H.L.; Trumpp, K.R. Sustainable intensification of livestock systems using forage legumes in the Anthropocene. Grass Forage Sci. 2024, 79, 481–498. [Google Scholar] [CrossRef] [Scilit]
  23. Sutharsan, R.; Jeyakumar, P.; Burkitt, L.; Matse, D.T.; Dhanuskodi, R.; Hanly, J.; Donaghy, D.J. Enhancing Biological Nitrogen Fixation Through Diverse Pasture Swards. Plants 2025, 14, 2727. [Google Scholar] [CrossRef] [Scilit] [PubMed]
  24. Kristensen, R.K.; Rasmussen, J.; Eriksen, J. Biological N2-fixation in grass-clover ley in response to N application in cattle slurry vs. mineral fertilizer. Plant Soil 2022, 471, 629–641. [Google Scholar] [CrossRef] [Scilit]
  25. Dillard, S.L. Cool-season annual legumes and forbs for grazing and cover crop systems. In Proceedings of the XXV International Grassland Congress, Covington, KY, USA, 14–19 May 2023; Available online: https://uknowledge.uky.edu/igc/XXV_IGC_2023/Livestock/7 (accessed on 2 July 2026).
  26. Vann, R.A.; Reberg-Horton, S.C.; Castillo, M.S.; McGee, R.J.; Mirsky, S.B. Winter pea, crimson clover, and hairy vetch planted in mixture with small grains in the southeast United States. Agron. J. 2019, 111, 805–815. [Google Scholar] [CrossRef] [Scilit]
  27. Gao, L.; Su, J.; Chen, C.; Tian, Q.; Shen, Y. Increases in forage legume biomass as a response to nitrogen input depend on temperature, soil characters and planting system: A meta-analysis. Grass Forage Sci. 2021, 76, 309–319. [Google Scholar] [CrossRef] [Scilit]
  28. da Silva, L.S.; Sollenberger, L.E.; Mullenix, M.K.; Kohmann, M.M.; Dubeux, J.C., Jr.; Silveira, M.L. Soil carbon and nitrogen stocks in nitrogen-fertilized grass and legume-grass forage systems. Nutr. Cycl. Agroecosyst. 2022, 122, 105–117. [Google Scholar] [CrossRef] [Scilit]
  29. Rayne, N.; Aula, L. Livestock manure and the impacts on soil health: A review. Soil Syst. 2020, 4, 64. [Google Scholar] [CrossRef] [Scilit]
  30. Whitehead, D.; Schipper, L.A.; Pronger, J.; Moinet, G.Y.; Mudge, P.L.; Pereira, R.C.; Kirschbaum, M.U.F.; Beare, M.H.; McNally, S.R.; Camps-Arbestain, M. Management practices to reduce losses or increase soil carbon stocks in temperate grazed grasslands: New Zealand as a case study. Agric. Ecosyst. Environ. 2018, 265, 432–443. [Google Scholar] [CrossRef] [Scilit]
  31. Guo, Z.; Zhang, J.; Fan, J.; Yang, X.; Yi, Y.; Han, X.; Wang, D.; Zhu, P.; Peng, X. Does animal manure application improve soil aggregation? Insights from nine long-term fertilization experiments. Sci. Total Environ. 2019, 660, 1029–1037. [Google Scholar] [CrossRef] [Scilit] [PubMed]
  32. Jin, V.L.; Johnson, M.V.V.; Haney, R.L.; Arnold, J.G. Potential carbon and nitrogen mineralization in soils from a perennial forage production system amended with class B biosolids. Agric. Ecosyst. Environ. 2011, 141, 461–465. [Google Scholar] [CrossRef] [Scilit]
  33. Dalias, P. Grain legume effects on soil nitrogen mineralization potential and wheat productivity in a Mediterranean environment. Arch. Agron. Soil Sci. 2015, 61, 461–473. [Google Scholar] [CrossRef] [Scilit]
  34. Silveira, M.L.; Rouquette, F.M., Jr.; Haby, V.A.; Smith, G.R. Effects of thirty-seven years of stocking and fertility regimens on soil chemical properties in bermudagrass pastures. Agron. J. 2016, 108, 913–921. [Google Scholar] [CrossRef] [Scilit]
  35. McAuliffe, G.A.; Lee, M.R.F.; Cardenas, L. Response of soil health indicators to dung, urine and mineral fertilizer application in temperate pastures. J. Environ. Manag. 2023, 330, 117096. [Google Scholar] [CrossRef] [Scilit] [PubMed]
  36. Kallenbach, C.; Grandy, A.S. Controls over soil microbial biomass responses to carbon amendments in agricultural systems: A meta-analysis. Agric. Ecosyst. Environ. 2011, 144, 241–252. [Google Scholar] [CrossRef] [Scilit]
  37. McDaniel, M.D.; Tiemann, L.K.; Grandy, A.S. Does agricultural crop diversity enhance soil microbial biomass and organic matter dynamics? A meta-analysis. Ecol. Appl. 2014, 24, 560–570. [Google Scholar] [CrossRef] [Scilit] [PubMed]
  38. Peel, M.C.; Finlayson, B.L.; McMahon, T.A. Updated world map of the Köppen–Geiger climate classification. Hydrol. Earth Syst. Sci. 2007, 11, 1633–1644. [Google Scholar] [CrossRef] [Scilit]
  39. Nave, R.L.; Barbero, R.P.; Boyer, C.N.; Mulliniks, J.T.; Corbin, M.D. Poultry litter as a sustainable fertilizer for stockpiled tall fescue during winter grazing in middle Tennessee. Crop Forage Turfgrass Manag. 2016, 2, 1–8. [Google Scholar] [CrossRef] [Scilit]
  40. Haynes, R.J.; Williams, P.H. Nutrient cycling and soil fertility in the grazed pasture ecosystem. Adv. Agron. 1993, 49, 119–199. [Google Scholar] [CrossRef] [Scilit]
  41. Rivera, J.E.; Chará, J.; Barahona, R. CH4, CO2 and N2O emissions from grasslands and bovine excreta in two intensive tropical dairy production systems. Agrofor. Syst. 2019, 93, 915–928. [Google Scholar] [CrossRef] [Scilit]
  42. Garcia, C.C.V.; Dubeux, J.C.B., Jr.; Martini, X.; Conover, D.; Santos, E.R.S.; Homem, B.G.C.; Ruiz-Moreno, M.; da Silva, I.A.G.; Abreu, D.S.; Queiroz, L.M.D.; et al. The role of dung beetle species in nitrous oxide emission, ammonia volatilization, and nutrient cycling. Sci. Rep. 2023, 13, 3572. [Google Scholar] [CrossRef] [Scilit] [PubMed]
  43. ANKOM Technology. Method 13—Neutral Detergent Fiber in Feeds: Filter Bag Technique (for A2000 and A2000I). Available online: https://www.ankom.com/sites/default/files/document-files/Method_13_NDF_A2000.pdf (accessed on 2 July 2026).
  44. ANKOM Technology. Method 5—Acid Detergent Fiber in Feeds: Filter Bag Technique (for A2000 and A2000I). Available online: https://www.ankom.com/sites/default/files/document-files/Method_5_ADF_A200.pdf (accessed on 2 July 2026).
  45. Ferreira, G.; Mertens, D.R. Chemica and physical characteristics of corn silages and their effects on in vitro disappearance. J. Dairy Sci. 2005, 88, 4414–4425. [Google Scholar] [CrossRef] [Scilit] [PubMed]
  46. Voroney, R.P.; Brookes, P.C.; Beyaert, R.P. Soil Microbial Biomass C, N, P, and S. In Soil Sampling and Methods of Analysis, 2nd ed.; Carter, M.R., Gregorich, E.G., Eds.; CRC Press: Boca Raton, FL, USA, 2008; pp. 637–652. [Google Scholar]
  47. Verdouw, H.; Van Echteld, C.J.A.; Dekkers, E.M.J. Ammonia determination based on indophenol formation with sodium salicylate. Water Res. 1978, 12, 399–402. [Google Scholar] [CrossRef] [Scilit]
  48. Doane, T.A.; Horwáth, W.R. Spectrophotometric determination of nitrate with a single reagent. Anal. Lett. 2003, 36, 2713–2722. [Google Scholar] [CrossRef] [Scilit]
  49. Ye, R.; Parajuli, B.; Sigua, G. Subsurface clay soil application improved aggregate stability, nitrogen availability, and organic carbon preservation in degraded Ultisols with cover crop mixtures. Soil Sci. Soc. Am. J. 2019, 83, 597–604. [Google Scholar] [CrossRef] [Scilit]
  50. Six, J.; Paustian, K.; Elliott, E.T.; Combrink, C. Soil structure and organic matter I. Distribution of aggregate-size classes and aggregate-associated carbon. Soil Sci. Soc. Am. J. 2000, 64, 681–689. [Google Scholar] [CrossRef] [Scilit]
  51. Márquez, C.O.; Garcia, V.J.; Cambardella, C.A.; Schultz, R.C.; Isenhart, T.M. Aggregate-size stability distribution and soil stability. Soil Sci. Soc. Am. J. 2004, 68, 725–735. [Google Scholar] [CrossRef]
  52. Haney, R.L.; Haney, E.B. Simple and rapid laboratory method for rewetting dry soil for incubations. Commun. Soil Sci. Plant Anal. 2010, 41, 1493–1501. [Google Scholar] [CrossRef] [Scilit]
  53. LI-COR Inc. Automated Soil Greenhouse Gas Flux System Instruction Manual; LI-COR Biosciences: Lincoln, NE, USA, 2023. [Google Scholar]
  54. Negrete, P.C.M. Evaluation of Cool-Season Annuals Effect on Soil Health in Warm-Season Perennial Pastures in Southestern US. Master’s Thesis, Louisiana State University and Agricultural & Mechanical College, Baton Rouge, LA, USA, 2021. Available online: https://digitalcommons.lsu.edu/gradschool_theses/5409 (accessed on 2 July 2026).
  55. Fulkerson, W.J.; Donaghy, D.J. Plant-soluble carbohydrate reserves and senescence: Key criteria for developing an effective grazing management system for ryegrass-based pastures. Aust. J. Exp. Agric. 2001, 41, 261–275. [Google Scholar] [CrossRef] [Scilit]
  56. Xu, R.; Shi, W.; Kamran, M.; Chang, S.; Jia, Q.; Hou, F. Grass-legume mixture and nitrogen application improve yield, quality, and water and nitrogen utilization efficiency of grazed pastures in the loess plateau. Front. Plant Sci. 2023, 14, 1088849. [Google Scholar] [CrossRef] [Scilit] [PubMed]
  57. Muir, J.P.; Dubeux, J.C.B., Jr.; Santos, M.V.F.; Foster, J.L.; Ferreira, R.L.C.; Lira, M.D.A., Jr.; Bellows, B.; Osei, E.; Singh, B.B.; Brady, J.A. Sustainable warm-climate forage legumes: Versatile products and services. Grasses 2025, 4, 16. [Google Scholar] [CrossRef] [Scilit]
  58. Ghafoor, A.; Javed, H.; Karim, H.; Studnicki, M.; Ali, I.; Yue, H.; Xiao, P.; Asghar, M.; Brock, C.; Wu, Y. Biological nitrogen fixation for sustainable agriculture development under climate change: New insights from a meta-analysis. J. Agron. Crop Sci. 2024, 210, e12754. [Google Scholar] [CrossRef] [Scilit]
  59. Jezequel, A.; Delaby, L.; McKay, Z.C.; Fleming, C.; Horan, B. Effect of sward species diversity combined with a reduction in nitrogen fertilizer on the performances of spring-calving grazing dairy cows. J. Dairy Sci. 2024, 107, 11104–11116. [Google Scholar] [CrossRef] [Scilit] [PubMed]
  60. Tahir, M.; Li, C.; Zeng, T.; Xin, Y.; Chen, C.; Javed, H.H.; Yang, W.; Yan, Y. Mixture composition influenced the biomass yield and nutritional quality of legume–grass pastures. Agronomy 2022, 12, 1449. [Google Scholar] [CrossRef] [Scilit]
  61. Sollenberger, L.E.; Dubeux, J.C.B. Warm-climate, legume-grass forage mixtures versus grass-only swards: An ecosystem services comparison. Rev. Bras. Zootec. 2022, 51, e20210198. [Google Scholar] [CrossRef] [Scilit]
  62. Ali, A.; Kaul, H.P. Monitoring yield and quality of forages and grassland in the view of precision agriculture applications—A review. Remote Sens. 2025, 17, 279. [Google Scholar] [CrossRef] [Scilit]
  63. Lüscher, A.; Mueller-Harvey, I.; Soussana, J.F.; Rees, R.M.; Peyraud, J.L. Potential of legume-based grassland–livestock systems in Europe: A review. Grass Forage Sci. 2014, 69, 206–228. [Google Scholar] [CrossRef] [Scilit] [PubMed]
  64. Li, J.; Niu, X.; Wang, P.; Yang, J.; Liu, J.; Wu, D.; Guan, P. Soil degradation regulates the effects of litter decomposition on soil microbial nutrient limitation: Evidence from soil enzymatic activity and stoichiometry. Front. Plant Sci. 2023, 13, 1090954. [Google Scholar] [CrossRef] [Scilit] [PubMed]
  65. Wu, S.; Jiang, Y.; Ai, L.; Wu, F.; Wu, Q.; Zhang, X.; Zhu, J.; Ni, X. Declines in carbon and nitrogen release from decomposing litter under elevated CO2 in terrestrial ecosystems. J. Plant Ecol. 2025, 18, rtaf002. [Google Scholar] [CrossRef] [Scilit]
  66. Rogeri, D.A.; Ernani, P.R.; Lourenço, K.S.; Cassol, P.C.; Gatiboni, L.C. Mineralização e nitrificação do nitrogênio proveniente da cama de aves aplicada ao solo. Rev. Bras. Eng. Agric. Ambient. 2015, 19, 534–540. [Google Scholar] [CrossRef] [Scilit]
  67. Whalen, J.K.; Chang, C.; Olson, B.M. Nitrogen and phosphorus mineralization potentials of soils receiving repeated annual cattle manure applications. Biol. Fertil. Soils 2001, 34, 334–341. [Google Scholar] [CrossRef] [Scilit]
  68. Kacprzak, M.; Malińska, K.; Grosser, A.; Sobik-Szołtysek, J.; Wystalska, K.; Dróżdż, D.; Jasińska, A.; Meers, E. Cycles of carbon, nitrogen and phosphorus in poultry manure management technologies: Environmental aspects. Crit. Rev. Environ. Sci. Technol. 2023, 53, 914–938. [Google Scholar] [CrossRef] [Scilit]
  69. Louarn, G.; Pereira-Lopès, E.; Fustec, J.; Mary, B.; Voisin, A.S.; de Faccio Carvalho, P.C.; Gastal, F. The amounts and dynamics of nitrogen transfer to grasses differ in alfalfa and white clover-based grass-legume mixtures as a result of rooting strategies and rhizodeposit quality. Plant Soil 2015, 389, 289–305. [Google Scholar] [CrossRef] [Scilit]
  70. Trumpp, K.R.; Dubeux, J.C., Jr.; Acuña, J.P.; Bretas, I.L.; Oduor, K.; Queiroz, L.M.; Ruiz-Moreno, M.; Sollenberger, L.E.; DiLorenzo, N.; Vendramini, J.M. Belowground biomass characteristics and soil organic C accumulation of bahiagrass-based forage systems with or without legumes. Crop Sci. 2026, 66, e70266. [Google Scholar] [CrossRef] [Scilit]
  71. Garcia, C.C.V.; Dubeux, J.C.B., Jr.; Vendramini, J.M.B.; Rios, E.F.; Santos, E.R.S.; Jaramillo, D.M.; Queiroz, L.M.D.; de Souza, R.T.A.; Homem, B.G.C.; Ruiz-Moreno, M.; et al. Herbage accumulation and nutritive value of new bermudagrass accessions and cultivars. Agron. J. 2024, 116, 2498–2510. [Google Scholar] [CrossRef] [Scilit]
  72. Clausecker, F.; Isselstein, J.; Obermeyer, K.; Komainda, M. Herbage nutritive value in extensively grazed grassland as affected by botanical composition, sward heterogeneity and grazing intensity. Grass Forage Sci. 2025, 80, e12715. [Google Scholar] [CrossRef] [Scilit]
  73. Sollenberger, L.E.; Kohmann, M.M. Forage legume responses to climate change factors. Crop Sci. 2024, 64, 2419–2432. [Google Scholar] [CrossRef] [Scilit]
  74. Chuckran, P.F.; Fofanov, V.; Hungate, B.A.; Morrissey, E.M.; Schwartz, E.; Walkup, J.; Dijkstra, P. Rapid response of nitrogen cycling gene transcription to labile carbon amendments in a soil microbial community. mSystems 2021, 6, 10–1128. [Google Scholar] [CrossRef] [Scilit] [PubMed]
  75. Zang, H.; Mehmood, I.; Kuzyakov, Y.; Jia, R.; Gui, H.; Blagodatskaya, E.; Xu, X.; Smith, P.; Chen, H.; Zeng, Z.; et al. Not all soil carbon is created equal: Labile and stable pools under nitrogen input. Glob. Change Biol. 2024, 30, e17405. [Google Scholar] [CrossRef] [Scilit] [PubMed]
  76. Gungaabayar, A.; Jha, A.; Warkentin, T.; Knight, D.; Penner, G.; Biligetu, B. Forage yield and biological nitrogen fixation of pea–cereal intercrops for hay production. Agron. J. 2023, 115, 607–619. [Google Scholar] [CrossRef] [Scilit]
  77. MacMillan, J.; Adams, C.B.; Hinson, P.O.; DeLaune, P.B.; Rajan, N.; Trostle, C. Biological nitrogen fixation of cool-season legumes in agronomic systems of the Southern Great Plains. Agrosyst. Geosci. Environ. 2022, 5, e20244. [Google Scholar] [CrossRef] [Scilit]
  78. Serafin-Andrzejewska, M.; Falkiewicz, A.; Wojciechowski, W.; Kozak, M. Yield and Seed Quality of Faba Bean (Vicia faba L. var. minor) as a Result of Symbiosis with Nitrogen-Fixing Bacteria. Agriculture 2025, 15, 960. [Google Scholar] [CrossRef] [Scilit]
  79. Boniface, H.S.; Cavigelli, M.A.; White, K.E.; Thapa, R.; Smith, S.; Mirsky, S.B.; Tully, K.L. Soil organic carbon fractions influenced by organic input diversity and tillage frequency after 25 years in Mid-Atlantic US grain cropping systems. Agric. Ecosyst. Environ. 2025, 394, 109869. [Google Scholar] [CrossRef] [Scilit]
  80. Adeyemi, F.O. Comparative effects of poultry and cow dung-based composts on soil pH, organic matter, and macronutrient dynamics in a tropical sandy loam. Eurasian J. Soil Sci. 2025, 14, 219–230. [Google Scholar] [CrossRef] [Scilit]
  81. Aranyos, J.T. Assessing the long-term effect of different organic amendments on the quality of acidic sandy soil. Soil Sci. Soc. Am. J. 2025, 89, e20788. [Google Scholar] [CrossRef] [Scilit]
  82. Zoumana, K.; Stanislas, K.K.; Mamourou, K.; Sidiky, B.; Maméri, C. Contribution of cattle dung as an alternative to mineral fertilization of soils in tomato (Lycopersicon esculentum) production. Asian J. Soil Sci. Plant Nutr. 2023, 9, 132–142. [Google Scholar] [CrossRef] [Scilit]
  83. Yang, Y.; Ashworth, A.J.; DeBruyn, J.M.; Willett, C.; Durso, L.M.; Cook, K.; Moore, P.A.; Owens, P.R. Soil bacterial biodiversity is driven by long-term pasture management, poultry litter, and cattle manure inputs. PeerJ 2019, 7, e7839. [Google Scholar] [CrossRef] [Scilit] [PubMed]
  84. Zhongqi, H.E.; Tazisong, I.A.; Xinhua, Y.I.N.; Watts, D.B.; Senwo, Z.N.; Torbert, H.A. Long-term cropping system, tillage, and poultry litter application affect the chemical properties of an Alabama Ultisol. Pedosphere 2019, 29, 180–194. [Google Scholar] [CrossRef] [Scilit]
  85. Liu, G.; Wang, H.; Sun, J.; Shi, H.; Fei, Y.; Liang, J.; Mu, Y.; Liu, C.; Han, Z. Cow dung liquid mulch improves maize yields: Beneficial microorganisms are enriched and environmental risks are reduced and nutrient cycling is promoted. Agronomy 2024, 14, 2379. [Google Scholar] [CrossRef] [Scilit]
  86. Ramos, M.L.G.; da Costa, A.R.; Madari, B.E.; Carvalho, G.D.; de Castro Pereira, A.C.; Corrêa, R.S.; de Sousa, T.R.; de Carvalho, A.M. Nitrous oxide emissions and ammonia volatilization from pasture after cattle dung and urine applications in the dry and rainy seasons of the Brazilian Cerrado. Agronomy 2024, 14, 1257. [Google Scholar] [CrossRef] [Scilit]
  87. Lombardi, B.; Loaiza, S.; Trujillo, C.; Arevalo, A.; Vázquez, E.; Arango, J.; Chirinda, N. Greenhouse gas emissions from cattle dung depositions in two Urochloa forage fields with contrasting biological nitrification inhibition (BNI) capacity. Geoderma 2022, 406, 115516. [Google Scholar] [CrossRef] [Scilit] [PubMed]
  88. Carey, A.M.; Dutter, C.R.; Mbacke, K.; McDaniel, M.D.; Nair, A. Integrating poultry improves soil health and vegetable yield in organic, cover-cropped system. Agric. Ecosyst. Environ. 2025, 382, 109499. [Google Scholar] [CrossRef] [Scilit]
  89. Six, J.; Conant, R.T.; Paul, E.A.; Paustian, K. Stabilization mechanisms of soil organic matter: Implications for C-saturation of soils. Plant Soil 2002, 241, 155–176. [Google Scholar] [CrossRef] [Scilit]
  90. Drinkwater, L.E.; Cambardella, C.A.; Reeder, J.D.; Rice, C.W. Potentially mineralizable nitrogen as an indicator of biologically active soil nitrogen. In Methods for Assessing Soil Quality; Doran, J.W., Jones, A.J., Eds.; Soil Science Society of America: Madison, WI, USA, 1997; pp. 217–229. [Google Scholar] [CrossRef] [Scilit]
  91. Kumar, N.; Shambhavi, S.; Das, A.; Yasmeen, S.; Ganguly, P.; Kumar, S.; Rakshit, R. Soil biological indicators associated with nitrogen mineralization patterns in rice soils under long-term integrated nutrient management. Soil Use Manag. 2024, 40, e12963. [Google Scholar] [CrossRef] [Scilit]
  92. Piotrowska-Długosz, A.; Długosz, J.; Gryta, A.; Frąc, M. Responses of N-cycling enzyme activities and functional diversity of soil microorganisms to soil depth, pedogenic processes and cultivated plants. Agronomy 2022, 12, 264. [Google Scholar] [CrossRef] [Scilit]
  93. Nleya, Y.; Young, B.; Nooraee, E.; Baroutian, S. Anaerobic digestion of dairy cow and goat manure: Comparative assessment of biodegradability and greenhouse gas mitigation. Fuel 2025, 381, 133458. [Google Scholar] [CrossRef] [Scilit]
  94. Saggar, S.; Tate, K.R.; Giltrap, D.L.; Singh, J. Soil-atmosphere exchange of nitrous oxide and methane in New Zealand terrestrial ecosystems and their mitigation options: A review. Plant Soil 2008, 309, 25–42. [Google Scholar] [CrossRef] [Scilit]
  95. Chadwick, D.; Sommer, S.; Thorman, R.; Fangueiro, D.; Cardenas, L.; Amon, B.; Misselbrook, T. Manure management: Implications for greenhouse gas emissions. Anim. Feed Sci. Technol. 2011, 166, 514–531. [Google Scholar] [CrossRef] [Scilit]
  96. Feng, L.; Wahid, R.; Ward, A.J.; Møller, H.B. Anaerobic co-digestion of cattle manure and meadow grass: Effect of serial configurations of continuous stirred tank reactors (CSTRs). Biosyst. Eng. 2017, 160, 1–11. [Google Scholar] [CrossRef] [Scilit]
  97. Niraula, S.; Rahman, S.; Chatterjee, A.; Cortus, E.L.; Mehata, M.; Spiehs, M.J. Beef manure and urea applied to corn show variable effects on nitrous oxide, methane, carbon dioxide, and ammonia. Agron. J. 2019, 111, 1448–1467. [Google Scholar] [CrossRef] [Scilit]
  98. Lin, F.; Liu, Y.; Zhang, L.; Zhang, Y. Legume-Based Rotations Enhance Ecosystem Sustainability in the North China Plain: Trade-Offs Between Greenhouse Gas Mitigation, Soil Carbon Sequestration, and Economic Viability. Agriculture 2026, 16, 116. [Google Scholar] [CrossRef] [Scilit]
  99. Snyder, C.S.; Bruulsema, T.W.; Jensen, T.L.; Fixen, P.E. Review of greenhouse gas emissions from crop production systems and fertilizer management effects. Agric. Ecosyst. Environ. 2009, 133, 247–266. [Google Scholar] [CrossRef] [Scilit]
  100. Uchida, Y.; Clough, T.J. Nitrous oxide emissions from pastures during wet and cold seasons. Grassl. Sci. 2015, 61, 61–74. [Google Scholar] [CrossRef] [Scilit]
  101. Bratti, F.; Locatelli, J.L.; Ribeiro, R.H.; Besen, M.R.; Dieckow, J.; Bayer, C.; Piva, J.T. Nitrous oxide and methane emissions affected by grazing and nitrogen fertilization in an integrated crop-livestock system. Geoderma 2022, 425, 116027. [Google Scholar] [CrossRef] [Scilit]
Figure 1. Daily environmental conditions during the experimental period. (A) Mean air temperature, (B) rainfall, and (C) volumetric soil water content (SWC).
Grasses 05 00032 g001
Figure 2. Schematic overview of the experimental design and timeline, including field establishment, treatment imposition, rates, sampling events, and greenhouse gas (GHG) monitoring.
Grasses 05 00032 g002
Figure 3. Treatment × month interaction on crude protein concentration (p = 0.01; SE = 1.19) in annual cool-season forage system of Calhoun County, South Carolina. T1, grass only; T2, grass + N; T3, grass + legume; T4, grass + poultry litter; T5, grass + cattle dung; Error bar, indicate standard error. Means followed by a common letter within a column are not significantly different at the 5% level of significance, determined using the Tukey test.
Grasses 05 00032 g003
Figure 4. Treatment × month interaction on soil microbial C:N (p < 0.01; SE = 4.65) and inorganic nitrogen (p < 0.01; SE = 3.01) in an annual cool-season forage system of Calhoun County, South Carolina. T1, grass only; T2, grass + N; T3, grass + legume; T4, grass + poultry litter; T5, grass + cattle dung; Error bars indicate standard errors; ns, no significance between each bar and line. * Significant at the 5% of probability level between each bar and line, according to the Tukey test.
Grasses 05 00032 g004
Figure 5. Treatment × day interaction (p < 0.01; SE = 514) for daily methane fluxes during the 51-day evaluation period from annual cool-season forage systems under contrasting nitrogen fertilization sources in Calhoun County, South Carolina. T1, grass only; T2, grass + N; T3, grass + legume; T4, grass + poultry litter; T5, grass + cattle dung. * Indicates significant difference at the 5% probability level between each bar and line, according to the Tukey test; Error bars indicate standard errors; ns, means no significant difference between each bar and line.
Grasses 05 00032 g005
Figure 6. Daily carbon dioxide (p < 0.001; SE = 26) and nitrous oxide (p = 0.087; SE = 80) fluxes during the 51-day evaluation period from annual cool-season grazing systems under contrasting nitrogen fertilization sources in Calhoun County, South Carolina. (A) Carbon dioxide flux; (B) Nitrous oxide flux. Different lowercase letters indicate significant differences at the 5% probability level between each day, according to the Tukey test; Error bars indicate standard errors.
Grasses 05 00032 g006
Table 1. Chemical composition of the nitrogen sources used in the experiment (as-sampled basis).
TreatmentN SourceChemical
Composition
NH4-NNPK
-------- g−1 Fresh Weight (As-Sample Basis) --------
T1no fertilizer
T219–19–1919082.8157.7
13–0–0130
T3legume
T4poultry litter11.131.57.4118.1
T5cattle dung0.221.511.39.1
“–” indicates values not applicable (e.g., no fertilizer applied in T1) or not determined (e.g., N contribution from biological nitrogen fixation was not quantified in T3). Nutrient concentrations for poultry litter and cattle dung are expressed on an as-sampled (fresh weight) basis. Dry matter contents were 97.5% for poultry litter and 66.1% for cattle dung. For inorganic fertilizers, nutrient concentrations are expressed per kilogram of commercial fertilizer product. Fertilizer formulations (19–19–19 and 13–0–0) are reported as N–P2O5–K2O, whereas the values presented in the table for P and K correspond to elemental P and K. NH4–N = ammoniacal nitrogen; N = total nitrogen; P = elemental phosphorus; K = elemental potassium.
Table 2. Forage mass and nutritive value of cool-season forage systems under contrasting nitrogen fertilization sources in Calhoun County, South Carolina.
TreatmentFM +NDFADFIVDDMLitter C:N Ratio
kg DM ha−1--------- % (DM Basis) ----------Dimensionless
T1 *305052306423.9
T2291649296324.8
T3332549296324.1
T4265849296021.3
T5303351296022.6
SE234.931.230.946.532.56
p value0.400.360.960.260.63
HarvestFM +NDFADFIVDDMLitter C:N ratio
kg DM ha−1--------- % (DM Basis) ------------Dimensionless
May1546 b48 b27 b67 a-
June4446 a52 a31 a56 b23
SE148.580.770.606.53-
p value<0.01<0.01<0.010.02-
* T1, grass only; T2, grass + N; T3, grass + legume; T4, grass + poultry litter; T5, grass + cattle dung. + FM, Forage mass; NDF, Neutral detergent fiber; ADF, Acid detergent fiber; CP, IVDDM, In vitro digestibility of dry matter; SE, Standard error. “–” indicates values not applicable (single litter sampling in June). Means followed by a common letter within a column are not significantly different at the 5% level of significance, determined using the Tukey test.
Table 3. Chemical and biological soil health indicators under contrasting nitrogen fertilization sources in annual cool-season forage systems of Calhoun County, South Carolina.
TreatmentPMN+EAEN
mg NH4-N kg−1 day−1mg NO3-N kg−1
T1 *2.71 b2.27 b14.40 b
T22.37 b1.87 b14.36 b
T33.96 a12.18 a20.81 a
T41.95 b1.75 b12.40 b
T53.11 ab1.79 b13.75 b
SE0.272.951.45
p value<0.010.02<0.01
* T1, grass only; T2, grass + N; T3, grass + legume; T4, grass + poultry litter; T5, grass + cattle dung. + PMN, potentially mineralizable nitrogen; EA, Extractable ammonium; EN, Extractable nitrate. SE, Standard error. Means followed by a common letter within a column are not significantly different at the 5% level of significance by Tukey’s test.
Table 4. Average daily greenhouse gas fluxes from annual cool-season grazing systems under contrasting nitrogen sources in Calhoun County, South Carolina.
TreatmentN2O +CH4CO2
g N2O-N ha−1 day−1g CH4-C ha−1 day−1kg CO2-C ha−1 day−1
T1 *193−1 c117 a
T277412 b132 a
T326−3.59 c90 b
T460.38 c86 b
T5551106 a175 a
SE56.35155.8522.73
p value0.10<0.01<0.01
* T1, grass only; T2, grass + N; T3, grass + legume; T4, grass + poultry litter; T5, grass + cattle dung. +N2O, nitrous oxide; CH4, methane; CO2, carbon dioxide; SE, standard error. Means followed by a common letter within a column are not significantly different at the 5% level of significance, determined using the Tukey test.
Table 5. Pairwise correlation of forage, soil health and greenhouse gas responses (May 2025).
Variable+WASPMNEAENINSOCSONMBCMBNC:NBSRNAGFMNDFADFCPIVDDMN2OCH4
PMN+−0.27
EA−0.170.69 **, †
EN0.060.56 *0.19
IN−0.110.81 **0.89 **0.62 *
SOC−0.340.84 **0.56 *0.460.66 **
SON−0.320.86 **0.56 *0.480.67 **0.99 **
MBC−0.230.46−0.230.60 *0.090.480.46
MBN−0.37−0.20−0.48−0.37−0.56 *0.090.030.39
C:N0.170.430.420.81 **0.72 **0.240.300.08−0.76 **
BSR−0.270.85 **0.88 **0.340.86 **0.74 **0.76 **0.04−0.350.36
NAG−0.220.73 **0.500.250.51 *0.55 *0.58 *0.190.010.150.70 **
FM0.060.270.160.040.140.120.130.12−0.240.100.230.17
NDF0.09−0.080.02−0.42−0.18−0.14−0.13−0.30−0.01−0.250.070.150.59 *
ADF0.35−0.11−0.04−0.30−0.17−0.26−0.25−0.160.04−0.18−0.090.180.390.70 **
CP0.140.370.290.59 *0.510.340.310.33−0.280.58 *0.230.140.52 *−0.050.11
IVDDM−0.080.110.210.380.340.290.310.01−0.240.340.22−0.24−0.46−0.66 **−0.82 **−0.06
N2O−0.05−0.130.10−0.26−0.04−0.010.01−0.26−0.22−0.030.03−0.250.55 *0.18−0.110.230.02
CH4−0.23−0.14−0.20−0.38−0.34−0.31−0.25−0.13−0.04−0.16−0.26−0.080.400.230.14−0.16−0.420.51
CO2−0.10−0.23−0.26−0.33−0.36−0.34−0.29−0.13−0.07−0.09−0.37−0.240.390.180.08−0.06−0.310.61 *0.95 **
+WAS, Wet aggregate stability; PMN, potentially mineralizable nitrogen; EA, Extractable ammonium; EN, Extractable nitrate; IN, Inorganic nitrogen; SOC, Soil organic carbon; SON, soil organic nitrogen; MBC, microbial biomass carbon; MBN, microbial biomass nitrogen; C:N, microbial biomass carbon-to-nitrogen ratio; BSR, short-term carbon mineralization, NAG, N-acetyl-β-glucoaminidase; FM, Forage mass; NDF, Neutral detergent fiber; ADF, Acid detergent fiber; CP, Crude protein; IVDDM, In vitro digestibility of dry matter; N2O, nitrous oxide; CH4, methane; CO2, carbon dioxide. † Values are the correlation coefficient R with designated significant values; * Significant at the 5% of probability level; ** Significant at the 1% of probability level.
Table 6. Pairwise correlation of forage, soil health and greenhouse gas responses (June 2025).
Variable+WASPMNEAENINSOCSONMBCMBNC:NBSRNAGFMNDFADFCPIVDDMN2OCH4
PMN+−0.03 †
EA−0.180.39
EN−0.250.69 **0.00
IN−0.290.72 **0.81 **0.59 *
SOC−0.120.66 **0.220.69 **0.59 *
SON−0.100.70 **0.230.73 **0.62 *0.99 **
MBC0.120.29−0.470.61 *−0.020.55 *0.54 *
MBN0.340.13−0.460.49−0.080.290.300.75 **
C:N−0.410.280.69 **−0.140.480.080.08−0.50−0.87 **
BSR−0.320.55 *0.200.68 **0.56 *0.72 **0.75 **0.390.310.06
NAG−0.100.310.56 *0.030.470.410.37−0.29−0.170.270.13
FM0.160.16−0.130.170.00−0.24−0.190.080.37−0.270.19−0.26
NDF0.14−0.27−0.06−0.26−0.20−0.46−0.45−0.10−0.150.08−0.18−0.390.56 *
ADF0.41−0.26−0.13−0.30−0.28−0.37−0.36−0.050.25−0.31−0.15−0.190.73 **0.65 **
CP−0.68 **0.160.350.440.54 *0.340.34−0.10−0.160.260.460.11−0.27−0.34−0.50
IVDDM−0.460.070.230.090.240.270.24−0.21−0.470.420.020.26−0.77 **−0.54 *−0.82 **0.69 **
N2O0.090.260.03−0.12−0.040.120.130.06−0.250.270.11−0.25−0.050.10−0.130.030.14
CH4−0.16−0.05−0.320.18−0.160.250.210.68 **0.40−0.280.15−0.32−0.30−0.31−0.270.050.110.02
CO2−0.10−0.130.48−0.400.16−0.36−0.35−0.70 **−0.500.33−0.230.16−0.090.05−0.080.290.210.37−0.53 *
+WAS, Wet aggregate stability; PMN, potentially mineralizable nitrogen; EA, Extractable ammonium; EN, Extractable nitrate; IN, Inorganic nitrogen; SOC, Soil organic carbon; SON, soil organic nitrogen; MBC, microbial biomass carbon; MBN, microbial biomass nitrogen; C:N, microbial biomass carbon-to-nitrogen ratio; BSR, short-term carbon mineralization, NAG, N-acetyl-β-glucoaminidase; FM, Forage mass; NDF, Neutral detergent fiber; ADF, Acid detergent fiber; CP, Crude protein; IVDDM, In vitro digestibility of dry matter; N2O, nitrous oxide; CH4, methane; CO2, carbon dioxide. † Values are the correlation coefficient R with designated significant values; * Significant at the 5% of probability level; ** Significant at the 1% of probability level.
Disclaimer/Publisher’s Note: The statements, opinions and data contained in all publications are solely those of the individual author(s) and contributor(s) and not of MDPI and/or the editor(s). MDPI and/or the editor(s) disclaim responsibility for any injury to people or property resulting from any ideas, methods, instructions or products referred to in the content.