Article

Understanding Suboptimal Temperature Stress Tolerance Mechanisms in Grasses via Integrated Analysis of Leaf Elongation Dynamics and Photosynthetic Traits †

by
María Carolina Michelini
,
Santiago Javier Maiale
,
Beatriz Wyss
and
Andrés Alberto Rodríguez
*
Laboratorio de Fisiología y Asistencia al Mejoramiento Vegetal, Instituto Tecnológico de Chascomús (INTECH-CONICET-UNSAM), Escuela de Bio y Nanotecnologías (UNSAM), Chascomús B7130IWA, Argentina
*
Author to whom correspondence should be addressed.
This work is part of Michelini M.C. Doctorate.
Grasses 2026, 5(1), 14; https://doi.org/10.3390/grasses5010014
Submission received: 20 January 2026 / Revised: 18 February 2026 / Accepted: 6 March 2026 / Published: 11 March 2026

Abstract

Stress caused by suboptimal temperatures (ST) represents a stress that limits growth in all grasses without inhibiting their activity and induces alterations in photosynthetic performance. We evaluated the responses of photosynthetic parameters and leaf elongation between two groups of grass genotypes with different levels of tolerance to ST, belonging to phylogenetically distant species. Responses to ST depended on the type of parameter and on the genotypic group. Leaf elongation traits showed discriminatory power, especially the area under the leaf elongation curve, which integrated the early and transient effects of stress over time. The photosynthetic parameter PIABS showed lower discriminatory power compared with the area under the leaf elongation curve. However, a deeper analysis of other photosynthetic parameters revealed an increase in energetic connectivity between Photosystem II centers in tolerant, but not in sensitive, genotypes. A subsequent analysis of leaf and cellular parameters of early leaf elongation dynamics indicated that ST reduced meristematic activity in all genotypes, but the tolerant genotype group maintained a greater accumulation of mature cells compared with the sensitive genotype group. Overall, the results suggested a response to ST in tolerant genotypes, but not in sensitive genotypes, related to the early dynamics of leaf and cellular growth parameters to partially compensate for the restrictive effect of ST on leaf elongation not recorded. In parallel, they also indicated a response of the tolerant genotypes to ST in terms of photosynthetic parameters, probably as a pathway to maintain cellular homeostasis, to prevent photooxidative damage in PSII under stress. However, the relationship between both responses does not appear to be strictly linear, but rather would be mediated by coordinated adjustments in the temporal dynamics of growth, suggesting a functional integration between photosynthetic performance and the cellular mechanisms that regulate leaf expansion under ST stress.

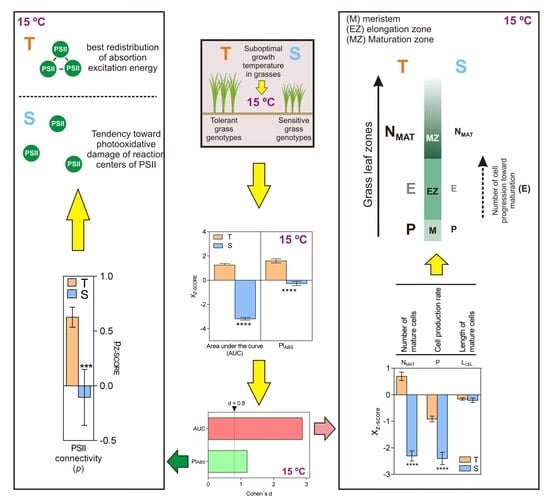
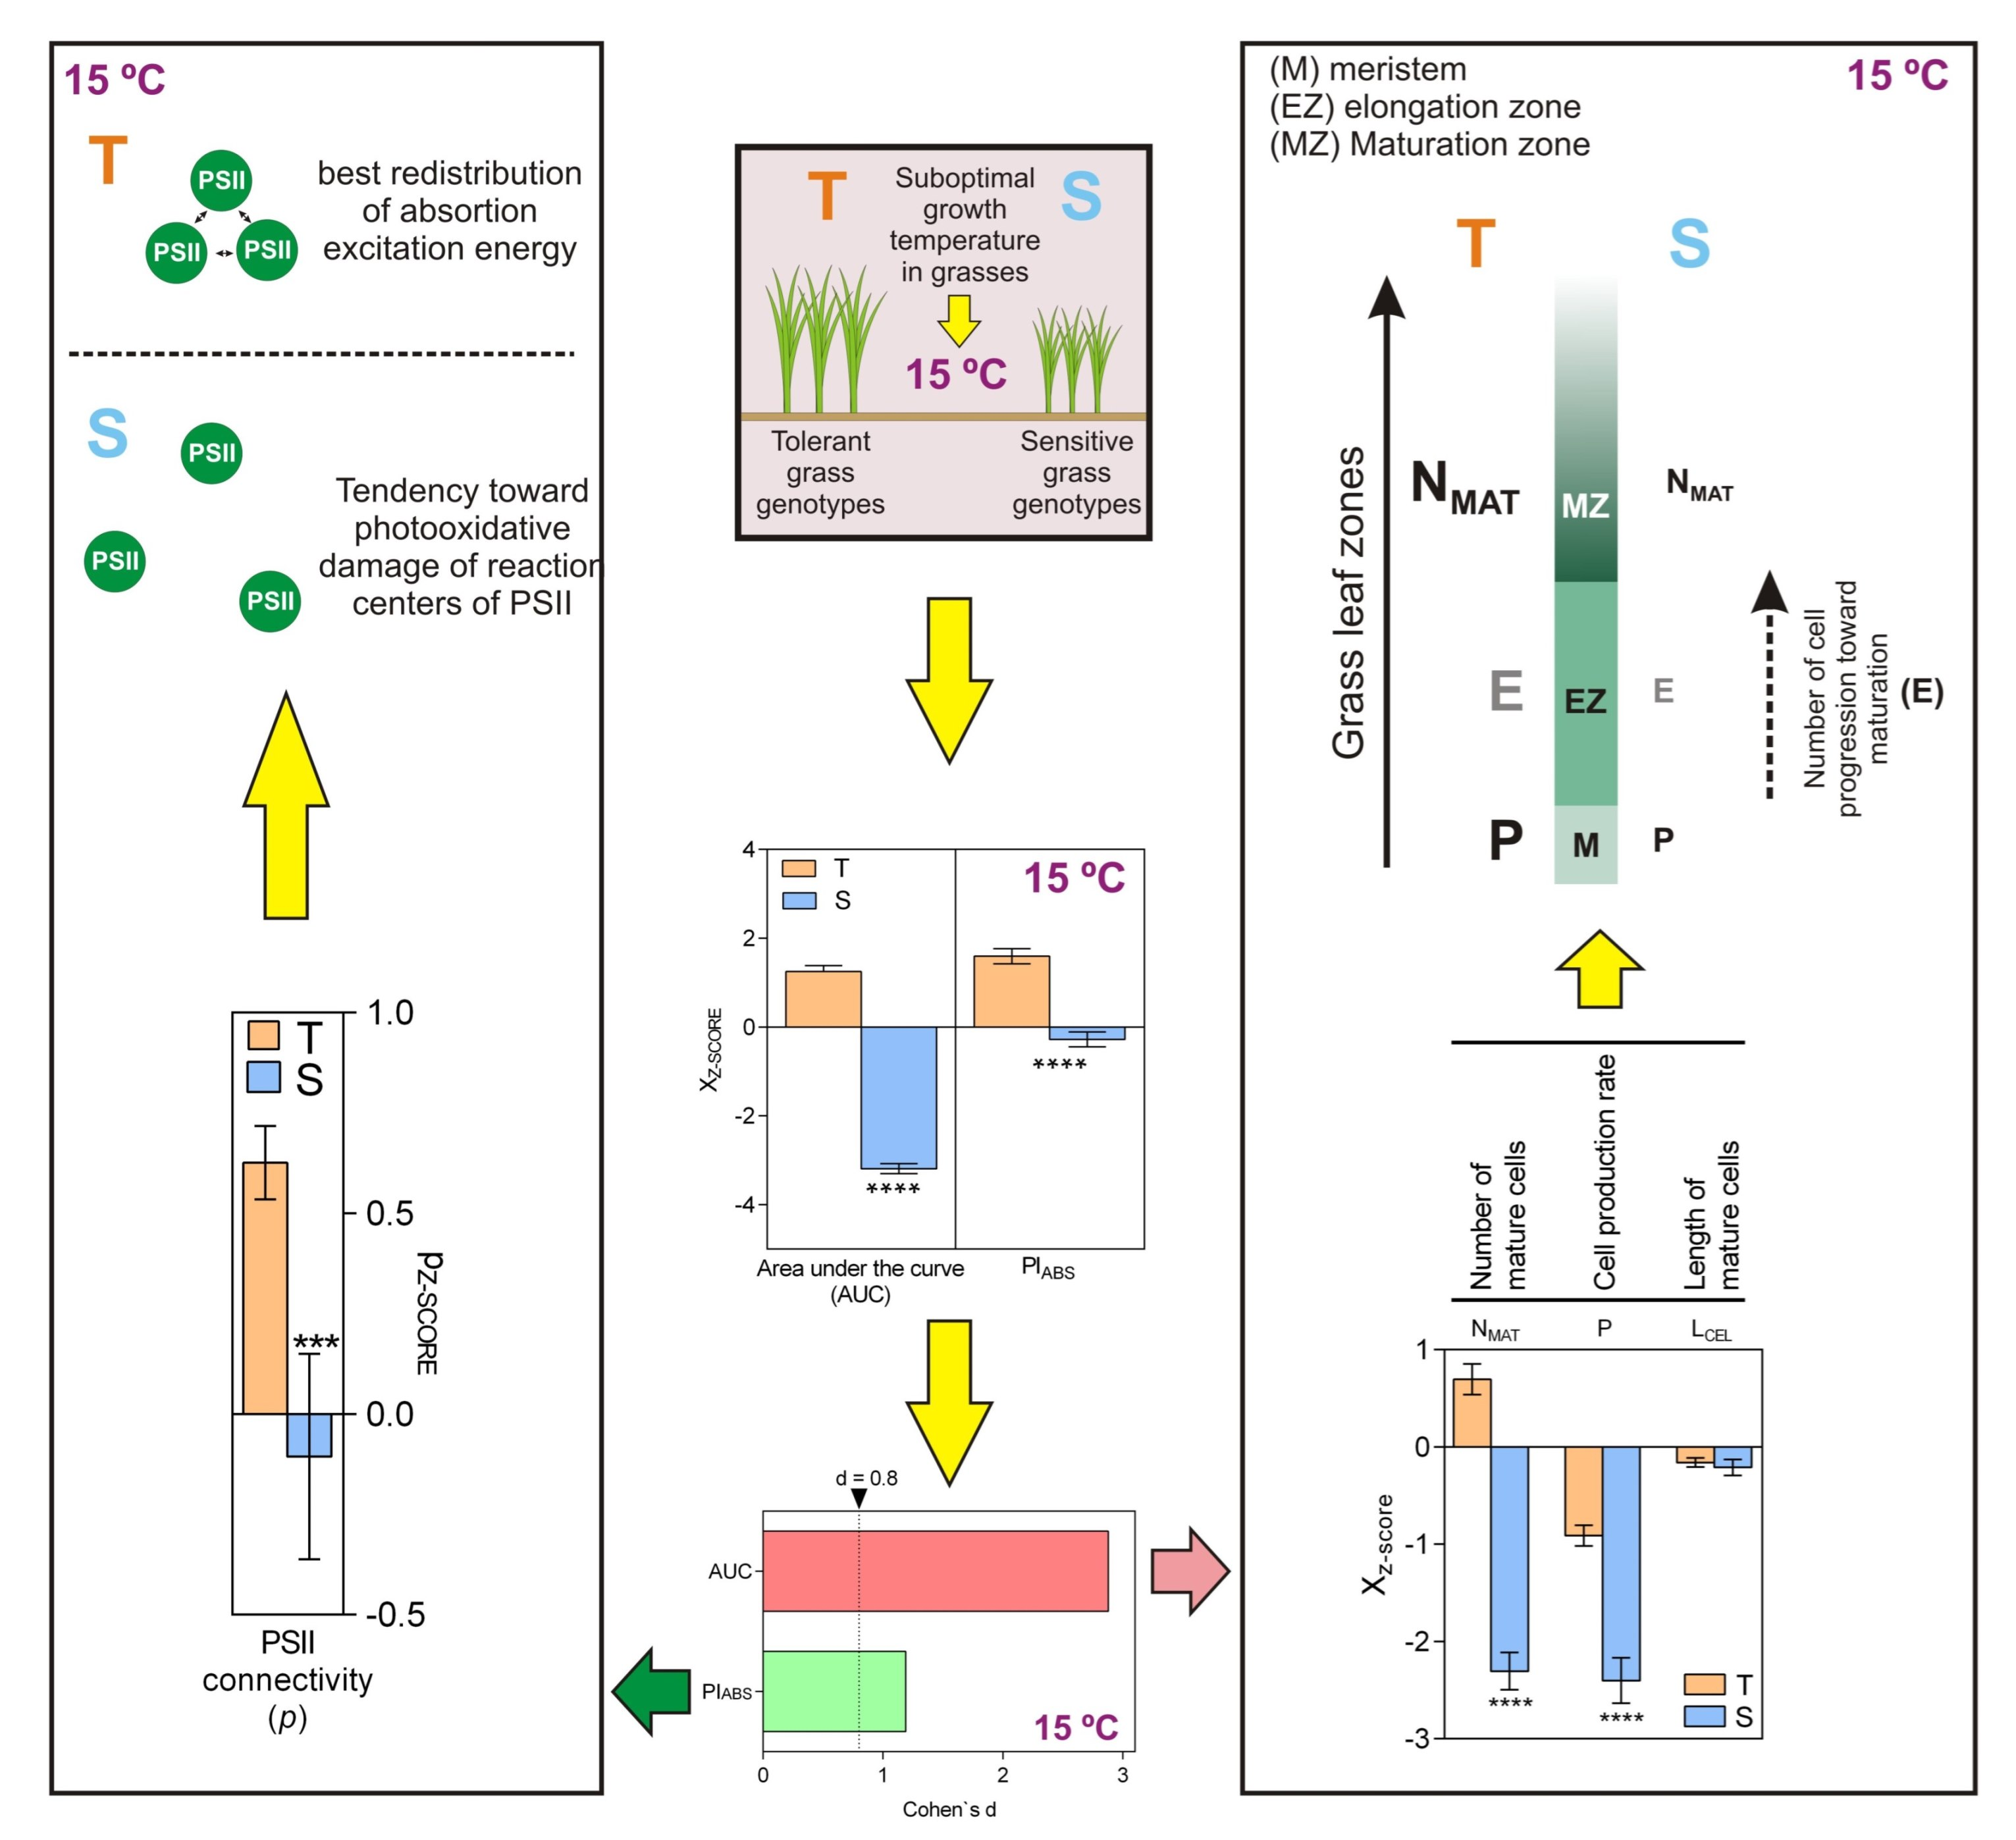
Graphical Abstract

1. Introduction

Since [1] proposed a genetic basis for cold adaptation in grasses, research on this topic has progressed continuously up to the present [2,3,4]. However, even in some of the most recent studies, it is still indicated that the underlying mechanisms have not yet been fully elucidated. The development of grasses is modulated by a gradient of cold conditions. Within the range of suboptimal temperatures (ST), defined as those falling between the minimum required for growth and the thermal optimum, there exists a more restrictive range (10–15 °C) that imposes growth-limiting stress without stopping its progress [5]. Unlike the more extreme states of chilling and freezing at the end of the spectrum, which often result in irreversible damage or plant death [6,7], this severe ST range allows many grasses to complete their life cycles. Certain cultivars of sensitive species, such as rice, have been reported to complete their life cycle under prolonged ST exposure, particularly when stress occurs during early vegetative stages, although with significant reductions in growth and yield [8,9]. This study focuses on the effects of ST on grasses, a frequent phenomenon during the growing season in temperate regions that restricts development without reaching the critical thresholds of extreme cold injury.
Photostasis acts as an integrative mechanism that coordinates photosynthesis and vegetative growth through the balance between the supply of photosynthetic energy and the metabolic demand associated with growth [10]. It has been demonstrated that cold exacerbates energy imbalance by reducing growth rate and metabolic activity, thereby generating a relative surplus of photosynthetic energy and disrupting photostasis [11]. This condition induces a readjustment of the cellular redox state and structural and functional modifications in the photosynthetic apparatus, in order to adjust metabolism to the new energy processing capacity [12]. In grasses, several authors have reported that the reduction in leaf growth promotes adjustments in photosynthetic components as a protective mechanism, thereby preventing oxidative damage to the photosynthetic apparatus [5,13]. However, it is still not clearly established how ST stress limits leaf elongation, nor what the relationship is between this limitation and photosynthetic performance. Among the most studied effects of ST stress on grass plants are those that induce changes in parameters related to growth and to the dynamics of leaf elongation. These effects have been reported both in ST-tolerant species such as wheat and barley [14,15] and in ST-sensitive species such as rice [8,16]. At the same time, effects that produce alterations in parameters associated with structural and functional changes in the photosynthetic apparatus also stand out in many ST-sensitive grasses [17,18], but also in many ST-tolerant grasses [19,20]. For this reason, many authors have conducted studies to identify indicators of cold tolerance in grasses, related to photosynthetic parameters or leaf development. However, previous studies that simultaneously analyze photosynthesis and leaf elongation with the aim of identifying mechanisms of tolerance to ST have either focused on a single species by evaluating different genotypes [21,22,23], or on two or more closely related species within the same genus or among related grasses [24,25]. Yet, species of grasses with contrasting levels of tolerance, and phylogenetically distant, have not been compared in an integrative approach that would allow the identification of differential patterns of response to ST stress. Therefore, the present study addresses this gap through the integrated analysis of leaf elongation and photosynthetic parameters in multiple grass species with different levels of tolerance to ST, belonging to phylogenetically distant species, with the aim of elucidating possible patterns and mechanisms involved in the response to this stress. And at the same time, the study explores which growth-related factors are modulated by ST stress to limit leaf elongation and whether these factors act independently of photosynthetic performance or not. Specifically, the working hypothesis proposes that ST stress modulates certain growth processes at the leaf and cellular levels, associated with leaf elongation, which allows them to partially compensate for the growth capacity affected by ST stress. And that in parallel, ST also modulates functional and structural factors of the photosynthetic apparatus that could contribute, along with the modulation of leaf elongation factors, to ST stress tolerance in grasses.
Among the photosynthetic parameters related with cold tolerance, the performance index of PSII (PIABS) has been shown to be a good indicator of ST tolerance in wheat [26], and rice [16]. In line with this, PIABS has also been identified as a good predictor of yield in rice under field ST conditions [27]. On the other hand, various parameters related to leaf elongation have also been employed to distinguish genotypes with contrasting tolerance to ST across different grass species. A typical leaf elongation parameter is the maximum leaf length achieved [28,29]. Other parameters related to leaf elongation dynamics, such as growth rate and duration, are also differentially affected among contrasting genotypes by the effect of ST [30,31]. Thus, the integrated variability of these parameters, determined through the area under the curve (AUC) of the leaf elongation pattern, could also represent a differential factor of tolerance to ST. In line with this, AUC has been effectively used to discriminate between ST-tolerant and ST-sensitive genotypes in rice during the early vegetative stage [8]. In the present study, the quantitative contribution of various photosynthetic parameters and leaf elongation to the differentiation between ST-tolerant and ST-sensitive grass genotypes was comprehensively analyzed. The results of this analysis provided key evidence on factors involved in a possible intrinsic mechanism of tolerance to ST, related to the dynamics of leaf elongation, and functional and structural parameters of the photosynthetic apparatus.

2. Materials and Methods

2.1. Plant Materials

Seeds of 15 genotypes belonging to 12 grass species, all of them cultivars currently sown in temperate regions of Argentina affected by ST stress, were used in this study. The tolerance category, interpreted as a binary variable with the categories tolerant or sensitive, was assigned a priori to the different genotypes based on information on the response to ST stress reported in the literature for the species of origin of each genotype, and on reports from producers who currently cultivate these genotypes. In particular, previous studies were considered in which different genotypes of these species were described according to their tolerant [32,33,34] or sensitive [35,36,37,38] response to ST stress. In the present study, the response to ST stress was conceived as a continuous phenotypic variable derived from the results of a PCA under the experimental conditions evaluated, using leaf elongation and photosynthesis parameters. This result supported the categories previously assigned to the genotypes and their grouping according to these categories, as an operational tool to facilitate the analysis and interpretation of the data. Specifically, the group of ST-tolerant genotypes included nine genotypes in total: two genotypes of Triticum aestivum (Maringa and Illinois), one genotype of Triticum durum (Kronos), one genotype of Hordeum vulgare (Picasso), one genotype of Avena sativa (Cautiva), one genotype of Bromus inermis (Criolla), one genotype of Secale cereale (Don Roque), one genotype of Lolium perenne (Picasso), one genotype of Festuca arundinacea (Brava). The group of ST-sensitive genotypes included six genotypes in total: one genotype of Panicum coloratum (Peman), three genotypes of Oryza sativa (Camba, Don Ignacio, Puitá), one genotype of Sorghum bicolor (Don Atilio), and one genotype of Chloris gayana (Topcut).

2.2. Growth Conditions

Seeds of ST-tolerant and ST-sensitive genotypes were sown following the method described in [5], on filter paper in Petri dishes. Subsequently, each obtained seedling was transplanted into a plastic cup containing sterile organic soil. The seedlings were grown under controlled environmental conditions with a 12/12 h photoperiod (light/dark), 80% relative humidity, 300 µmol photons m−2 s−1 photosynthetically active radiation, and an air temperature of 25 °C (control condition). When the third leaf emerged from the sheath tube formed by the preceding phytomers, 20 seedlings of each genotype were evenly distributed between two identical growth chambers (Percival E-30, Percival Scientific, IA, USA), placing 10 plants per genotype in each chamber. The third-leaf stage was selected because, in several of the grass species, its appearance marks the onset of the seedling’s photoautotrophic phase [39,40,41,42,43], reducing noise caused by seed nutritional variation during the heterotrophic phase. One chamber was maintained under control conditions (Chamber C). The other chamber (Chamber ST) was set under low-temperature stress conditions, maintaining the same photoperiod, relative humidity, and light intensity as the control condition, but with an air temperature of 15 °C. In this way, the onset of stress was synchronized with a morphologically comparable developmental stage among genotypes. The growth conditions protocol was initially used in order to obtain the complete time-series data of leaf elongation (Section 2.3), and OJIP parameters (Section 2.4). In addition, it was repeated three more times under the same experimental design, partly for the same purpose, but also, in order to obtain the data on the early dynamics of leaf elongation (Section 2.5). Comparative analysis among repetitions of the growth conditions protocol did not reveal significant differences between experiments for the parameters evaluated for each genotype and treatment.

2.3. Acquisition of Leaf Elongation Time-Series Data

The length of the third leaf (Y, dependent variable) was recorded at approximately 24 h intervals, 2 h after the onset of the light period, in plants grown in both chambers. Variable Y was measured in millimeters from the stem–leaf junction to the leaf tip, starting at leaf emergence from the sheath formed by the preceding phytomers, using a millimeter ruler. At the same time, the measurement time (X, independent variable) was also recorded. When Y equaled the previous measurement, the leaf was considered to have reached its final length (LMAX), and measurements were stopped. This moment was defined as the time at which the leaf reached its final length (TMAX). This resulted in a pattern of XY points for each analyzed leaf (XY dataset). AUC at TMAX was calculated with scipyintegratetrapezoid in Python v3.14.3 using the XY datasets. One measurement of each parameter (LMAX, TMAX, and AUC at TMAX) in each third leaf of each of the 10 plants of each genotype, in both chambers. Each of the values of these parameters under ST (XST), from plants of a particular genotype, was standardized by z-score using the mean (μCONTROL) and standard deviation (σCONTROL) calculated from the 10 control plants of the same genotype, according to the formula: XZ-SCORE = XST − μCONTROLCONTROL. This standardization approach was applied to reduce the influence of intrinsic vigor and potential interspecific differences in developmental rates, thereby enabling comparisons at the functional group level.

2.4. Determination of the PIABS, and Other OJIP Parameters

A single chlorophyll a fluorescence emission kinetic was analyzed in each third leaf of each of the 10 plants of each genotype, in both chambers, at TMAX, using the OJIP-test according to [18]. This was performed 3 h after the photoperiod light stage initiation, utilizing a fluorometer HANDY PEA (Hansatech Instruments Ltd., King’s Lynn, Norfolk, UK), according to the manufacturer’s instructions. A section of the intact leaf blade of the third leaf of each plant was placed in a fluorometer leaf clip, and the sliding cover of the leaf clip was closed to block light, allowing the leaf blade section to adapt to darkness for 20 min. The leaf clip was positioned at the middle of the leaf blade. After 20 min of dark adaptation, the leaf clip, still covering the leaf, was tightly positioned in front of the actinic light source of the fluorometer. Then, the sliding cover of the leaf clip was opened to expose the leaf blade section to a pulse of actinic red light (650 nm, 3500 μmol photons m−2 s−1). The pulse lasted 3 s to obtain the raw fluorescence emission kinetics data. These raw data were processed using the PEA Plus software (PEA Plus v1.1, Hansatech Instrument, King’s Lynn, Norfolk, UK) to determine PIABS and other OJIP parameters related to the proportion and functional state of active reaction centers (RC) of PSII (RC-PSII). For the particular case of determining the connectivity between PSII units (p), the equation proposed by [44] was employed, using the specific raw fluorescence values. The parameter p was calculated as p = F300μs/VJ, where Vt = (Ft − F0)/(FM − F0). F300μs, Ft, F0, and FM represent, respectively, the fluorescence value at 300 μs, the fluorescence at a time t during induction, the minimal fluorescence and the maximal fluorescence. Values of p greater than zero reflect a higher energetic connectivity between RC-PSII, while values close to zero indicate independent RC-PSII. One measurement of each OJIP parameter was obtained from each of the chlorophyll a fluorescence emission kinetics, thus obtaining 10 measurements of each parameter per genotype in each chamber. All OJIP parameters were standardized using z-scores according to the equation indicated in Section 2.3.

2.5. Determination of Early Growth Parameters at the Cellular and Foliar Levels

Cellular parameters were determined according to [45] in each third leaf of each of the 10 plants of each genotype, in both chambers. Each third leaf was completely removed from the plants by first eliminating the older leaves with forceps and a scalpel. An imprint of the abaxial epidermis of these leaves was made using nail varnish and transferred to microscope slides with cellophane tape. All cell lengths were obtained from images of abaxial epidermal impressions. In particular, the lengths of 20 mature cells, taken from a single third leaf, were measured next to the stomatal file, a procedure that allows cell lengths to be reproducibly measured along the epidermis [46]. These lengths were obtained from images of a single impression of the cell maturation zone, which includes the fully expanded mature cells within the leaf. These images were acquired using bright-field microscopy (Zeiss Axio Observer 7 inverted fluorescence microscope, Carl Zeiss, Jena, Germany) at ×20, particularly from a 2 cm long area in the middle region of the leaf lamina, and processed using Fiji/ImageJ software (Fiji/ImageJ software, version 2.14,0, NIH, Bethesda, MD, USA). Cell lengths were determined randomly at 1mm intervals within this area, taking one cell length per mm, until a total of 20 measurements were obtained. These cell lengths were subsequently averaged to calculate the average cell length. The cell production rate in the meristem (P) was calculated following the equation described in [30]:
L E R = P   .     L C E L 1000
where LER represents the leaf elongation rate defined as:
L E R = F i n a l   l e n g t h     I n i t i a l   l e n g t h     T f i n a l T i n i t i a l
where Final length and Initial length represent the initial measurement of leaf length at final time and initial time, respectively, both recorded according for Section 2.3. By rearranging Equation (1), Equation (3) was obtained to calculate P:
P = L E R   .     1000 L C E L
Finally, the number of mature cells accumulated at the end of the linear elongation phase (NMAT) was estimated as the ratio between the length of the cell maturation zone and LCEL. The LER during the linear phase of leaf growth (Slin) was calculated according Equation (2). The average curvature (AC) of the elongation pattern was calculated according to the following equation, developed by [47]:
A C = 1 n i = 1 n K x i
where K(xi) represents the average curvature of each local curvature.
All early growth parameters at the cellular and foliar Levels were determined of the 10 plants of each genotype, in both chambers. These data were presented with and without z-score standardization, according to the equation indicated in Section 2.3.

2.6. Statistical Analyses

The tolerance category assigned to the genotypes was the only factor of comparison used in the statistical analyses (the genotype and species factors were not considered). Individual plants were considered the experimental units for each parameter evaluated.

2.6.1. Statistical Analyses to Assess the Ability of Different Parameters to Maximize the Separation Between Groups of Genotypes Contrasting in ETS Tolerance

Z-score data of photosynthesis and leaf elongation parameters were analyzed using a Student’s t-test, and PCA in Infostat 2020 software (https://www.infostat.com.ar, accessed on 18 February 2026). A Python v3.14.3 function based on [48] was created to compute Cohen’s d, quantifying effect size between means. The function takes two value sets, calculates their means and sample standard deviations (s1, s2) with NumPy’s np.std (ddof = 1), and computes the pooled standard deviation using:
S p =   n 1 1 s 1 2 +   n 2 1 s 2 2 n 1 + n 2 2
where n1 and n2 are their respective standard deviations. Finally, the function returns the standardized difference between the means of both groups, corresponding to the value of the Cohen’s d statistic, which represents the effect size. Cohen’s d values ≈ 0.2, ≈0.5 and ≥0.8, indicate respectively, a small effect size, a medium effect size and a large effect size.

2.6.2. Statistical Analyses to Assess the Key Role of AUCST in ETS Tolerance and Its Relationship with the Early Dynamics of the Leaf-Elongation Pattern

Associations between AUCZ-SCORE and AUCCONTROL/AUCST at TMAX were analyzed using linear parametric correlation and regression in Infostat 2020 software (https://www.infostat.com.ar, accessed on 18 February 2026). Relationships between AUCST at TMAX and partial characteristics of the leaf elongation pattern were assessed using multiple regression analyses. The partial characteristics features were extracted at the individual leaf level from subsets of elongation XY datapoints using a custom Python v3.14.3 script based on NumPy. The partial characteristics features included average slope (SAVE), the ratio between final and initial slope (RS), maximal slope (SMAX), partial area under the curve (AUCP), and average partial length (YAVE). The multiple regression was performed using the MixedLM class from statsmodels in Python v3.14.3. Regression performance was evaluated using the coefficient of determination (R2). Z-score data and non-standardized data of the partial characteristics features were also analyzed using a Student’s t-test.

3. Results

3.1. Characterization of Physiological Parameters Between ST-Tolerant and ST-Sensitive Grass Genotypes

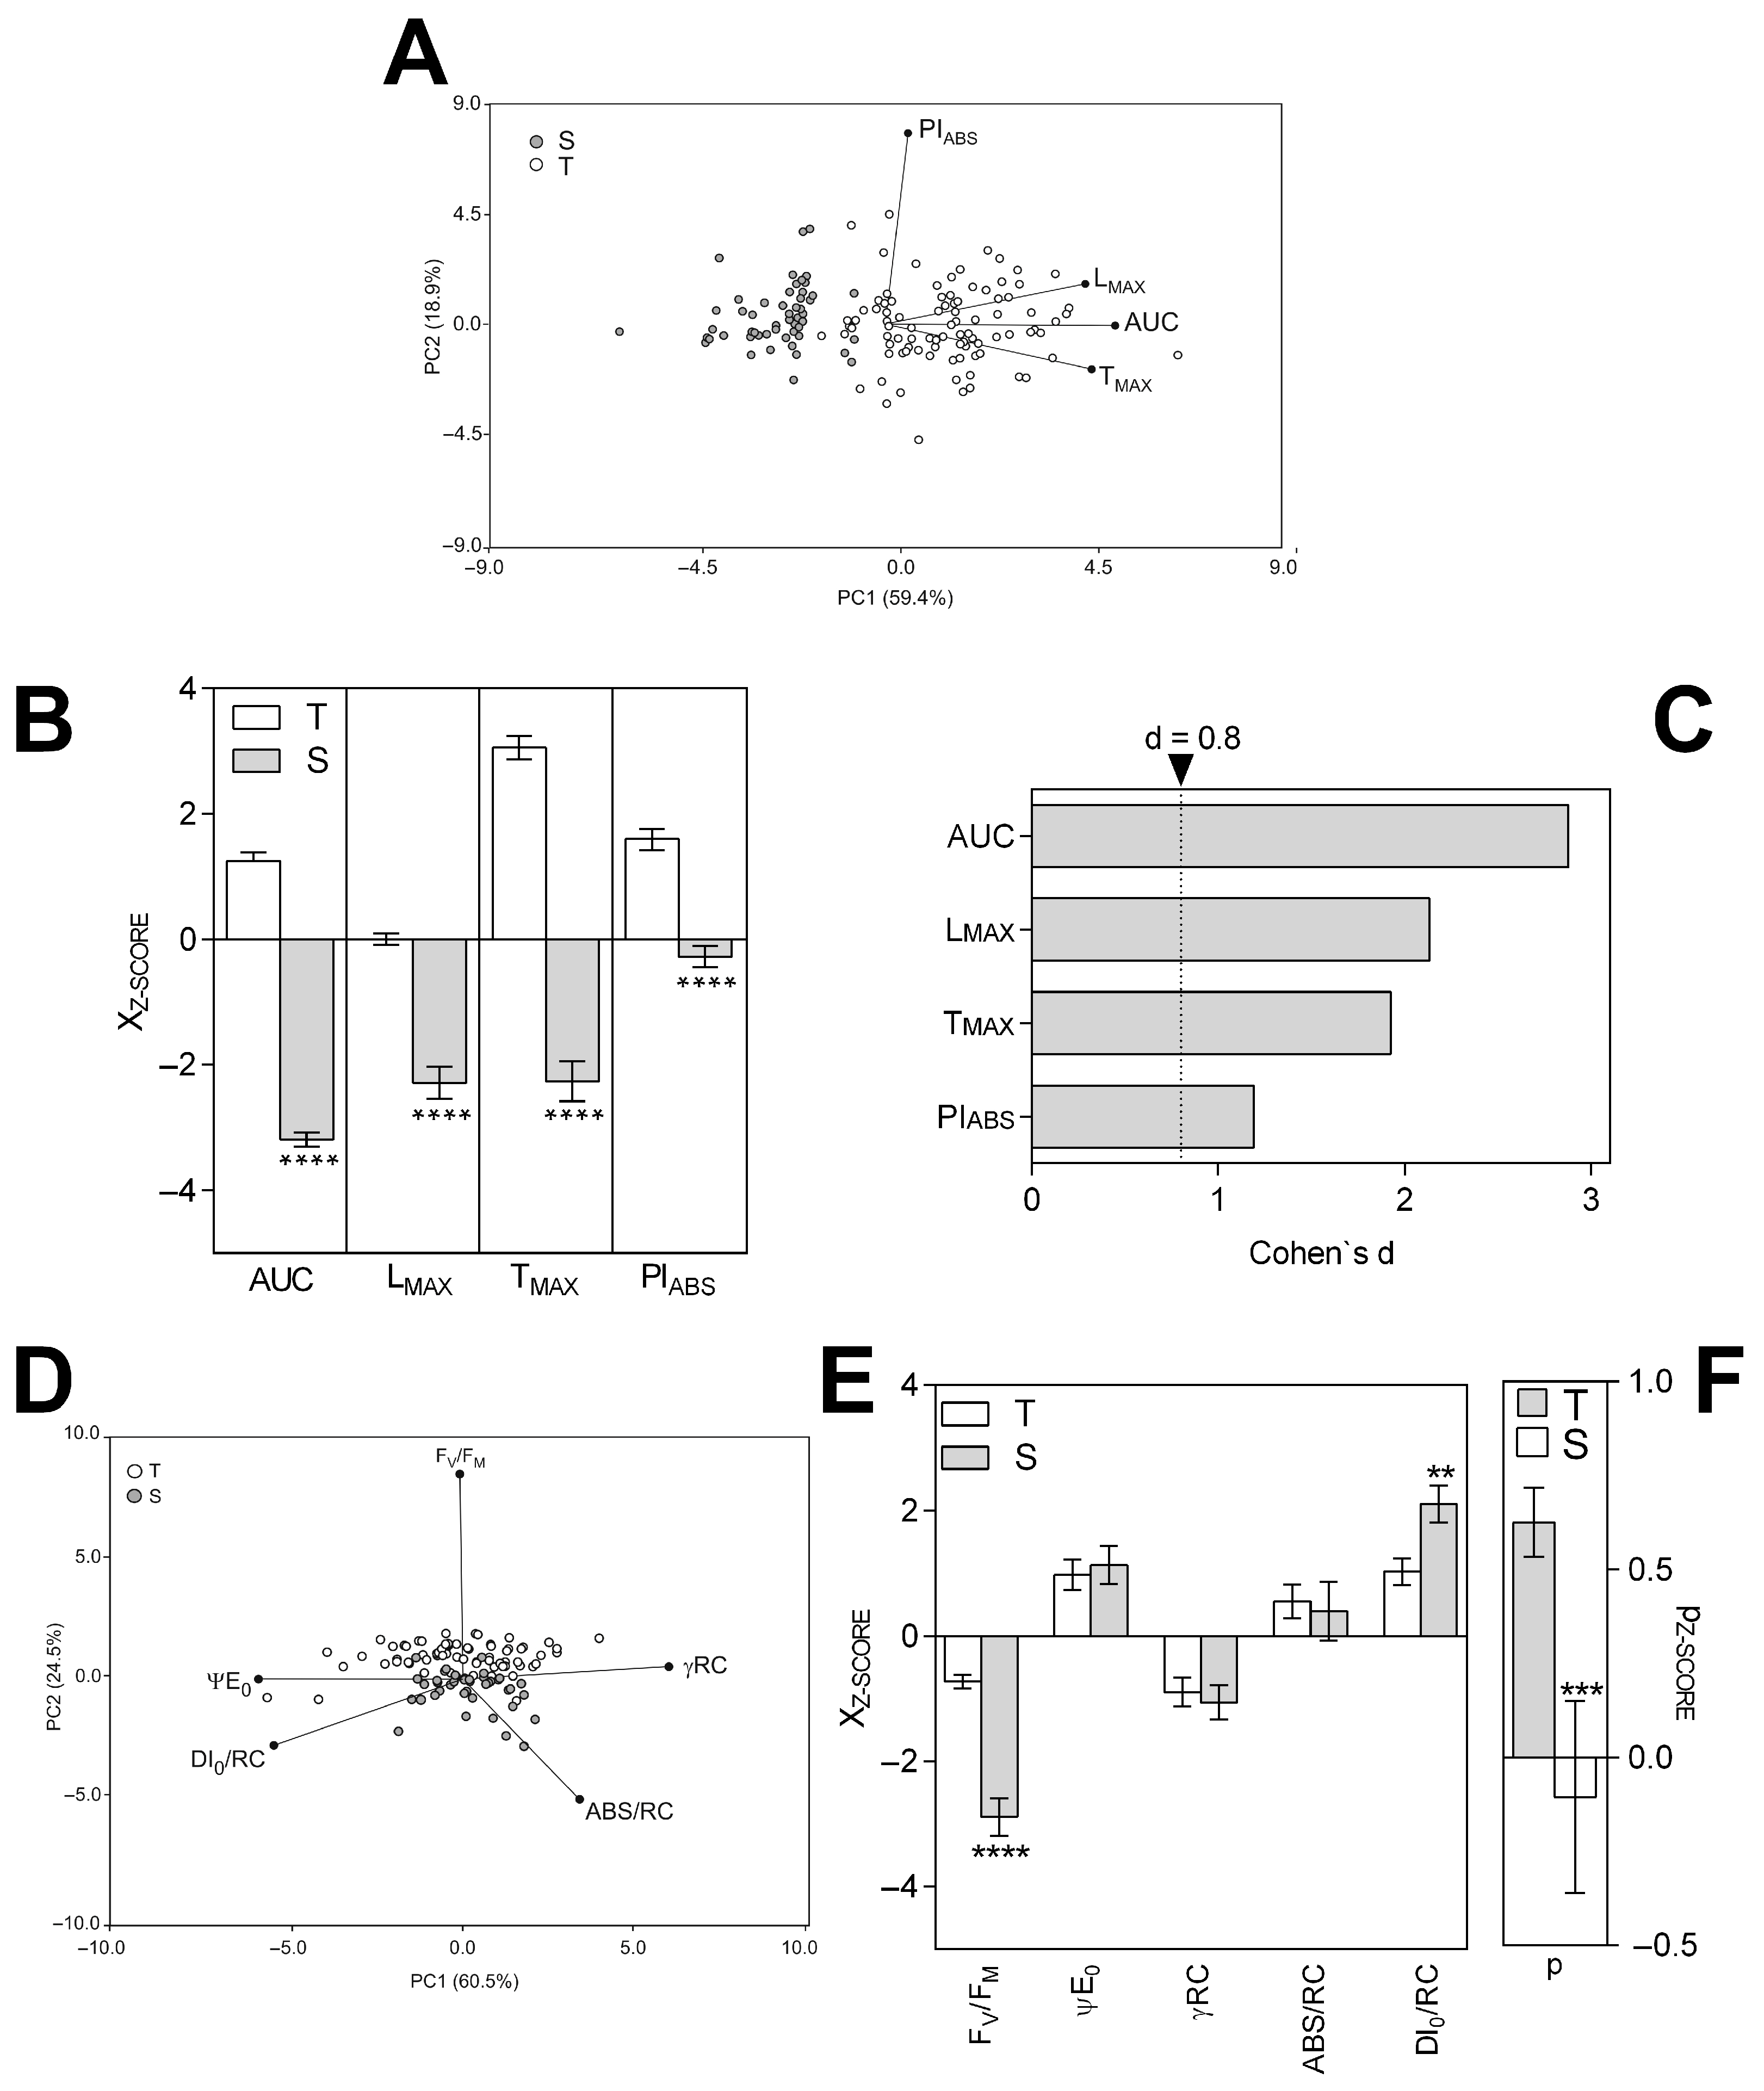
As a first step, a PCA was performed using photosynthetic and leaf elongation parameters standardized by z-score to minimize the influence of the genotypes’ inherent vigor (Figure 1A).
The PCA suggested a separation of the data between the contrasting groups of genotypes, which confirmed the tolerance categories previously assigned to the genotypes, with the variance along PC1 primarily influenced by leaf elongation parameters. The maximization of the separation between contrasting groups, based on individual parameters, indicated differences in both growth and PIABS traits among grass genotypes (Figure 1B). All parameter values of the ST-sensitive genotype group were predominantly negative, particularly for leaf elongation parameters, indicating a general decrease under ST conditions compared with the control. In contrast, with the exception of LMAX, which showed similar values between treatments, the remaining parameters exhibited positive z-score values. Also, by calculating the effect size of the mean differences using the Cohen’s d statistic, all parameters showed a large effect size (d ≥ 0.8), with AUC standing out with a value of d = 2.87 (Figure 1C). While leaf elongation parameters showed the highest discriminant power in both individual and multivariate analyses, PIABS exhibited a moderate ability to separate groups. In this context, complementary fluorescence parameters were explored. A complementary PCA indicated that the joint variability of the PIABS subcomponents was primarily structured along PC1, with γRC and ABS/RC associated with positive values of this axis, and ΨE0 and DI0/RC with negative values (Figure 1D). In contrast, FV/FM showed a strong positive correlation with PC2. A univariate analysis of the fluorescence parameters previously analyzed by PCA indicated significant differences only for FV/FM and DI0/RC (Figure 1E). Both groups exhibited negative z-score values for FV/FM and positive values for DI0/RC; however, the sensitive group showed significantly more negative FV/FM values and significantly more positive DI0/RC values. In contrast, no significant differences were detected for γRC, ΨE0, or ABS/RC. This pattern suggested that the observed differences might be related to the energetic connectivity between PSII units (p). An analysis of p indicated positive z-score values for the ST-tolerant genotypes, whereas the ST-sensitive genotypes showed values slightly below zero (Figure 1F).

3.2. Relationship Between Early Leaf Elongation Dynamics and AUC Under ST

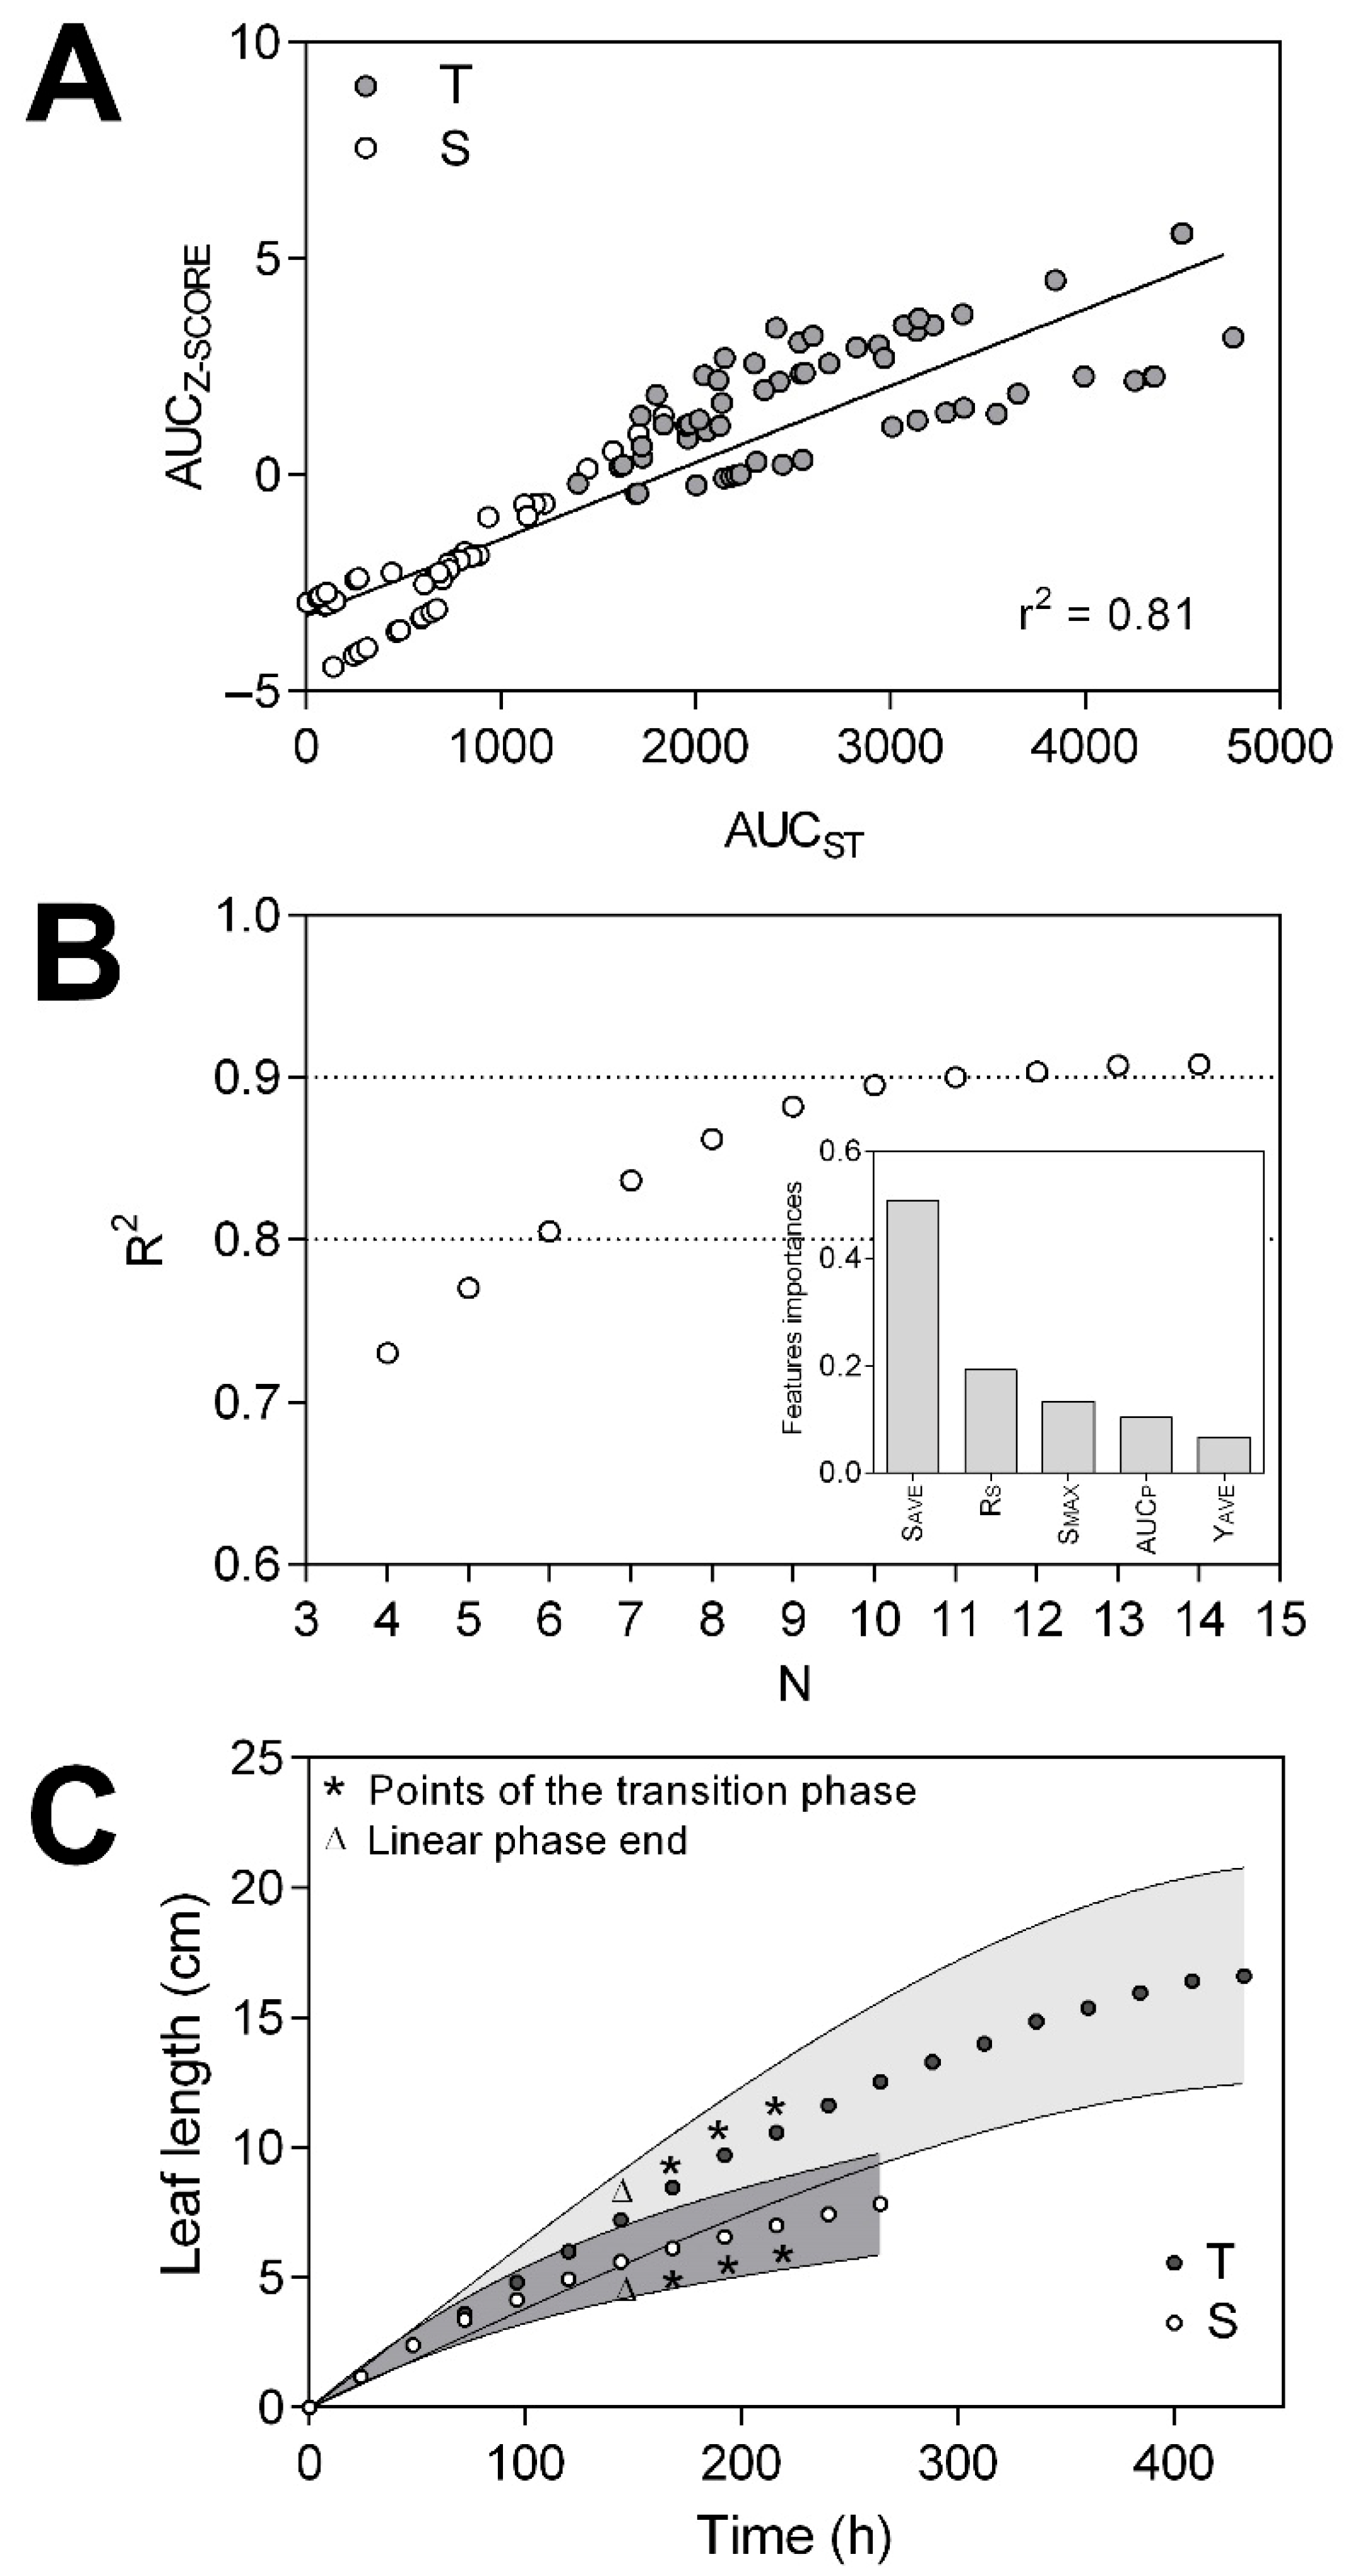
The previous statistical analyses highlighted the AUC z-score (AUCZ-SCORE) as the parameter with the greatest capacity to distinguish the contrasting groups. A linear regression analysis showed that the AUC value of both groups under control conditions (AUCCONTROL) did not show an association with the AUCZ-SCORE. This indicated, on the one hand, the absence of variability in AUCCONTROL between sensitive and tolerant genotypes, and on the other hand, that the intrinsic vigor associated with AUCCONTROL does not determine the differential response to ST among groups. In contrast, AUC under ST conditions (AUCST) was strongly associated with the AUCZ-SCORE (R2 = 0.81; Figure 2A). This result is consistent with the mathematical formulation of the standardized metric and confirms that variation in performance under ST largely determines the discriminatory capacity of the AUCZ-SCORE.
Additionally, a study was conducted to identify the stages of the leaf elongation pattern that contribute most significantly to the relationship between AUCST and ST tolerance. To this end, various partial characteristics of the leaf elongation pattern were calculated from progressively larger sets of XY data pairs. These partial characteristics, together with AUCST values, were subjected to different multiple regression analyses to determine the amount of XY data required to explain the largest proportion of AUCST variability. This study showed that the partial characteristics explained more than 90% of the variability in AUCST (R2 > 0.90), particularly when the set of the first 10 XY data pairs was used. However, adding more XY data points did not provide additional relevant information, as evidenced by the stabilization of the R2 values (Figure 2B). The regression analysis using the first 10 XY data pairs also revealed that the most relevant partial features were those closely related to the leaf elongation rate (Inset, Figure 2B). A subsequent analysis of the average leaf elongation patterns ST-tolerant and ST-sensitive grass genotypes revealed that these 10 XY data pairs contained information corresponding to the linear elongation zone and the first points of the transition phase (Figure 2C). Altogether, these findings indicated that early leaf and cellular growth dynamics could act as early descriptors of final growth performance and ST tolerance, rather than fully independent predictors.

3.3. Analysis of the Relationship Between Early Leaf and Cellular Elongation Dynamics and ST Tolerance

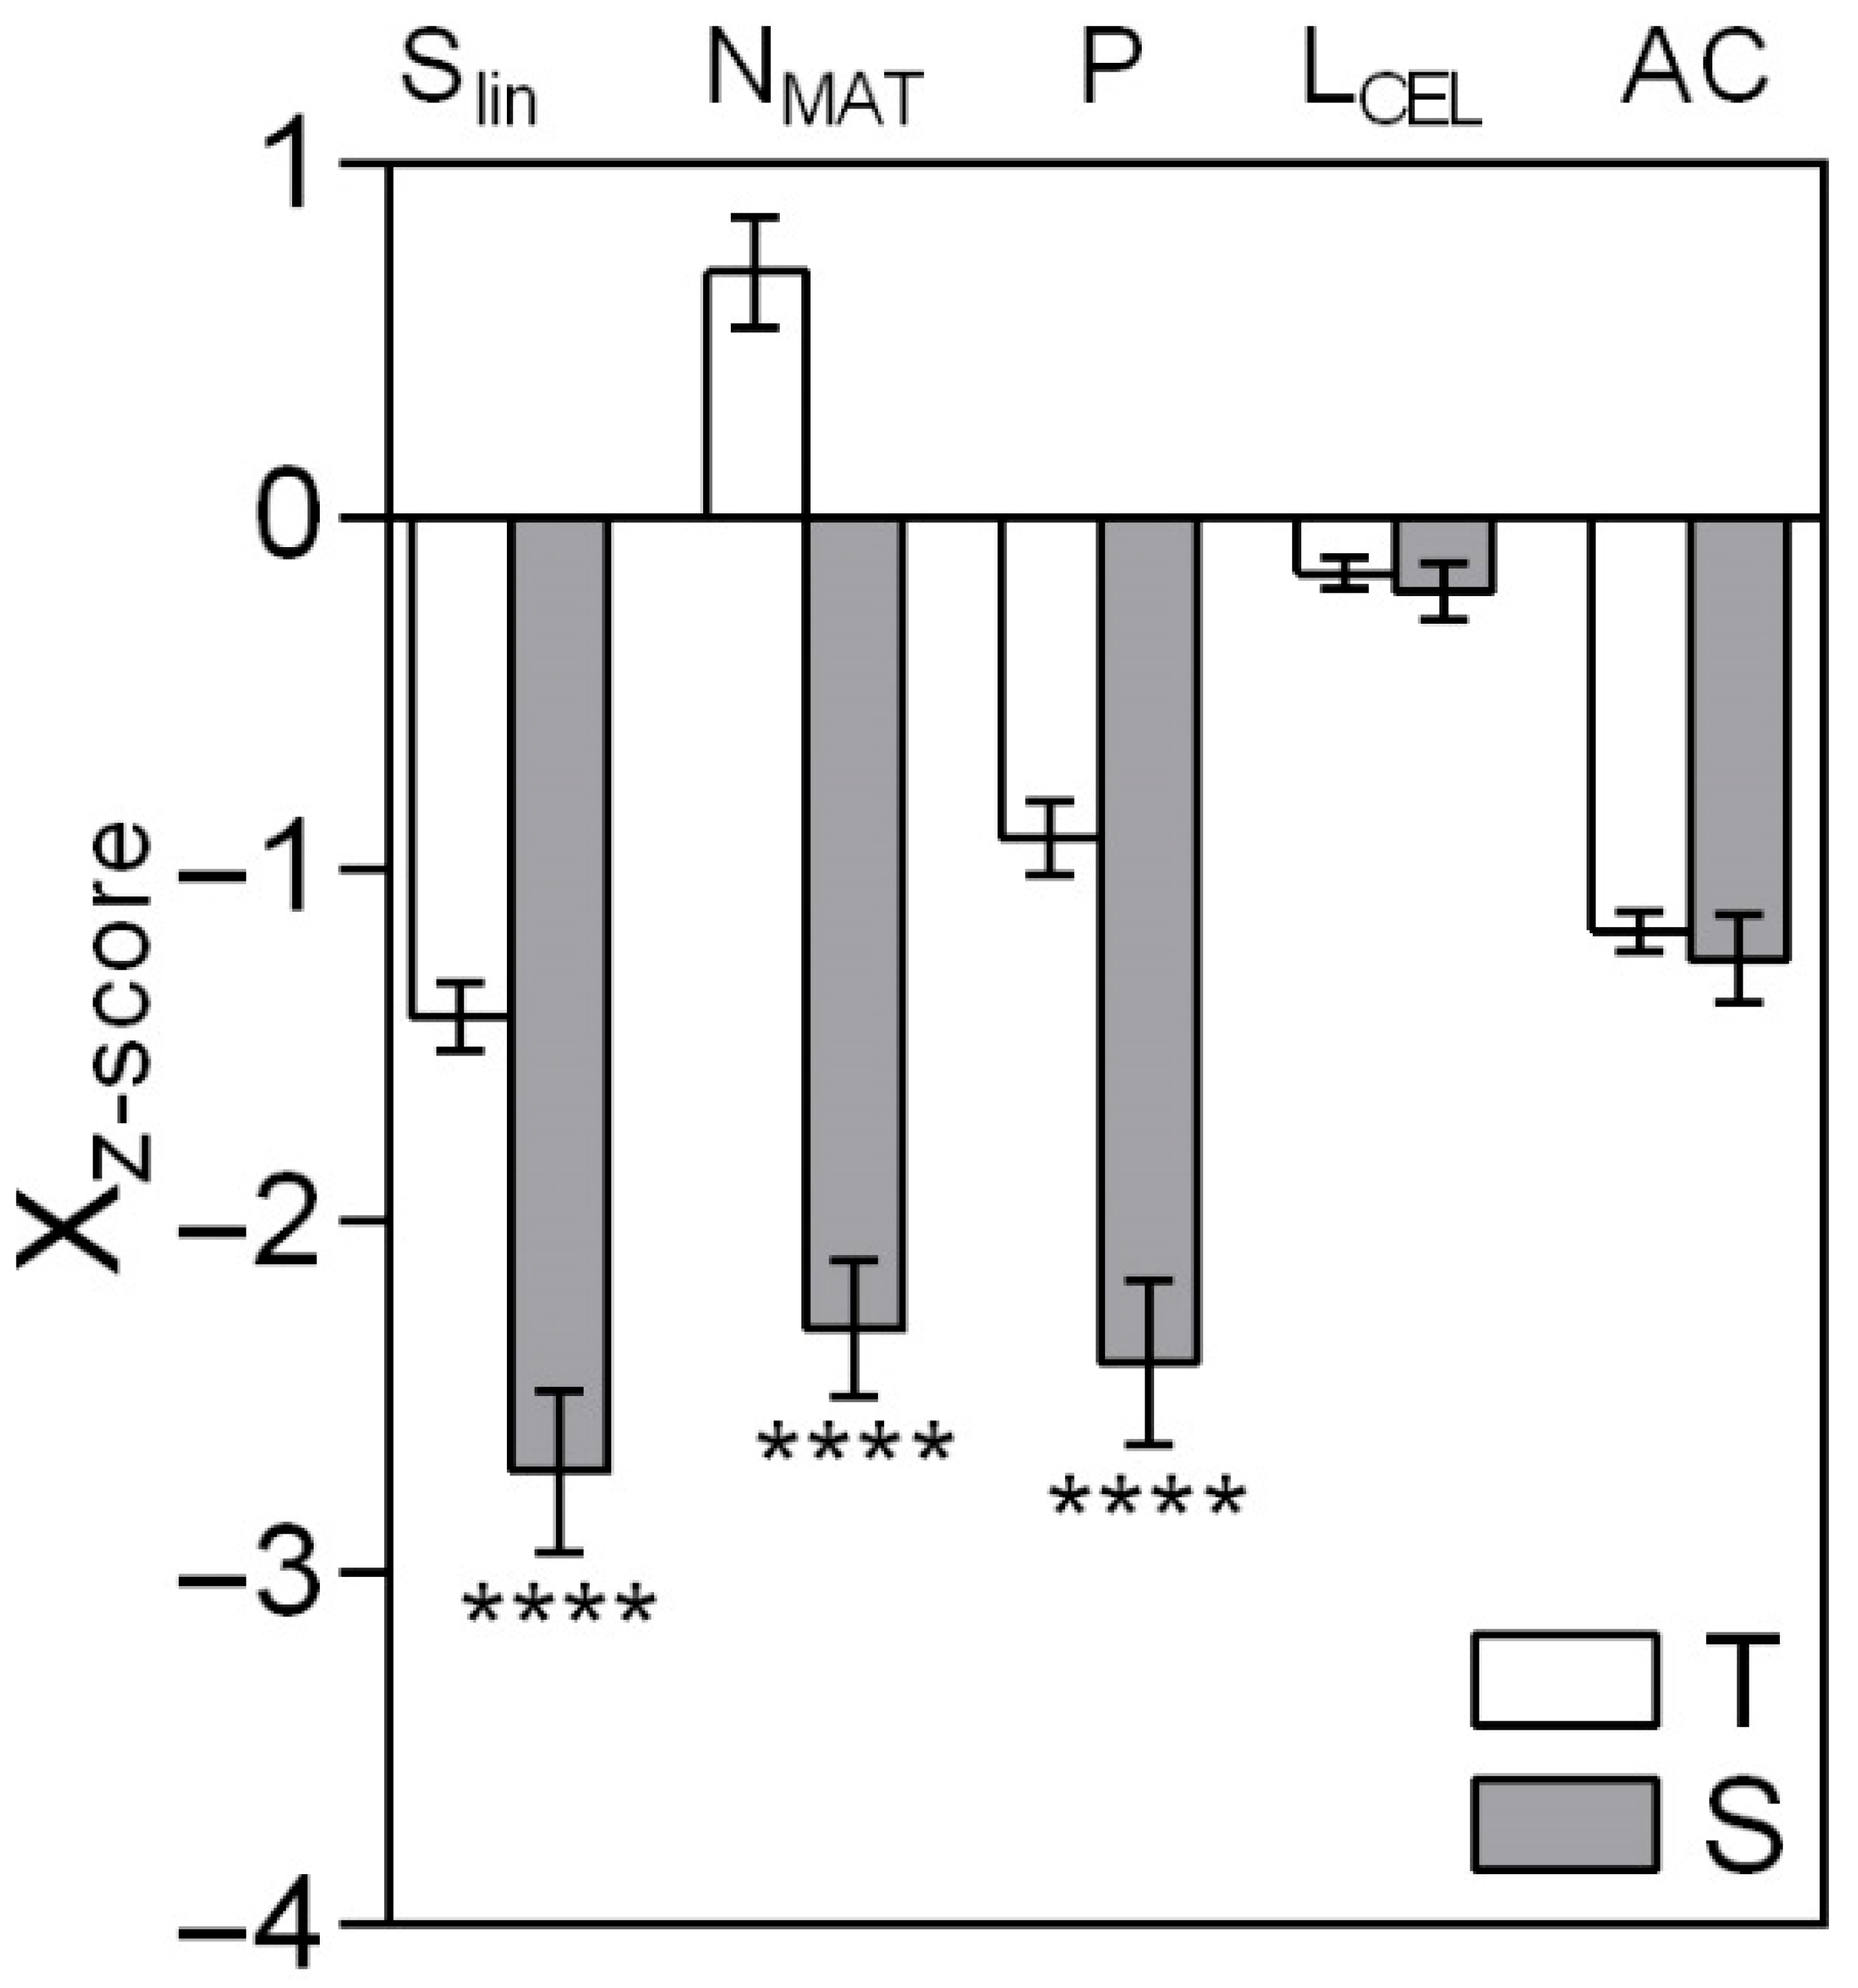
Foliar and cellular parameters associated with early leaf elongation dynamics under ST conditions, were also determined in ST-tolerant and ST-sensitive grass genotypes under control and ST stress conditions (Figure 3).
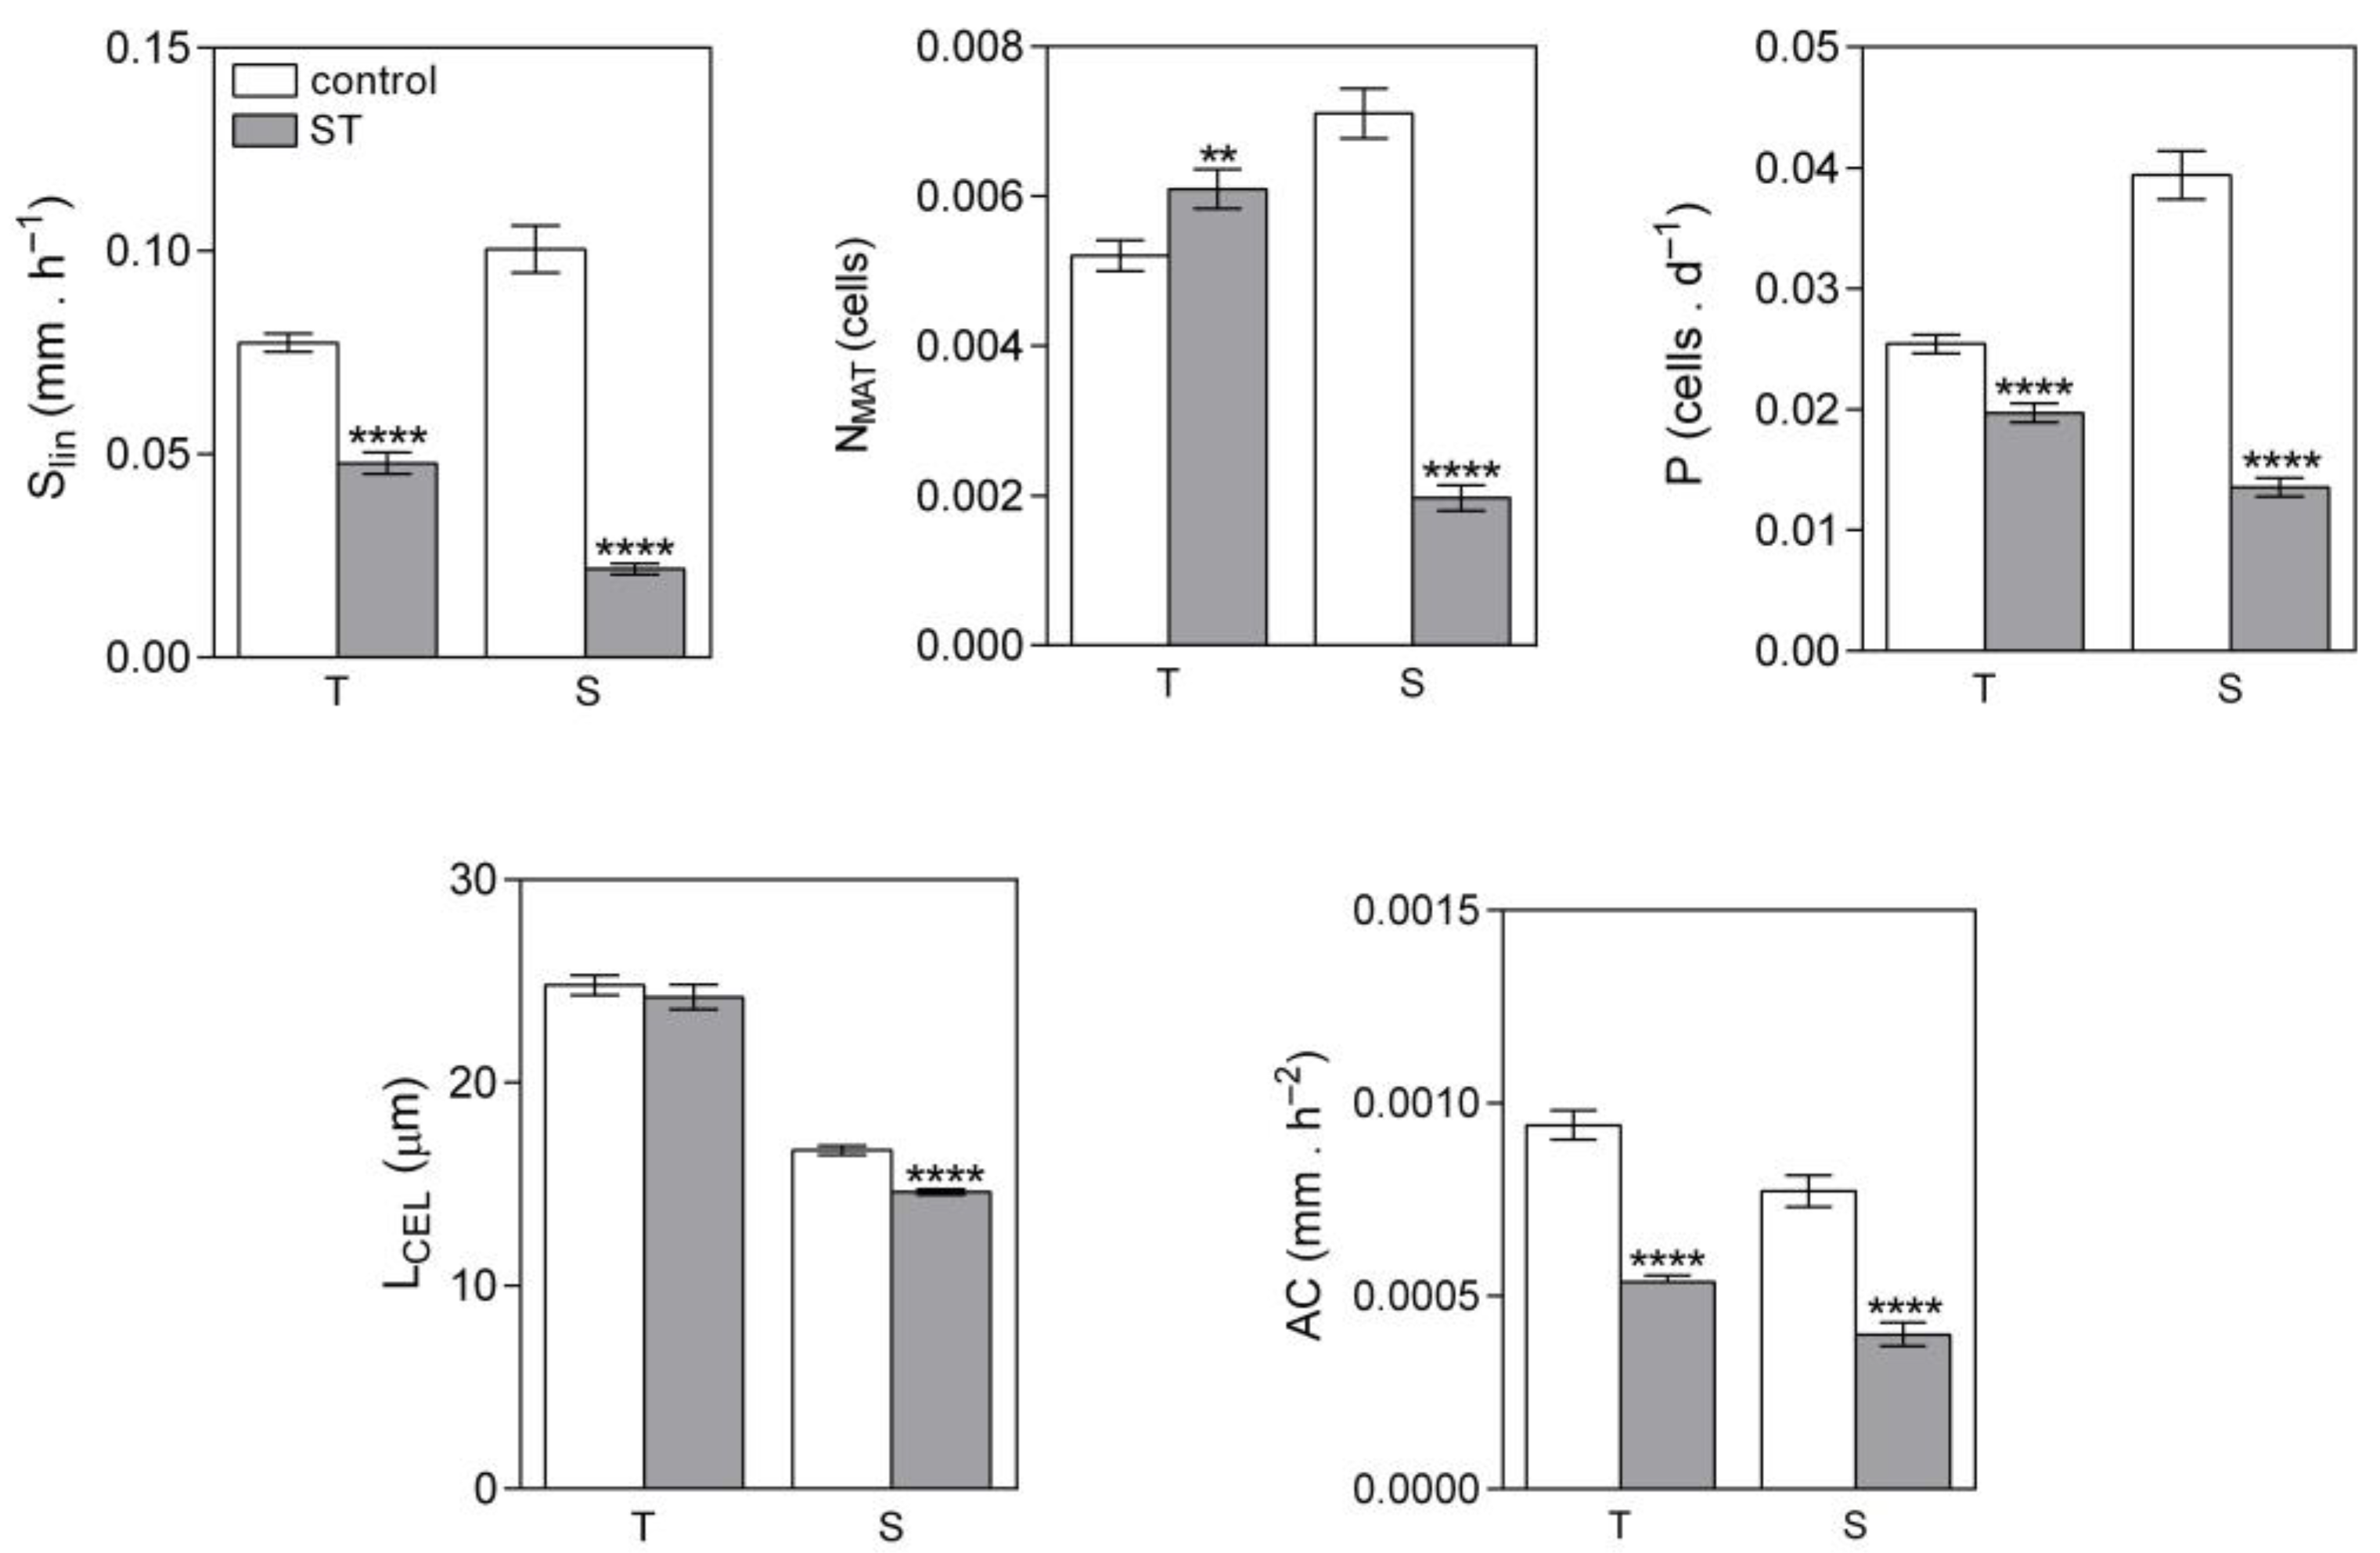
All z-score values of the parameters, except for LCEL (length of the mature cell), were negative in the tolerant genotypes. On the other hand, the parameters Slin (LER during the linear phase of leaf growth), P (cell production rate in the meristem), and NMAT (number of mature cells at the end of the linear elongation phase) showed differences between contrasting groups. In contrast, the parameters LCEL (length of the mature cell) and AC (average curvature) did not show differences between groups. Both groups showed negative z-score values for Slin and P; however, these parameters were approximately 1.5- and 1-fold more negative, respectively, in sensitive genotypes compared with tolerant ones. Finally, the most relevant parameter was NMAT, which, due to the effect of ST stress, exhibited a marked reduction in sensitive genotypes, in contrast to its increase under the same treatment in tolerant genotypes. Finally, the results of the non-standardized early leaf and cellular elongation dynamics parameters (Figure 4) also showed distributionpatterns among groups consistent with the results of the same parameters standardized by z-score as previously described.

4. Discussion

Plant physiologists refer to temperatures below 0 °C as freezing, temperatures from 0 °C to the minimum required for growth as chilling, and ST as the temperatures between this minimum and the optimum for growth [49]. The first two, more extreme cold conditions inhibit growth and photosynthetic processes in grasses. In contrast, ST stress represents a sublethal condition that limits growth relative to the optimum without stopping its progress [14,16]. Moreover, it markedly alters overall plant metabolism, particularly photosynthetic processes [5,21]. The analysis of the study of PIABS and leaf elongation parameters also reproduced this behavior. However, the overall results showed differential responses depending on the type of parameter and on contrasting grass groups in terms of ST tolerance. The differential responses among parameter types were attributed to the moderate intensity of ST stress compared with the more severe cold stresses characteristic of temperate climates. Consequently, the ability of different parameters to discriminate among contrasting genotypes under ST stress largely depends on the magnitude of their response to a moderate, prolonged stress. Leaf elongation parameters exhibited high discriminatory capacity, as reflected by their association with differences between contrasting groups, although some of these differences may also reflect inherent species-specific traits rather than solely ST tolerance. This may be attributed to the fact that some growth parameters integrate physiological effects cumulatively over time, thereby amplifying differences between contrasting genotypes [50].
The photosynthetic parameter PIABS exhibited a lower discriminatory capacity under ST stress in comparison with AUC, represented by a smaller proportion of the total multivariate variation and a reduced ability to separate contrasting groups, in contrast to leaf elongation parameters. However, a comprehensive analysis of the study of PIABS components, together with other photosynthetic parameters, revealed significant findings that are consistent with potential mechanisms of ST tolerance in grasses in relation to the photosynthetic apparatus. The analysis of the study of the structural and functional parameters of the photosynthetic apparatus indicated that structurally, both groups of genotypes responded in a similar manner. This was inferred through the moderate and similar decrease in γRC in both groups, which indicated a reduction in the number of RCs (active reaction centers), an effect reported in multiple grasses [7,51,52]. The increase in ABS/RC is a common consequence under stress conditions, as the functional reaction centers receive more energy from the antennas associated with inactive reaction centers [53]. This phenomenon was also observed in both groups of genotypes at moderate levels, as suggested by the increase in ABS/RC. However, from a functional point of view, the RCs of both groups of genotypes showed contrasts in terms of photochemical efficiency. This was inferred from a smaller decrease in FV/FM in the tolerant genotypes compared to the sensitive ones, an effect reported in different tolerant [5] and highly ST-tolerant grasses [54,55]. This indicated that the RCs were more efficient in the tolerant genotype group in terms of their ability to convert photons into useful chemical energy, Consequently, the lower amount of energy converted in the sensitive genotypes was consistent with the increased energy dissipation by the RCs, as indicated by DI0/RC. The phenomenon of increased energy dissipation has been reported in all plants, but is particularly pronounced in stress-sensitive species, serving as a mechanism to prevent photooxidative damage in PSII [56]. In turn, this pattern of photochemical energy in both groups of genotypes is consistent with the pattern of energetic connectivity between PSII units indicated by the parameter p. Cold has been reported to decrease the energetic connectivity between PSII [57,58]. This suggested a possible mechanism of tolerance to ST stress, in which tolerant genotypes respond by generating a greater functional interconnection between RCs, which would facilitate the redistribution of absorbed excitation energy and reduce the probability of local overexcitation. In contrast, sensitive genotypes, with values of p close to or below zero, would show a lower capacity for energy buffering, favoring the accumulation of excitation in individual centers and, consequently, a greater activation of dissipative processes.
Ref. [59] point out that leaf elongation results from the precise coordination between cell division and cell expansion, two fundamental phases of leaf growth that are modulated by genetic and environmental factors. In this context, AUC allows the integration of early, transient and late stress effects that are not always reflected in static parameters such as final leaf length [60]. This may explain why AUC behaved as a strong integrative indicator of growth performance under ST among grass groups contrasting in tolerance, rather than directly reflecting tolerance mechanisms. Moreover, AUC has already been used by other authors as a parameter with high potential to discriminate between genotypes contrasting in ST tolerance for breeding purposes aimed at increasing yield [8]. In this regard, the application of AUC as a breeding indicator could be limited by the time required for its determination under ST, typically taking several weeks, for the leaves of tolerant genotypes to reach full elongation. However, a very close relationship between AUC and the earliest stages of leaf elongation under ST was confirmed. This indicates that parameters of these early stages provide preliminary estimates of final growth performance rather than acting as independent determinants of ST tolerance, and could therefore be used as an indirect tool in breeding programs. The earliest stages, such as the linear elongation phase, are closely linked to meristematic activity and cell expansion, which are key mechanisms determining plant organ size, including leaves [61]. From a biological perspective, the differences observed at these stages likely reflect differences in cellular dynamics among contrasting genotypes under ST, since variation in cell division and expansion parameters explains the differential growth response of genotypes with contrasting stress tolerance [30,62].
Lastly, the analysis of early foliar elongation parameters indicated that ST stress induced a general restriction of leaf growth in both groups of genotypes, although with contrasting responses in the underlying cellular dynamics. This restriction was evidenced by the decrease in the leaf elongation rate during the linear phase (Slin) and in the rate of cell production in the meristem (P) in both tolerant and sensitive genotypes, indicating that ST directly affects meristematic activity regardless of the level of tolerance. However, the magnitude of this reduction was greater in the sensitive genotypes, suggesting a greater potential penalization of cell supply from the meristem under ST. In this context, what allowed a clearer discrimination between groups was the differential response associated with the number of mature cells described by NMAT. While sensitive genotypes showed a marked reduction in NMAT under ST, tolerant genotypes exhibited an increase in this parameter under the same treatment. Given that the length of mature cells did not show differences between groups, the increase in NMAT observed in tolerant genotypes cannot be attributed to greater final cell expansion. Instead, these results may reflect that, despite a reduction in the rate of cell production, tolerant genotypes have a greater capacity to sustain or integrate the process of cellular accumulation during early foliar elongation, rather than demonstrating it directly. This response suggests a mechanism of adjustment in the temporal dynamics of growth in tolerant genotypes, which allows a greater number of cells to complete their transit toward maturation under ST conditions. This mechanism is supported by the results of a kinematic analysis conducted in rice genotypes with differential tolerance to an ST stress condition less severe than that used in the present study [45]. In that analysis, a slightly smaller reduction in P was also reported in tolerant genotypes compared with sensitive ones under ST. However, tolerant genotypes accumulated a greater number of cells in the cell expansion zone, with no differences in the cell transition time within this zone (T) between contrasting genotypes. In line with this, and considering the expression of cell flux (F) proposed by [63], F = N · T−1, the results of that kinematic study also allow explaining a greater number of mature cells as a result of a higher cell flux from the cell expansion zone in tolerant genotypes.

5. Conclusions

ST stress induced a general restriction of growth without stopping its progress and photosynthetic activity in grasses. However, the magnitude and nature of these responses depended on both the evaluated parameter and the level of genotypic tolerance, and may also be influenced by inherent species-level characteristics. In addition, structural differences in thylakoid organization and in the composition of antenna complexes between C3 and C4 species may intrinsically influence parameters such as PIABS and PSII energetic connectivity. Therefore, part of the variation observed in these parameters could reflect fundamental differences in photosynthetic architecture rather than exclusively mechanisms of tolerance to ST. The experimental design of the present study was not conceived to fully separate these effects. Further comparative studies, ideally conducted within the same species or among phylogenetically closer taxa, will be required to disentangle inherent structural differences from specific ST tolerance mechanisms. Leaf elongation parameters, particularly AUC, showed a strong ability to discriminate between tolerant and sensitive genotypes, which is consistent with an integration of cumulative physiological effects over time. Although PIABS exhibited a lower discriminatory capacity under ST, in comparison with AUC, the analysis of its components revealed key functional differences in the photosynthetic apparatus. Tolerant genotypes maintained higher photochemical efficiency and greater energetic connectivity among PSII reaction centers, which is consistent with a potential capacity to redistribute excitation energy and limit photooxidative damage under ST conditions. At the growth level, ST reduced meristematic activity in all genotypes, but Tolerant genotypes showed a smaller reduction in cell production and a greater accumulation of mature cells during early leaf elongation. This pattern is consistent with adjustments in the temporal dynamics of cell accumulation, which may allow a greater number of cells to complete maturation under stress. Together, these results suggest that ST tolerance in grasses may involve coordinated adjustments in photosynthetic efficiency and cellular growth dynamics. The observed patterns could suggest that differences in photochemical efficiency and in the energetic connectivity among PSII reaction centers could influence the capacity of genotypes to maintain the accumulation of mature cells and leaf elongation under ST. In this sense, genotypes that maintain higher photosynthetic efficiency could have a greater availability of energy to support critical cellular processes, such as cell production and maturation, which would be consistent with a lower restriction of growth. In contrast, genotypes with lower efficiency could experience an energy limitation that would contribute to the reduction in cell accumulation and leaf elongation. Importantly, our observations suggest that under ST conditions, photosynthetic adjustments primarily act as a protective mechanism to maintain cellular homeostasis, rather than serving as the main limiting factor for growth. Nevertheless, in specific genotypes, reductions in photosynthetic efficiency can directly constrain carbon assimilation and thereby limit growth, indicating that the impact of photosynthesis on growth is context-dependent. These results highlight a nuanced relationship in which photosynthetic capacity may act as a limiting factor in some cases, while in others it represents a parallel physiological response to stress. These inferences could indicate that ST tolerance would involve coordinated adjustments between the capacity for energy conversion and the temporal dynamics of cellular growth. Finally, in the following paragraph we summarize some considerations for the present work. First, it should be considered that the results can only be reproduced under the indicated controlled environmental conditions. Second, both groups of genotypes, tolerant and sensitive to ST, included different species. Therefore, part of the observed variation could reflect inherent physiological and developmental differences between species, in addition to mechanisms of ST tolerance, which limits the generalization of the results to all grass species. Furthermore, it should be noted that these mechanisms might be unique to the Poaceae family; consequently, any extension of these findings to species with distinct structural growth patterns warrants careful consideration. Despite these issues, the results provide useful information on possible mechanisms and traits relevant for ST tolerance.

Author Contributions

All authors have contributed to the preparation of this manuscript as follows: Ms design and conception: A.A.R.; data collection: M.C.M., S.J.M., B.W. and A.A.R.; analysis, interpretation, and discussion of results: M.C.M. and A.A.R.; draft manuscript preparation: S.J.M. and A.A.R. All authors have read and agreed to the published version of the manuscript.

Funding

This research was supported by the Agencia Nacional de Promocion de Ciencia y Tecnologia (Grant: PICT 2019-02779) and by the Universidad Nacional de San Martin (Grant: UNSAM Investiga 2025-80020250100068SM).

Data Availability Statement

The original contributions presented in this study are included in the article. Further inquiries can be directed to the corresponding author.

Conflicts of Interest

The authors declare that there are no financial interests or personal relationships that have influenced the results and opinions included in this manuscript.

Abbreviations

The following abbreviations are used in this manuscript:
ABS/RCApparent antenna size of RC-PSII
ACAverage curvature
AUCArea under the curve
FV/FMEfficiency of photochemistry
LERLeaf elongation rate
LCELLength of the mature cell
LMAXMaximum final leaf length
STSuboptimal temperatures
NMATNumber of mature cells accumulated at the end of the linear elongation phase
pConnectivity between PSII units
PCell production rate in the meristem
PSIIPhotosystem II
PIABSPerformance index of photosystem II
RCActive reaction center
SlinLER during the linear phase of leaf growth
LERDuring the linear phase of leaf growth
TMAXTime when the leaf reached LMAX
γRCFraction of RC-PSII
ΨE0Efficiency of electron transport

References

  1. Hartley, W. Studies on the origin, evolution, and distribution of the Gramineae. V. The subfamily Festucoideae. Aust. J. Bot. 1973, 21, 201–234. [Google Scholar] [CrossRef]
  2. Edwards, E.J.; Smith, S.A. Phylogenetic analyses reveal the shady history of C4 grasses. Proc. Natl. Acad. Sci. USA 2010, 107, 2532–2537. [Google Scholar] [CrossRef] [PubMed]
  3. Vigeland, M.D.; Spannagl, M.; Asp, T.; Paina, C.; Rudi, H.; Rognli, O.A.; Fjellheim, S.; Sandve, S.R. Evidence for adaptive evolution of low-temperature stress response genes in a Pooideae grass ancestor. New Phytol. 2013, 199, 1060–1068. [Google Scholar] [CrossRef]
  4. Manetti Filho, J.; de Oliveira, C.M.G.; Caramori, P.H.; Nagashima, G.T.; Hernandez, F.B.T. Cold tolerance of forage plant species. Semin. Ciênc. Agrár. 2018, 39, 1469–1476. [Google Scholar] [CrossRef]
  5. Vilas, J.M.; Corigliano, M.G.; Clemente, M.; Maiale, S.J.; Rodríguez, A.A. Close relationship between the state of the oxygen evolving complex and rice cold stress tolerance. Plant Sci. 2020, 296, 110488. [Google Scholar] [CrossRef] [PubMed]
  6. Allen, D.J.; Ort, D.R. Impacts of chilling temperatures on photosynthesis in warm-climate plants. Trends Plant Sci. 2001, 6, 36–42. [Google Scholar] [CrossRef] [PubMed]
  7. Mazeed, A.; Ansari, M.I. Enzymatic and nonenzymatic antioxidant defense in plants under cold or chilling stress. In Role of Antioxidants in Mitigating Plant Stress, 1st ed.; Husen, A., Ed.; Academic Press: Cambridge, MA, USA, 2025; pp. 145–165. [Google Scholar] [CrossRef]
  8. Michelini, M.C.; Gazquez, A.; Checovich, M.L.; Tamayo, A.S.; Maiale, S.J.; Menéndez, A.B.; Rodríguez, A.A. Determination of low-temperature stress during the vegetative stage as a tool to predict plant yield in rice genotypes with contrasting tolerance levels. J. Agron. Crop Sci. 2024, 210, e12670. [Google Scholar] [CrossRef]
  9. Shimono, H.; Ishii, A.; Kanda, E.; Suto, M.; Nagano, M. Genotypic variation in rice cold tolerance responses during reproductive growth as a function of water temperature during vegetative growth. Crop Sci. 2011, 51, 290–297. [Google Scholar] [CrossRef]
  10. Hüner, N.P.A.; Ivanov, A.G.; Szyszka-Mroz, B.; Savitch, L.V.; Smith, D.R.; Kata, V. Photostasis and photosynthetic adaptation to polar life. Photosynth. Res. 2024, 161, 51–64. [Google Scholar] [CrossRef]
  11. Ensminger, I.; Busch, F.; Huner, N.P. Photostasis and cold acclimation: Sensing low temperature through photosynthesis. Physiol. Plant. 2006, 126, 28–44. [Google Scholar] [CrossRef]
  12. Huner, N.P.; Öquist, G.; Melis, A. Photostasis in plants, green algae and cyanobacteria: The role of light harvesting antenna complexes. In Light-Harvesting Antennas in Photosynthesis; Green, B., Parson, W.W., Eds.; Springer Science & Business Media: Dordrecht, The Netherlands, 2003; pp. 401–421. [Google Scholar] [CrossRef]
  13. Öquist, G.; Huner, N.P. Photosynthesis of overwintering evergreen plants. Annu. Rev. Plant Biol. 2003, 54, 329–355. [Google Scholar] [CrossRef]
  14. Nagelmüller, S.; Kirchgessner, N.; Yates, S.; Hiltpold, M.; Walter, A. Leaf Length Tracker: A novel approach to analyse leaf elongation close to the thermal limit of growth in the field. J. Exp. Bot. 2016, 67, 1897–1906. [Google Scholar] [CrossRef] [PubMed]
  15. Yu, M.; Luobu, Z.; Zhuoga, D.; Wei, X.; Tang, Y. Physiological and broadly targeted metabolomic analyses of barley (Hordeum vulgare L.) in response to low-temperature stress. BMC Genom. 2025, 26, 618. [Google Scholar] [CrossRef] [PubMed]
  16. Gazquez, A.; Maiale, S.J.; Rachoski, M.M.; Vidal, A.; Ruiz, O.; Menéndez, A.B.; Rodríguez, A.A. Physiological response of multiple contrasting rice (Oryza sativa L.) cultivars to suboptimal temperatures. J. Agron. Crop Sci. 2015, 201, 117–127. [Google Scholar] [CrossRef]
  17. Sánchez, E.; Gil, S.; Azcón-Bieto, J.; Nogués, S. The response of Arundo donax L. (C3) and Panicum virgatum (C4) to different stresses. Biomass Bioenergy 2016, 85, 335–345. [Google Scholar] [CrossRef]
  18. Gazquez, A.; Vilas, J.M.; Lerner, J.E.C.; Maiale, S.J.; Calzadilla, P.I.; Menéndez, A.B.; Rodríguez, A.A. Rice tolerance to suboptimal low temperatures relies on the maintenance of the photosynthetic capacity. Plant Physiol. Biochem. 2018, 127, 537–552. [Google Scholar] [CrossRef] [PubMed]
  19. Sadura, I.; Janeczko, A. Brassinosteroids and the tolerance of cereals to low and high temperature stress: Photosynthesis and the physicochemical properties of cell membranes. Int. J. Mol. Sci. 2021, 23, 342. [Google Scholar] [CrossRef]
  20. Li, Y.T.; Li, Y.N.; Zhang, Q.; Yang, C.; Xu, Y.N.; Zhao, S.J.; Qi, X.-L.; Li, X.-D.; Zhang, Z.S. Photosynthetic acclimation of wheat (Triticum aestivum) to winter. Plant Physiol. 2025, 199, kiaf260. [Google Scholar] [CrossRef]
  21. Głowacka, K.; Adhikari, S.; Peng, J.; Gifford, J.; Juvik, J.A.; Long, S.P.; Sacks, E.J. Variation in chilling tolerance for photosynthesis and leaf extension growth among genotypes related to the C4 grass Miscanthus × giganteus. J. Exp. Bot. 2014, 65, 5267–5278. [Google Scholar] [CrossRef] [PubMed]
  22. Purdy, S.J.; Maddison, A.L.; Jones, L.E.; Webster, R.J.; Andralojc, J.; Donnison, I.; Clifton-Brown, J. Characterization of chilling-shock responses in four genotypes of Miscanthus reveals the superior tolerance of M. × giganteus compared with M. sinensis and M. sacchariflorus. Ann. Bot. 2013, 111, 999–1013. [Google Scholar] [CrossRef] [PubMed]
  23. Fonteyne, S.; Lootens, P.; Muylle, H.; Van den Ende, W.; De Swaef, T.; Reheul, D.; Roldán-Ruiz, I. Chilling tolerance and early vigour-related characteristics evaluated in two Miscanthus genotypes. Photosynthetica 2016, 54, 295–306. [Google Scholar] [CrossRef]
  24. Dalmannsdottir, S.; Jørgensen, M.; Rapacz, M.; Østrem, L.; Larsen, A.; Rødven, R.; Rognli, O.A. Cold acclimation in warmer extended autumns impairs freezing tolerance of perennial ryegrass (Lolium perenne) and timothy (Phleum pratense). Physiol. Plant. 2017, 160, 266–281. [Google Scholar] [CrossRef]
  25. Hakala, K.; Pahkala, K. Comparison of central and northern European winter rye cultivars grown at high latitudes. J. Agric. Sci. 2003, 141, 169–178. [Google Scholar] [CrossRef]
  26. Rapacz, M. Chlorophyll a fluorescence transient during freezing and recovery in winter wheat. Photosynthetica 2007, 45, 409–418. [Google Scholar] [CrossRef]
  27. Rodríguez, A.A.; Vilas, J.M.; Sartore, G.D.; Bezus, R.; Colazo, J.; Maiale, S.J. Field and genetic evidence support the photosynthetic performance index (PIABS) as an indicator of rice grain yield. Plant Physiol. Biochem. 2023, 201, 107897. [Google Scholar] [CrossRef]
  28. Zhou, Q.P.; Gou, X.L.; Tian, L.H.; Chen, Y.; Gao, S.; Bai, W.; Zhang, W. Performances of early and late maturing oat varieties in cold regions. Chin. Sci. Bull. 2018, 63, 1722–1730. [Google Scholar] [CrossRef][Green Version]
  29. Guo, Z.; Wang, H.; Yao, J.; Cheng, Y.; Zhang, W.; Xu, Z.; Li, M.; Huang, J.; Zhao, M. Quantitative trait loci mapping analysis for cold tolerance under cold stress and brassinosteroid-combined cold treatment at germination and bud burst stages in rice. Front. Plant Sci. 2022, 13, 938339. [Google Scholar] [CrossRef] [PubMed]
  30. Gazquez, A.; Beemster, G.T. What determines organ size differences between species? A meta-analysis of the cellular basis. New Phytol. 2017, 215, 299–308. [Google Scholar] [CrossRef]
  31. Sowiński, P.; Wieliczko-Manowska, K.; Grzybowski, M.; Jończyk, M.; Sowiński, J.; Sobkowiak, A.; Kowalec, P.; Rogacki, J. Diverse coping modes of maize in cool environment at early growth. BMC Plant Biol. 2025, 25, 191. [Google Scholar] [CrossRef]
  32. Liu, Q.; Zhang, X.; Su, Y.H.; Zhang, X.S. Genetic mechanisms of cold signaling in wheat (Triticum aestivum L.). Life 2022, 12, 700. [Google Scholar] [CrossRef] [PubMed]
  33. Izadi-Darbandi, E.; Hasanfard, A. Higher tolerance to freezing stress may accelerate the distribution and invasion of wild barley (Hordeum spontaneum Koch) and feral rye (Secale cereale L.). Adv. Weed Sci. 2025, 43, e020252069. [Google Scholar] [CrossRef]
  34. Webb, M.S.; Uemura, M.; Steponkus, P.L. A comparison of freezing injury in oat and rye: Two cereals at the extremes of freezing tolerance. Plant Physiol. 1994, 104, 467–478. [Google Scholar] [CrossRef] [PubMed]
  35. Liu, C.T.; Wang, W.; Mao, B.G.; Chu, C. Cold stress tolerance in rice: Physiological changes, molecular mechanism, and future prospects. Hereditas 2018, 40, 171–185. [Google Scholar] [CrossRef]
  36. Vera Hernández, P.F.; Mendoza Onofre, L.E.; Rosas Cárdenas, F.D.F. Responses of sorghum to cold stress: A review focused on molecular breeding. Front. Plant Sci. 2023, 14, 1124335. [Google Scholar] [CrossRef] [PubMed]
  37. Ivory, D.A.; Whiteman, P.C. Effect of temperature on growth of five subtropical grasses. I. Effect of day and night temperature on growth and morphological development. Aust. J. Plant Physiol. 1978, 5, 131–148. [Google Scholar] [CrossRef]
  38. Imaz, J.A.; Merani, V.; Santos, D.D.; Benvenutti, M.; Giménez, D.O.; Hernández, O.; Arroquy, J.I. Effects of deferred forage as winter cover on spring growth of the tropical grasses Chloris gayana and Panicum coloratum. Trop. Grassl.–Forrajes Trop. 2017, 5, 29–39. [Google Scholar] [CrossRef]
  39. van Campen, J.C.; Yaapar, M.N.; Narawatthana, S.; Lehmeier, C.; Wanchana, S.; Thakur, V.; Chater, C.; Kelly, S.; Rolfe, S.A.; Quick, W.P.; et al. Combined chlorophyll fluorescence and transcriptomic analysis identifies the P3/P4 transition as a key stage in rice leaf photosynthetic development. Plant Physiol. 2016, 170, 1655–1674. [Google Scholar] [CrossRef]
  40. Soltani, E.; Maleki, K.; Colbach, N.; Gardarin, A.; Lamichhane, J.R. Variations in heterotrophic seedling growth parameters of 28 plant species and their relationships with seed traits. Environ. Exp. Bot. 2025, 236, 106170. [Google Scholar] [CrossRef]
  41. Cooper, C.S.; MacDonald, P.W. Energetics of early seedling growth in corn (Zea mays L.). Crop Sci. 1970, 10, 136–139. [Google Scholar] [CrossRef]
  42. Deleens, E.; Gregory, N.; Bourdu, R. Transition between seed reserve use and photosynthetic supply during development of maize seedlings. Plant Sci. Lett. 1984, 37, 35–39. [Google Scholar] [CrossRef]
  43. Yoshida, S. Fundamentals of Rice Crop Science, 1st ed.; International Rice Research Institute: Manila, Philippines, 1981; 269p. [Google Scholar]
  44. Strasser, R.J.; Stirbet, A.D. Estimation of the energetic connectivity of PS II centres in plants using the fluorescence rise O-J-I-P: Fitting of experimental data to three different PS II models. Math. Comput. Simul. 2001, 56, 451–462. [Google Scholar] [CrossRef]
  45. Gazquez, A.; AbdElgawad, H.; Baggerman, G.; Van Raemdonck, G.; Asard, H.; Maiale, S.J.; Rodríguez, A.A.; Beemster, G.T.S. Redox homeostasis in the rice leaf growth zone plays a key role in cold tolerance. J. Exp. Bot. 2020, 71, 1053–1066. [Google Scholar] [CrossRef] [PubMed]
  46. Luo, L.; Zhou, W.Q.; Liu, P.; Li, C.X.; Hou, S.W. The development of stomata and other epidermal cells on the rice leaves. Biol. Plant. 2012, 56, 521–527. [Google Scholar] [CrossRef]
  47. Toponogov, V.A. Differential Geometry of Curves and Surfaces, 1st ed.; Birkhũser: Basel, Switzerland, 2006; 206p. [Google Scholar] [CrossRef]
  48. Cohen, J. Statistical Power Analysis for the Behavioral Sciences, 2nd ed.; Lawrence Erlbaum Associates: New York, NY, USA, 1988; 567p. [Google Scholar] [CrossRef]
  49. Menéndez, A.B.; Rodríguez, A.A.; Maiale, S.J.; Rodríguez Kessler, M.; Jimenez Bremont, J.F.; Ruiz, O.A. Polyamines contribution to the improvement of crop plants tolerance to abiotic stress. In Crop Improvement Under Adverse Conditions, 1st ed.; Tuteja, N., Gill, S., Eds.; Springer: New York, NY, USA, 2013; pp. 113–136. [Google Scholar]
  50. Körner, C. Paradigm shift in plant growth control. Curr. Opin. Plant Biol. 2015, 25, 107–114. [Google Scholar] [CrossRef] [PubMed]
  51. Fan, J.; Hu, Z.; Xie, Y.; Chan, Z.; Chen, K.; Amombo, E.; Chen, L.; Fu, J. Alleviation of cold damage to photosystem II and metabolisms by melatoninin bermudagrass. Front. Plant Sci. 2015, 6, 925. [Google Scholar] [CrossRef]
  52. Gururani, M.A.; Venkatesh, J.; Ganesan, M.; Strasser, R.J.; Han, Y.; Kim, J.I.; Lee, H.Y.; Song, P.S. In vivo assessment of cold tolerance through chlorophyll-a fluorescence in transgenic zoysiagrass expressing mutant phytochrome A. PLoS ONE 2015, 10, e0127200. [Google Scholar] [CrossRef] [PubMed]
  53. Strasser, R.J.; Srivastava, A.; Tsimilli-Michael, M. The fluorescence transient as a tool to characterize and screen photosynthetic samples. In Probing Photosynthesis: Mechanisms, Regulation and Adaptation, 1st ed.; Yunus, M., Pathre, U., Mohanty, P., Eds.; CRC Press: London, UK, 2000; pp. 445–483. [Google Scholar]
  54. Głowacka, K.; Jørgensen, U.; Kjeldsen, J.B.; Kørup, K.; Spitz, I.; Sacks, E.J.; Long, S.P. Can the exceptional chilling tolerance of C4 photosynthesis found in Miscanthus × giganteus be exceeded? Screening of a novel Miscanthus Japanese germplasm collection. Ann. Bot. 2015, 115, 981–990. [Google Scholar] [CrossRef]
  55. Jiao, X.; Kørup, K.; Andersen, M.N.; Sacks, E.J.; Zhu, X.G.; Lærke, P.E.; Jørgensen, U. Can miscanthus C4 photosynthesis compete with festulolium C3 photosynthesis in a temperate climate? GCB Bioenergy 2017, 9, 18–30. [Google Scholar] [CrossRef]
  56. Tsimilli-Michael, M. Revisiting JIP-test: An educative review on concepts, assumptions, approximations, definitions and terminology. Photosynthetica 2020, 58, 275–292. [Google Scholar] [CrossRef]
  57. Marečková, M.; Barták, M.; Hájek, J. Temperature effects on photosynthetic performance of Antarctic lichen Dermatocarpon polyphyllizum: A chlorophyll fluorescence study. Polar Biol. 2019, 42, 685–701. [Google Scholar] [CrossRef]
  58. Wu, P.; Ma, Y.; Ahammed, G.J.; Hao, B.; Chen, J.; Wan, W.; Zhao, Y.; Cui, H.; Xu, W.; Cui, J.; et al. Insights into melatonin-induced photosynthetic electron transport under low-temperature stress in cucumber. Front. Plant Sci. 2022, 13, 1029854. [Google Scholar] [CrossRef]
  59. Kalve, S.; De Vos, D.; Beemster, G.T. Leaf development: A cellular perspective. Front. Plant Sci. 2014, 5, 362. [Google Scholar] [CrossRef] [PubMed]
  60. Fournier, C.; Durand, J.L.; Ljutovac, S.; Schäufele, R.; Gastal, F.; Andrieu, B. A functional–structural model of elongation of the grass leaf and its relationships with the phyllochron. New Phytol. 2005, 166, 881–894. [Google Scholar] [CrossRef] [PubMed]
  61. Powell, A.E.; Lenhard, M. Control of organ size in plants. Curr. Biol. 2012, 22, R360–R367. [Google Scholar] [CrossRef]
  62. Avramova, V.; AbdElgawad, H.; Vasileva, I.; Petrova, A.S.; Holek, A.; Mariën, J.; Asard, H.; Beemster, G.T. High antioxidant activity facilitates maintenance of cell division in leaves of drought tolerant maize hybrids. Front. Plant Sci. 2017, 8, 84. [Google Scholar] [CrossRef] [PubMed]
  63. Sprangers, K.; Thys, S.; Van Dusschoten, D.; Beemster, G.T. Gibberellin enhances the anisotropy of cell expansion in the growth zone of the maize leaf. Front. Plant Sci. 2020, 11, 1163. [Google Scholar] [CrossRef]
Figure 1. Multivariate and univariate analyses of PIABS and leaf elongation parameters. T, tolerant genotype group; S, sensitive genotype group. (A) Principal component analysis using PIABS and leaf elongation parameters. (B) Bars represent means ± S.E and the X in XZ-SCORE represents each of the parameters. (C) Calculation of Cohen’s d statistic using only the parameters that showed significant differences in (A). (D,E) Principal component analysis and XZ-SCORE, respectively, of PIABS components and other OJIP parameters. (F) Analysis of the connectivity between PSII units (p). Asterisks in (B,E,F) indicate significant differences between tolerant and sensitive genotype groups (Student’s t-test, two samples; **, ***, and **** represent p < 0.01, p < 0.001, and p < 0.0001, respectively).
Grasses 05 00014 g001
Figure 2. Analysis of the relationship between the AUC and partial characteristics of the leaf elongation pattern under ST. T, tolerant genotype group; S, sensitive genotype group. (A) Linear regression analysis between AUCZ-SCORE with AUCST at TMAX (p < 0.0001); R2, coefficient of determination. (B) Graph of the progression of AUC fitting and the partial characteristics from different sets (N) of XY pairs (for all cases, p < 0.0001); The inset represents the relevance of each early-curve feature for the fit. (C) Average leaf elongation patterns of tolerant and sensitive grass groups. Points represent mean values, and the shaded areas bounded by the continuous lines indicate the confidence limits for each group.
Grasses 05 00014 g002
Figure 3. XZ-SCORE of foliar and cellular parameters associated with early leaf elongation dynamics. Bars represent means ± S.E. The X in XZ-SCORE represents each of the parameters. Asterisks represent significant differences between tolerant (T) and sensitive (S) grass groups (Student’s t-test, two samples; **** represents p < 0.0001).
Grasses 05 00014 g003
Figure 4. Foliar and cellular parameters associated with early leaf elongation dynamics. Bars represent means ± S.E. Asterisks represent significant differences between control an ST stress treatments for tolerant (T) and sensitive (S) grass groups (Student’s t-test, two samples; ** and **** represent p < 0.01 and p < 0.0001, respectively).
Grasses 05 00014 g004
Disclaimer/Publisher’s Note: The statements, opinions and data contained in all publications are solely those of the individual author(s) and contributor(s) and not of MDPI and/or the editor(s). MDPI and/or the editor(s) disclaim responsibility for any injury to people or property resulting from any ideas, methods, instructions or products referred to in the content.