Article

Effect of Grazing Intensity and Frequency on Forage Accumulation and Agronomic Characteristics of Tropical Mixed Pastures

by
Bruna Zanini Uzan
1,
Luciana Gerdes
1,
Waldssimiler Teixeira de Mattos
1,
Taise Robinson Kunrath
2,
Stela Soares Zamboin
3,
Cristina Maria Pacheco Barbosa
1,
Gabriela Aferri
1 and
Flavia Maria de Andrade Gimenes
1,*
1
Instituto de Zootecnia (IZ), Nova Odessa 13380-011, SP, Brazil
2
Aliança SIPA, Porto Alegre 90150-101, RS, Brazil
3
Centro de Energia Nuclear na Agricultura (CENA/USP), Piracicaba 13416-000, SP, Brazil
*
Author to whom correspondence should be addressed.
Grasses 2026, 5(1), 15; https://doi.org/10.3390/grasses5010015
Submission received: 31 October 2025 / Revised: 5 March 2026 / Accepted: 9 March 2026 / Published: 20 March 2026

Abstract

This study evaluated combinations of defoliation frequencies and intensities to identify grazing strategies that optimize forage accumulation and morphological composition in mixed pastures of Marandu palisadegrass (Urochloa brizantha cv. Marandu) with the legume Macrotyloma axillare. Treatments consisted of pre-grazing heights of 30 and 40 cm (defining defoliation frequency) combined with post-grazing heights of 15 and 20 cm (defoliation intensity), in a 2 × 2 factorial randomized block design with four repetitions. Forage accumulation rate, morphological component mass, and leaf area index (LAI) were evaluated under rotational stocking. The highest forage accumulation rates of grass and its stems occurred at a pre-grazing height of 30 cm. A taller pre-grazing height (40 cm) resulted in greater pre-grazing forage mass, leaf and stem mass of Marandu palisadegrass and LAI, but it also increased the amount of dead material and post-grazing stem mass. The greatest Macrotyloma forage accumulation occurred under grazing strategies of 30–20 cm and 40–15 cm. Lenient defoliation (20 cm post-grazing height) favored post-grazing leaf mass, whereas severe defoliation (15 cm) favored stem mass. Marandu palisadegrass showed higher LAI at 40 cm pre-grazing height (4.7) than at 30 cm (3.6), with slightly greater values under 20 cm (4.3) than 15 cm (4.1) post-grazing height, while Macrotyloma axillare exhibited low LAI. Across all grazing strategies, the legume mass decreased over time. Therefore, future studies should explore alternative grazing strategies and periodic reseeding of Macrotyloma axillare to maintain its presence in mixed tropical pastures.

1. Introduction

The total pasture area in Brazil is approximately 167 million hectares, over 40% of which is classified as medium to highly degraded [1]. The main factors associated with this degradation are the excessive stocking rates and a lack of nutrient replenishment, particularly nitrogen [2]. Integrating forage legumes into tropical pasture systems has been proposed as a sustainable alternative to reduce the need for nitrogen fertilizer and improve soil fertility [3]. Through symbiosis with N2-fixing bacteria, legumes can contribute up to 150 kg N/ha year to the system [4]. In addition, they are a valuable source of protein for ruminants and enhance the overall nutritive value of the pasture.
Tropical pasture systems in Brazil are commonly established on highly weathered and acidic soils with naturally low fertility, where nutrient availability strongly influences pasture productivity and persistence. Under these conditions, the absence of nitrogen replenishment can accelerate pasture degradation and reduce forage productivity over time [2]. The inclusion of forage legumes has therefore been proposed to improve soil fertility and nitrogen cycling [3,4], although the success of grass–legume mixtures also depends on grazing management capable of maintaining adequate canopy structure and reducing competition between species with different growth habits [5,6].
Despite these benefits, managing mixed pastures of tropical grasses and legumes with different photosynthetic pathways (C4 grasses and C3 legumes) remains challenging due to differences in growth patterns, light interception, and competitive ability within the canopy [6,7]. Twining legume persistence in mixed tropical pastures is constrained by competition for light and sensitivity to grazing intensity and frequency, resulting in reduced regrowth and declining canopy contribution over time [3]. Therefore, identifying grazing management practices that favor the coexistence of grasses and legumes is crucial for the long-term sustainability of tropical livestock systems. Grazing management based on canopy height has proven to be an effective tool for regulating forage accumulation, light interception, and plant structure in tropical grasses [6]. However, the optimal height combinations for grass–legume mixtures remain unclear.
The legume Macrotyloma axillare (E. Mey. ex Verdc.) is considered a promising species for tropical pastures due to its capacity for nitrogen fixation, seed and dry matter production, resistance to pests and diseases, and greater persistence compared with other tropical legumes [8]. When cultivated in conjunction with grasses, it has shown significant potential, representing up to 42.2% of the forage mass in mixtures with Panicum maximum cv. Aruana [9]. Furthermore, Macrotyloma contains tannins in its composition, which may reduce methanogenic bacterial populations in the rumen, potentially contributing to lower methane emissions [10].
Urochloa brizantha (Hochst. ex A. Rich.) R.D. Webster cv. Marandu, commonly known as Marandu palisadegrass, is the most widely cultivated tropical forage grass in Brazil. Although it is highly productive and adaptable [11], most cultivated areas consist of grass monocultures, which are susceptible to degradation and nutrient imbalances. Research on Marandu-based mixed pastures with forage legumes, particularly those with a twining growth habit, such as Macrotyloma, exists [5,12]; however, it remains scarce.
The hypothesis is that combining defoliation frequency (pre-grazing height) and intensity (post-grazing height) alters the growth dynamics, morphological composition, and species balance in mixed pastures of Marandu palisadegrass (Urochloa brizantha cv. Marandu) with the legume Macrotyloma axillare. Specifically, different combinations of grazing frequency and intensity may modify canopy structure and resource availability within the sward, thereby affecting forage accumulation and the balance between grass and legume components. Therefore, the objective of this study was to evaluate how combinations of pre- and post-grazing canopy heights (grazing management strategies) affect forage accumulation rate, morphological composition, and leaf area index in mixed pastures of Marandu palisadegrass and the legume Macrotyloma axillare managed under rotational stocking.

2. Materials and Methods

2.1. Experimental Site

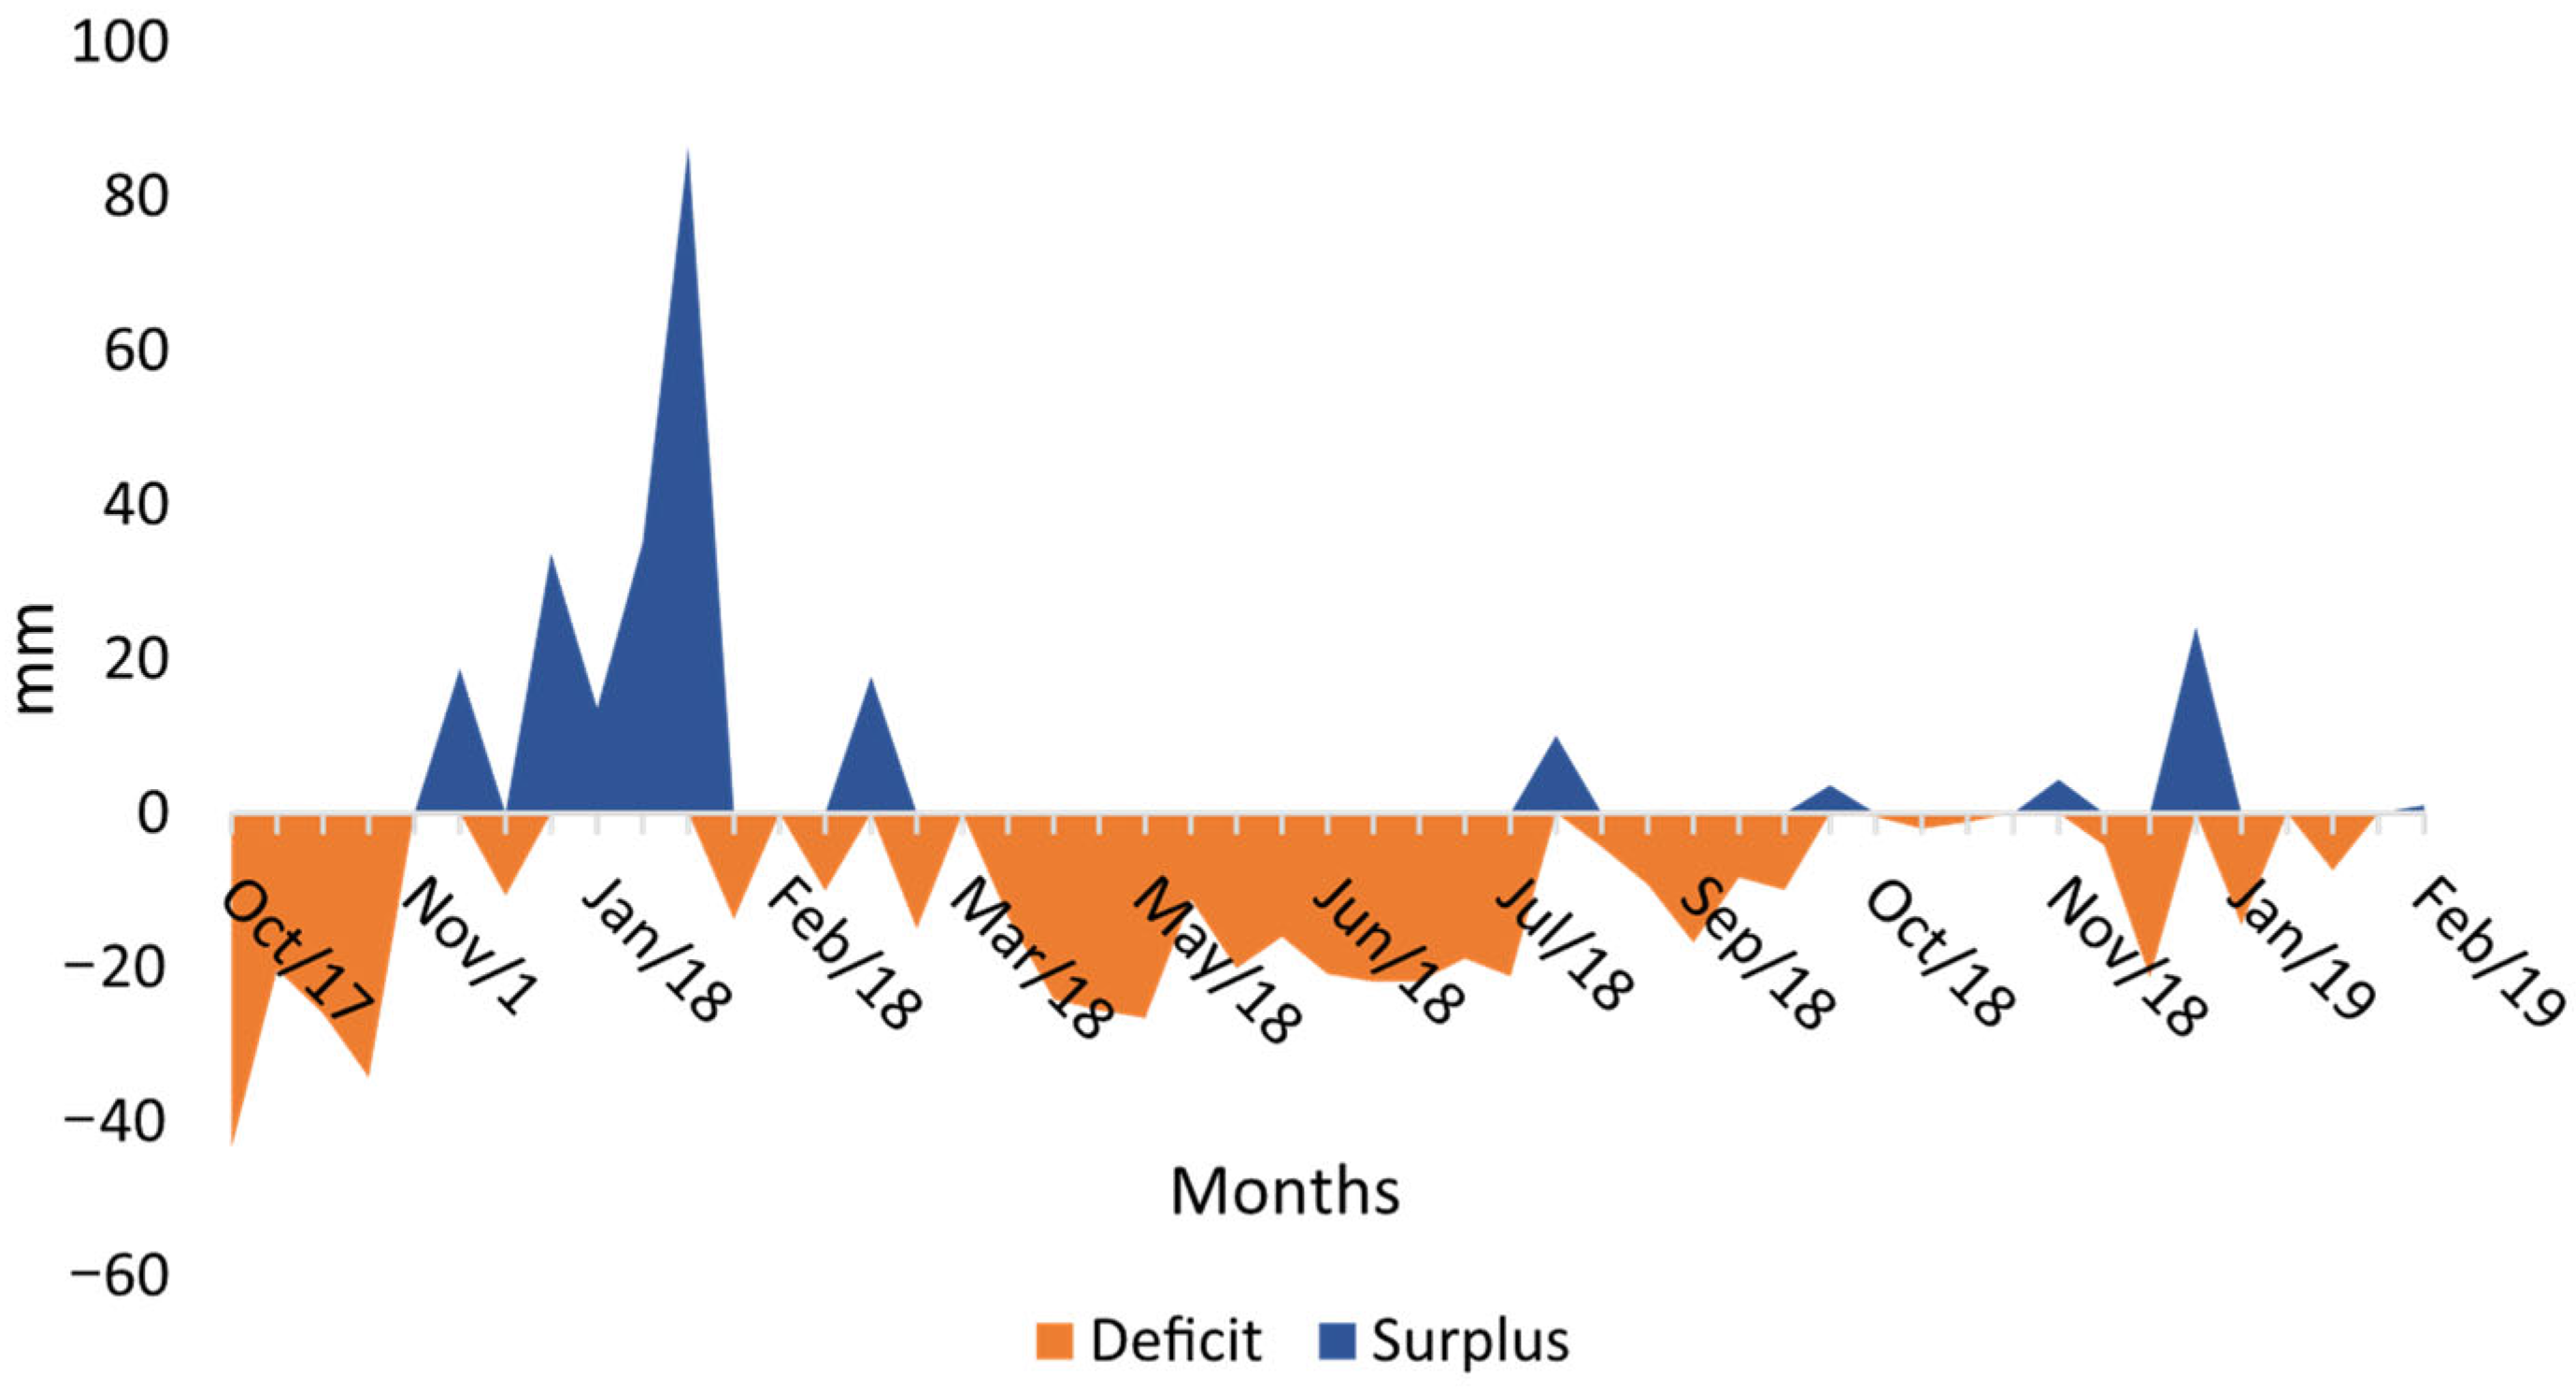
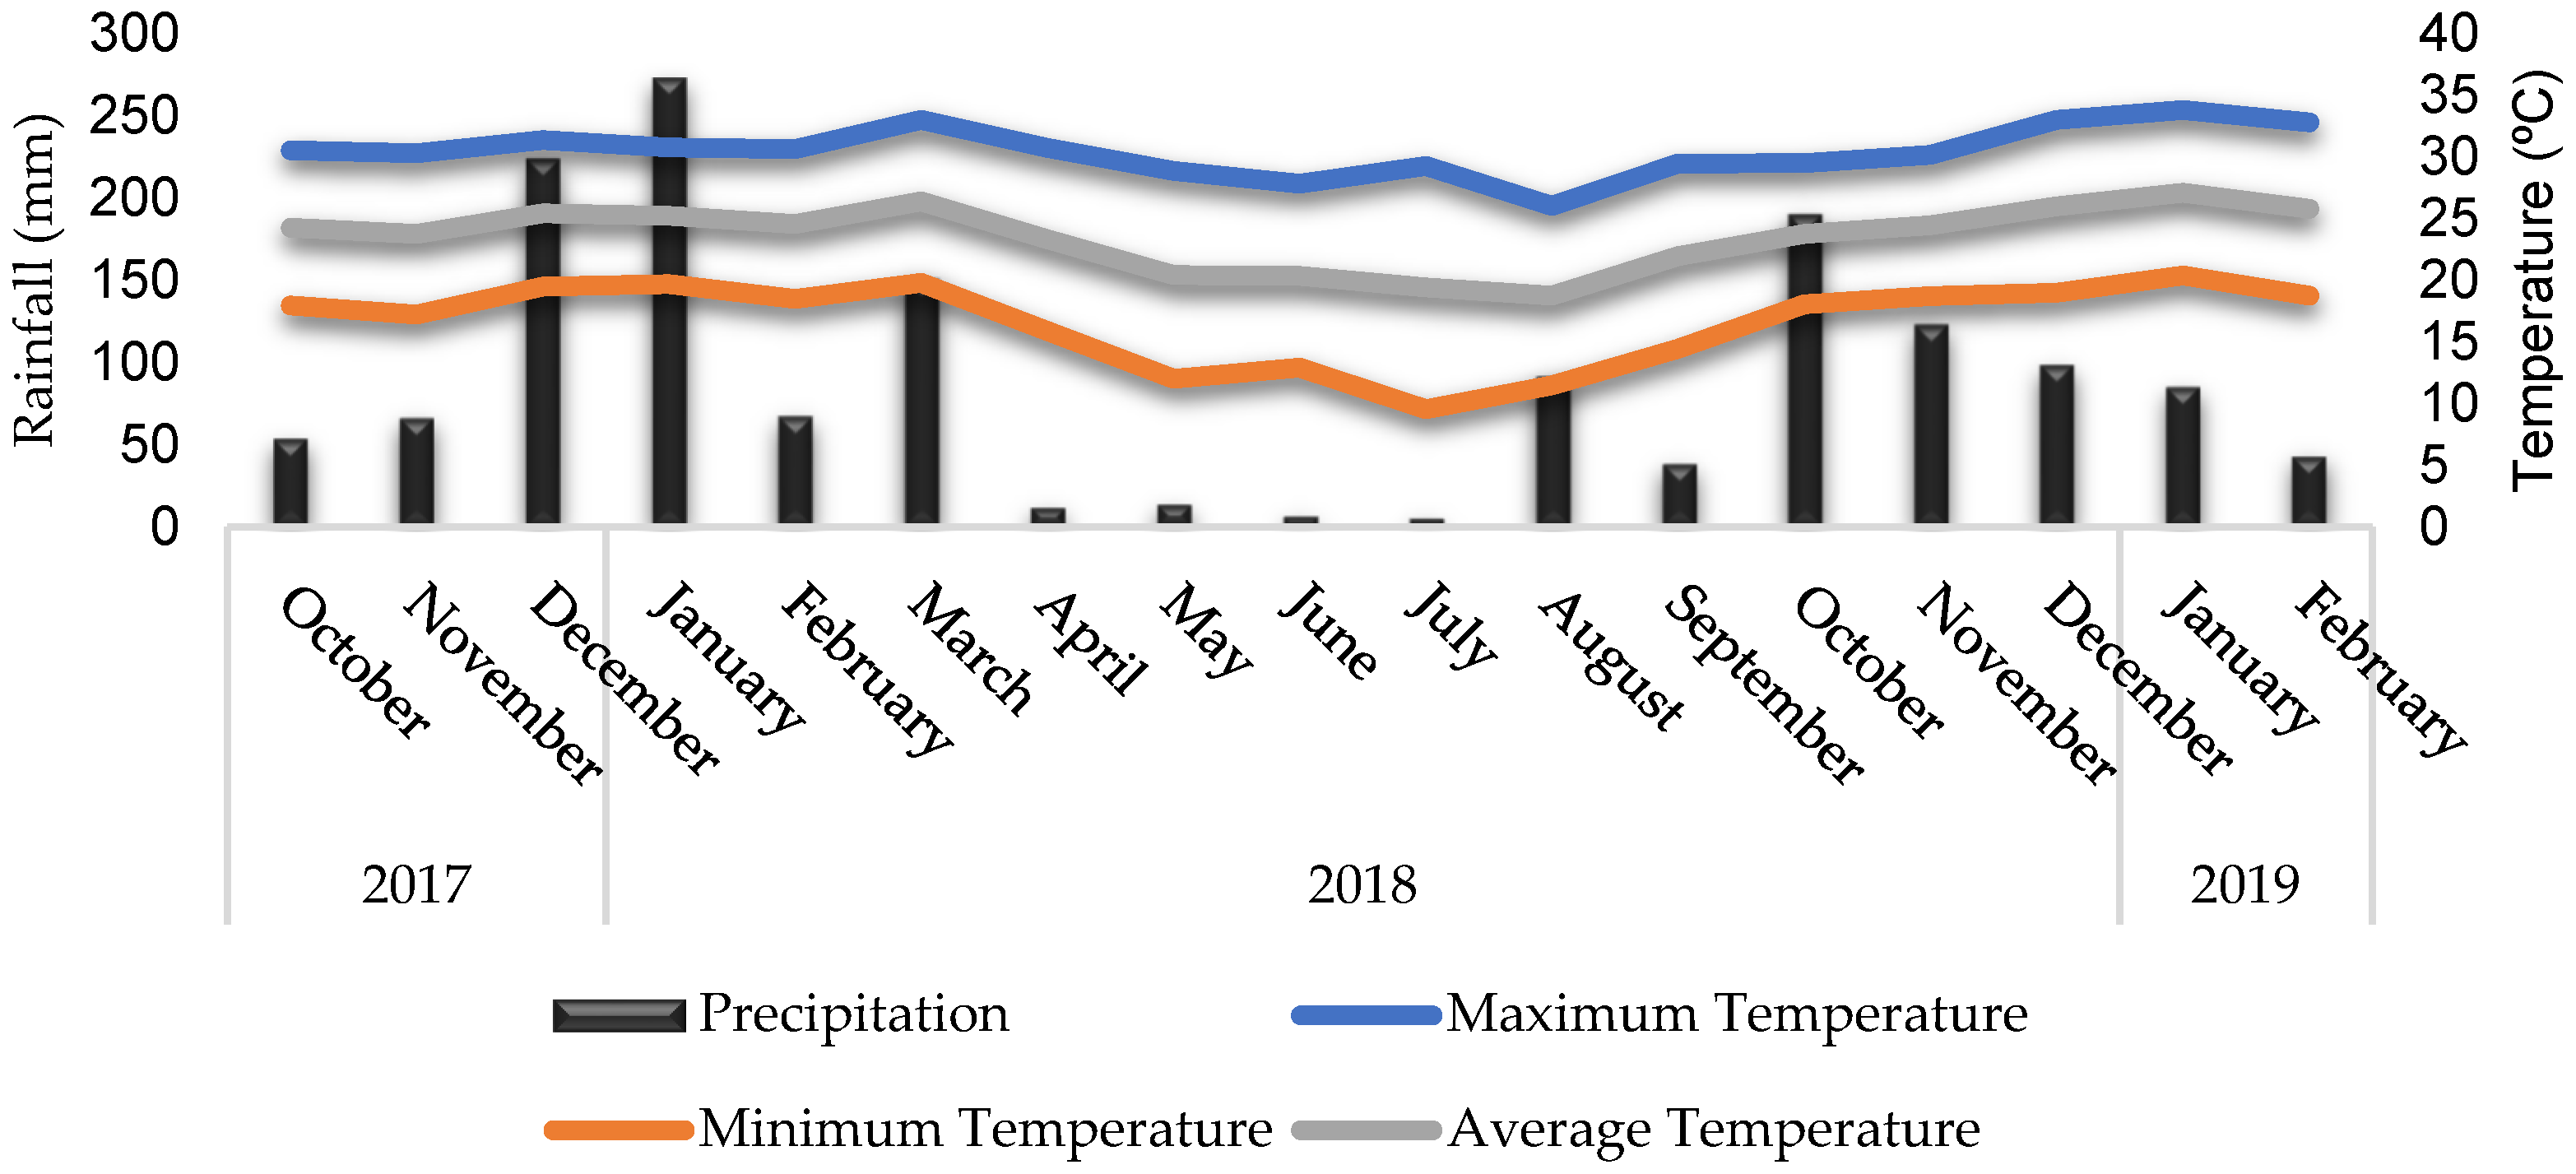
The experiment was conducted at the Division for Research and Development of Pastures and Animal Feeding of the Instituto de Zootecnia, Nova Odessa, São Paulo State, Brazil (22°42′ S, 47°18′ W; 528 m altitude), from October 2017 to February 2019. The region’s climate is classified as type Cwa, humid mesothermal, subtropical with dry winters according to the Köppen climate classification. Climatological data from the last 30 years showed that the average annual temperature was approximately 21.5 °C, with average annual minimum and maximum temperatures of 16.9 °C and 27.3 °C, respectively. The average annual rainfall was about 1457 mm, concentrated mainly between October and March, characterizing the rainy season, while the period from May to August presented low levels of rainfall. Climatic data recorded during the experimental period (Figure 1) were obtained from the meteorological station of the Instituto de Zootecnia and used to calculate the soil water balance, assuming a soil water storage capacity of 50 mm (Figure 2).
The soil of the experimental area is classified as an Ultisol. Chemical soil properties (0–20 cm layer) before the beginning of the experiment were as follows: pH (CaCl2) 4.5; organic matter 13.5 g/dm3 or 1,35%; P 10.2 mg/dm3; Ca 2.2 cmolc/dm3; Mg 1.2 cmolc/dm3; K 0.08 cmolc/dm3; Cu 1.85 mg/dm3; Fe 138.0 mg/dm3; Zn 1.4 mg//dm3; Mn 4.25 mg//dm3; B 0.56 mg//dm3; H + Al 1.6 cmolc/dm3; sum of bases 3.5 cmolc/dm3; cation exchange capacity 5.5 cmolc/dm3; and base saturation 66.5%. Fertilization was applied at sowing and during the experimental period: in December 2017, potash (83 kg K/ha) and simple superphosphate (35 kg P/ha) were applied, and in February 2018, simple superphosphate (33 kg P/ha) and potassium chloride (83 kg K/ha), according to recommendations of [13] for mixed pastures.
The area had been established with Marandu palisadegrass [Urochloa brizantha (Hochst. ex A. Rich.) R.D. Webster cv. Marandu] in 1997 and managed under continuous stocking until the introduction of the legume Macrotyloma axillare (E. Mey. ex Verdc.), accession no. 279 from the Instituto de Zootecnia germplasm bank in 2014. The legume was overseeded in February 2014 and again in September 2017, using 10 kg of viable seeds/ha at each sowing. Part of the dataset generated from this experimental area has been reported in studies focusing on canopy structure under the same grazing management strategies. However, the present study addresses different response variables, specifically forage accumulation rate across evaluation periods, accumulation rates of morphological components of each species, and leaf area index, providing complementary information to other findings.
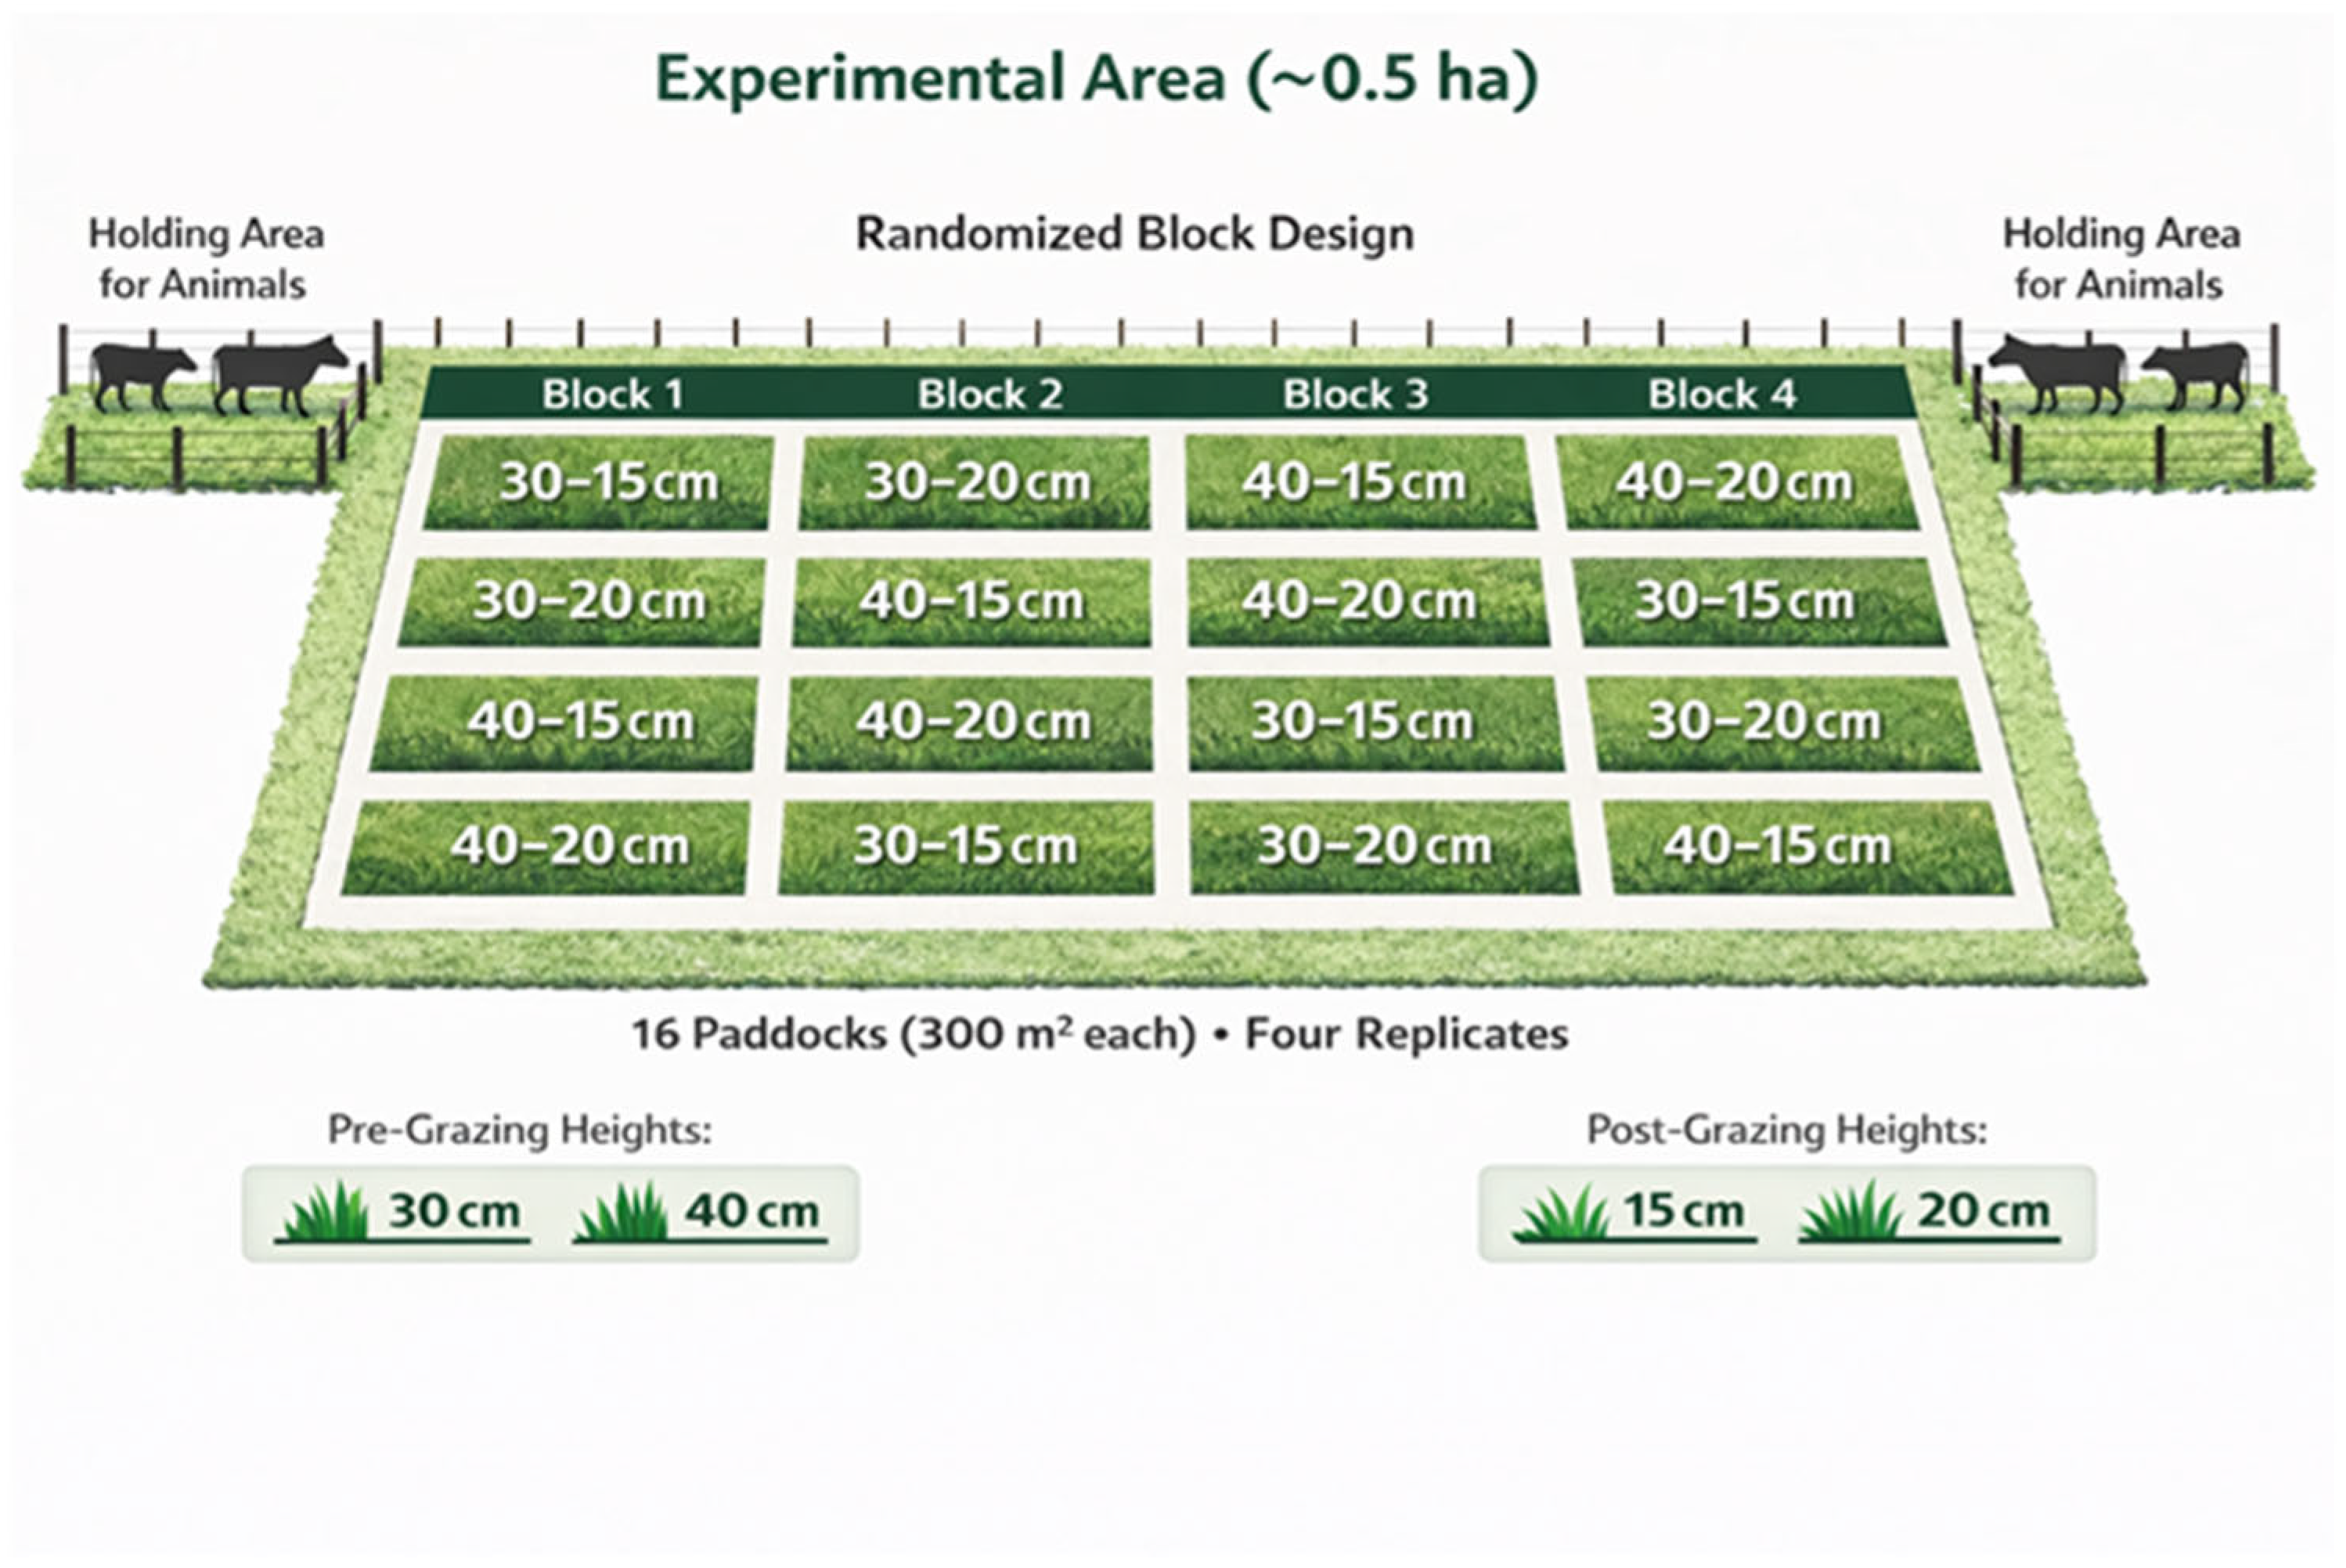
Treatments consisted of combinations of defoliation frequency and defoliation intensity arranged in a 2 × 2 factorial design. Defoliation frequency was defined by pre-grazing canopy heights of 30 and 40 cm, which determined grazing intervals and the timing of animal entry into the paddocks. Defoliation intensity was defined by post-grazing canopy heights of 15 and 20 cm, corresponding to different proportions of forage removal from the pasture canopy. The resulting grazing management strategies were 30–15, 30–20, 40–15, and 40–20 cm. Treatments were allocated to 16 paddocks (300 m2 each) in a randomized block design with four replicates, totalling approximately 0.5 ha of experimental area. Additional pasture areas were reserved for animals when not grazing the experimental paddocks (Figure 3).
Pastures were managed under rotational stocking using Jersey heifers (220 ± 25 kg body weight; 8–14 months of age). Grazing was conducted using a mob-grazing approach [14], with high stocking density for short grazing periods (4 to 20 h), until the target post-grazing height was reached. The number of animals varied from 7 to 10 per experimental unit (paddock), depending on the availability of animals and the amount of forage to be harvested in a short grazing period. Canopy height was monitored once or twice weekly using a sward stick, with 30 measurements per paddock. A grazing cycle was defined as the period between two consecutive grazing events, and the rest period corresponded to the interval between them.

2.2. Experimental Evaluations

2.2.1. Canopy Height, Forage Mass and Forage Accumulation Rate

Canopy height was monitored using a sward stick once or twice a week, depending on weather conditions, throughout the experimental period [15] at 30 sites per paddock in transect lines. Each time the pasture reached the pre-grazing target height, the animals were transferred to the paddock to graze until it reached the post-grazing target height. Total herbage mass and its components were determined in each of the 16 experimental units; pre-grazing forage samples were cut immediately before the animals entered, when the canopy height reached the pre-established target (30 or 40 cm). Post-grazing samples were cut immediately after the animals left, when the pre-established post-grazing height was reached (15 or 20 cm). Forage mass samples were collected in three areas from each paddock, representing the average canopy height (0.25 m2 = 0.5 m × 0.5 m). The results were used to calculate the monthly pre- and post-grazing forage masses. According to [16], the cuts were made close to the ground with the aid of a manual grass trimmer. The forage from each sample was collected and weighed. A subsample was taken from each sample and dried in a forced-air oven at 55 °C for 72 h to determine the herbage dry matter percentage, and the values obtained were used to calculate the kg DM/ha. The remaining material from the three collected samples was pooled, and a subsample was separated to determine the botanical components (grass, legume or weeds). Then, each grass and legume was separated into its morphological components: leaves (leaf for grasses and leaflets + petioles for legumes); stems (stems + leaf sheaths for grasses and branches for legumes); and dead material. The content related to each component was put in a paper bag and placed in a forced-air oven for drying at 55 °C for 72 h. With the respective mass values of each component, the individual proportion and mass of these in the total herbage mass were calculated. The forage accumulation rate was calculated as the difference between the pre-grazing forage mass in cycle n and the post-grazing herbage mass in cycle n-1, divided by the number of days in the growth period, and expressed in kg DM/ha day.

2.2.2. Leaf Area Index

Leaf area index (LAI) was determined by destructive sampling during forage mass evaluations before drying. Each sample, consisting of grass or legume leaves, was scanned using a LI-3100 leaf area meter (LI-COR, Lincoln, NE, USA). LAI was calculated as the ratio between total leaf area and the corresponding ground area sampled (m2 leaf area per m2 ground area).

2.2.3. Statistical Analysis

Data were tested using the Kolmogorov–Smirnov test with a 5% significance level to verify normality. The presence of outliers was verified by the Coock’s test with the same significance level. Any data identified as outliers were excluded from the analyses. Analysis of variance was performed using PROC MIXED of the SAS statistical package (Statistical Analysis System), version 9.1. The Akaike information criterion was used to construct the variance and covariance matrix, which permitted detecting the effects of the main causes of variation: grazing frequency (pre-grazing height), grazing intensity (post-grazing height), period and their interactions [grazing frequency × grazing intensity, grazing frequency × period, grazing intensity × period and grazing frequency × grazing intensity × period]. The effects of grazing frequency and intensity, period, and their interactions were considered to be fixed, and the effect of blocks was considered to be random. Because measurements were taken repeatedly in the same experimental units over time, the period was treated as a repeated measure, and paddock was the experimental unit. Treatment means were estimated using LSMEANS and compared using Student’s t-test at the 5% significance level. Main effects were interpreted only when interactions were not significant. When significant interactions occurred, treatment combinations were interpreted as grazing management strategies defined by combinations of pre- and post-grazing heights.

3. Results

3.1. Forage Accumulation Rates of Marandu Palisadegrass and Macrotyloma Legume

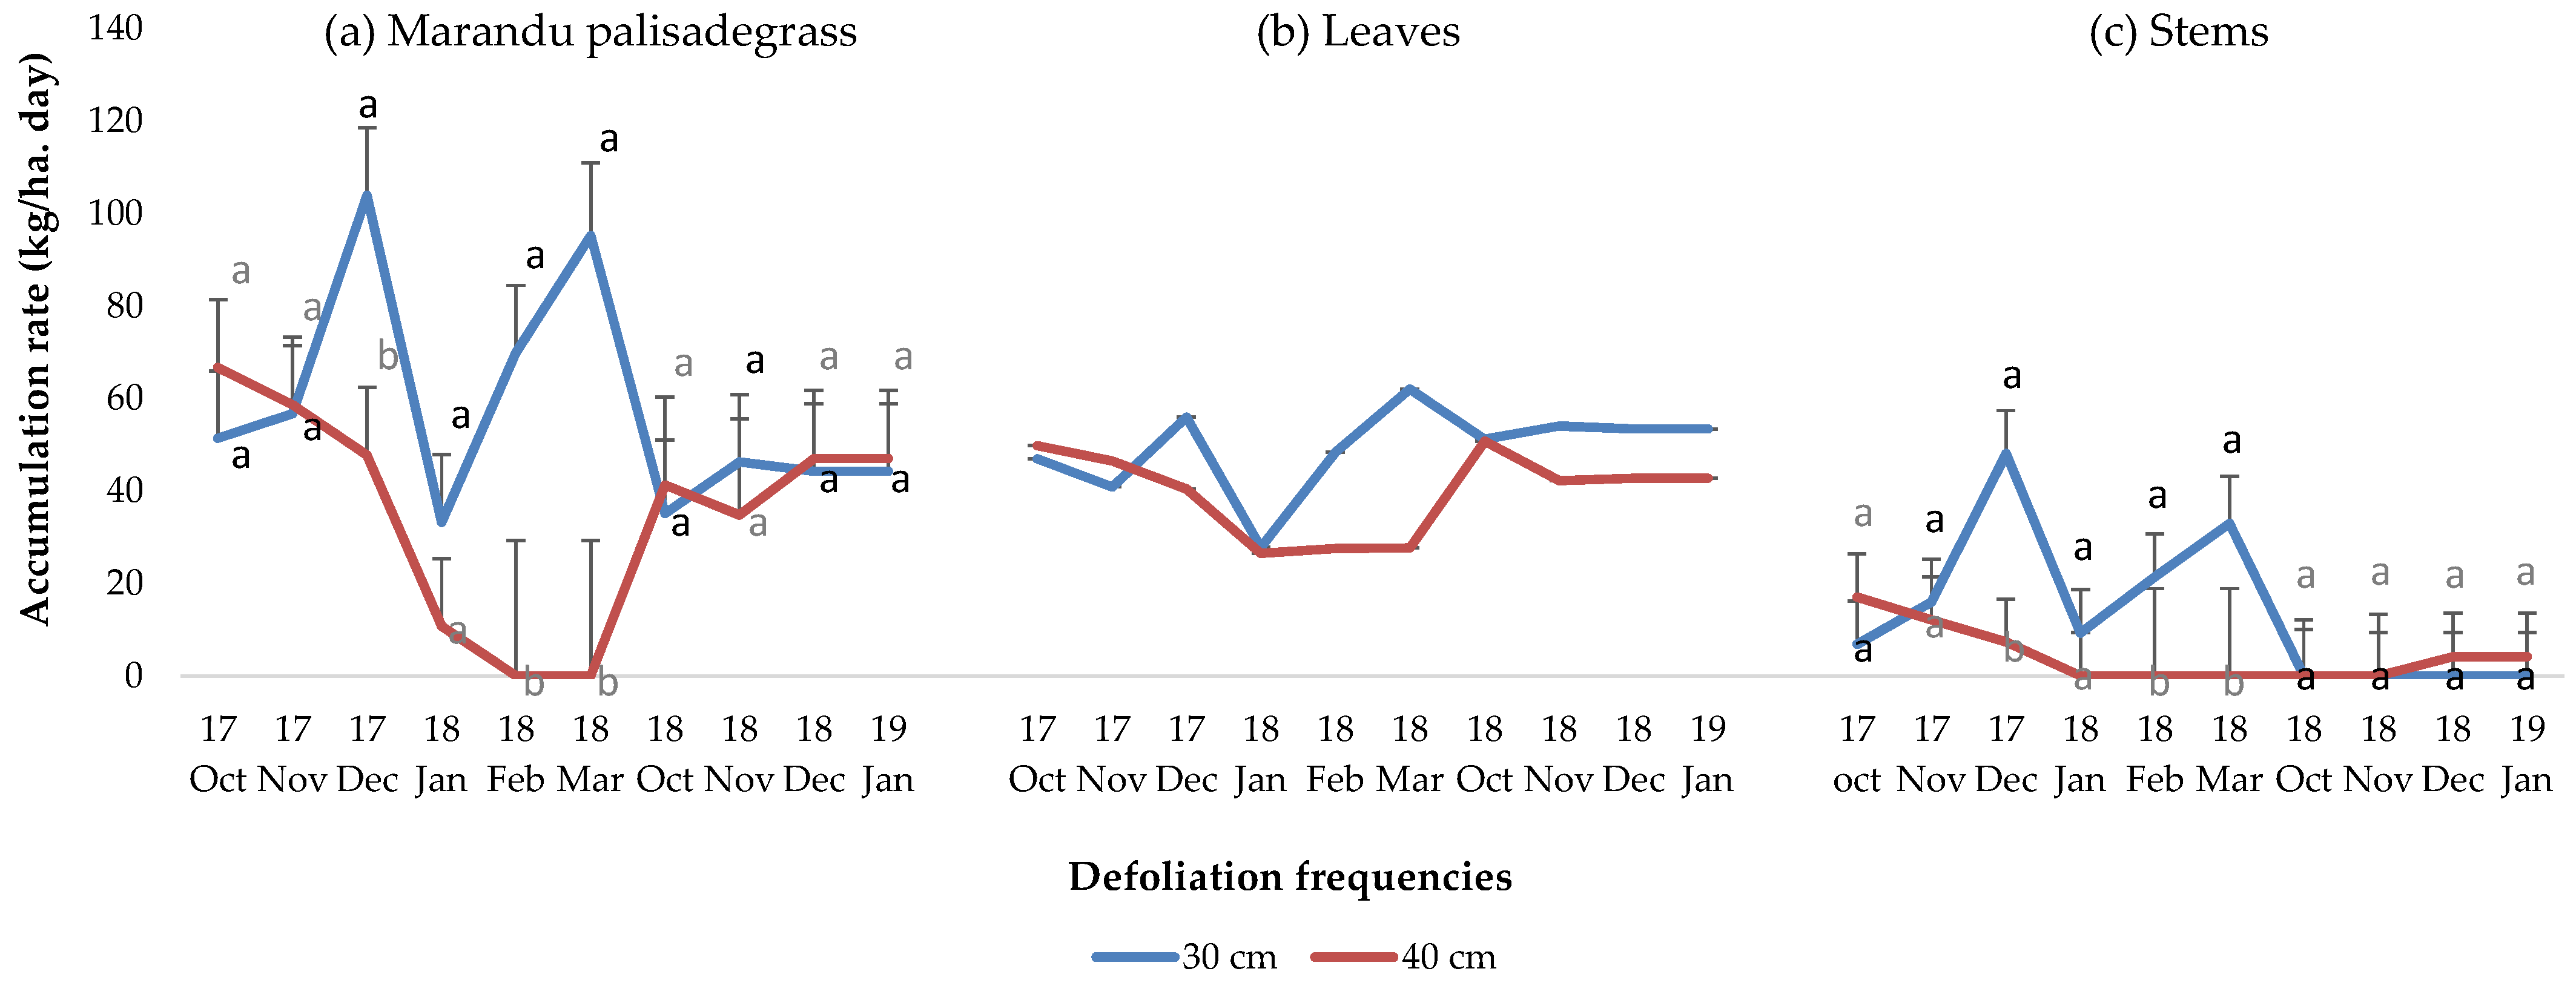
Forage accumulation rate of Marandu palisadegrass and its stems was affected by the interaction between grazing frequency and period (p = 0.0418 and p = 0.0040, respectively) (Figure 4a,c). Within this interaction, higher accumulation of Marandu palisadegrass and its stems was generally observed under the 30 cm pre-grazing height during favorable growing conditions. A similar pattern was observed for the leaf component, although without statistical support (Figure 4b).
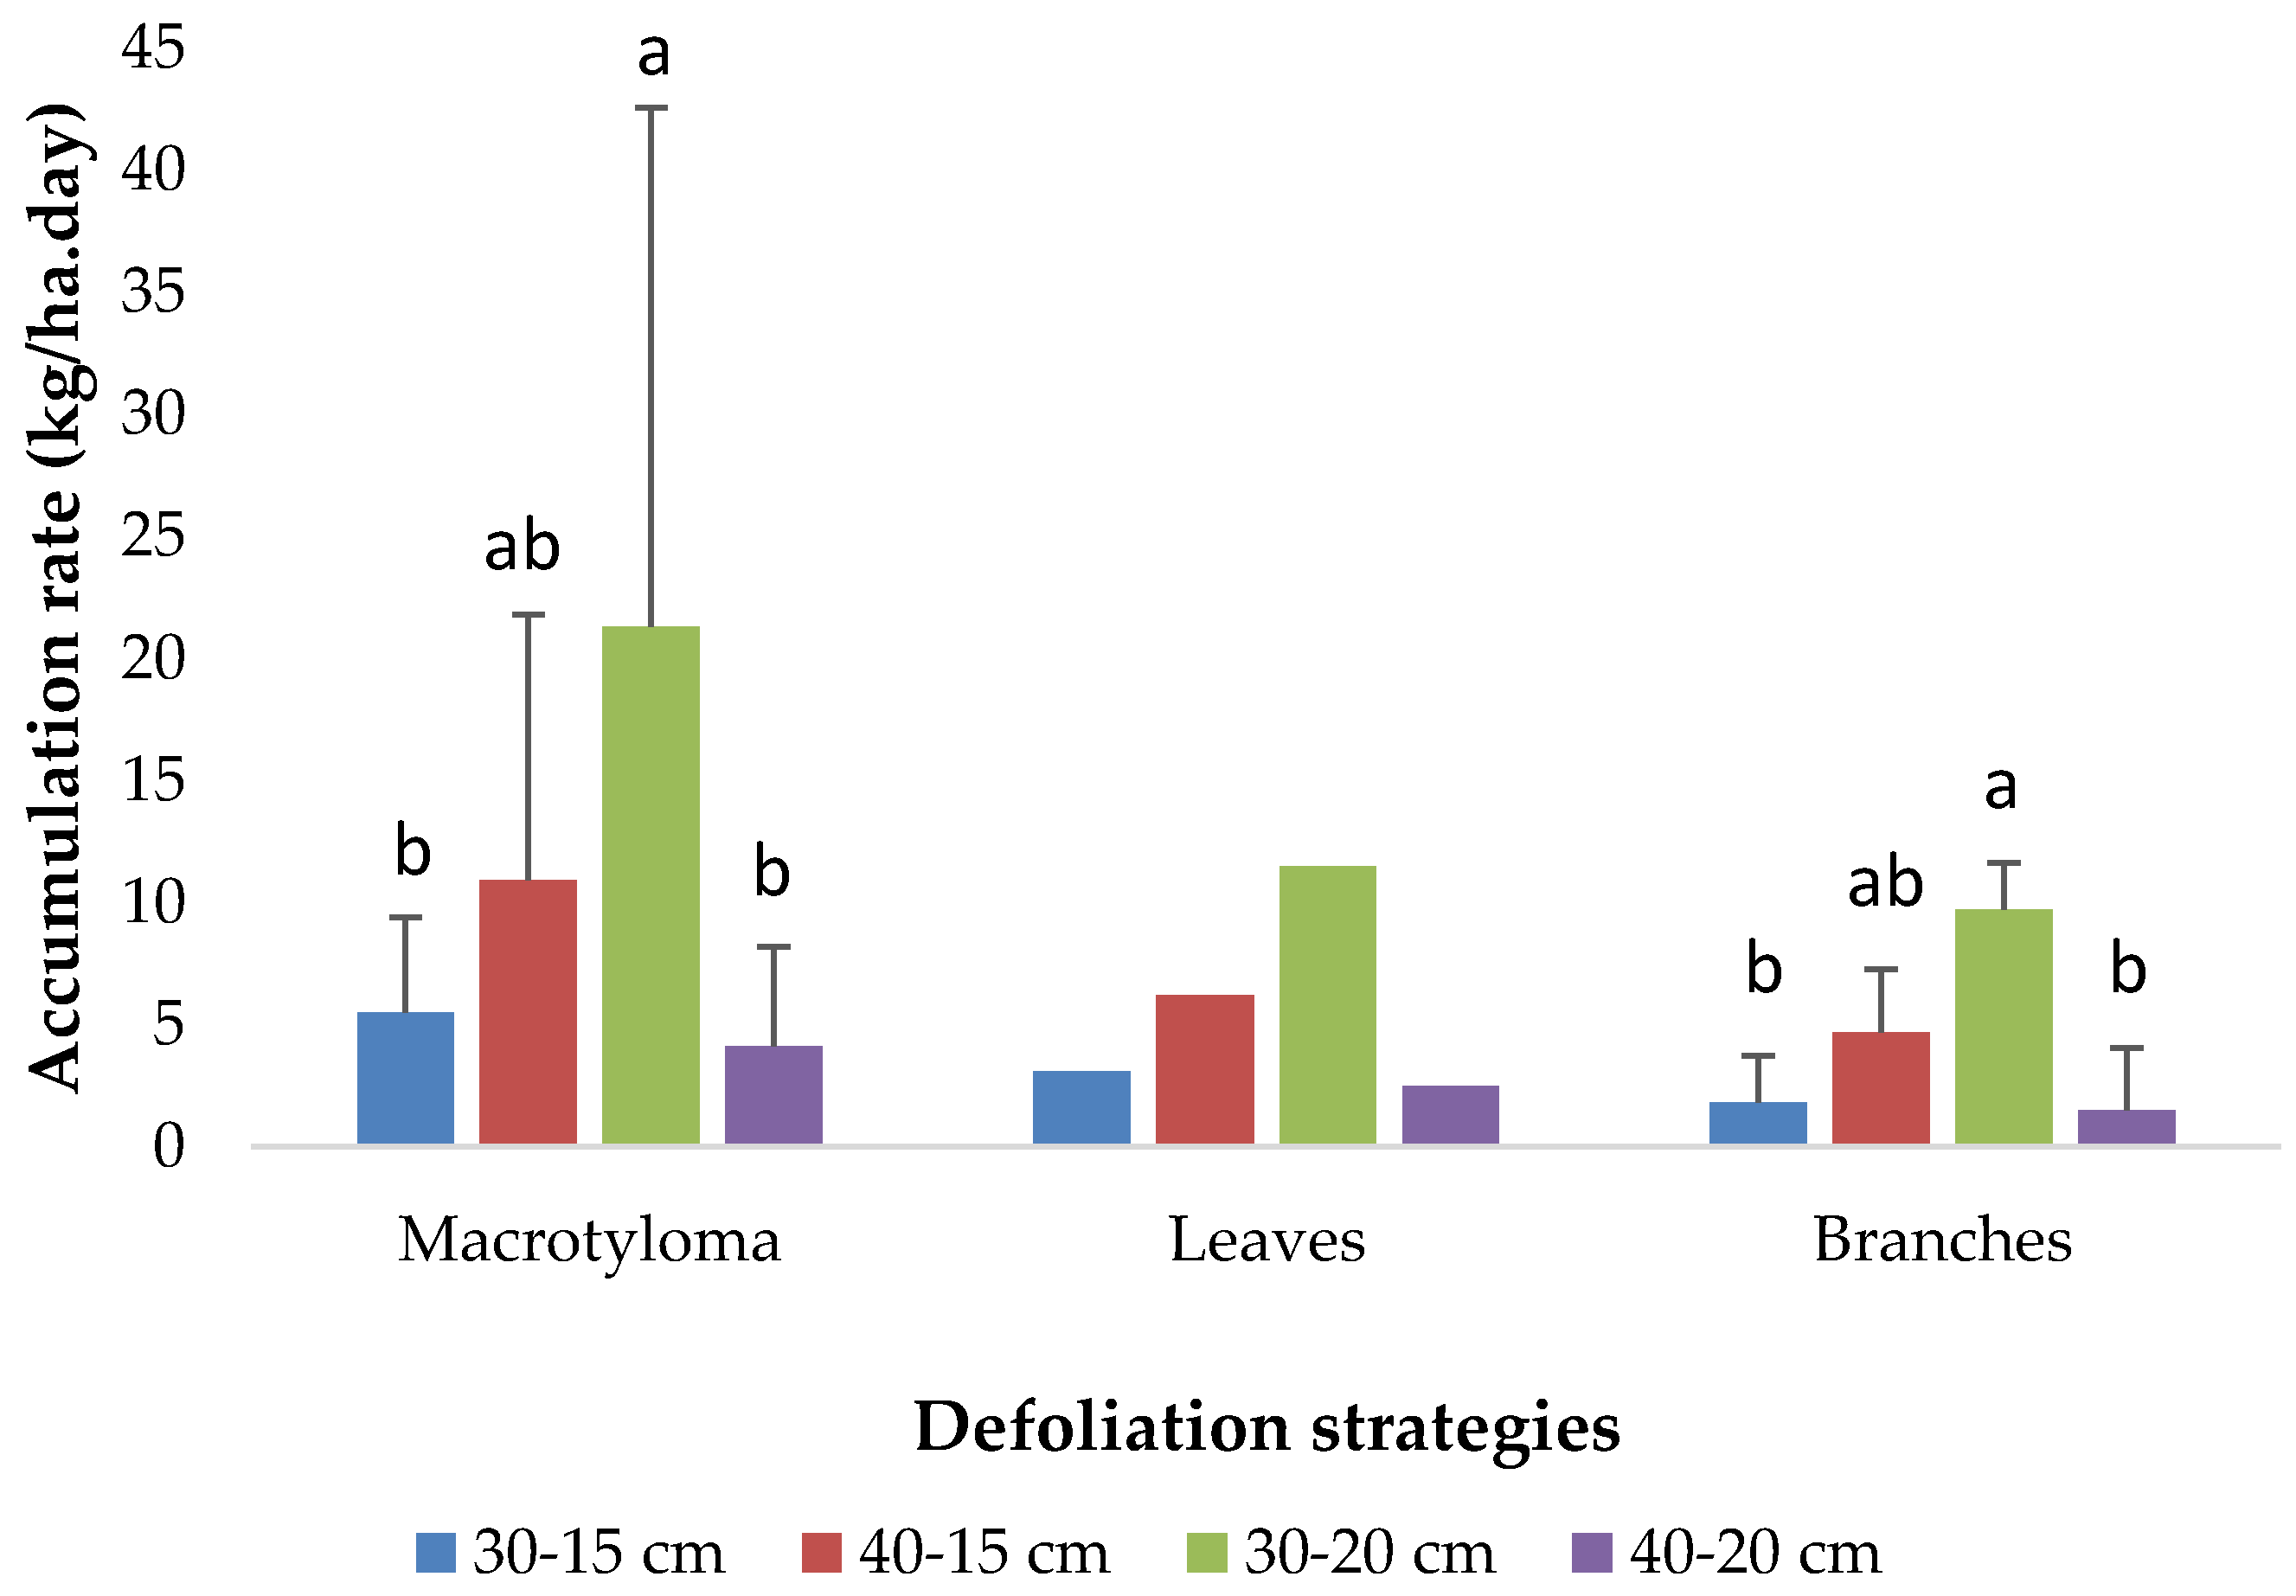
Forage accumulation of Macrotyloma and its branch component was affected by the interaction between grazing frequency and grazing intensity (p = 0.0351 and p = 0.0357, respectively) (Figure 5). The highest values occurred under the 30–20 cm and 40–15 cm grazing strategies. A similar response was observed for the leaf component, although without statistical support (Figure 5).

3.2. Pre-Grazing Canopy Height and Forage Mass

Pre-grazing canopy heights averaged 40.0 and 16.9 cm (40–15 cm), 40.2 and 19.5 cm (40–20 cm), 31.5 and 17.1 cm (30–15 cm), and 30.2 and 19.2 cm (30–20 cm), with monthly values presented by [17].
Pre-grazing forage mass of Marandu palisadegrass was affected by grazing frequency (p = 0.0004), period (p < 0.0001), and their interaction (p = 0.0014). Greater forage mass occurred in pastures managed with the 40 cm pre-grazing height compared with 30 cm.
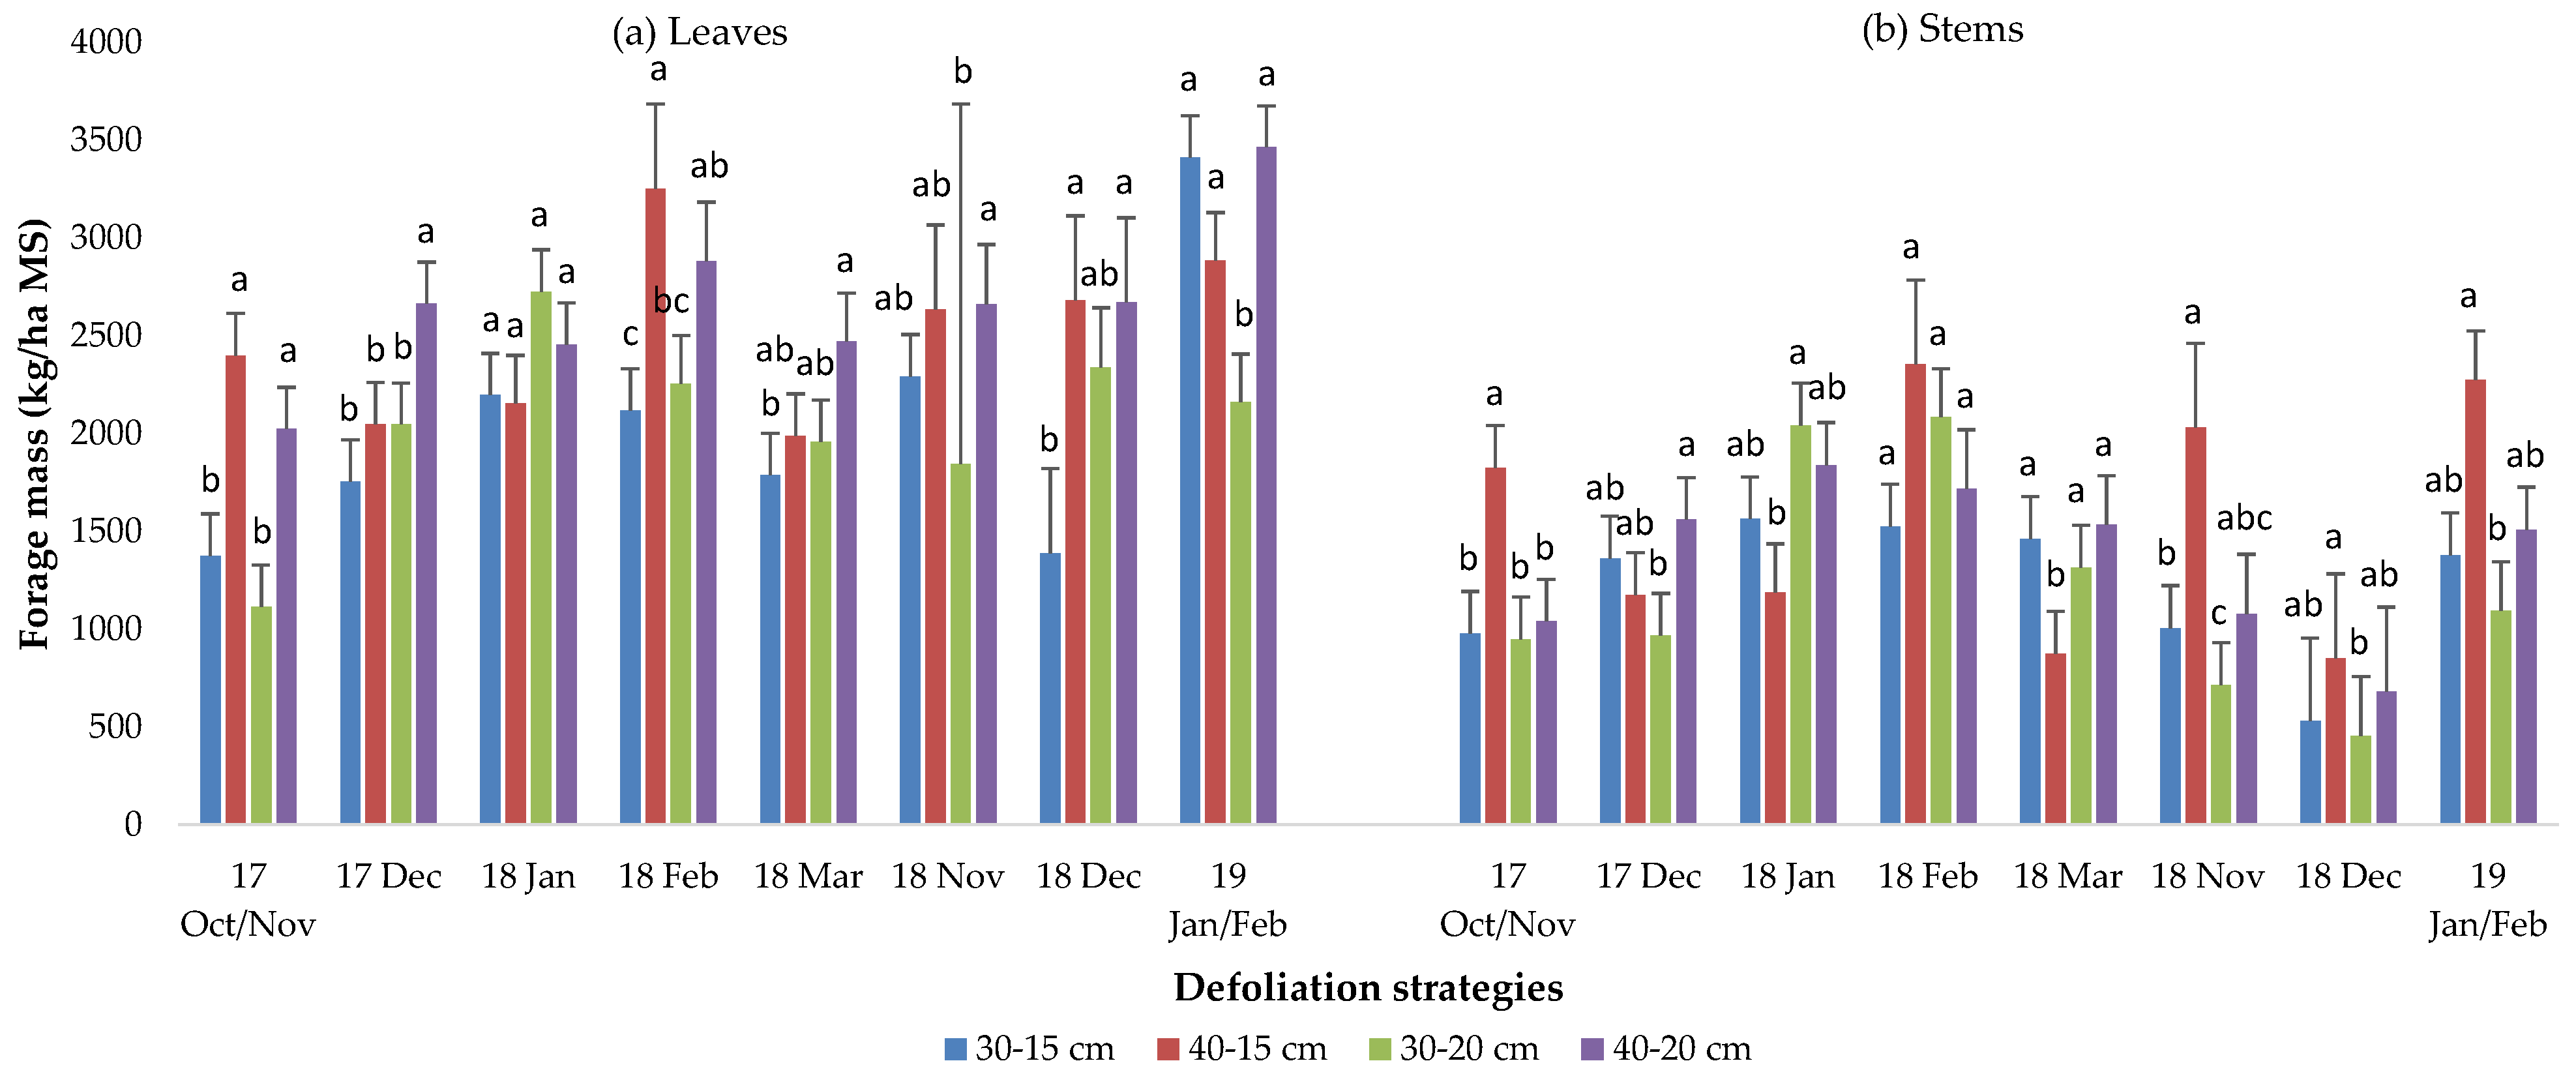
Pre-grazing Marandu palisadegrass leaf mass (Figure 6a) varied with grazing frequency (p = 0.0003), period (p < 0.0001), and the interaction among frequency, intensity, and period (p = 0.0258). Across the experimental period, higher leaf mass occurred in pastures managed with the 40 cm pre-grazing height, whereas lower values were observed under the 30 cm height, particularly in the 30–20 cm grazing strategy.
Pre-grazing Marandu palisadegrass stem mass (Figure 6b) varied with grazing frequency (p = 0.0236), period (p < 0.0001), and the interaction among frequency, intensity, and period (p = 0.0339). In general, higher values occurred in pastures managed with the 40–15 cm grazing strategy in most periods of the year, whereas lower values occurred under the 30–20 cm strategy.
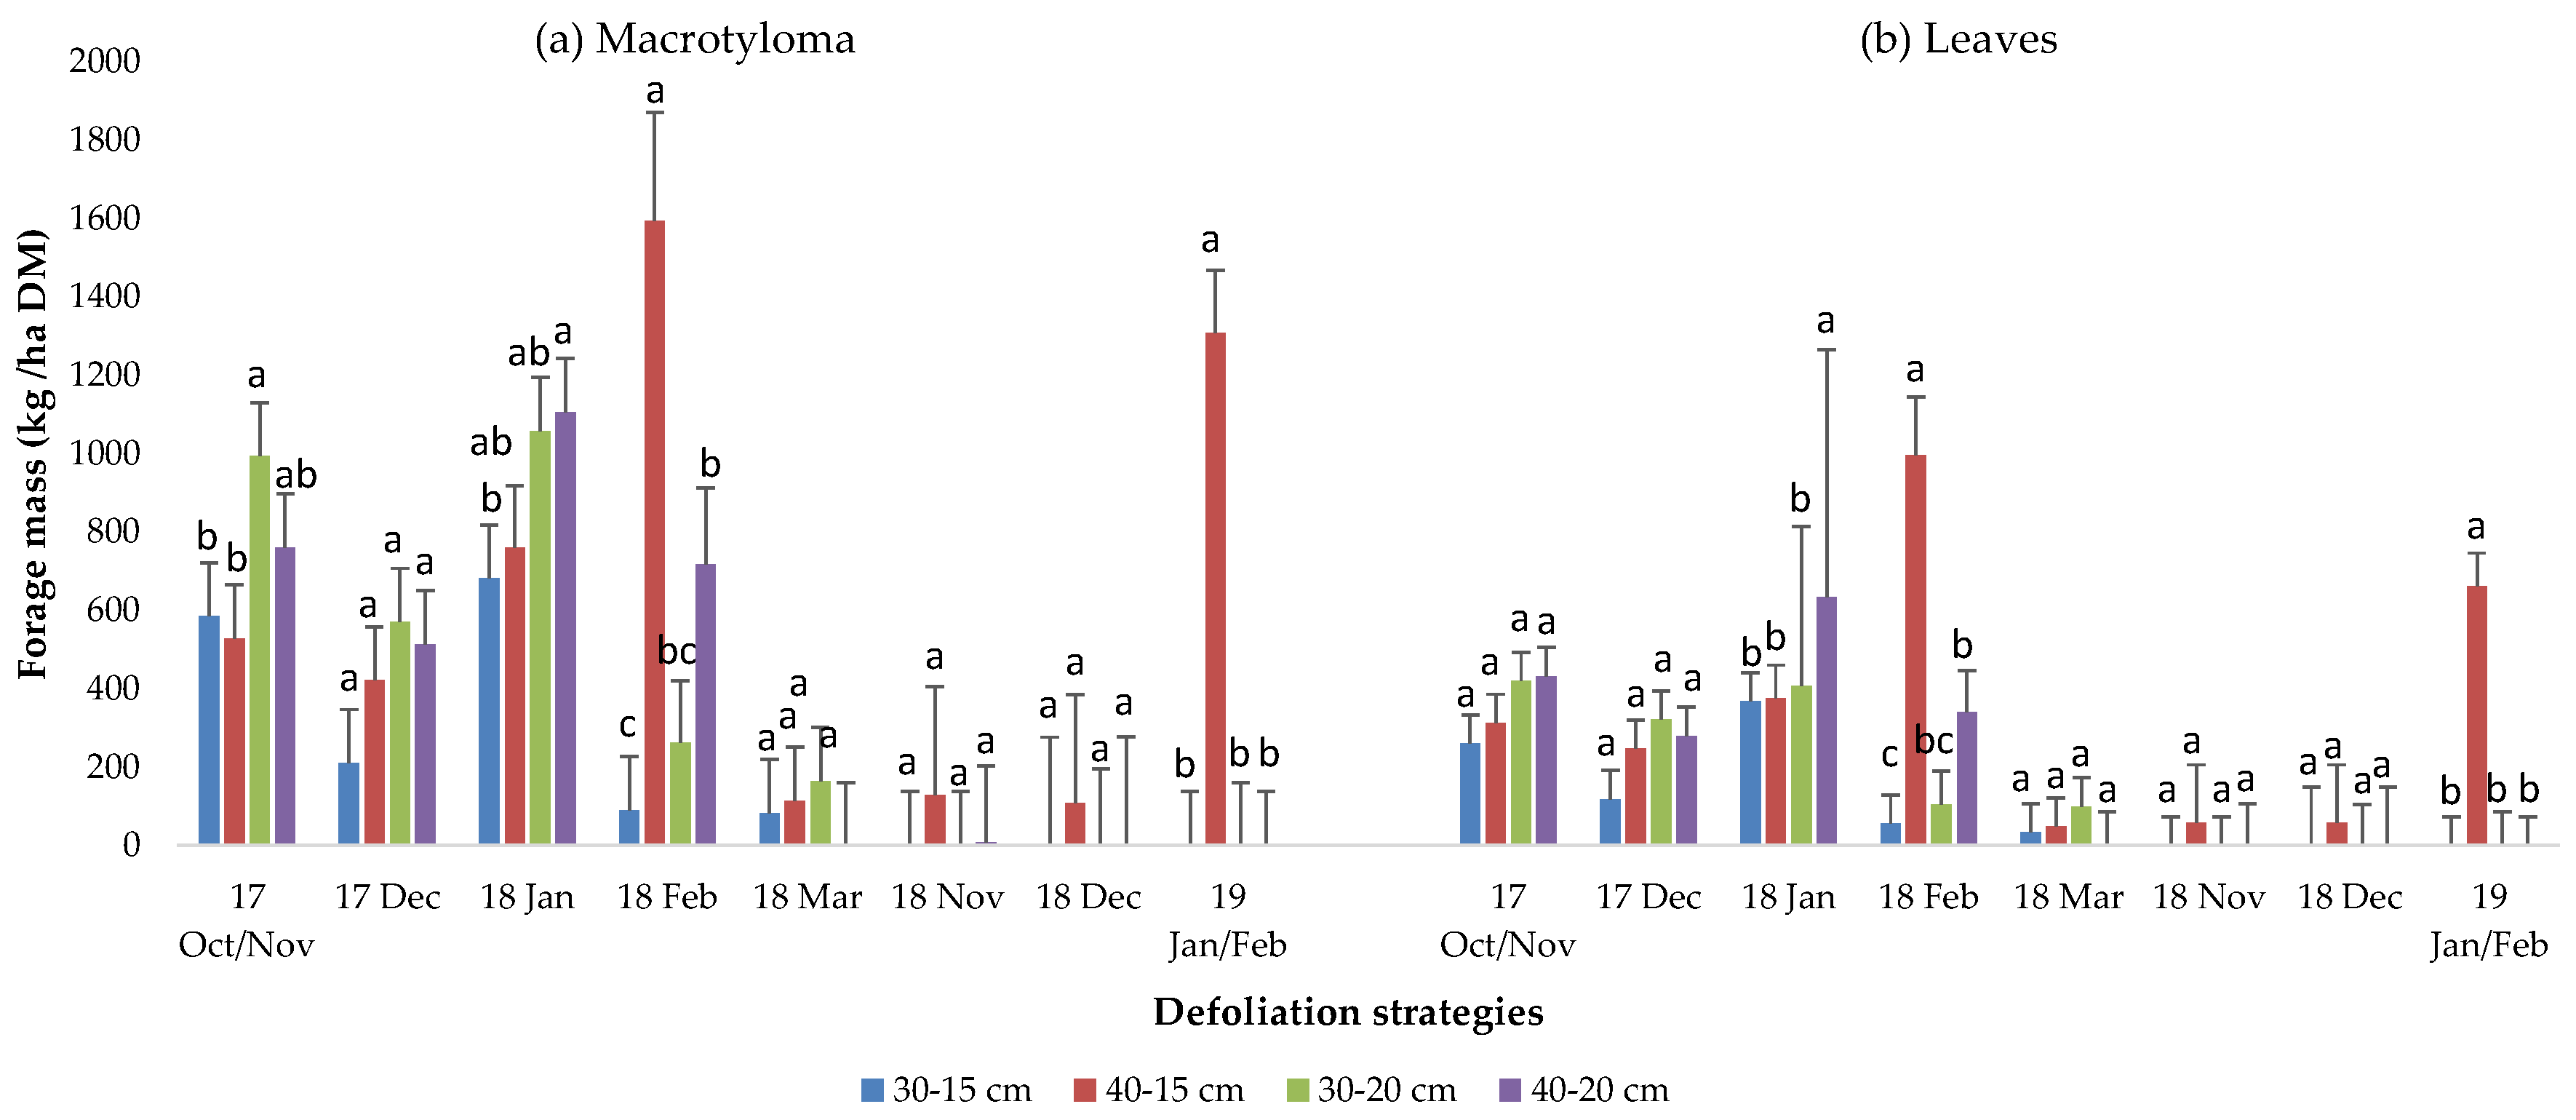
Pre-grazing forage mass of Macrotyloma was influenced by grazing frequency (p = 0.0175), period (p < 0.0001), and the interaction among frequency, intensity, and period (p = 0.0298). Higher values occurred under the 40–15 cm and 40–20 cm grazing strategies, whereas the 30–15 cm strategy produced the lowest values (Figure 7a).
Pre-grazing leaf mass of Macrotyloma varied with period (p < 0.0001) and the interaction between frequency, intensity, and period (p = 0.0036). Higher values occurred in February 2018 and January–February 2019, mainly under the 40–20 and 40–15 cm grazing strategies (Figure 7b).
Pre-grazing branch mass of Macrotyloma varied with period (p < 0.0001) and the interactions grazing frequency × intensity (p = 0.0132), intensity × period (p = 0.0001), and frequency × period (p = 0.0001). Seasonal peaks occurred mainly in October–November 2017 and January–February 2018, whereas the lowest values occurred in March, November, and December 2018. The 40–15 cm and 30–20 cm grazing strategies produced the greatest branch masses, while the 30–15 cm strategy resulted in the lowest values. Dead material varied only with period (p = 0.0244), with higher amounts early in the experimental period (October–November 2017; Table 1).

3.3. Pre-Grazing Leaf Area Index

The pre-grazing Leaf Area Index (LAI) of Marandu palisadegrass varied with grazing frequency (p < 0.0001), period (p < 0.0001), and the interaction between grazing intensity and period (p = 0.0102) (Table 2). The 40 cm pre-grazing height resulted in the highest LAI (4.7 ± 0.13), whereas the 30 cm height showed lower values (3.6 ± 0.10). Within the intensity × period interaction, the 20 cm post-grazing height produced greater LAI in December 2017 and January 2018 compared with 15 cm.
The pre-grazing LAI of Macrotyloma varied with grazing frequency (p = 0.0076) and the interaction among grazing frequency, intensity, and period (p = 0.0249) (Table 3). In general, higher LAI values occurred in pastures managed with 40 cm pre-grazing height combined with 15 cm post-grazing height in February 2018 and January–February 2019, and with 20 cm post-grazing height in January 2018.

3.4. Post-Grazing Forage Mass

Post-grazing forage mass of Marandu palisadegrass varied with period (p < 0.0001) and the interaction among grazing frequency, intensity, and period (p = 0.0485). The 40–20 cm grazing strategy had higher post-grazing forage mass during most of the experimental period (Table 4).
Post-grazing leaf mass of Marandu palisadegrass varied with period (p = 0.0003), with higher values occurring in January 2018 and lower values in December 2018 (Table 5).
Post-grazing stem mass varied with grazing frequency (p = 0.0016), grazing intensity (p = 0.0072), period (p < 0.0001), and the interaction among intensity and period (Table 6). Higher values occurred under the 40 cm pre-grazing height (1563.4 ± 50.73 kg DM ha−1) compared with the 30 cm height (1277.8 ± 24.40 kg DM ha−1), and under the 15 cm post-grazing height.
Post-grazing mass of Macrotyloma and its leaf and branch components varied only with period (p < 0.0001), with higher values early in the experiment (Oct–Nov 2017) and lower values in subsequent periods (Table 5).
Post-grazing dead material mass varied with grazing frequency (p = 0.0138), the interaction between intensity and period (p = 0.0046), and the interaction between frequency and period (p = 0.0004) (Table 7). Higher values occurred under less intense defoliation (20 cm) and lower grazing frequency (40 cm).

3.5. Post-Grazing Leaf Area Index (LAI)

Post-grazing LAI of Marandu palisadegrass and Macrotyloma varied with period (p < 0.001) (Table 8). Marandu palisadegrass showed higher LAI values between January and March 2018 and in December 2018, whereas lower values occurred in January–February 2019. In contrast, Macrotyloma LAI declined throughout the experimental period, approaching zero in later periods.

4. Discussion

During the experimental period, the proposed canopy height targets were achieved for both pre- and post-grazing, ensuring the necessary contrasts in defoliation strategies necessary for the study. However, pastures managed with a 40 cm pre-grazing height showed greater difficulty in achieving the post-grazing target, likely due to the accumulation of stems and dead material [18,19]. Similar findings were reported by Antunes et al. [11], who observed that Marandu palisadegrass pastures managed at a pre-grazing height of 35 cm had increased stem proportions and failed to achieve the post-grazing target of 10 cm compared with shorter canopies managed at 25 cm.
The response of Marandu palisadegrass forage accumulation depended on the interaction between grazing frequency and seasonal growing conditions, suggesting that grazing management effects are modulated by plant growth dynamics throughout the year. However, it did not affect the accumulation rates of Marandu or Macrotyloma leaves. The highest forage accumulation rates were found for Marandu stems at shorter pre-grazing heights (30 cm), while Macrotyloma branches accumulated more under lenient defoliation (20 cm). These results reinforce the idea that light interception and residual leaf area are key factors in driving regrowth and canopy productivity in mixed pastures.
The highest forage accumulation rates of the legume Macrotyloma occurred under the 30–20 cm and 40–15 cm grazing strategies. These results suggest that Macrotyloma growth was favored, first, by lenient defoliation (30–20 cm; 33% proportion of canopy height removed by grazing), and second, by longer regrowth intervals, even at higher grazing intensity (40–15 cm with 62% proportion of canopy height removed by grazing). Although the post-grazing heights evaluated represent relatively intense defoliation for Marandu palisadegrass [18], they did not affect total Macrotyloma forage production as initially expected.
Seasonal variation influenced the accumulation rates and botanical composition of mixed pastures of Marandu palisadegrass and Macrotyloma, indicating that similar grazing management strategies yielded different results across evaluation periods due to climatic seasonality. Based on this observation, it may be beneficial to have different pasture height targets throughout the year, as Terra et al. [19] reported for Marandu palisadegrass under continuous grazing.
As expected, the mass of Marandu palisadegrass and its leaves and stems were directly related to canopy height, consistent with the positive linear relationship between height and forage mass [20]. Pre-grazing leaf and stem mass were higher at a pre-grazing height of 40 cm, reflecting longer regrowth intervals and lower consumption by animals [21,22].
Macrotyloma pre-grazing mass was also influenced by post-grazing height: less intense grazing (20 cm) resulted in greater residual leaf area and faster recovery, while intense defoliation (15 cm) reduced regrowth by probably removing apical meristems. Similar responses have been reported for other twining legumes, which develop better under lower grazing intensities, as described by Ongaro et al. and Batista et al. [17,23] in continuous stocking grazing management. Legume persistence and productivity depend on the preservation of growing points and leaves, which are favored by lenient defoliation in rotational stocking systems [24]. On the other hand, studies of mixed pastures in Brazil suggest that pasture development is best when regrowth is interrupted at 95% light interception (higher frequency) compared to pastures reaching close to 100% light interception (lower frequency) [7,8,21]. In this study, this corresponds to pre-grazing heights of 30 and 40 cm, respectively. The branch mass of Macrotyloma was also greater under 30–20 cm and 40–15 cm (211 and 264 kg DM/ha, respectively), suggesting that lenient or moderately intense grazing combined with adequate regrowth intervals promotes branch development in twining legumes. Macrotyloma pre-grazing branch mass was also affected by post-grazing height, likely due to its twining growth habit, allowing vertical development over the grass canopy in order to reach light, with secondary branching observed during evaluations [17].
Higher pre-grazing canopy heights, resulting from longer regrowth periods, enabled greater plant development and senescence, leading to increased stem elongation, leaf aging, and the accumulation of dead material [12]. Taller canopies were also likely to experience shading of emerging tillers and leaves, which reduced light availability and produced older, more lignified tissues in the bottom stratum of the forage canopy [17]. Gomes et al. [21] reported that long regrowth intervals in mixed pastures of Marandu palisadegrass and forage peanut (Arachis pintoi cv. BRS Mandobi) reduced the stability of the legume in the canopy. Therefore, the growth habit of the intercropped legume (twining vs. prostrate) plays a decisive role in its persistence and productivity when intercropped with tropical grasses. In this study, the Macrotyloma legume exhibits a twining growth habit. This causes the plants to be preferentially positioned in the upper part of the forage canopy [16], resulting in more frequent consumption in pastures with shorter grazing intervals (30 cm) than in those with fewer grazing events (40 cm).
According to Thomas [24,25], the optimal contribution of legumes to tropical pastures should range from 20 to 45% of the total forage mass. Throughout the experiment, Macrotyloma represented less than 8% of the total forage mass (70–240 kg DM/ha), which is far below the recommended range [23,25]. Grazing pressure, even in the lenient treatments, was likely excessive for this forage legume, limiting its persistence. Oliveira [26] reported persistence of the legume Macrotyloma and a high proportion in the total forage mass in a two-year experiment under continuous stocking at 30 cm, indicating that grazing management may be a determining factor for the presence of this legume.
The pre-grazing Leaf Area Index (LAI) of Marandu palisadegrass and Macrotyloma was positively correlated with leaf mass and canopy height. Pastures managed at a pre-grazing height of 40 cm showed the highest LAI values for both species. The grass LAI remained stable over time, whereas the legume LAI declined sharply as the experiment progressed. In contrast, Alviarez et al. [12] reported no differences among defoliation frequencies in pre-grazing Marandu palisadegrass LAI, although a marked reduction was observed over the experimental period, from 5.10 to 3.93. Conversely, the legume Calopo LAI increased over time, from zero to 1.57, under the lowest defoliation frequency (100% light interception- IL). In this study, the post-grazing LAI of Marandu palisadegrass remained stable throughout the experimental period, while the LAI of Macrotyloma declined. In this condition, Alviarez et al. [12] describe only the differences in grass LAI for defoliation frequency: higher LAI with high frequency and light interception in the pre-grazing canopy (90 and 95% IL), and higher LAI for the opposite defoliation frequency in the Calopo (100% IL).
The interaction between pre- and post-grazing heights impacted the amount of forage remaining after grazing. The 30–20 cm grazing strategy produced the lowest values, possibly due to a higher frequency of grazing and forage removal. Conversely, the 40–20 cm treatment resulted in the highest forage mass, mainly stems. The quantity of remaining leaves after grazing is directly associated with photosynthetic capacity and regrowth potential, representing an indicator of pasture persistence [6]. While all grazing management strategies ensured a supply of Marandu palisagrass leaves post-grazing, the legume leaves were reduced, and there was a decrease in post-grazing mass. Post-grazing stem mass of Marandu was higher under the 40 cm pre-grazing height, reflecting longer rest periods and lower grazing frequency. Similar patterns were described by [18], who reported reduced grazing efficiency at a pre-grazing height of 35 cm compared to 25 cm. This is consistent with the findings of Alviarez et al. [12], who found that stem elongation in tropical grasses increases once they exceed 95% light interception.
Post-grazing leaf mass of Marandu palisadegrass varied mainly across evaluation periods, reflecting seasonal variations in plant growth and forage production. The 5 cm difference between post-grazing heights (15 vs. 20 cm) was apparently insufficient to produce consistent differences in the amount of leaf mass remaining after grazing. Higher leaf proportions were generally associated with periods of active growth, when faster leaf turnover and tiller renewal contribute to greater leaf presence in the residual canopy, whereas slower growth conditions tend to favor stem accumulation and leaf aging within the canopy [6,12]. Post-grazing dead material mass increased with taller pre-grazing heights (40 cm; Table 2), likely due to longer growth periods allowing more vegetal tissue senescence when compared to the 30 cm treatment.
Over time, there was a significant reduction in the presence of the legume in all defoliation strategies evaluated. Zamboin et al. [17], evaluating the same species and defoliation strategies, concluded that pastures with a height of 30–20 cm present the best canopy structure for grazing animals. These authors proposed sowing the legume annually or biennially to ensure its constant presence in the forage mass, as is already the case with other legumes in pastures [27].
Future studies should focus on long-term evaluations of Macrotyloma persistence under variable grazing pressures, its regrowth physiology in shaded environments, and the balance between canopy structure, light interception, and nitrogen dynamics. Such research will help to develop sustainable, productive, multispecies pastures in tropical livestock systems


5. Conclusions

Defoliation strategy strongly influences forage accumulation and species balance in mixed pastures of Marandu palisadegrass and the twining legume Macrotyloma axillare. Lower grazing frequency (40 cm pre-grazing height) increased the forage mass and leaf area index of the grass but also promoted stem accumulation and dead material, whereas higher grazing frequency (30 cm) favored leafier canopies and higher grass regrowth rates. Lenient defoliation (20 cm post-grazing height) improved post-grazing leaf retention and canopy stability, while severe defoliation (15 cm) increased stem presence. No single grazing strategy simultaneously optimized grass productivity and legume persistence. While lower grazing frequency and lenient defoliation improved canopy structure and grass leaf area, legume contribution was higher under specific combinations (30–20 and 40–15 cm) but declined over time under all strategies. Future studies should focus on adjusting grazing management seasonally, exploring alternative defoliation targets, and evaluating periodic reseeding or complementary establishment techniques to enhance the persistence of twining legumes in mixed tropical pastures.

Author Contributions

Conceptualization, L.G., W.T.d.M. and F.M.d.A.G.; Methodology, B.Z.U., L.G., W.T.d.M., T.R.K., S.S.Z., C.M.P.B. and F.M.d.A.G.; Validation, G.A.; Formal analysis, B.Z.U., L.G., W.T.d.M., T.R.K., S.S.Z., C.M.P.B. and G.A.; Investigation, B.Z.U., L.G., S.S.Z., C.M.P.B. and F.M.d.A.G.; Resources, L.G.; Data curation, B.Z.U., L.G., W.T.d.M., T.R.K., S.S.Z., C.M.P.B. and G.A.; Writing—original draft, B.Z.U., L.G., T.R.K., S.S.Z., C.M.P.B., G.A. and F.M.d.A.G.; Writing—review & editing, B.Z.U., L.G., W.T.d.M., S.S.Z., C.M.P.B., G.A. and F.M.d.A.G.; Supervision, F.M.d.A.G.; Project administration, L.G.; Funding acquisition, L.G. All authors have read and agreed to the published version of the manuscript.

Funding

The present study was financially supported by the Research Support Foundation of the State of São Paulo (FAPESP) [grant nº 2014/22580-1] and by the Coordination for the Improvement of Higher Education Personnel (CAPES), which provided a scholarship for the first and fifth authors.

Data Availability Statement

The data supporting the findings of this study are available from the corresponding author upon reasonable request.

Acknowledgments

The authors are grateful to the Instituto de Zootecnia and its staff for their operational support. During the preparation of this manuscript, the authors used ChatGPT (GPT-5.3, OpenAI, San Francisco, USA) to help summarize some parts. The authors have reviewed and edited the output and take full responsibility for the content of this publication.

Conflicts of Interest

The authors declare no conflicts of interest.

References

  1. ABIEC (Associação Brasileira das Indústrias Exportadoras de Carne). Beef Report 2025—Brazilian Beef Profile [Internet]. 2025. Available online: https://abiec.com.br/publicacoes/beef-report-2025-brazilian-beef-profile-2/ (accessed on 1 October 2025).
  2. dos Santos, C.A.; Krawulski, C.C.; Bini, D.; Filho, T.G.; Knob, A.; Medina, C.C.; Filho, G.A.; Nogueira, M.A. Reclamation status of a degraded pasture based on soil health indicators. Sci. Agric. 2015, 72, 195–202. [Google Scholar] [CrossRef]
  3. Boddey, R.M.; Casagrande, D.R.; Homem, B.G.C.; Alves, B.J.R. Forage legumes in grass pastures in tropical Brazil and likely impacts on greenhouse gas emissions: A review. Grass Forage Sci. 2020, 75, 357–371. [Google Scholar] [CrossRef]
  4. Homem, B.G.C.; de Lima, I.B.G.; Spasiani, P.P.; Guimarães, B.C.; Guimarães, G.D.; Bernardes, T.F.; Rezende, C.d.P.; Boddey, R.M.; Casagrande, D.R. N-fertiliser application or legume integration enhances N cycling in tropical pastures. Nutr. Cycl. Agroecosyst. 2021, 121, 167–190. [Google Scholar] [CrossRef]
  5. Depablos, L.; Homem, B.G.C.; Ferreira, I.M.; Bernardes, T.F.; Boddey, R.M.; Lara, M.A.S.; Casagrande, D.R. Nitrogen cycling in tropical grass-legume pastures managed under canopy light interception. Nutr. Cycl. Agroecosyst. 2021, 121, 51–67. [Google Scholar] [CrossRef]
  6. Da Silva, S.; Sbrissia, A.; Pereira, L. Ecophysiology of C4 Forage Grasses—Understanding Plant Growth for Optimising Their Use and Management. Agriculture 2015, 5, 598–625. [Google Scholar] [CrossRef]
  7. Taiz, L.; Zeiger, E.; Moller, I.M.; Murphy, A. Plant Physiology and Development, 6th ed.; Sinauer Associates is an imprint of Oxford University Press: Sunderland, MA, USA, 2014. [Google Scholar]
  8. Veasey, E.A.; Werner, J.C.; Colozza, M.T.; Freitas, T.D.; Lucena Marcia Aturi Cardeli Beisman, D.A.; Gerdes, L. Avaliação de caracteres morfológicos, fenológicos e agronômicos em leguminosas forrageiras tropicais visando a produção de sementes. Bol. Ind. Anim. 1999, 56, 109–125. [Google Scholar]
  9. Gerdes, L.; Barbosa, C.M.P.; Giacomini, A.A.; Mattos, W.T.; Gimenes, F.M.A.; Batista, K.; Uzan, B.Z. Introduction of forage legumes into Aruana Guineagrass pasture. Bol. Ind. Anim. 2020, 77, 1–10. [Google Scholar] [CrossRef]
  10. Lima, P.M.T.; Moreira, G.D.; Sakita, G.Z.; Natel, A.S.; Mattos, W.T.; Gimenes, F.M.A.; Gerdes, L.; McManus, C.; Abdalla, A.L.; Louvandini, H. Nutritional evaluation of the legume Macrotyloma axillare using in vitro and in vivo bioassays in sheep. J. Anim. Physiol. Anim. Nutr. 2017, 102, E669–E676. [Google Scholar] [CrossRef]
  11. Antunes, L.E.; Montagner, D.B.; Euclides, V.P.B.; Taira, C.d.A.Q.; Echeverria, J.R.; Nantes, N.N.; Junior, M.A.P.O. Intermittent stocking strategies for the management of Marandu palisade grass in the Brazilian Cerrado biome. Grassl. Sci. 2021, 68, 70–77. [Google Scholar] [CrossRef]
  12. Alviarez, L.A.D.; Homem, B.G.C.; Couto, P.H.D.; Dubeux, J.C.B.; Bernardes, T.F.; Casagrande, D.R.; Lara, M.A.S. Managing “Marandu” palisadegrass and calopo pastures based on light interception. Grass Forage Sci. 2020, 75, 447–461. [Google Scholar] [CrossRef]
  13. Quaggio, J.A.; Alcântara, P.B.; Cantarella, H.; Paulino, V.T.; Villa, M.R. Forrageiras. In Recomendação de Adubação e Calagem Para o Estado de São Paulo; Instituto Agronômico: Campinas, Brazil, 2022; p. 484. [Google Scholar]
  14. Allen, V.G.; Batello, C.; Berretta, E.J.; Hodgson, J.; Kothmann, M.; Li, X.; McIvor, J.; Milne, J.; Morris, C.; Peeters, A.; et al. An international terminology for grazing lands and grazing animals. Grass Forage Sci. 2011, 66, 2–28. [Google Scholar] [CrossRef]
  15. Barthram, G.T. Experimental techniques: The HFRO sward stick. In Hill Farming Research Organization; Bienal Report; HFRO: Scotland, UK, 1985. [Google Scholar]
  16. Ongaro, A.F.B.; Martuscello, J.A.; de Andrade Gimenes, F.M.; Batista, A.C.L.; Penteado, L.F.; Premazzi, L.M.; de Mattos, W.T.; Vieira, M.M.; da Costa, R.L.D.; Gerdes, L. Canopy height impact on legume mass and Megathyrsus maximus tiller dynamics in mixed pastures. Acta Agric. Scand. Sect. B—Soil Plant Sci. 2023, 73, 114–126. [Google Scholar]
  17. Zamboin, S.S.; Branco, R.H.; de Andrade Gimenes, F.M.; Barbosa, C.M.P.; de Mattos, W.T.; Batista, K.; Aferri, G.; Uzan, B.Z.; Gerdes, L. Canopy structure and forage mass of mixed pastures of Marandu palisadegrass and the legume Macrotyloma axillare managed under rotational stocking. Rev. Bras. Zootec. 2025, 54, e20240123. [Google Scholar] [CrossRef]
  18. Giacomini, A.A.; da Silva, S.C.; Sarmento, D.O.d.L.; Zeferino, C.V.; Júnior, S.J.S.; da Trindade, J.K.; Guarda, V.D.; Júnior, D.D.N. Growth of marandu palisadegrass subjected to strategies of intermittent stocking. Sci. Agric. 2009, 66, 733–741. [Google Scholar] [CrossRef]
  19. Terra, S.; De Andrade Gimenes, F.M.; Giacomini, A.A.; Gerdes, L.; Manço, M.X.; De Mattos, W.T. Seasonal alteration in sward height of Marandu palisade grass (Brachiaria brizantha) pastures managed by continuous grazing interferes with forage production. Crop Pasture Sci. 2020, 71, 285–293. [Google Scholar] [CrossRef]
  20. Gimenes, F.M..A.; da Silva, S.C.; Fialho, C.A.; Gomes, M.B.; Berndt, A.; Gerdes, L.; Colozza, M.T. Ganho de peso e produtividade animal em capim-marandu sob pastejo rotativo e adubação nitrogenada. Pesqui. Agropecu. Bras. 2011, 46, 751–759. [Google Scholar] [CrossRef]
  21. Gomes, F.K.; Oliveira, M.D.B.L.; Homem, B.G.C.; Boddey, R.M.; Bernardes, T.F.; Gionbelli, M.P.; Lara, M.A.S.; Casagrande, D.R. Effects of grazing management in brachiaria grass-forage peanut pastures on canopy structure and forage intake. J. Anim. Sci. 2018, 96, 3837–3849. [Google Scholar] [CrossRef]
  22. Boval, M.; Sauvant, D. Ingestive behaviour of grazing ruminants: Meta-analysis of the components linking bite mass to daily intake. Anim. Feed. Sci. Technol. 2021, 278, 115014. [Google Scholar] [CrossRef]
  23. Batista, A.C.L.; Barbosa, C.M.P.; Penteado, L.F.; Ongaro, A.F.B.; da Costa, R.L.D.; Simili, F.F.; Ribeiro, E.G.; de Mattos, W.T.; Gerdes, L.; Gimenes, F.M.d.A. Sheep performance and forage quality in grass-legume pastures with different canopy heights. Anim. Prod. Sci. 2024, 64, AN23391. [Google Scholar] [CrossRef]
  24. Thomas, R.J. The role of the legume in the nitrogen cycle of productive and sustainable pastures. Grass Forage Sci. 1992, 47, 133–142. [Google Scholar] [CrossRef]
  25. Thomas, R.J. Roles of legumes in providing N for sustainable tropical pasture systems. Plant Soil 1995, 174, 103–118. [Google Scholar] [CrossRef]
  26. Oliveira, A.B. Persistence of Macrotyloma Axillare under Continuous Stocking Management. Master’s Thesis, University of São Paulo (USP), São Paulo, Brazil, 2023. [Google Scholar]
  27. Garzon, J.; Vendramini, J.M.B.; Silveira, M.L.; Dubeux, J.C.B.; Sollenberger, L.E.; Liao, H.; da Silva, H.M.S.; Gomes, V.C.; Oliveira, H.M.R.; Moriel, P. Aeschynomene overseeding and nitrogen fertilization effects in bahiagrass litter decomposition. Agron. J. 2024, 116, 1455–1465. [Google Scholar] [CrossRef]
Figure 1. Monthly rainfall and temperature, Nova Odessa, state of São Paulo, Brazil, from October 2017 to February 2019.
Grasses 05 00015 g001
Figure 2. Monthly water balance from October 2017 to February 2019, considering a soil water storage capacity of 50 mm.
Grasses 05 00015 g002
Figure 3. Schematic layout of the experimental area showing the allocation of grazing management strategies under a randomized block design.
Grasses 05 00015 g003
Figure 4. Forage accumulation rate of Marandu grass (a) and its leaf (b) and stem (c) components in mixed pastures subjected to defoliation (of different frequencies and intensities) from October 2017 to February 2019. Different lowercase letters between canopy pre-grazing heights are different according to Student’s t-test (p < 0.05). Vertical bars correspond to the standard error of the mean.
Grasses 05 00015 g004
Figure 5. Forage accumulation rate of the legume Macrotyloma and its components in mixed pastures subjected to grazing management strategies defined by combinations of pre- and post-grazing heights (30–15, 30–20, 40–15 and 40–20 cm). These combinations represent the interaction between defoliation frequency and defoliation intensity. Different lowercase letters indicate differences among strategies according to Student’s t-test (p < 0.05). Vertical bars correspond to the standard error of the mean.
Grasses 05 00015 g005
Figure 6. Pre-grazing forage mass of grass leaves (a) and stems (b) of Marandu palisadegrass in mixed pastures subjected to different grazing management strategies from October 2017 to February 2019. Lowercase letters compare means between defoliation strategies within periods according to Student’s t-test (p < 0.05). Vertical bars correspond to the standard error of the mean.
Grasses 05 00015 g006
Figure 7. Pre-grazing forage mass of the legume Macrotyloma (a) and its leaves (b) in mixed pastures subjected to different grazing management strategies from October 2017 to February 2019. Lowercase letters compare means between GMS within periods according to Student’s t-test (p < 0.05). Vertical bars correspond to the standard error of the mean.
Grasses 05 00015 g007
Table 1. Pre-grazing dead material mass in mixed pastures subjected to defoliation frequencies and intensities from October 2017 to February 2019.
PeriodsPre-Grazing Forage Mass of Dead Material
(kg DM/ha)
Oct–Nov/171806.4 (152.66) A
Dec/171590.2 (152.66) AB
Jan/181323.2 (159.18) BC
Feb/181325.6 (221.72) ABC
Mar/181454.1 (159.16) AB
Nov/181160.8 (219.30) BC
Dec/18804.9 (286.45) C
Jan–Feb/191188.2 (165.23) BC
Uppercase letters in the column compare means between periods. Values in parentheses correspond to the standard error of the mean.
Table 2. Pre-grazing Leaf Area Index (LAI) of Marandu palisadegrass leaves in mixed pastures subjected to frequencies and intensities of defoliation from October 2017 to February 2019.
Pre-grazing Leaf Area Index (LAI)
Intensities
Period15 cm20 cmMean
Oct–Nov/173.6 (0.29) Abc2.9 (0.29) Ac3.2 (0.20)
Dec/173.3 (0.29) Bc4.4 (0.29) Ab3.9 (0.20)
Jan/184.4 (0.31) Bab5.4 (0.29) Aa4.9 (0.21)
Feb/185.1 (0.46) Aa4.9 (0.37) Aab5.0 (0.29)
Mar/183.8 (0.29) Abc4.6 (0.31) Aab4.2 (0.21)
Nov/184.4 (0.46) Aab4,0 (0.36) Ab4.2 (0.29)
Dec/183.3 (0.58) Abc4.1 (0.50) Ab3.7 (0.38)
Jan–Feb/194.8 (0.38) Aa3.9 (0.31) Ab4.3 (0.24)
Mean4.1 (0.13)4.3 (0.11)
Means followed by different uppercase letters in the same row or different lowercase letters in the same column differ from each other (p < 0.05). Values in parentheses correspond to the standard error of the mean.
Table 3. Pre-grazing Leaf Area Index of legume leaves in mixed pastures subjected to defoliation frequencies and intensities from October 2017 to February 2019.
Frequencies
Intensities30 cm40 cmMean
Oct–Nov/17
15 cm0.6 (0.17) a’0.7 (0.17) a’0.8 (0.08)
20 cm0.9 (0.17) a’1.1 (0.17) a’
Dec/17
15 cm0.3 (0.17) a’0.5 (0.17) a’0.5 (0.08)
20 cm0.6 (0.17) a’0.7 (0.17) a’
Jan/18
15 cm1.0 (0.17) b’1.1 (0.20) b’1.3 (0.09)
20 cm1.1 (0.17) b’1.9 (0.17) a’
Feb/18
15 cm0.1 (0.17) c’2.2 (0.34) a’0.8 (0.12)
20 cm0.1 (0.20) c’0.8 (0.24) b’
Mar/18
15 cm0.1 (0.17) a’0.1 (0.17) a’0.1 (0.09)
20 cm0.2 (0.17) a’0.0 (0.20) a’
Nov/18
15 cm0.0 (0.17) a’0.1 (0.34) a’0.0 (0.12)
20 cm0.0 (0.17) a’0.0 (0.24) a’
Dec/18
15 cm0.1 (0.34) a’0.0 (0.34) a’0.0 (0.16)
20 cm0.0 (0.24) a’0.0 (0.34) a’
Jan–Feb/19
15 cm0.0 (0.20) b’1.0 (0.24) a’0.2 (0.10)
20 cm0.0 (0.20) b’0.0 (0.17) b’
Mean0.3 (0.06) 0.6 (0.07)
Means followed by different lowercase letters followed by ’ within period (p < 0.05). Values in parentheses correspond to the standard error of the mean.
Table 4. Post-grazing forage mass of Marandu grass in mixed pastures subjected to frequencies and intensities of defoliation from October 2017 to February 2019.
Post-Grazing Forage Mass (kg DM/ha)
Frequencies
Intensities30 cm40 cmMean
Oct–Nov/17
15 cm1875.6 (265.83) a’1763.3 (265.83) a’1832.6 (132.91)
20 cm1613.6 (265.83) a’2077.8 (265.83) a’
Dec/17
15 cm1855.7 (265.83) bc’1532.8 (265.83) c’2058.8 (132.91)
20 cm2134.6 (265.83) ab’2712.1 (265.83) a’
Jan/18
15 cm3279.5 (265.83) ab’2835.0 (308.06) ab’3114.4 (138.50)
20 cm2647.6 (265.83) b’3695.4 (265.83) a’
Feb/18
15 cm3432.6 (308.07) a’3284.5 (537.41) a’3174.1 (196.69)
20 cm3186.0 (307.93) a’2793.3 (378.42) a’
Mar/18
15 cm1789.6 (265.83) b’2605.3 (265.83) a’2289.0 (132.91)
20 cm2197.7 (265.83) ab’2563.3 (265.83) a’
Apr/18
15 cm3031.4 (378.43) a’2368.3 (537.30) a’2491.4 (223.47)
20 cm2481.2 (265.83) a’2084.7 (537.44) a’
Nov/18
15 cm1974.2 (265.83) b’3308.8 (538.77) a’2540.0 (190.56)
20 cm2274.9 (265.83) ab’2602.2 (378.81) ab’
Dec/18
15 cm2964.0 (265.83) a’1934.5 (308.38) b’2234.5 (143.76)
20 cm1903.5 (265.83) b’2136.0 (308.16) ab’
Mean2415.1 (63.75)2518.6 (89.49)
Means followed by different lowercase letters followed by ’ within period and lowercase letters in columns differ from each other (p < 0.05). Values in parentheses correspond to the standard error of the mean.
Table 5. Post-grazing legume, legume leaf and legume branch masses and Marandu leaf mass in mixed pastures subjected to frequencies and severities of defoliation from October 2017 to February 2019.
Post-Grazing Mass (kg DM/ha)
PeriodsLegumeLegume LeafLegume BranchMarandu Leaf
Oct–Nov/17270.8 (39.11) A76.7 (12.15) A 194.9 (28.51) A935.8 (84.30) BC
Dec/17103.9 (39.11) B31.8 (12.15) B 72.1 (28.51) B970.4 (84.30) B
Jan/18100.7 (40.51) B24.2 (12.55) B 75.9 (29.55) B1419.8 (87.88) A
Feb/1839.1 (56.13) B8.9 (17.35) B 37.9 (40.08) B1071.2 (125.22) B
Mar/1823.7 (39.11) B12.5 (12.15) B 11.2 (28.51) B1047.7 (84.30) B
Nov/1834.3 (63.79) B10.0 (19.74) B 21.2 (45.51) B845.2 (142.12) BC
Dec/180.0 (54.98) B0.0 (16.91) B 0.0 (40.17) B1023.2 (121.10) B
Jan–Feb/191.0 (42.25) B0.0 (13.12) B 1.1 (30.68) B791.1 (91.23) C
Means followed by different uppercase letters in the same column differ from each other (p < 0.05). Values in parentheses correspond to the standard error of the mean.
Table 6. Post-grazing forage mass of Marandu palisadegrass stems in mixed pastures subjected to defoliation frequencies and intensities from October 2017 to February 2019.
Post-Grazing Stem Mass (kg DM/ha)
PeriodIntensitiesMean
15 cm20 cm
Oct–Nov/17882.9 (134.60) Ad903.9 (134.60) Ac893.4 (95.17)
Dec/17936.9 (134.60) Acd1249.2 (134.60) Abc1093.0 (95.17)
Jan/181719.2 (143.15) Aa1699.5 (134.60) Aa1709.3 (98.24)
Feb/182200.4 (212.17) Aa1344.9 (164.81) Bab1772.7 (134.36)
Mar/181234.9 (134.60) Abc1247.6 (134.60) Aab1241.3 (95.17)
Nov/181694.9 (223.89) Aab1508.4 (204.27) Aab1601.6 (152.27)
Dec/181990.0 (202.36) Aab1200.3 (159.42) Bbc1595.2 (129.57)
Jan–Feb/191631.4 (142.82) Aa1285.5 (142.75) Bbc1458.5 (100.96)
Mean1536.3 (43.80) 1304.9 (35.45)
Means followed by different uppercase letters in the same row or different lowercase letters in the same column differ from each other (p < 0.05). Values in parentheses correspond to the standard error of the mean.
Table 7. Post-grazing forage mass of dead material in mixed pastures subjected to defoliation intensities and frequencies from October 2017 to February 2019.
Post-Grazing Forage Mass of Dead Material (kg DM/ha)
IntensitiesFrequencies
Periods15 cm20 cm30 cm40 cmMean
Oct–Nov/171536.0 Ac2070.5 Aabc1930.5 Aabc1676.0 Ac1803.2
(198.73)(198.73)(198.73)(198.73)(140.52)
Dec/171787.0 Abc2205.9 Aab1620.7 Bcd2372.1 Aab1996.4
(198.73)(198.73)(198.73)(198.73)(140.52)
Jan/182349.0 Aab1674.0 Bbc2182.3 Aab1840.6 Abc2011.5
(215.28)(198.73)(198.73)(215.28)(146.49)
Feb/181827.2 Abc1586.7 Ac1224.6 Bd2189.2 Aabc1706.9
(329.47)(230.21)(230.21)(326.18)(200.08)
Mar/181826.8 Abc1814.5 Aabc1807.1 Abc1834.2 Abc1820.7
(198.73)(198.73)(198.73)(198.73)(140.52)
Nov/181923.4 Aabc2566.9 Aa2525.6 Aa1964.7 Aabc2245.2
(350.91)(318.03)(244.97)(401.43)(236.80)
Dec/182796.5 Aa1854.2 Babc1672.9 Bbcd2977.7 Aa2325.3 a
(318.17)(245.04)(198.73)(351.33)(201.82)
Jan–Feb/192698.1 Aa1856.2 Babc1693.1 Bbc2861.3 Aa2277.2
(215.30)(215.27)(198.73)(230.27)(152.08)
Mean2093.0 1953.6 1832.1 2214.5
(92.16)(81.30)(74.75)(97.44)
Means followed by different uppercase letters in the same row or different lowercase letters in the same column differ from each other (p < 0.05). Values in parentheses correspond to the standard error of the mean.
Table 8. Post-grazing leaf area index of Marandu grass and Macrotyloma legume in mixed pastures subjected to defoliation frequencies and intensities from October 2017 to February 2019.
Post-Grazing Leaf Area Index
PeriodsMarandu PalisadegrassMacrotyloma Legume
Oct–Nov/171.5 (0.17) BC0.1 (0.02) A
Dec/171.7 (0.17) BC0.1 (0.02) AB
Jan/182.3 (0.17) A0.1 (0.02) BC
Feb/181.8 (0.24) AB0.0 (0.03) BC
Mar/181.9 (0.17) AB0.0 (0.02) BC
Nov/181.1 (0.26) CD0.0 (0.03) BC
Dec/181.7 (0.22) ABC0.0 (0.03) BC
Jan–Feb/190.8 (0.17) D0.0 (0.02) C
Means followed by different uppercase letters in the same column differ from each other (p < 0.05). Values in parentheses correspond to the standard error of the mean.
Disclaimer/Publisher’s Note: The statements, opinions and data contained in all publications are solely those of the individual author(s) and contributor(s) and not of MDPI and/or the editor(s). MDPI and/or the editor(s) disclaim responsibility for any injury to people or property resulting from any ideas, methods, instructions or products referred to in the content.