Article

Cattle Preference in Warm-Season Grasses: Effects of Seasonal Growth, Leaf Morphology, and Leaf Anatomy

by
Florencia Marcón
1,†,
Elio L. Di Lorenzo
2,†,
Myriam C. Peichoto
1 and
Carlos A. Acuña
1,*
1
Instituto de Botánica del Nordeste, Consejo Nacional de Investigaciones Científicas y Técnicas, Facultad de Ciencias Agracias, Universidad Nacional del Nordeste, Corrientes 3400, Argentina
2
Instituto Nacional de Tecnología Agropecuaria, Estación Experimental Agropecuaria Colonia Benítez, Colonia Benítez 3505, Argentina
*
Author to whom correspondence should be addressed.
These authors contributed equally to this work.
Grasses 2025, 4(4), 40; https://doi.org/10.3390/grasses4040040
Submission received: 8 August 2025 / Revised: 22 September 2025 / Accepted: 28 September 2025 / Published: 9 October 2025

Abstract

Warm-season grasses are the main source of feed in tropical and subtropical beef cattle production systems. The objective was to assess cattle preference among three warm-season grasses and explore its relationship with forage yield and plant structural traits. The three species were cultivated in 2 × 2 m plots using a completely randomized design. Cattle preference was evaluated in spring (December 2016 and 2017), summer (March 2017), and autumn (May 2017) using six Braford steers that grazed the plots for 4 h on two consecutive days. Pre-grazing forage yield, plant height, leaf-blade length, leaf-blade width, and the proportions of five leaf tissues at three leaf regions were measured at each date. Cattle preference was variable among the three species and evaluation dates. Paspalum atratum exhibited the highest pre-grazing forage yield, and constituted the tallest plants with the longest leaves during the summer. Urochloa brizantha showed the greatest proportion of vascular bundle sheath (17–30% at the midrib region, 25–31% at the interveinal region and 14–23% at the margin region) and P. atratum exhibited the greatest number of primary vascular bundle. Cattle preference was negatively correlated with the number of primary vascular bundle, pre-grazing forage yield, plant height and leaf-blade length.

1. Introduction

In pasture-based systems, intake could be limited by forage preference, which is defined as the acceptance of a given forage when two or more are available [1,2,3]. Allison [4] reported that unaccepted forages provoked a 61% decrease in intake while preferred forage increased it by around 30%. Morphological, anatomical, or external characteristics of the pasture along with plant maturity are some aspects that could alter animal preference [1,5,6,7,8].
Warm-season grasses are the main feed source in tropical and subtropical beef cattle production systems. These species exhibit a high growth rate during the warm season and are highly variable in morphology and growth habits [9]. These have an impact on the vertical structure of the canopy, which in turn affects its acceptance by cattle since more homogeneous canopies with a greater proportion of leaves are generally preferred [1,10,11]. The high growth rate of these species increases the proportion of stems and accelerates maturity, thereby affecting animal preference [1,9]. Cattle tend to select species with greater leaf/stem ratio since leaves are better-quality tissue [12,13]. Regarding plant morphology, it was observed that plant height, leaf-blade length, and leaf flexibility had an impact on animal preference [14,15].
Leaf anatomy of C4 grasses is characterized by a thick-walled parenchyma bundle sheath around each vascular bundle called the Kranz sheath. This structure increases the proportion of lignified tissues, in comparison with C3 grasses, and with that, chewing and rumination times also increase, which could limit intake [10]. Akin and Burdick [16] reported differences in the leaf tissue proportion of C4 grasses and its role in degradation by rumen microorganisms; however, its impact on cattle preference was not tested. Recently, the authors of [15] observed differences in leaf tissue proportion and the number of vascular bundles between accessions of the same species. In addition, the authors found that cattle preference was negatively correlated with the proportion of leaf-supporting tissues and the number of vascular bundles. Based on the abovementioned points and to make better management decisions, it would be interesting and useful to identify the main traits in leaf anatomy, leaf morphology and productivity that potentially interact to affect cattle preference in warm-season grasses.
Among the most cultivated warm-season grasses in tropical and subtropical regions are the genera Urochloa, Megathrysus, Paspalum, Cenchrus and Chloris [17]. In these regions, forage mixture is commonly used since it increases forage availability, improves the quality of forage, extends the growing period of a pasture, provides flexibility to environmental conditions, reduces erosion, and improves cattle preference. However, due to the fact that species vary in forage yield, growing rate, morphology and leaf anatomy, some of them may be more preferred by cattle [9]. This could have an impact on the persistence of the selected species, hence knowing which species are more preferred and which forage attributes are involved could allow us to define management strategies more effectively. For example, in P. atratum, it was observed during the warm season that cattle preferred shorter plants with shorter and more flexible leaves due to a lower proportion of structural tissues and fewer primary vascular bundles [15]. Considering the increasing use of forage mixture, it would be relevant to evaluate the cattle preference, leaf morphology and leaf anatomy of Urochloa brizantha, Chloris gayana and Paspalum atratum. U. brizantha is one of the most cultivated warm-season grasses in tropical and subtropical South America [18]. It has adapted to poor, acidic soils and has a high forage yield. Chloris gayana is widely cultivated in subtropical regions with limited rainfall (300–700 mm) and salty soils [19,20]. P. atratum is cultivated in waterlogged infertile soils of tropical and subtropical regions [21,22]. These three species from different genera may be used to represent the warm-season perennial grasses typically used for forage.
The aims of this study were to (i) evaluate cattle preference among Urochloa brizantha, Chloris gayana and Paspalum atratum; (ii) evaluate morphological and anatomical leaf characteristics and (iii) determine the relationship among the evaluated traits.

2. Materials and Methods

2.1. Plant Material and Experimental Site

Paspalum atratum cv Cambá, Urochloa brizantha cv Marandú and Chloris gayana cv Callide were used in this study. Seeds of the three species were sown in the greenhouse of the Faculty of Agronomy–National University of the Northeast located in Corrientes, Argentina, in August 2015. Seedlings with at least three leaves were transplanted to planting trials. On 25 November 2015, these plants were planted into the experimental field of Colonia Benitez Experimental Station, National Institute of Agriculture Technology located in Colonia Benitez (27°19′23.68″ S and 58°57′17.73″ W), Chaco, Argentina, in 4 m2 plots (2 × 2 m) using a completely randomized design with four replicates. The plots constituted of 36 plants spaced 30 cm between them and 1.5 m between plots. The experimental site has a sub-humid to humid subtropical climate with a mean temperature of 21.5°, an annual mean rainfall of 1300 mm (INTA), medium-textured soil with flat topography, pH 5, a P concentration of 29 mg kg−1 and an organic matter concentration of 2 mg kg−1 [23]. In February 2017, the three species were fertilized with 50 kg N ha−1.

2.2. Forage Yield and Cattle Preference

Forage yield of each cultivar was evaluated before the grazing event in the spring (December 2016 and 2017), summer (March 2017) and autumn (May 2017). Forage of each cultivar was harvested at 10 cm stubble height from a 50 × 50 cm square quadrant in the center of each plot. The fresh material was collected and weighed, and a subsample of approximately 300 g was taken. The subsample was weighed and dried at 60 °C for 48 h to obtain the proportion of dry matter and to determine the pre-grazing forage yield of each cultivar.
Cattle preference was evaluated in a three-step process as described by the authors of [15]. First, pre-grazing forage yield of the three species was determined as per the method mentioned above. Second, the plots were grazed by a group of six steers (330–370 kg), at the same time, for 4 h on two consecutive days using the mob-stocking method (a method of stocking at a high grazing pressure for a short time). Finally, the post-grazing forage yield was measured as described previously. The area under study (plots + space between plots) was 168 m2, enclosed by an electric fence. The difference between pre-grazing forage yield and post-grazing forage yield was determined and the proportion of forage that disappeared was obtained. After each grazing event and at the end of the winter season, all plots were staged to a 10 cm stubble height.

2.3. Morphological and Leaf Anatomy Evaluations

Plant height, leaf-blade length and leaf-blade width were measured in the spring (December 2016 and 2017), summer (March 2017) and autumn (May 2017) before pre-grazing forage yield evaluation. Plant height (cm) was measured from the base of the plant to the top of the canopy without extending leaf blades at four different points in the plot. Leaf-blade length (cm) was measured from the ligule to the apex of the fourth youngest fully expanded leaves from four different plants, and leaf-blade width (mm) was measured at the widest point of the leaf blade.
The leaf tissue proportion of the three species was determined. Two to three leaf blades (the second youngest leaf with exposed ligule) from vegetative tillers were collected from three central plants of each plot in spring (December 2016 and 2017), summer (March 2017) and autumn (May 2017) before the pre-grazing forage yield evaluation. These leaves were fixed in FAA (formaldehyde/glacialacetic acid/ethanol) solution for 72 h and subsequently preserved in 70% ethanol until analysis [24]. Leaf transversal sections were performed by hand with steel blades, from the middle to the basal portion of the leaf. Some of these sections were stained with astra blue-safranin [25]. Phloroglucinol and chlorhydric acid reaction [24] and toluidine blue solution [26] were used to determine the presence of lignin in the cell walls. The images of the transversal leaf section were obtained using a Leica DMLB2 compound microscope (Leica) equipped with a digital camera. The other transversal sections were dehydrated in acetonic series, dried to the critical point, and metalized with gold/palladium to be analyzed using a scanning electron microscope (SEM Jeol LV 5800). Images from the midrib, interveinal and marginal regions were acquired and analyzed using ImageJ 1.53k software [27]. For the analysis of the images in ImageJ, a spatial calibration and measurement procedure was conducted according to the methodology proposed by Gonzalez [28]. We determined the areas of the epidermis and the bulliform cells, and calculated the sum of parenchyma and chlorenchyma area, the sum of xylem and sclerenchyma area (lignified tissues), and the sum of the areas of the bundle sheath. Tissue proportions were calculated as TP = (TA/LA)100, where TP = the proportion of each tissue, TA = the tissue area, and LA = the leaf area measured in the images. Furthermore, the number of first-order vascular bundles in the interveinal and midrib region and the distance among primary vascular bundle from the interveinal region were determined.

2.4. Statistical Analysis

All data generated were analyzed using the software InfoStat version 2020 [29] as a completely randomized design. Mean, analysis of variance (ANOVA) and means separation by Fisher’s least significant difference test were calculated. The significance of the interaction between species and evaluation date was determined. A principal component analysis (PCA) and a biplot graphical representation were conducted considering all agronomic, morphologic and anatomical traits evaluated previously. The graphical representation of the biplot was generated using the ggbiplot, ggplot2 3.4.3 and ggfortify 0.4.16 packages in R. The variance of the principal components and the accumulated variance were considered to graph the biplot. These analyses were conducted to join all evaluated traits and determine if there were variables that better explained the observed variation, and to establish which traits were more related. Furthermore, a Pearson correlation test was conducted among cattle preference and all evaluated characteristics.

3. Results

3.1. Forage Yield and Cattle Preference

A significant interaction species × evaluation date was observed for forage yield before grazing (p < 0.05). Upon analyzing spring forage yield over two years (December 2016 and 2017), non-significant differences between species were observed (p > 0.05). However, significant differences among species were observed during the summer and autumn (Figure 1). P. atratum exhibited two times more biomass than U. brizantha and C. gayana during the summer (March 2017), while in autumn (May 2017), U. brizantha showed the greatest value. Summer forage yield was three times more than that of autumn (Figure 1).
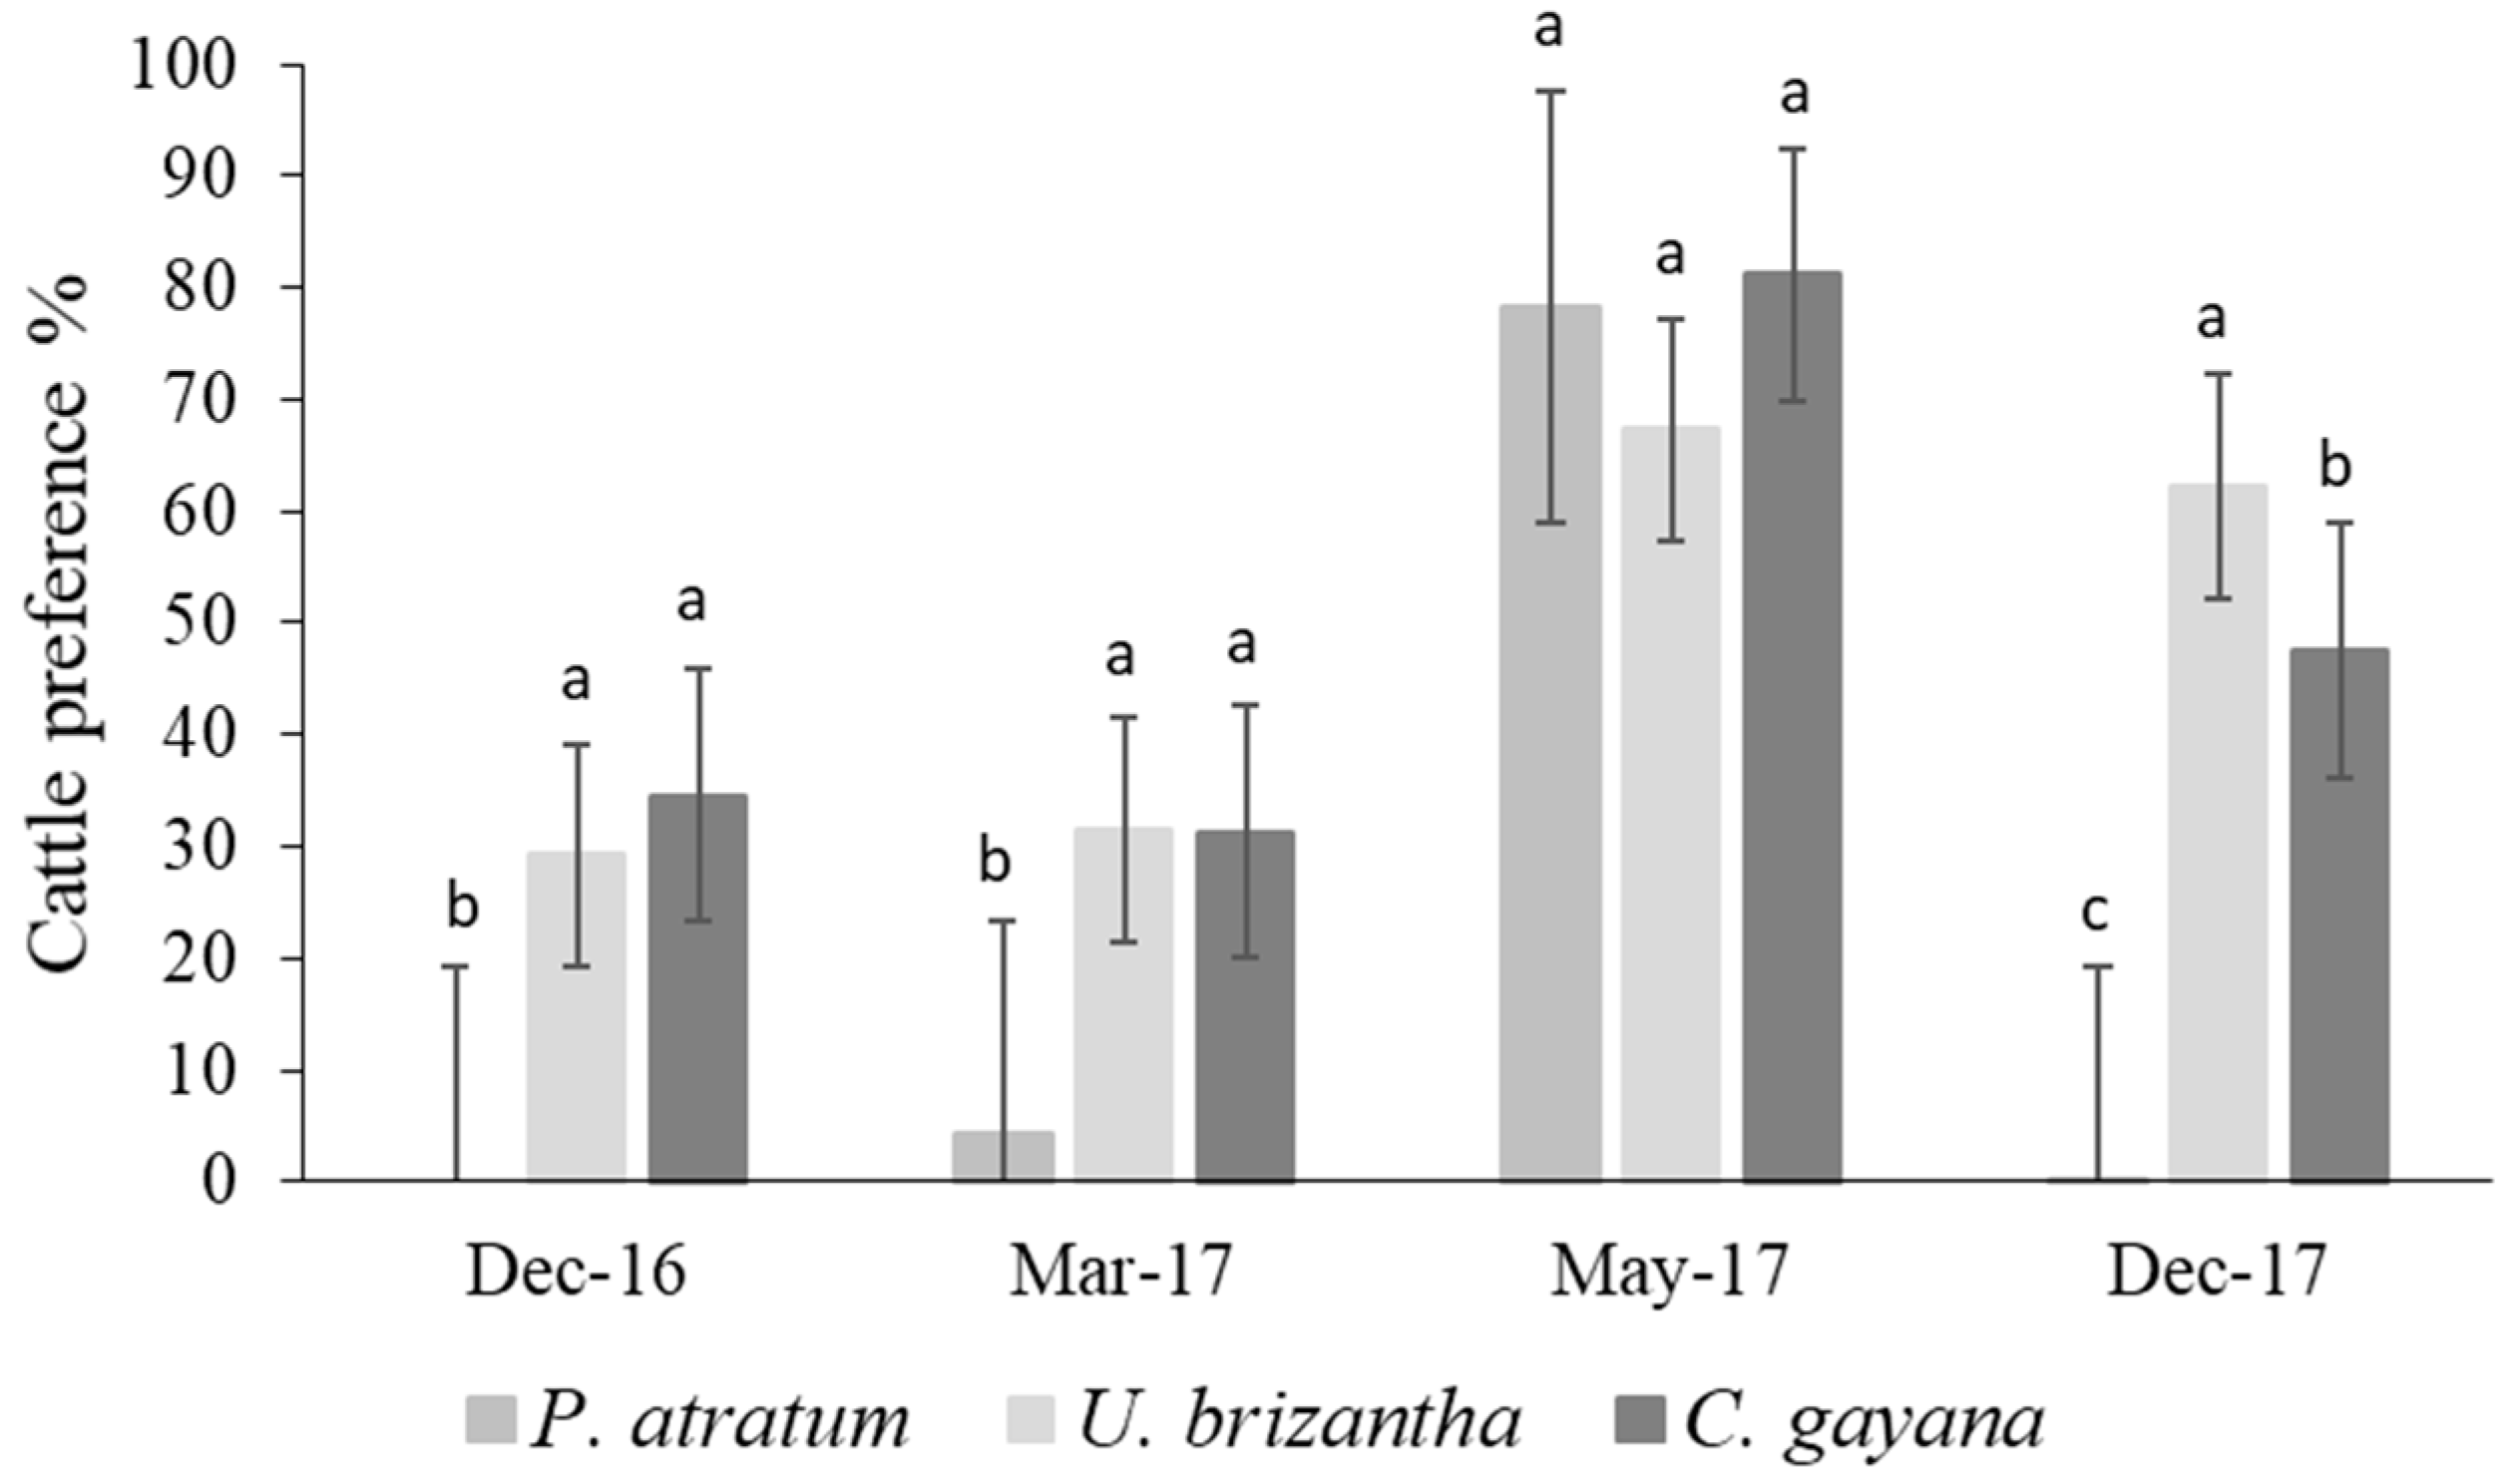
The interaction species × evaluation date was significant for cattle preference (p < 0.001), so this trait was evaluated per date. The amount of forage consumed during the spring and summer (December 2016 and 2017 and March 2017) was greater for U. brizantha and C. gayana (around 40% more) (Figure 2); however, in autumn, the three species were equally consumed. The average proportion of biomass consumed during autumn was 75% while during the spring and summer it was between 21 and 36%.

3.2. Morphological Evaluations

A significant correlation between species and evaluation date was observed for the three morphological traits studied (p < 0.001). Plant height, leaf-blade length and leaf-blade width were greater during the spring and summer. Significant differences among species were detected for all evaluated traits during the four dates, except plant height tested in autumn. During the spring (December 2016 and 2017) and summer (March), P. atratum exhibited the tallest plants (Table 1). Regarding leaf-blade length, P. atratum showed the longest leaves and U. brizantha the shortest during the four evaluated dates (Table 1). P. atratum and U. brizantha exhibited the widest leaves during all evaluated dates.

3.3. Proportion of Leaf Tissues

A significant interaction between species and evaluation dates was observed for (p < 0.05) the proportion of epidermal tissues at the midrib region, the proportion of bulliform cells at the midrib and margin regions, the proportion of parenchymatic tissues at the midrib and interveinal regions, the proportion of bundle sheath at the three regions studied and the proportion of lignified tissues at the margin region. In addition, significant differences among species were detected for all traits during the four evaluated dates, except for the proportion of epidermal tissues at the interveinal region and the proportion of bulliform cells at the midrib region evaluated in May (Table 2). U. brizantha and P. atratum exhibited the greatest proportion of epidermis at the midrib and margin regions, respectively, during the four dates. P. atratum showed the lowest proportion of bulliform cells at the interveinal and margin regions; however, it exhibited the greatest proportion of parenchymatic tissues at the three evaluated regions during the four dates (Table 2).
U. brizantha showed a seven times higher proportion of bundle sheath at the midrib region than P. atratum and double at the interveinal and margin regions. In addition, P. atratum was characterized by having the least proportion of lignified tissues at the three leaf regions studied and during the four evaluated dates. Chloris gayana and Urochloa brizantha exhibited the highest values of lignified tissue in the marginal region.
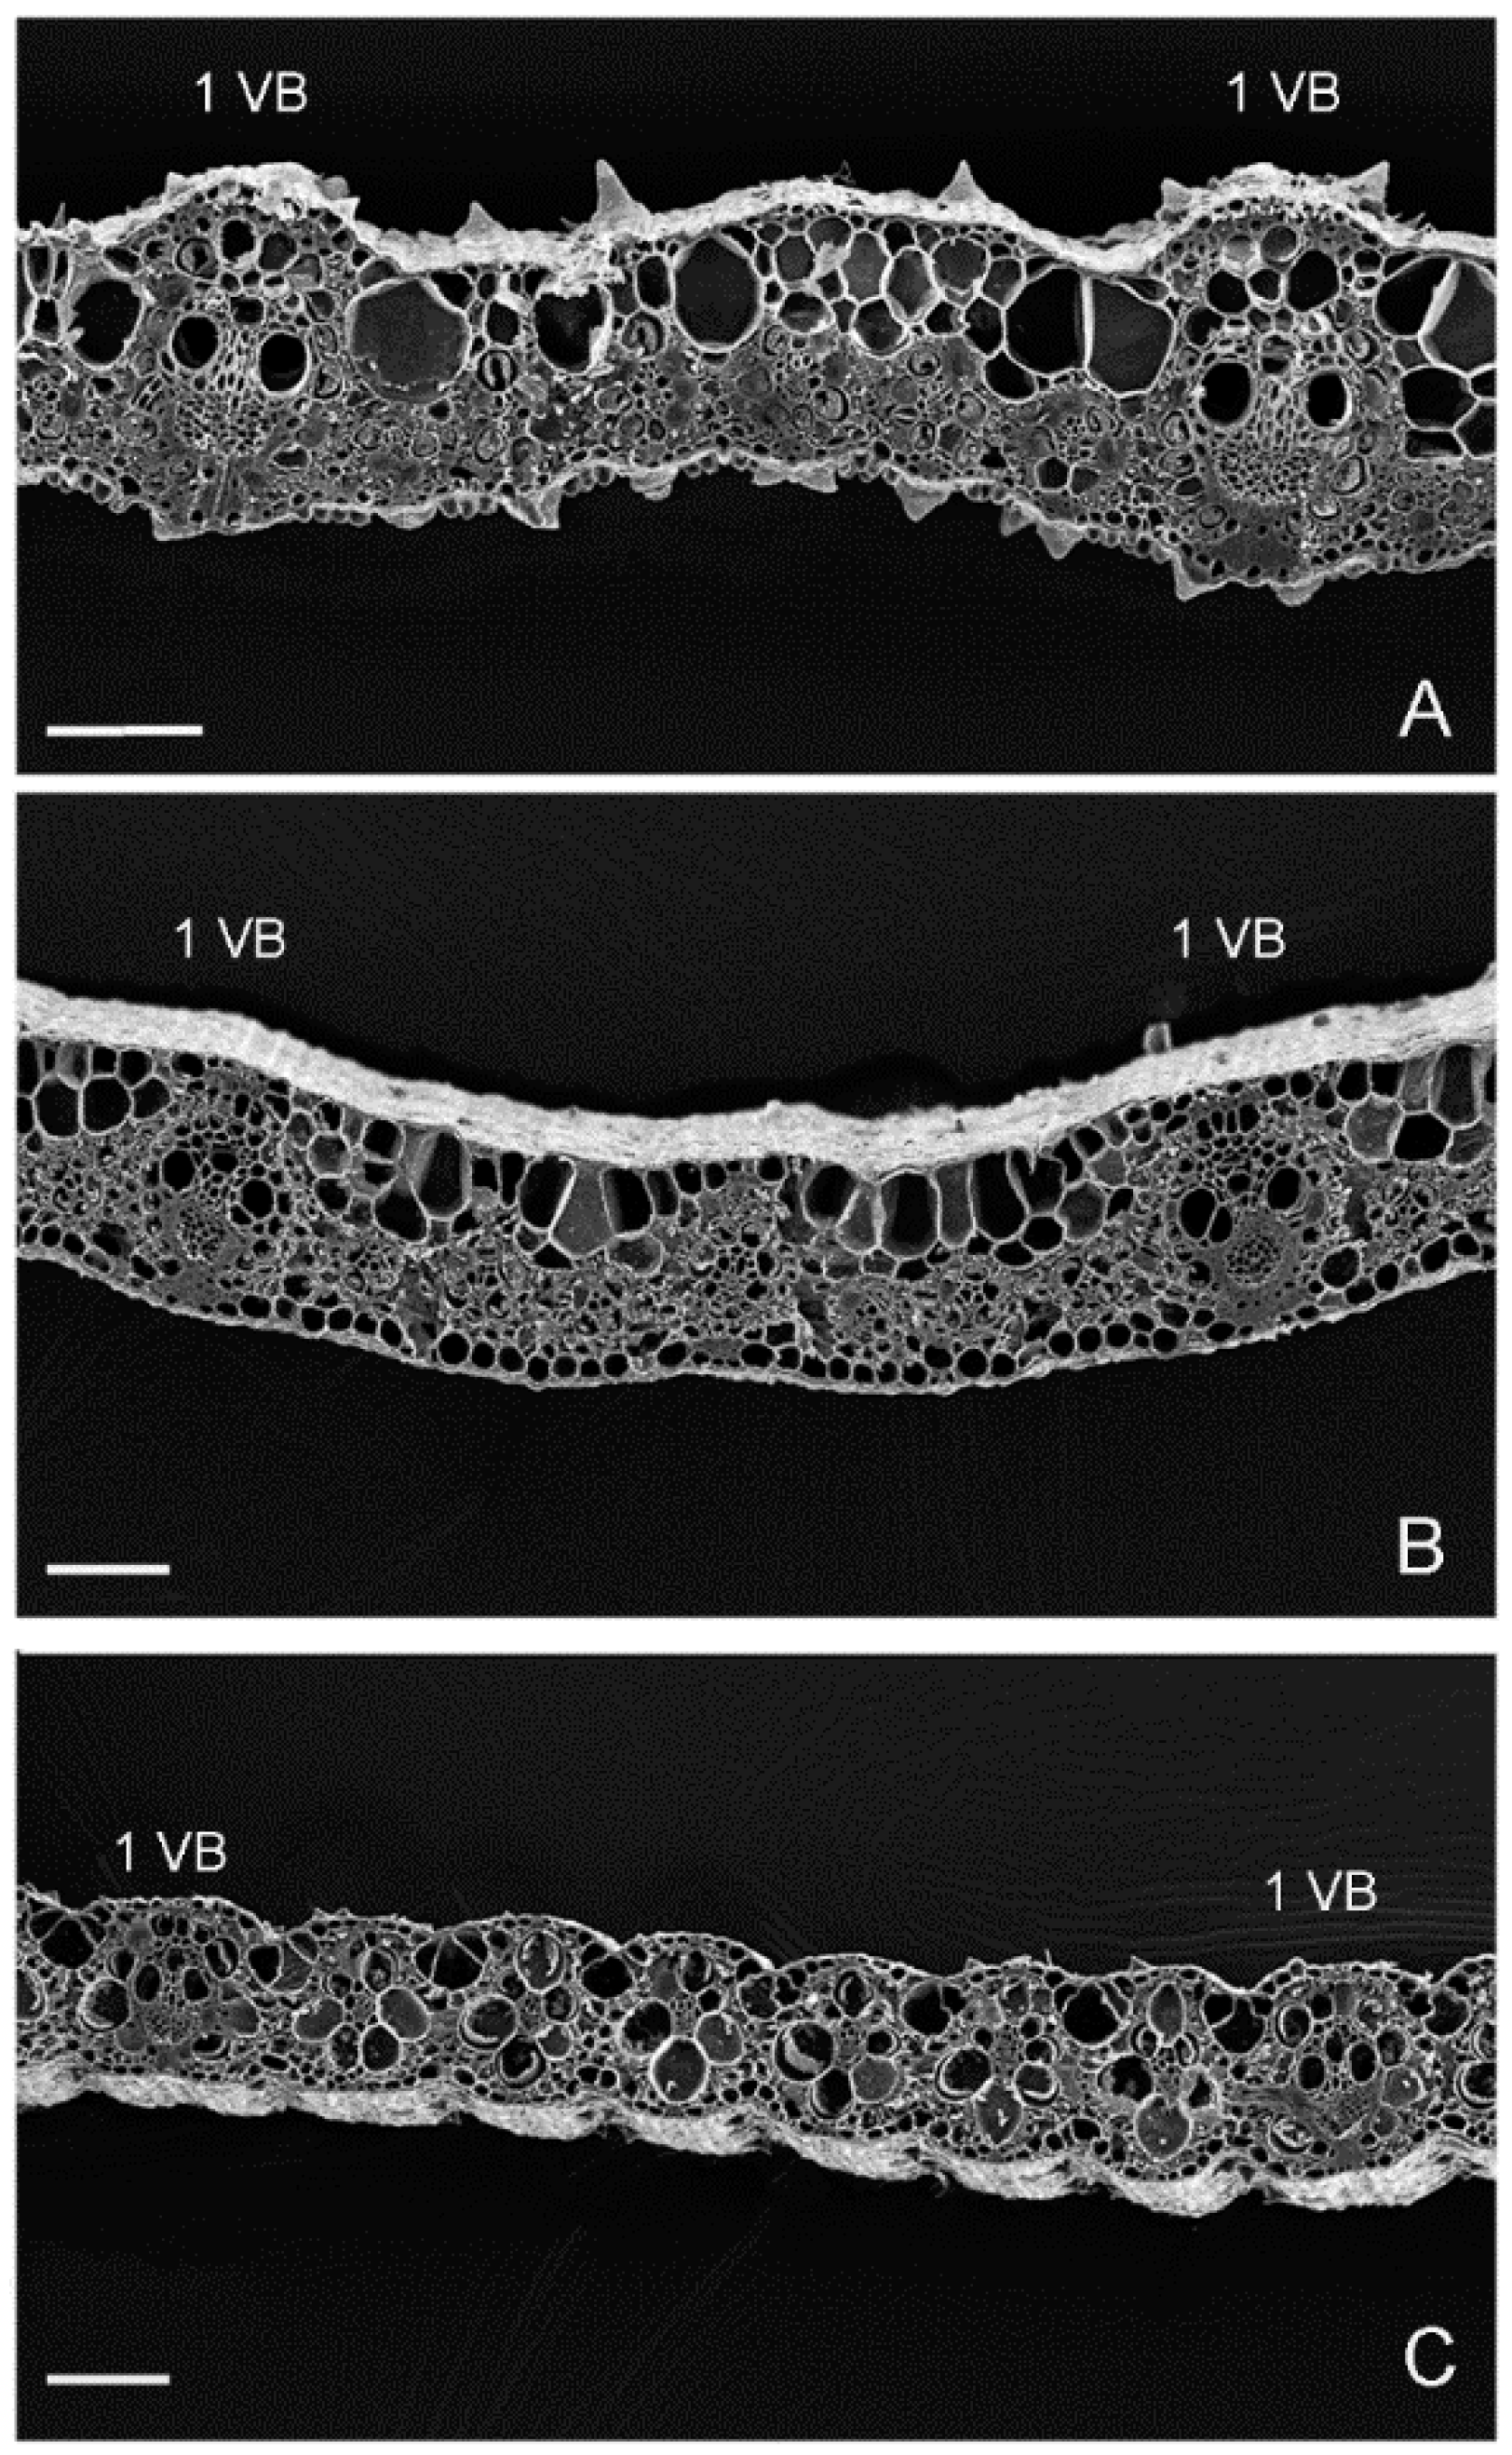
Regarding the number of primary vascular bundle and the distance between primary vascular bundles, a significant correlation between species and evaluation dates was detected (p < 0.05). In addition, significant differences among species were observed. P. atratum exhibited the largest number of primary vascular bundles at the midrib and interveinal regions and C. gayana showed the lowest distance among primary vascular bundles (Table 3) (Figure 3).

3.4. Proportion of Leaf Tissues

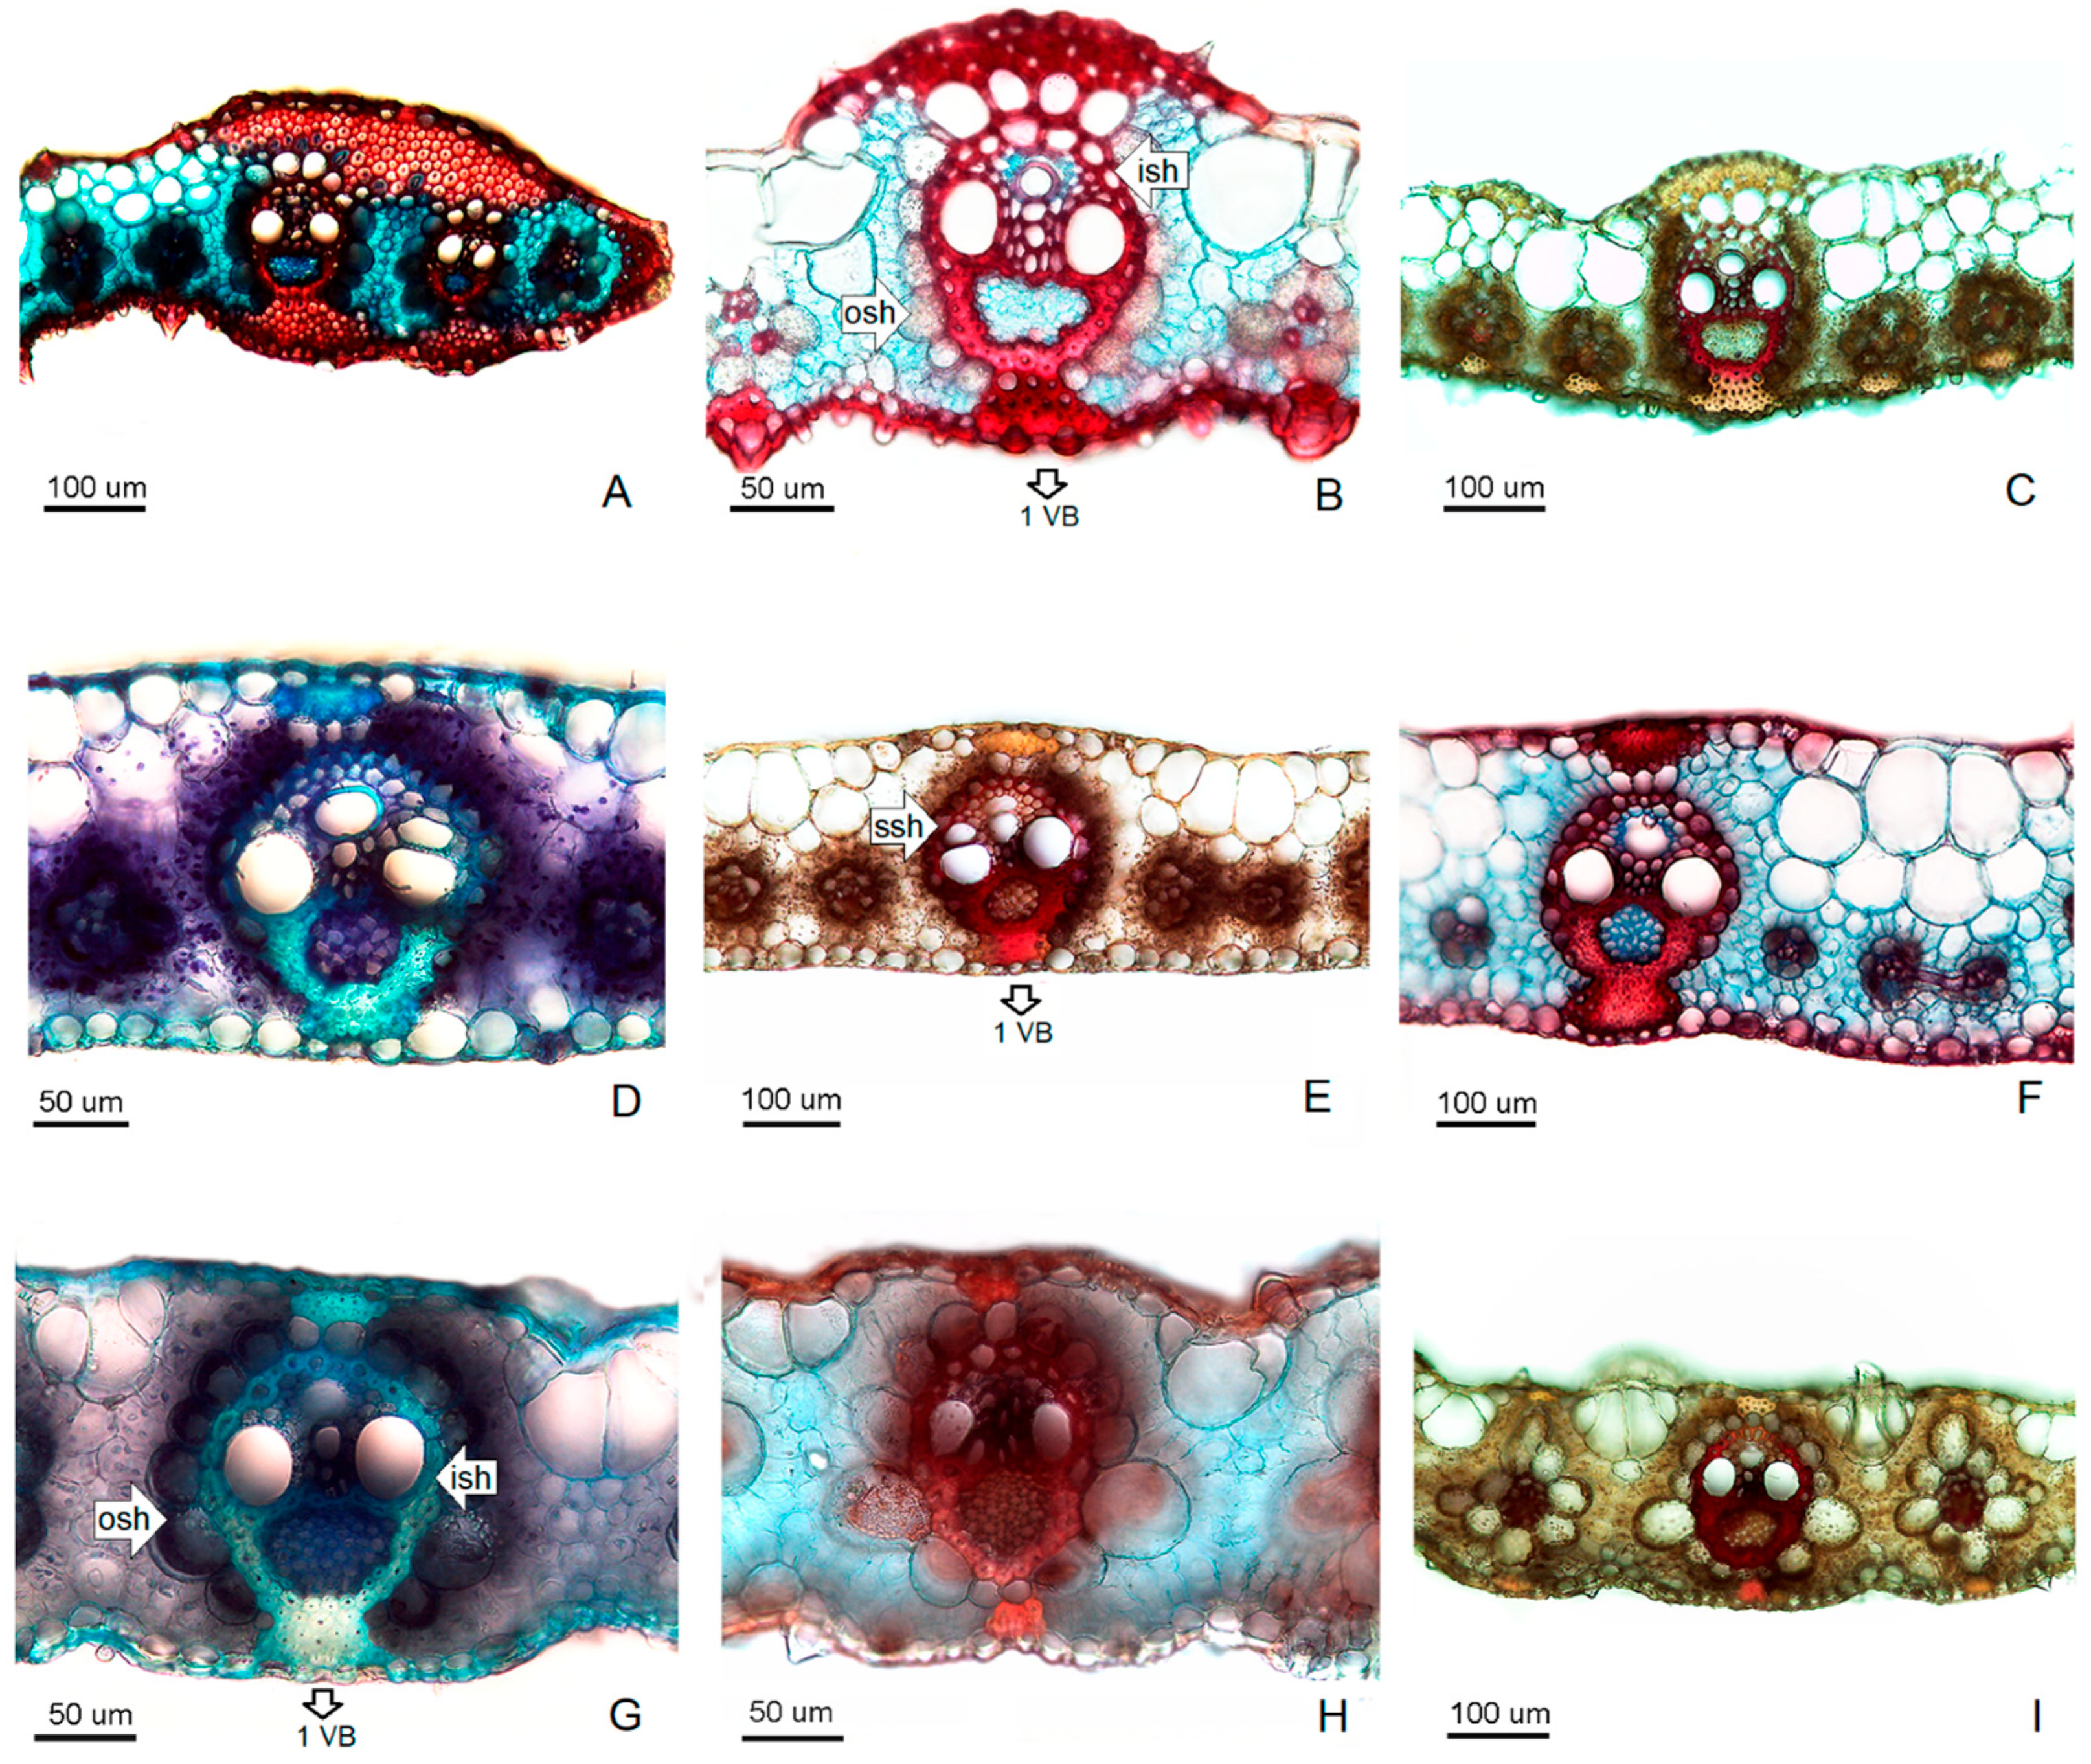
First-order vascular bundles of Chloris gayana are surrounded by an incomplete outer sheath with a wide abaxial interruption of well-developed (shape trapezoidal) sclerenchyma girders. The adaxial side presents conspicuous, vertically elongated cells and is in contact with a conspicuous sclerenchymatous girder, as wide as or wider than the vascular bundle (Figure 4B,C). The outer sheath is composed of non-lignified cells, while the inner sheath is composed of reduced and lignified lumen elements (Figure 4B). First-order vascular bundles of P. atratum are surrounded by an incomplete single sheath with a wide abaxial interruption of well-developed sclerenchyma (trapezoidal shape) girders, and the adaxial side is in contact with a conspicuous extension of the bundle sheath and wide sclerenchyma bi-seriate strands. The bundle sheath is composed of lignified cells (Figure 4D–F). First-order vascular bundles of U. brizantha are surrounded by either an outer complete sheath or an incomplete one due to a wide interruption of sclerenchyma girders towards the abaxial epidermis. The adaxial side is in contact with small sclerenchyma strands, sometimes well-developed. The outer bundle sheath is composed of non-lignified cells, while the inner bundle sheath is composed of reduced and lignified lumen elements (Figure 4G–I).

3.5. Principal Component Analysis and Pearson Correlation Test

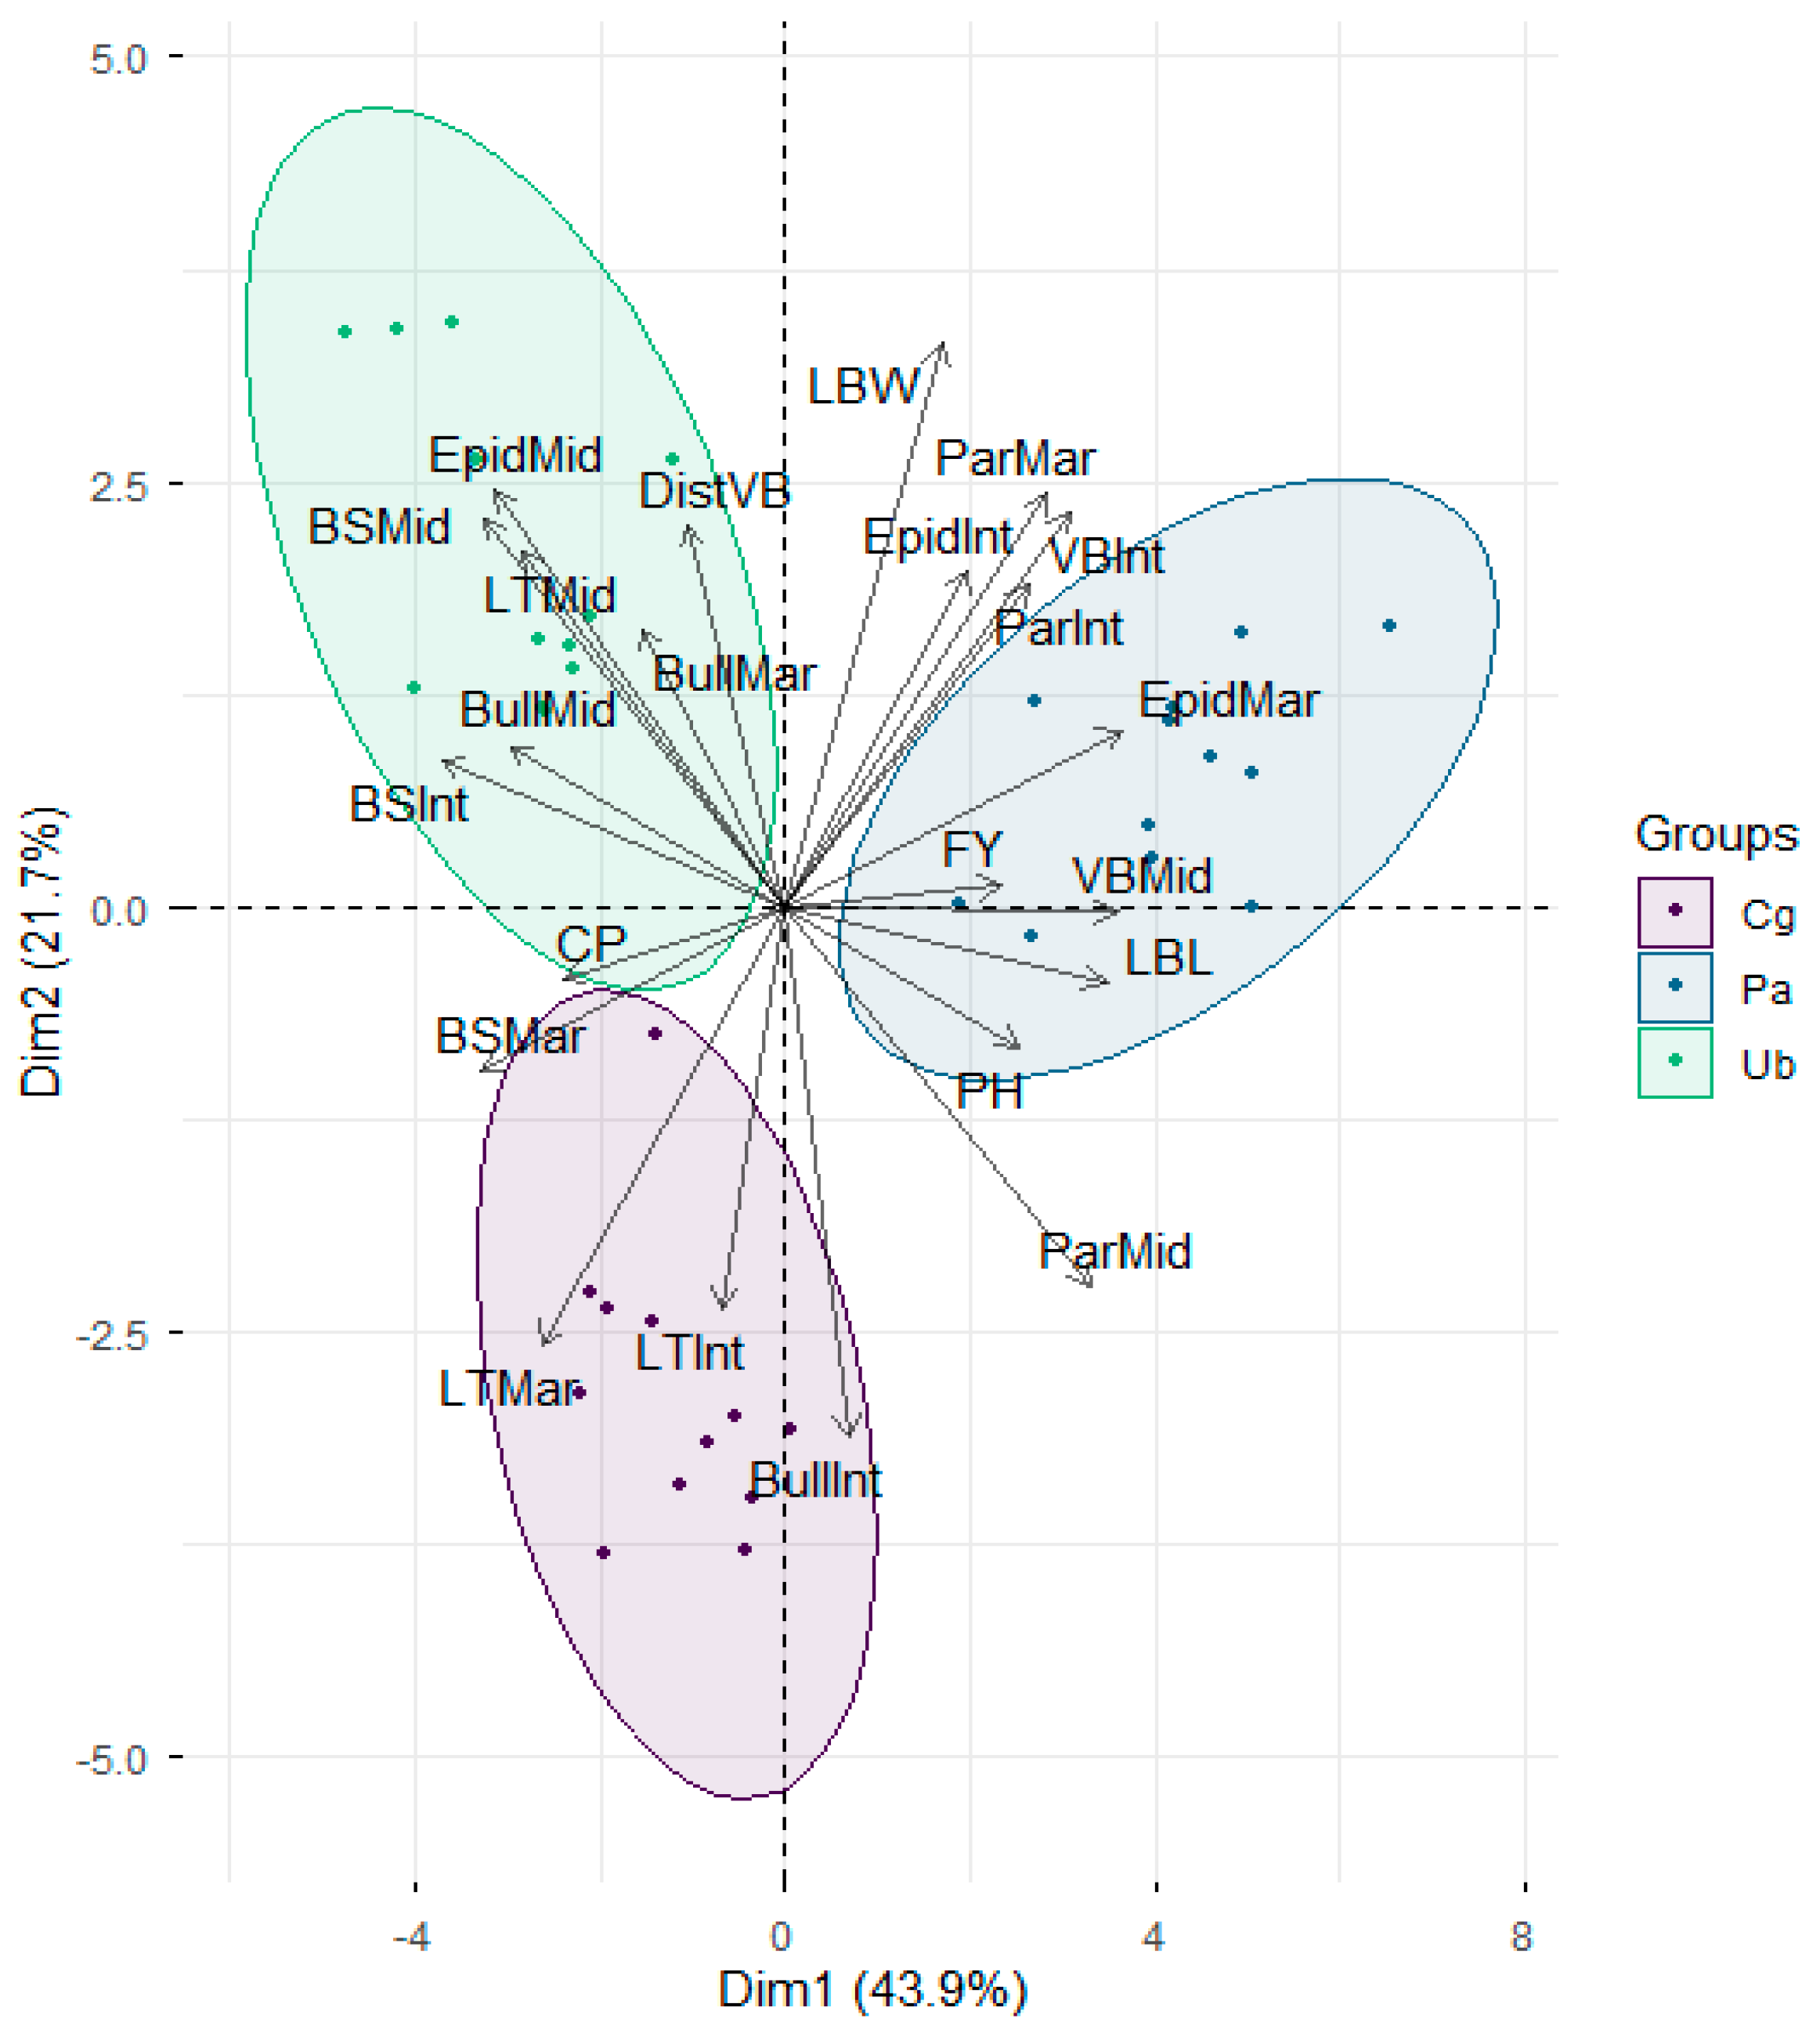
The percentage of variance accounted by component 1 was 43.9% and 21.2% by component 2. Components 3 and 4 contributed 11.2% and 5.2% of variance, respectively. Together, the first two components accounted for 63% of the total variance. Considering these values, components 1 and 2 were plotted in the biplot. The biplot shows that the anatomical traits of the leaves contributed more to the observed variance (Figure 5). In addition, variability between the three species was observed since they were distributed in different quadrants of the graph (Figure 5). U. brizantha exhibited a high cattle preference, proportion of bundle sheath, and proportion of bulliform cells. C. gayana also showed a high cattle preference with a high lignified tissue proportion. However, P. atratum exhibited a high pre-grazing forage yield, number of first-order vascular bundles, plant height, and leaf-blade length. Furthermore, the biplot shows that some variables are positively and negatively correlated.
Positive and negative significant correlations were observed between cattle preference and the agronomic, morphologic and anatomical traits evaluated (Table 4). Cattle preference was positively correlated with the proportion of the bundle sheath at the margin (0.61) and at the interveinal (0.53) region and with the proportion of epidermis at the midrib region (0.43). However, it was negatively correlated with forage yield (−0.67), the number of primary vascular bundles at the midrib region (−0.63), plant height (−0.61), leaf-blade length (−0.56) and the number of primary vascular bundles at the interveinal region (−0.52). In addition, the number of primary vascular bundles at the midrib region was negatively correlated with the proportion of bundle sheath at the interveinal (−0.63), margin (−0.61) and midrib (−0.45) regions, while it was positively correlated with the leaf-blade length (0.61), forage yield (0.46) and plant height (0.41). The proportion of bundle sheath at the margin region was negatively correlated with the leaf-blade length (−0.66), plant height (−0.61) and the proportion of parenchyma at the margin (−0.69). Forge yield was positively correlated with plant height (0.79) and leaf-blade length (0.7).

4. Discussion

Warm-season grasses are the primary feed source in tropical and subtropical beef cattle production systems [9]. This study aimed to evaluate the effects of seasonal growth, leaf morphology, and leaf anatomy of three warm-season grasses on cattle preference. The findings may help to explain the variations in cattle preference among warm-season grasses, especially to understand their behavior when sown in mixtures.
Cattle preference differed among the three species during three of the four evaluated periods. U. brizantha and C. callide were the most preferred during spring and summer, but no significant differences were observed in autumn. Pre-grazing forage yield differed among species in the summer and autumn, with summer being the season with the greatest values. This could be an indication of the important role that the amount of forage available before the grazing event plays in cattle preference of warm-season grasses. Regarding the proportion of forage consumed, the autumn was the season with the greatest values. This could be related to the regrowth period, since spring and summer months are 60 and 30 days longer than autumn months.
The three species exhibited different morphological characteristics during the four evaluated dates, which could be linked to leaf anatomical characteristics as was observed in other warm-season grasses. In Megathrysus maximus, the widest leaves were related to a greater mesophyll proportion, while in Cenchrus ciliaris, longer leaves were associated with a greater proportion of thick-walled tissues [30,31]. In addition, taller plants are associated with a greater proportion of structural tissues due to a greater proportion of stems [32]. On the other hand, these traits may have implications for cattle preference, as noted in previous studies involving P. atratum accessions, where animals preferred shorter plants with more flexible leaves [15]. In this work, the tallest plants were observed to have the longest and widest leaves during the warm season.
C4 grasses are characterized by a thick-walled parenchyma bundle sheath around each vascular bundle [32]. This structure increased the proportion of lignified tissues affecting the chewing and rumination [10], and imparting resistance to the apprehension of the leaf by cattle [33]. In this study, U. brizantha exhibited a sevenfold higher proportion of bundle sheath at the midrib region compared to P. atratum, so the proportion of lignified tissues in P. atratum was lower than in U. brizantha. In addition, we observed that U. brizantha exhibited an outer non-lignified bundle sheath and an inner one composed of reduced and lignified cells, while P. atratum showed a simple bundle sheath composed of lignified cells. Additionally, P. atratum displayed the highest number of first-order vascular bundles, which would increase the total proportion of bundle sheath.
Based on the biplot and the Pearson correlation test, cattle preference was positively correlated with the proportion of bundle sheath and was negatively correlated with pre-grazing forage yield, plant height, leaf-blade length and the number of first-order vascular bundles. Furthermore, pre-grazing forage yield, plant height and leaf-blade length were negatively correlated with the proportion of bundle sheath and the proportion of lignified tissues. In a previous work conducted on P. atratum, it was observed that cattle preference was negatively correlated with plant height, leaf-blade length and the number of first-order vascular bundles [15]. In P. dilatatum, it was observed that as the proportion of lignified tissues and vascular bundles increased, the resistance to apprehension by cattle also increased [32]. In addition, we observed that the first-order vascular bundles of the three species were associated with sclerenchyma girders or strands. Basso et al. [34] observed these structures provide a mechanical barrier limiting the access of ruminal microorganisms to the parenchyma, thereby affecting leaf degradability. Hence, as the number of first-order vascular bundles increases and the distance between them decreases, it is more difficult for ruminal microorganisms to beak down these fractions [35]. All of these indicate that the leaf morphology and anatomy of these species play a key role in cattle preference. In addition, the growing season had an impact in cattle preference since during the spring and summer, differences in preference were observed, while in the autumn, the three species were equally preferred due to a lower growth rate. During the warm season, taller plants with longer leaves were observed, which could help to explain the change mentioned above. Therefore, these findings could be useful for understanding other warm-season grasses.
The joint analysis between agronomic, morphological and anatomical traits showed that cattle preference in warm-season grasses is affected by the amount of forage available, the growing season, plant height, leaf-blade length and the number of primary vascular bundles. Taller plants with longer leaves showed a higher number of vascular bundles, which increased the proportion of lignified cells associated with this structure. Based on this, cattle preference during the warm season could be improved by managing plant height and leaf-blade length through grazing. All of these have more relevance in a forage mixture where more than one species cohabits with different forage production, leaf morphology and anatomy. In conclusion, the three evaluated species differed in their cattle preference, herbage mass, morphology and leaf anatomy. All of these variables were affected by the growing season. Forage yield was greater during the summer, and taller plants with longer leaves were observed. Urochloa brizantha was characterized by the highest proportion of bundle sheath, which is composed of non-lignified cells, while Paspalum atratum was characterized by the greatest number of first-order vascular bundles. The amount of forage consumed varied among species during the spring and summer, while in the autumn, the three species were consumed equally. Cattle preference negatively correlated with forage yield, plant height, leaf-blade length and the number of first-order vascular bundles. Hence, the greater the amount of forage available and the higher the proportion of supporting tissues—due to taller plants with longer leaves and more vascular bundles—the lower the preference shown by cattle. Therefore, we can infer that in warm-season grasses, cattle may prefer shorter plants with shorter leaves and fewer primary vascular bundles.

Author Contributions

Conceptualization, C.A.A.; methodology, F.M., E.L.D.L. and M.C.P.; software, F.M., E.L.D.L. and M.C.P.; validation, C.A.A. and M.C.P.; formal analysis, F.M.; investigation, F.M., E.L.D.L. and M.C.P.; resources, M.C.P. and C.A.A.; data curation, F.M., E.L.D.L. and M.C.P.; writing—original draft preparation, F.M.; writing—review and editing, F.M., E.L.D.L., M.C.P. and C.A.A.; visualization, F.M. and M.C.P.; supervision, M.C.P. and C.A.A.; project administration, C.A.A. All authors have read and agreed to the published version of the manuscript.

Funding

This research received no external funding.

Data Availability Statement

The raw data supporting the conclusions of this article will be made available by the authors on request.

Conflicts of Interest

The authors declare no conflicts of interest.

References

  1. Rutter, S.M. Review: Grazing preferences in sheep and cattle: Implications for production, the environment and animal welfare. Can. J. Anim. Sci. 2010, 90, 285–445. [Google Scholar] [CrossRef]
  2. Martens, D.R.; Grant, R.J. Digestibility and intake. In Forages: The Science of Grassland Agriculture, 7th ed.; Moore, K.J.M., Collins, C.J., Redfearn, D.D., Eds.; Wiley: Hoboken, NJ, USA, 2020; Volume 2, pp. 609–631. [Google Scholar]
  3. Cuchillo-Hilario, M.; Wrage-Monnig, N.; Isselstein, J. Forage selectivity by cattle and sheep co-grazing swards differing in plant species diversity. Grass Forage Sci. 2018, 73, 320–329. [Google Scholar] [CrossRef]
  4. Allison, C.D. Factors affecting forage intake by range ruminants: A review. J. Range Manag. 1985, 38, 305–311. [Google Scholar] [CrossRef]
  5. Beaumont, A.B.; Stitt, R.E.; Snell, R.S. Some factors affecting the palatability of pasture plants. J. Am. Soc. Agron. 1933, 25, 123–128. [Google Scholar] [CrossRef]
  6. Rutter, S.M. Diet preference for grass and legumes in free-ranging domestic sheep and cattle: Current theory and future application. Appl. Anim. Behav. Sci. 2006, 97, 17–35. [Google Scholar] [CrossRef]
  7. Caram, N.; Casalás, F.; Soca, P.; Wallau, M.O.; Sollenberger, L.E.; Cadenazzi, M.; Boggiano, P. Grazing intensity controls the seasonal utilization of functionally diverse patches by mediating herbivore selectivity. Rangel. Ecol. Manag. 2024, 96, 152–162. [Google Scholar] [CrossRef]
  8. Oliveira, B.A.; López, I.F.; Cranston, L.M.; Poli, C.H.E.C.; Kemp, P.D.; Donaghy, D.J.; Draganova, I.; López-Villalobos, N. Animal behaviour and dietary preference of dairy cows grazing binary and diverse pastures under the leaf regrowth stage defoliation criterion. Anim. Feed Sci. Technol. 2024, 318, 116146. [Google Scholar] [CrossRef]
  9. Sollenberger, L.E.; Vendramini, J.M.B.; Pedreira, C.G.S.; Rios, E.F. Warm-season grasses for humid areas. In Forages: The Science of Grassland Agriculture, 7th ed.; Moore, K.J.M., Collins, C.J., Redfearn, D.D., Eds.; Wiley: Hoboken, NJ, USA, 2020; Volume 2, pp. 331–346. [Google Scholar]
  10. Coleman, S.W.; Moore, J.E.; Wilson, J.R. Quality and utilization. In Warm-Season (C4) Grasses; Moser, L.E., Burson, B.L., Sollenberger, L.E., Eds.; ASA, CSSA, SSSA: Madison, WI, USA, 2004; Volume 45, pp. 267–308. [Google Scholar]
  11. Otaviano, E.K.S.; Mammana, A.F.; Gomes, C.M.; Silva, A.M.S.; Carvalho, L.F.G.; Sbrissia, A.F.; Barbosa, R.M.; Sollenberger, L.E.; Silva, S.C. Canopy structure and herbage intake rate of three tropical forage grasses cultivated as pure or mixed stands. Crop Pasture Sci. 2024, 75, CP24125. [Google Scholar] [CrossRef]
  12. Forbes, T.D.A.; Coleman, S.W. Forage intake and ingestive behavior of cattle grazing old world bluestems. Agron. J. 1993, 85, 808–816. [Google Scholar] [CrossRef]
  13. Benvenutti, M.A.; Gordon, I.J.; Poppi, D.P. The effects of stem density of tropical swards and age of grazing cattle on their foraging behavior. Grass Forage Sci. 2008, 63, 1–8. [Google Scholar] [CrossRef]
  14. MacAdam, J.W.; Mayland, H.F. The relationship of leaf strength to cattle preference in tall fescue cultivars. Agro. J. 2003, 95, 414–419. [Google Scholar] [CrossRef]
  15. Marcón, F.; Di Lorenzo, E.L.; Peichoto, M.C.; Acuña, C.A. Cattle preference in Paspalum atratum and its relationship with morphological and anatomical leaf characteristics. Crop Sci. 2023, 63, 1659–1673. [Google Scholar] [CrossRef]
  16. Akin, D.E.; Burdick, D. Percentage of tissue types in tropical and temperate grass leaf blades and degradation of tissues by rumen microorganisms. Crop Sci. 1975, 15, 661–668. [Google Scholar] [CrossRef]
  17. Moser, L.E.; Burson, B.L.; Sollenberger, L.E. Warm season (C4) grass overview. In Warm-Season (C4) Grasses; Moser, L.E., Burson, B.L., Sollenberger, L.E., Eds.; ASA, CSSA, SSSA: Madison, WI, USA, 2004; Volume 45, pp. 1–14. [Google Scholar]
  18. Marchi, S.R.; Bellé, J.R.; Foz, C.H.; Ferri, J.; Martins, D. Weeds alter the establishment of Brachiaria brizantha cv. Marandu. Trop. Grassl.-Forrajes Trop. 2017, 5, 85–93. [Google Scholar] [CrossRef]
  19. Loch, D.S.; Rethman, N.F.G.; Van Niekerk, W.A. Rhodesgrass. In Warm-Season (C4) Grasses; Moser, L.E., Burson, B.L., Sollenberger, L.E., Eds.; ASA, CSSA, SSSA: Madison, WI, USA, 2004; Volume 45, pp. 833–872. [Google Scholar]
  20. Chiachiera, S.; Bertram, N.; Taleisnik, E.; Jobbágy, E. Effect of watertable depth and salinity on growth dynamics of Rhodes grass (Chloris gayana). Crop Pasture Sci. 2016, 67, 881–887. [Google Scholar] [CrossRef]
  21. Kalmbacher, R.S.; Brown, W.F.; Colvin, D.L.; Dunavin, L.S.; Kretschmer, A.E.; Martin, F.G.; Mullahey, J.J.; Rechcigl, J.E. Suerte Atra Paspalum: Its management and utilization. In Circular S-397; Florida Cooperative Extension Service, Institute of Food and Agricultural Sciences, University of Florida: Gainesville, FL, USA, 1997. [Google Scholar]
  22. Marcón, F.; Urbani, M.H.; Quarin, C.L.; Acuña, C.A. Agronomic characterization of Paspalum atratum Swallen and P. lenticulare Kunth. Trop. Grassl.-Forrajes Trop. 2018, 6, 70–81. [Google Scholar] [CrossRef]
  23. Ledesma, L.L. Los Suelos de la Estación Experimental Agropecuaria Colonia Benítez “Dr. Augusto G. Schulz” Provincia del Chaco; Instituto Nacional de Tecnología Agropecuaria (INTA): Buenos Aires, Argentina, 1995; pp. 1–38. [Google Scholar]
  24. Zarlavsky, G.E. Histología vegetal técnicas simples y complejas. Soc. Argent. Bot. 2014, 1–198. [Google Scholar]
  25. Luque, R.; Sousa, H.C.; Kraus, J.E. Métodos de coloração de Roeser (1972)–modificado- e Kropp (1972) visando a substituição do azul de astra de alcião 8 GS ou 8 GX. Acta Bot. Bras. 1996, 10, 199–212. [Google Scholar] [CrossRef]
  26. Ruzin, S.E. Plant Microtechnique and Microscopy; Oxford University Press: New York, NY, USA, 1999; Volume 198, p. 322. [Google Scholar]
  27. Schneider, C.A.; Rasband, W.S.; Eliceiri, K.W. NIH Image to ImageJ: 25 years of image analysis. Nat. Methods 2012, 9, 671–675. [Google Scholar] [CrossRef] [PubMed]
  28. Gonzalez, A.M. Image J: Una herramienta indispensable para medir el mundo biológico. Folium Relatos Botánicos 2018, 1, 6–17. [Google Scholar]
  29. Di Rienzo, J.A.; Casanoves, F.; Balzarini, M.G.; Gonzalez, L.; Tablada, M.; Robledo, C.W. InfoStat. Grupo InfoStat. FCA, Universidad Nacional de Córdoba. 2020. Available online: http://www.infostat.com.ar (accessed on 15 September 2025).
  30. Batistoti, C.; Lempp, B.; Jank, L.; Morai, M.D.G.; Cubas, A.C.; Gomes, R.A.; Ferreira, M.V.B. Correlations among anatomical, morphological, chemical and agronomic characteristics of leaf blades in Panicum maximum genotypes. Anim. Feed Sci. Technol. 2012, 171, 173–180. [Google Scholar] [CrossRef]
  31. Wilson, J.R.; Anderson, K.L.; Hacker, J.B. Dry matter digestibility in vitro of leaf and stem of Buffel Grass (Cenchrus ciliaris) and related species and its relation to plant morphology and anatomy. Aust. J. Agric. Res. 1989, 40, 281–291. [Google Scholar] [CrossRef]
  32. Wilson, J.R. Organization of forage plant tissue. In Forage Cell Wall Structure and Digestibility; Jung, H.G., Buxton, D.R., Hatifield, R.D., Ralph, J., Eds.; ASA, CSSA, SSSA: Madison, WI, USA, 1993; pp. 1–27. [Google Scholar]
  33. Zhang, J.M.; Hongo, A.; Akimoto, M. Physical strength and its relation to leaf anatomical characteristics of nine forage grasses. Aust. J. Bot. 2004, 52, 799–804. [Google Scholar] [CrossRef]
  34. Basso, K.C.; Galzerano, L.; Da Silva, W.L.; Ruggieri, A.C.; Reis, R.A. Anatomical, morphogenic and structural characteristics of Xaraés palisade grass under grazing. Biosci. J. 2023, 39, e39067. [Google Scholar] [CrossRef]
  35. Alves de Brito, C.J.F.; Rodella, R.A.; Deschamps, F.C. Anatomia quantitativa da folha e do colmo de Brachiaria brizantha (Hochst. ex A. Rich.) Stapf e B. humidicola (Rendle) Schweick. R. Bras. Zootec. 2004, 33, 519–528. [Google Scholar] [CrossRef]
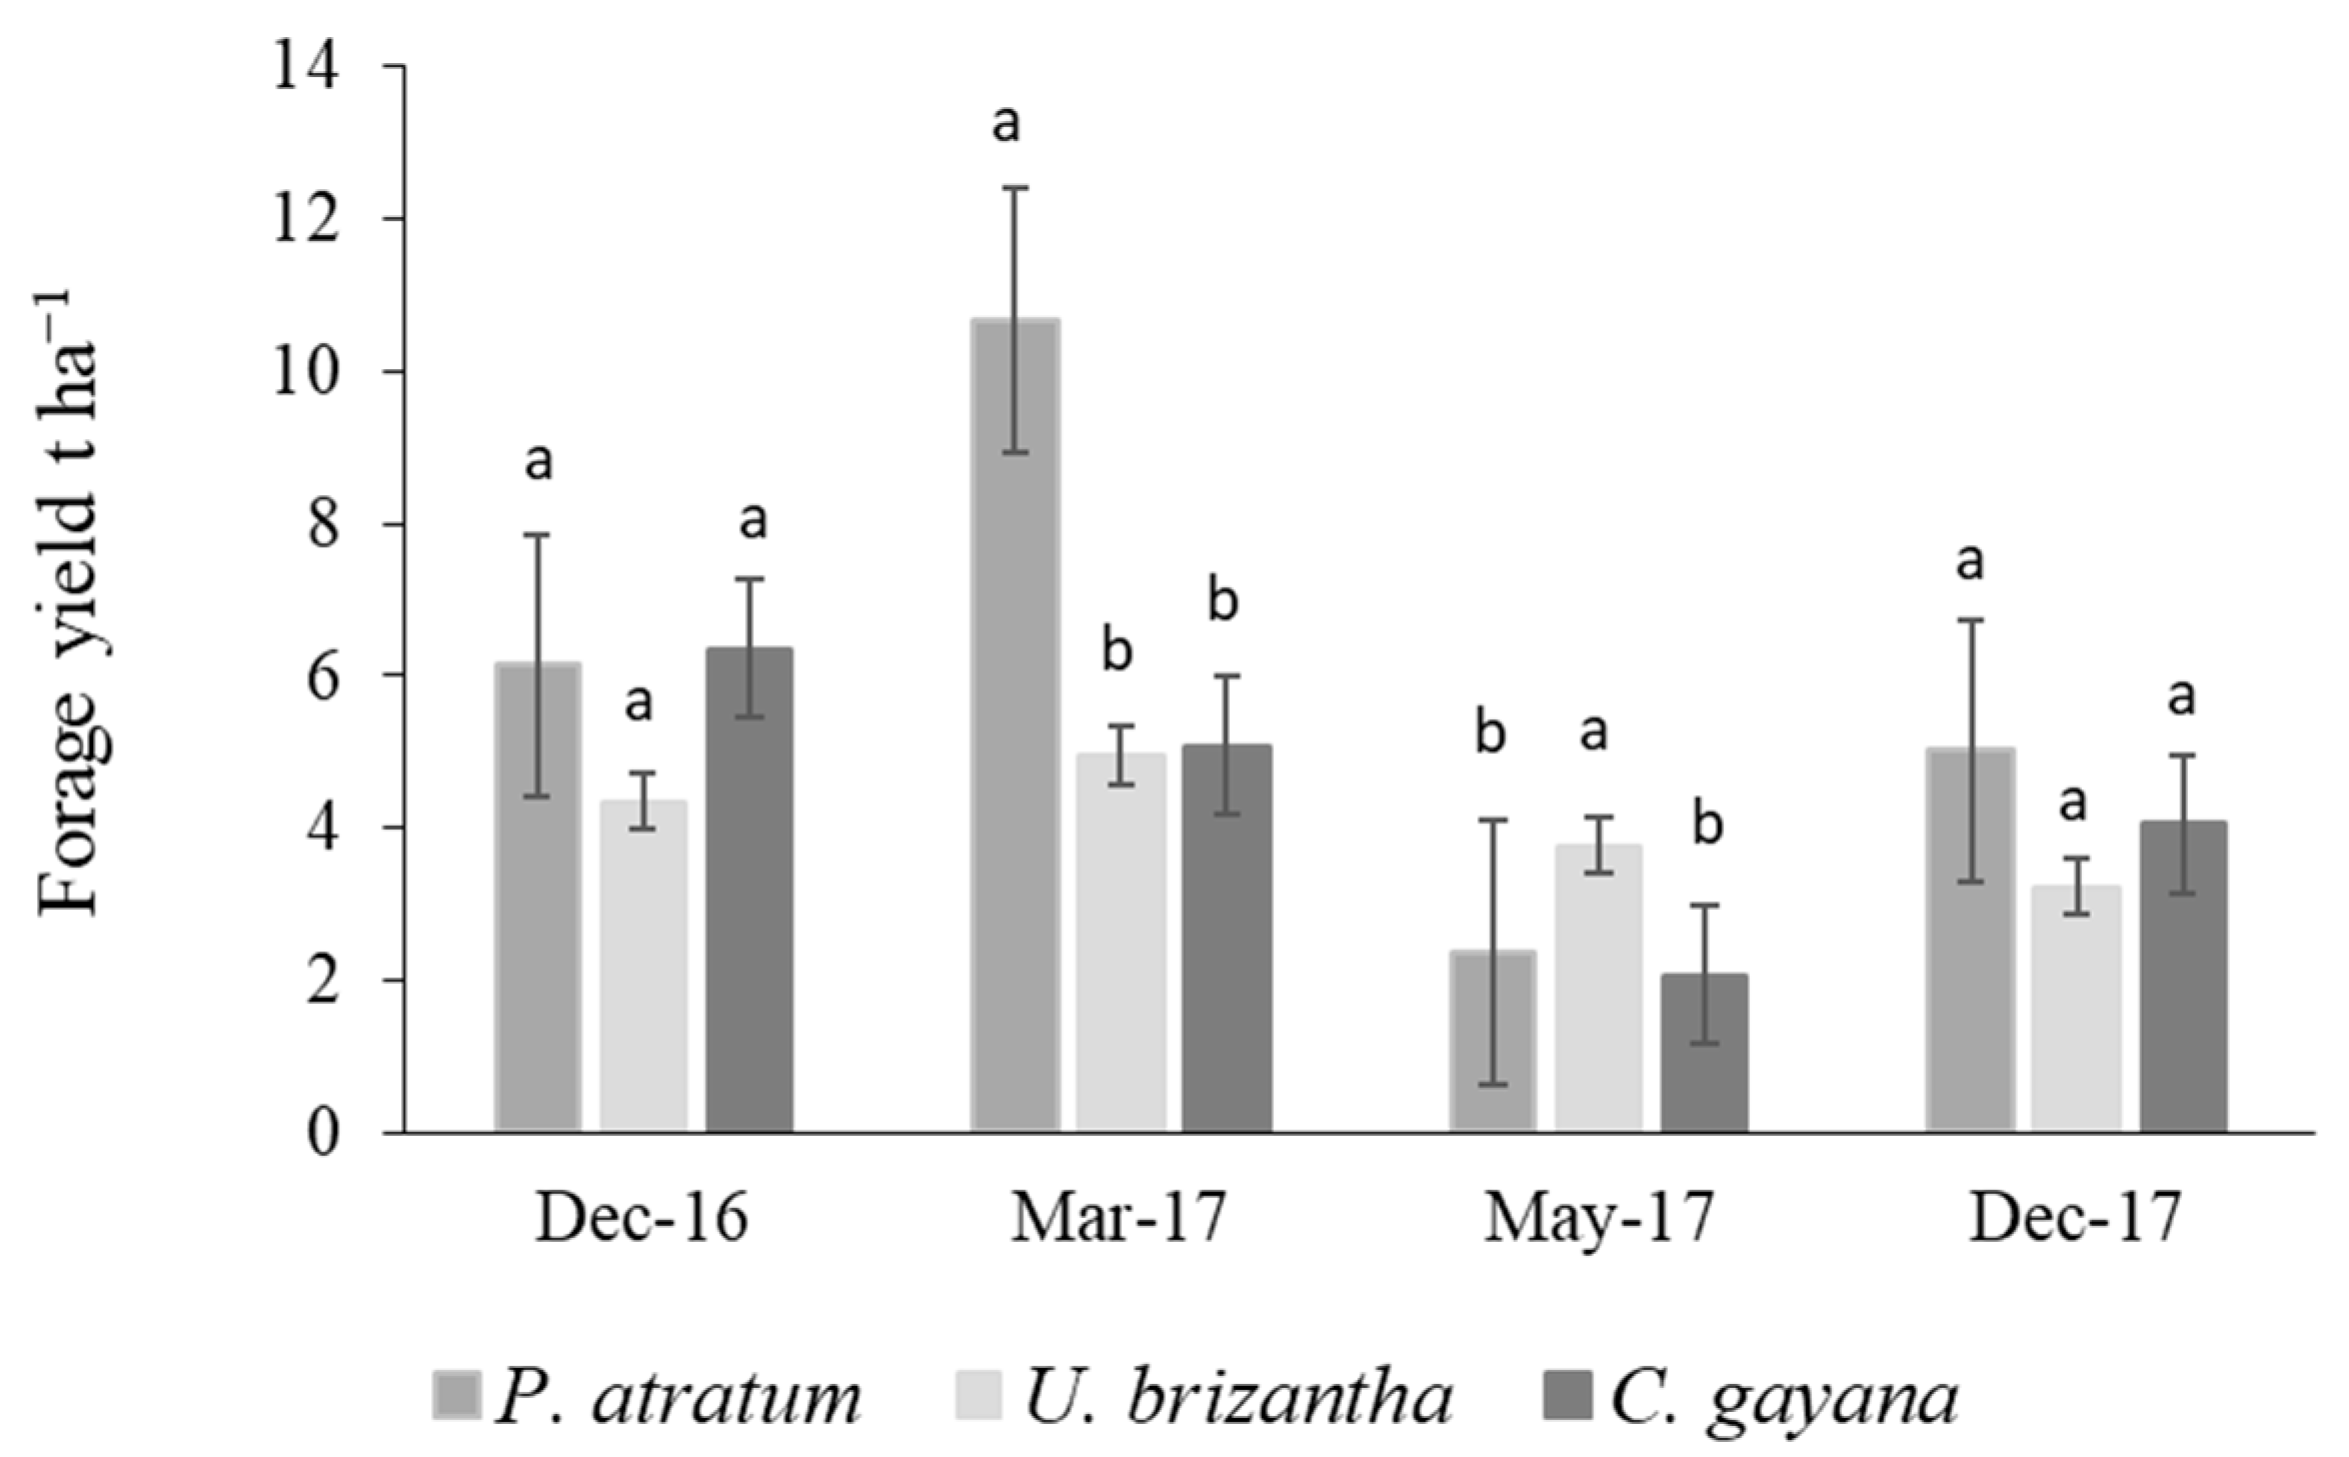
Figure 1. Average forage yield (t ha−1) of Paspalum atratum cv Cambá, Urochloa brizantha cv Marandú and Chloris gayana cv Callide evaluated before grazing during December 2016 (Dec-16), March 2017 (Mar-2017), May 2017 (May-17) and December 2017 (Dec-17). Within a measurement date, bars not sharing a common letter are significantly different among accessions at p < 0.05 according to the least significant difference test. The vertical lines at each bar represent the standard error.
Grasses 04 00040 g001
Figure 2. Average cattle preference (%) of Paspalum atratum cv Cambá, Urochloa brizantha cv Marandú and Chloris gayana cv Callide evaluated during December 2016 (Dec-16), March 2017 (Mar-2017), May 2017 (May-17) and December 2017 (Dec-17). Within a measurement date, bars not sharing a common letter are significantly different among accessions at p < 0.05 according to the least significant difference test. The vertical lines at each bar represent the standard error.
Grasses 04 00040 g002
Figure 3. Transverse sections of interveinal regions of the leaf blade of Chloris gayana cv Callide (A), Paspalum atratum cv Cambá (B) and Urochloa brizantha cv Marandú (C) photographed with scanning electron microscope. 1 VB: First-order vascular bundle. The white bar at the bottom of each figure represents a scale of 100 µm.
Grasses 04 00040 g003
Figure 4. Photographs of transverse sections of the leaf blade from Chloris gayana cv Callide (AC), Paspalum atratum cv. Cambá (DF) and Urochloa brizantha cv Callide (GI) with differential histochemical coloration. (A,B,F,H) Transection stained with astra blue-safranin. (D,G) Transection stained with toluidine blue solution. (C,E,I) Transection stained with phloroglucinol and chlorhydric acid reaction. ish: inner sheath, osh: outer sheath, ssh single sheath, 1 VB: first vascular bundle.
Grasses 04 00040 g004
Figure 5. Principal component analysis for a group of agronomic, morphological and anatomical leaf traits of Urochloa Brizantha cv Marandú (Ub), Paspalum atratum cv Cambá (Pa) and Chloris gayana cv Callide (Cg). Abbreviations: cattle preference (CP), pre-grazing forage yield (FY), plant height (PH), leaf-blade length (LBL), leaf-blade width (LBW), proportion of epidermis at the midrib region (EpidMid), proportion of epidermis at the interveinal region (EpidInt), proportion of epidermis at the margin region (EpidMar), proportion of bulliformcells at the midrib region (BullMid), proportion of bulliformcells at the interveinal region (BullInt), proportion of bulliformcells at the margin region (BullMar), proportion of parenchyma at the midrib region (ParMid), proportion of parenchyma at the interveinal region (ParInt), proportion of parenchyma at the margin region (ParMar), proportion of bundle sheath at the midrib region (BSMid), proportion of bundle sheath at the interveinal region (BSInt), proportion of bundle sheath at the margin region (BSMar), proportion of lignified tissues at the midrib region (LTMid), proportion of lignified tissues at the interveinal region (LTInt), proportion of lignified tissues at the margin region (LTMar), number of primary vascular bundles at the interveinal region (VBInt), number of primary vascular bundles at the midrib region (VBMid), and distance between primary vascular bundles (DistVB).
Grasses 04 00040 g005
Table 1. Average plant height (PH), average leaf-blade length (LBL) and average leaf-blade width (LBW) evaluated for Paspalum atratum cv Cambá (PA), Urochloa brizantha cv Marandú (UB) and Chloris gayana cv Callide (CG) during four dates. Abbreviations: December 2016 (Dec-16), March 2017 (Mar-17), May 2017 (May-17), December 2017 (Dec-17), coefficient of variation (CV %) and minimum significant differences (MSDs) for the least significant test at 5% of significance.
Dec-16Mar-17May-17Dec-17
PHLBLLBWPHLBLLBWPHLBLLBWPHLBLLBW
cmmmcmmmcmmmcmmm
PA97.9266.3216.92146.7576.0623.2560.9244.9215.0075.6548.8313.67
UB68.7533.4316.0691.6936.1918.1358.8837.4412.7547.3830.1915.25
CG85.0641.14.69114.0654.56.8166.4443.386.2569.2541.975.5
CV9.3713.788.369.927.3510.196.257.186.825.333.826.01
MSD13.3110.701.7419.586.782.696.675.131.285.772.591.16
Table 2. Average proportion of epidermis, bulliform cells, parenchyma (colorless parenchyma + chlorenchyma), bundle sheath and lignified tissues (xylem + esclerenchyma) at the midrib (Mid.), interveinal (Int.) and margin (Mar.) regions evaluated for Paspalum atratum cv Cambá (PA), Urochloa brizantha cv Marandú (UB) and Chloris gayana cv Callide (CG) during December 2016 and March 2017. Abbreviations: coefficient of variation (CV %) and minimum significant differences (MSDs) for the least significant test at 5% of significance.
Epidermis (%)
December 2016March 2017May 2017December 2017
Mid.Int.Mar.Mid.Int.Mar.Mid.Int.Mar.Mid.Int.Mar.
PA4.8712.6634.14.4215.3831.75.6513.731.424.2317.7530.21
UB8.8211.817.99.0712.7716.939.0712.816.911.5511.3116.34
CG5.3710.2817.33.839.1614.856.4610.215.26.511.114.1
CV10.417.776.889.9815.218.19.2319.57.3814.128.784.66
MSD1.051.101.950.892.655.271.053.242.162.042.472.01
Bulliform Cells (%)
December 2016March 2017May 2017December 2017
Mid.Int.Mar.Mid.Int.Mar.Mid.Int.Mar.Mid.Int.Mar.
PA1.717.1100.8316.045.262.3715.120.811.3212.583.86
UB6.215.318.492.810.284.373.4412.27.58.566.977.42
CG4.5721.921.422.1921.342.443.9516.81.123.4121.37.01
CV44.2710.0639.3926.427.766.134.618.750.646.0532.8937.08
MSD2.942.421.600.765.754.541.783.812.413.168.453.95
Parenchyma (%)
December 2016March 2017May 2017December 2017
Mid.Int.Mar.Mid.Int.Mar.Mid.Int.Mar.Mid.Int.Mar.
PA80.3445.8643.0182.8342.8941.1780.2746.5943.4279.4141.9540.87
UB39.5730.6629.4345.5231.7931.4457.331.730.130.1239.4635.19
CG71.7133.3721.3477.3126.0429.569.828.125.167.524.926.5
CV13.003.6114.472.099.367.933.146.849.442.5514.810.35
MSD5.861.382.732.184.473.83.783.394.393.0410.67.1
Bundle Sheath (%)
December 2016March 2017May 2017December 2017
Mid.Int.Mar.Mid.Int.Mar.Mid.Int.Mar.Mid.Int.Mar.
PA4.0810.099.953.4610.59.084.8711.7712.024.444.4410.56
UB23.7525.1814.623.3627.9314.5517.429.919.130.3631.3523.69
CG7.5717.8420.585.5318.816.279.621.72011.722.519.7
CV8.119.1017.578.727.5411.710.56.2310.711.210.769.46
MSD1.761.683.391.461.832.051.711.672.42.693.472.85
Lignified Tissues (%)
December 2016March 2017May 2017December 2017
Mid.Int.Mar.Mid.Int.Mar.Mid.Int.Mar.Mid.Int.Mar.
PA7.611.9411.297.3213.1810.675.7610.7510.538.9712.5312.33
UB19.2814.8127.8716.3413.943113.211.724.116.84915.76
CG9.414.0636.89.1520.7633.998.7119.935.89.591730.3
CV17.5734.856.586.3812.37.168.088.7616.214.098.7317.76
MSD3.395.832.051.042.612.271.191.694.862.851.935.68
Table 3. Average number of primary vascular bundles at the midrib (Mid.) and interveinal (Int.) regions and average distance between primary vascular bundles of Paspalum atratum cv Cambá (PA), Urochloa brizantha cv Marandú (UB) and Chloris gayana cv Callide (CG) during December 2016 (Dec16), March 2017 (Mar17), May 2017 (May17) and December 2017 (Dec17). Abbreviations: coefficient of variation (CV %) and minimum significant differences (MSDs) for the least significant test at 5% of significance.
Number of Primary Vascular BundleDistance Primary VB (µm)
Dec16Mar17May17Dec17Dec16Mar17May17Dec17
Int.Mid.Int.Mid.Int.Mid.Int.Mid.
PA9.173.89.8358.3337.675.331227.51013950.56585.27
UB5161614.6711459.41444.313921096.8
CG31334143692.5921.4842675
CV11.8032.714.73013.651.58.039.3612.1019.117.115.2
MSD0.830.880.40.41.141.490.760.54167.72289.9245243.39
Table 4. Person correlation coefficient and p-values between cattle preference and morphological and anatomical leaf characteristics of Urochloa Brizantha cv Marandú, Paspalum atratum cv Cambá and Chloris gayana cv Callide. Abbreviations: pre-grazing forage yield (FY), plant height (PH), leaf-blade length (LBL), leaf-blade width (LBW), proportion of epidermis at the midrib region (Epid.Mid), proportion of epidermis at the interveinal region (Epid.Int), proportion of epidermis at the margin region (Epid.Mar), proportion of bulliformcells at the midrib region (Bull.Mid), proportion of bulliformcells at the interveinal region (Bull.Int), proportion of bulliformcells at the margin region (Bull.Mar), proportion of parenchyma at the midrib region (Par.Mid), proportion of parenchyma at the interveinal region (Par.Int), proportion of parenchyma at the margin region (Par.Mar), proportion of bundle sheath at the midrib region (BS.Mid), proportion of bundle sheath at the interveinal region (BS.Int), proportion of bundle sheath at the margin region (BS.Mar), proportion of lignified tissues at the midrib region (LT.Mid), proportion of lignified tissues at the interveinal region (LT.Int), proportion of lignified tissues at the margin region (LT.Mar), number of primary vascular bundles at the interveinal region (N°VB.Int), number of primary vascular bundles at the midrib region (N°VB.Mid), and distance between primary vascular bundles (Dist.VB).
TraitsPearson Correlation Coefficientp-Value
FY−0.67<0.001
N°VB.Mid−0.63<0.001
PH−0.61<0.001
LBL−0.56<0.001
N°VB.Int−0.520.358
Epid.Mar−0.420.010
LBW−0.370.024
Par.Mar−0.340.041
Epid.Int−0.280.097
Par.Mid−0.250.134
Par.Int−0.210.212
LT.Int−0.110.517
Bull.Int−0.090.614
Bull.Mar−0.050.791
LT.Mid−0.010.943
Dist.VB0.020.928
LT.Mar0.280.100
BS.Mid0.290.082
Bull.Mid0.320.053
Epid.Mid0.430.008
BS.Int0.53<0.001
BS.Mar0.61<0.001
Disclaimer/Publisher’s Note: The statements, opinions and data contained in all publications are solely those of the individual author(s) and contributor(s) and not of MDPI and/or the editor(s). MDPI and/or the editor(s) disclaim responsibility for any injury to people or property resulting from any ideas, methods, instructions or products referred to in the content.