Abstract
The Nama Karoo biome is one of the least well-studied biomes in the semi-arid region of South Africa, and essential baseline biodiversity data for this region are lacking. The aim of the present study was to examine the influence of environmental factors on the species diversity and richness of Mountain Zebra National Park, South Africa, which includes this vital biome. Vegetation data were obtained using the step-point method. Both species richness and diversity were unaffected by slope, aspect, coarse fragments, and soil texture. Multiple linear regression analyses indicated that a combination of four variables (nitrogen, clay, and sand contents, and longitude) should be included in the optimal model for species richness, and the optimal model for species diversity also revealed four influencing variables: soil organic carbon, clay and sand contents, and longitude. Overall, both species richness and diversity could be predicted by a combination of climatic, topographic, and soil properties. The findings of this study can be used as a reference for the effects of environmental factors on plant species richness and diversity in semi-arid environments.
1. Introduction
Vegetation plays a vital role in the lives of many organisms, as well as in natural preservation, and ecosystem balance [1]. Any impact on an ecosystem, such as pollution, development, grazing, fire, and drought, is first observed through changes in the vegetation. Detailed studies on the species and population dynamics of vegetation in an area are critical for developing scientifically sound management and conservation strategies [2]. Plant species richness and diversity patterns are the foundations of ecology and conservation biology research [3]. Local and regional plant community distribution patterns are influenced by environmental factors such as climate, topography, and soil physical and chemical properties [4]. Although several ecological studies have explored different aspects of vegetation within the Nama Karoo biome [5], there still exists a considerable knowledge gap regarding the driving factors that influence this vegetation. Soil is a vital environmental factor that influences ecosystem processes, and the distribution and characteristics of plant communities [5]. Soil properties affect the redistribution of rainwater, including runoff and infiltration [6]. The chemical, physical, and microbiological properties of soil influence the plant community structure, composition, distribution, and diversity [7]. In mountainous areas, elevation, slope, and aspect are the main topographic factors affecting plant species composition, diversity, and distribution patterns [8]. Vegetation monitoring is essential for understanding the vegetation structure and species composition over time [9]. However, few studies have investigated plant biodiversity patterns in the semi-arid Nama Karoo biome. Previous ecological research in the region has primarily focused on livestock grazing effects on the landscape [10,11], and several floristic studies have investigated species assemblages in some parts of the region [12]. However, there is a need to further explore how environmental drivers affect the vegetation in the region.
Bezuidenhout and Brown [9] divided Mountain Zebra National Park (MZNP) into 13 landscape units based on their geomorphological characteristics, land and soil types, and plant species composition. These landscape units serve as management units and provide an ideal opportunity to study the species richness and diversity across various topographical areas. MZNP was established to protect the threatened Cape Mountain Zebra. Since 1996, the Park has been enlarged with the incorporation of various farms alongside the northern boundaries. As a result, the park more than doubled in size, from 6536 ha to approximately 21,000 ha [13].
The Nama Karoo biome, the second largest biome in South Africa, is located on the central plateau area of the country. The biome is characterized by the dominance of dwarf shrubs and grasses on the lower-lying valley bottom areas and plateaus, with medium-sized shrubs along the moderate to steep mountain slopes [14,15]. The Vachellia karroo tree is prominent along drainage lines and streams. Although it is not as diverse as other biomes, the fauna and flora of the region are adapted to the arid and semi-arid environments within which they occur. In the past, the biome was characterized by vast herds of springbok that used to migrate to the area in search of grazing land and water [16]. With the settlement of humans in the area, most wild animals were destroyed, while the fencing of the farms effectively cut off any animal migratory routes [17]. The wild ungulates were replaced by sheep and angora goats that comprise the major agricultural activity of the area today [18]. The stocking of the area with domestic animals lead to the heavy overgrazing of large sections of the biome [14]. Foreign plants were also introduced into the area, which has resulted in the displacement of the natural vegetation of the biome in many areas [19,20]. Moreover, mining activities in some parts have contributed to the destruction of the natural vegetation and habitat of the biome [13]. To make scientifically justifiable decisions on the management of the remaining natural habitat, research on the vegetation of the area must be continued. This will not only provide an inventory of the biome, but also of the diversity of species present [13].
The main objective of the present study was to determine the effects of environmental factors on plant species richness and diversity in the study area. The following hypotheses were tested: (i) species diversity and richness vary across different landscape units, and (ii) plant species richness and diversity significantly correlate with soil parameters and topographic factors.
2. Materials and Methods
2.1. Study Area
The study was conducted in MZNP (Figure 1), which covers an area of approximately 28,412 ha and is in the Eastern Cape Province, South Africa (32°22′47″ S; 25°47′8″ E). The park comprises three biomes of South Africa: Karoo Escarpment Grassland (53%), Eastern Upper Karoo (37%), and Eastern Cape Escarpment Thicket (10%) [2]. The Eastern Upper Karoo is characterized by flat and gently sloping plains, interspersed with hills and rocky areas where the dominant flora are dwarf microphyllous shrubs (Pentzia incana and Eriocephalus ericoides) [21]. The Karoo Escarpment Grassland is characterized by low mountains and hills, with wiry tussock grasslands and mountain wire grass (Merxmuellera disticha) being the dominant flora. The Eastern Cape Escarpment Thicket is characterized by steeply sloping escarpment and mountain slopes with medium-high and semi-open to closed thicket, where the dominant flora are olive trees (Olea europaea) [2]. The park is located on the northern slopes of the Bankberg mountain range [21]. It is dominated by sedimentary rock types such as the sandstones, siltstones, and mudstones of the Beaufort Series [22]. Mountainous terrain with steep-sided drainage lines makes up the southern quarter of the park, where the highest point is found along Bankberg Mountain at 1957 m above sea level, with the lowest part of the park in the northern section only reaching 1000 m above sea level [22,23]. The soil in the park is predominantly shallow, with large areas of the park being rocky and having minimal or no topsoil [21,22]. The average monthly temperature in summer (September to March) varies between a minimum of 6 °C and a maximum of 28 °C, whereas in winter (April to August), the temperature often drops below 0 °C and reaches maximums of 20 °C [24]. Rainfall occurs regularly from December to April [24], and the average annual rainfall is 400 mm (Figure 2) [25]. The region experiences periodic light snow during the winter months, and frost is common between May and October [24].
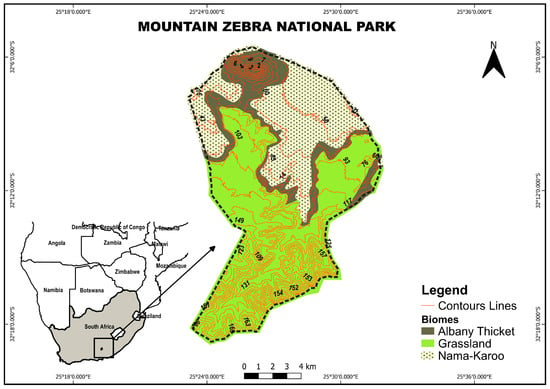
Figure 1.
Location of Mountain Zebra National Park (MZNP) in South Africa and the three biomes in the study area in the park (contour interval = 10 m).
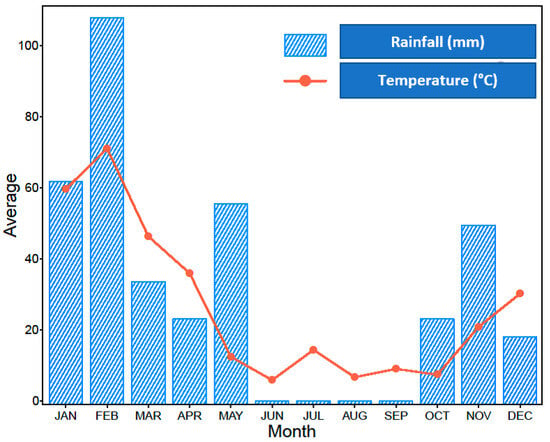
Figure 2.
Climate and rainfall in Mountain Zebra National Park from 2019.
2.2. Field Data Collection: Plot-Based Method
Sampling was conducted using transects distributed across the different vegetation units in the park (Figure 3). Vegetation units are the categories of different portions in the park that are based on the dominant vegetation and the growth forms. Data were collected using the step-point method [26], using an approach based on a method reported previously [27]. In total, 50 transects were sampled across the eight management units. Several plots differed across the vegetation units. The transects were 50 m long, and observations were made at 1 m intervals, where the plant in contact with the meter stick was identified and recorded. All plants in the plots were identified to the species level. The geographical positioning system (GPS) coordinates were recorded using a Garmin GPSMAP 64s GPS device. The study was conducted during the growing season (January to February 2021) to facilitate easy plant species identification.
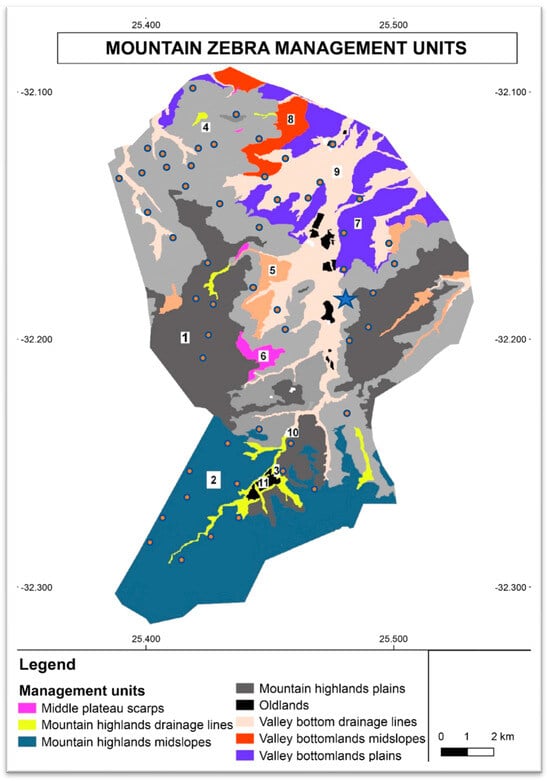
Figure 3.
Location of the monitoring plots in the Mountain Zebra National Park management units. The star symbol on the map represents the location of the climatic weather station. Number 1 to 11 on the map are different vegetation unit.
2.3. Climate and Soil Data
Digital elevation model (DEM) data were obtained to compute the slope, and aspect data and environmental data, except the rainfall data, were extracted for each sample site using Quantum GIS (QGIS) 2.18.0 (Las Palmas de G.C.). All of the layers that were applied in QGIS used the geographic coordinate system WGS84 and EPSG:4326 as a spatial reference. This was completed using WorldClim, which allows for the extraction of raster values to points. The soil physical properties included organic matter content, sand, clay, coarse fragments, and silt, whereas the chemical properties included nitrogen and organic carbon (Table 1).

Table 1.
Environmental variables used in the present study.
2.4. Statistical Analyses
Statistical analyses were performed using R (R Development Core Team 2019) [28]. Two response variables were investigated: species richness and the normalized Shannon diversity index (NSDI). Species richness was calculated as the absolute number of unique species in the corresponding vegetation units. The NSDI (a fractional value that varies between zero and one) was implemented as an extension of the original proposal by Shannon [29]. The association between the response variables and different environmental variables was evaluated using appropriate visual and quantitative statistical tools. Geographic coordinates were also considered as predictor variables in the models. The GPS coordinates serve as proxies for the environmental gradient, meaning that the information added to the model by the longitude and latitude variables can be considered as an indicator of the positions of the plots on the map. Because of the limited size of the dataset used for the analyses, all of the p-values reported in this work were adjusted for multiple testing using the Benjamini–Hochberg technique [30], which minimizes the risk of incorrectly rejecting the null hypotheses verified with the statistical tests. Notably, all areas in each vegetation unit had similar richness and NSDI values, implying that the vegetation unit variable perfectly separated the response variables. Regression analyses were used to separate and evaluate the relationship between the overall species richness and the NSDI. These analyses required us to implicitly assume that the unobserved population data of the pairs of responses were normally distributed, depending on the predictors. Environmental variables were included as predictors in the models. The decisions regarding the parsimonious models relied on Akaike information criteria [30] and an analysis of variance (ANOVA). The NSDI was estimated, such that for each vegetation unit ,
The notation is , where is the number of times species was observed in vegetation unit and denotes the total number of unique species observed across all the vegetation units. Normalization permits for unbiased comparisons among vegetation units.
3. Results
Both the species richness and the NSDI had low p-values (≈0.0003), indicating a statistically significant difference between richness and diversity across the vegetation units (Table 2). Unit 1 contained the highest number of species (34), whereas Unit 11 had more than five times fewer species (6). Subsequently, the degree of pairwise relationships between the vegetation unit response and each different environmental predictor was investigated using ANOVA and linear correlations.

Table 2.
Species richness and the normalized Shannon diversity index (NSDI), summarized concerning the vegetation unit.
The widths of the lines drawn in the graphical illustrations of continuous predictors were two times greater than those of the associated standard errors (Figure 4). The dots represent the positions of the corresponding average values. A statistically significant association was observed only between the vegetation units adopted here as a proxy for the NSDI and species richness. This inference was based on the corresponding low p-values (<0.05). The longitude coordinate, rainfall, and soil organic carbon content in Unit 2 appeared to be significantly higher than similar measurements in the other units.
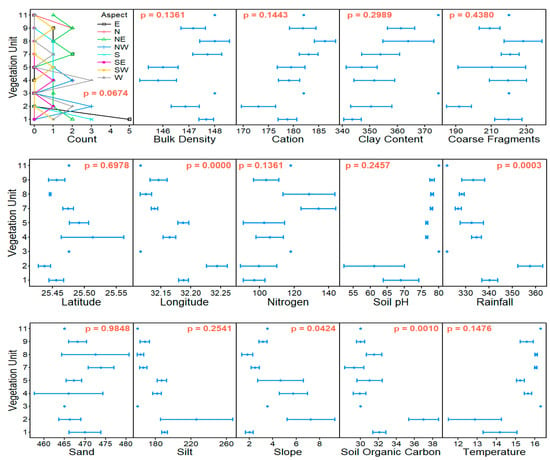
Figure 4.
Pairwise comparison of the environmental and geographical predictor variables against the vegetation unit variable. The vegetation unit was used here as a proxy for the normalized Shannon diversity index and the species richness response variables. The reported adjusted p-values were obtained from appropriate Fisher tests of association.
Outputs from examining the magnitude and direction of the linear relationship between all pairs of continuous variables in the data are summarized in the correlation matrix (Figure 5). It is evident from the matrix that the coarse fragment variable had the lowest degree of linear correlation with the other continuous variables in the data. However, longitude appears to have the strongest linear relationship with the other variables. Sand exhibited the highest (approximately zero) pairwise linear correlation. These observations implied that: (1) the information provided by the longitude coordinates was similar to that provided by many of the other variables in the data, indicating that such “other” variables are likely to be redundant; (2) sand and coarse fragment variables are unlikely to be displaced from an optimal model, except if the quality of the information that they contribute is invaluable.
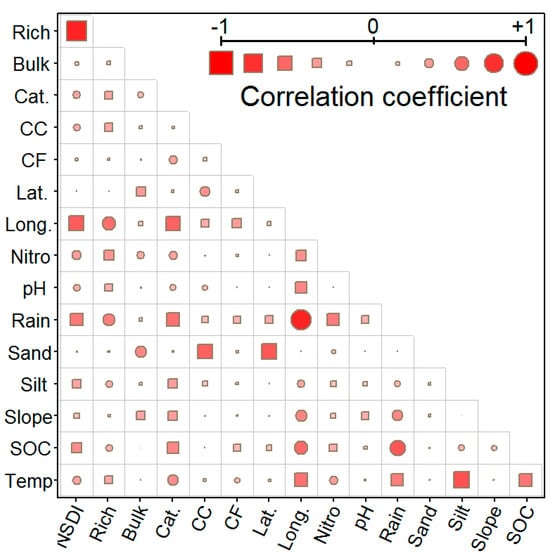
Figure 5.
Pairwise linear correlation matrix for all the continuous variables in the analyzed data. The cells’ color, size, and shape are proportional to the corresponding coefficients. NSDI = Normalized Shannon diversity index; Rich = Species richness; Bulk = Bulk density; Cat. = Cation; CC = Clay content; CF = Coarse fragments; Lat. = Latitude; Long. = Longitude; Nitro = Nitrogen; pH = soil pH Water; Rain = Rainfall; SOC = Soil organic carbon; Temp = Temperature.
The linear predictive equations for the NSDI and species richness, including all predictor variables in the dataset, are presented (Table 3). Note that the aspect categories were included in the model as dichotomous variables, with east being the reference category. Without a loss of generality, the East-Aspect category of vegetation units was adopted as the reference group for understanding the impact of Aspect on the response variables. The regression estimates from the regression model related to Aspect should be interpreted relative to the East-Aspect group. In addition, owing to its perfect portioning property, the vegetation unit variable was not included as a predictor variable. The degree of the observed variation in the response variable explained by the predictive models was measured by the adjusted correlation coefficient. The estimates were 38.13% and 33.43% for the NSDI and species richness, respectively. The regression coefficient estimated that eight of the predictors in the NSDI equal zero. This implied that the predictors did not affect the NSDI values in the presented full-model expression.

Table 3.
Parsimonious multiple linear regression for the species richness response as inferred through implementation of all-subset variable selection analysis.
Consequently, it is necessary to seek less complex models, i.e., those made up of fewer influential predictors, which are almost as effective as the full models.
The clay content, longitude, and sand predictor variables constituted the optimal models for both of the response variables (Table 3 and Table 4). These three variables were also inferred to significantly influence the estimates of both the NSDI and the species richness. This claim was based on the corresponding low adjusted p-values (<0.05). The clay content and sand variables had positive impacts on the response values. In contrast, the longitude tended to be negatively associated with the NSDI, but positively associated with species richness. Two predictors, namely soil organic carbon for the NSDI, and nitrogen for species richness, were included in the final models, despite them not showing a statistically significant impact in determining the relative response value. This non-significance could result from the conservativeness related to the multiple test corrections or because these variables represent confounders. Thus, a pair of predictors could benefit from future interrogation with a larger dataset. The optimal models identified through all-subset variable selection analyses used to achieve the set objective are summarized in Table 3 and Table 4 for the NSDI and species richness responses, respectively.

Table 4.
Optimal linear regression model for the normalized Shannon diversity index (NSDI) response, as identified through implementation of all-subset variable selection analysis.
4. Discussion
The main findings indicate that the chemical properties of soil (nitrogen and soil organic carbon) significantly impacted on species richness and diversity, and that the clay and sand content (i.e., soil texture) positively affected species diversity. In contrast, the physical properties of soil (silt) did not affect plant species richness and diversity.
Furthermore, our results suggested that soil nitrogen content influences species richness, as the nitrogen content was inversely proportional to species richness. The negative relationship between species richness and soil nitrogen content in the present study was in accordance with the findings of [31,32], but it contradicted the “fertility effect” theory of Dybzinski et al. [33]. Duprè et al. [34] conducted a temporal analysis of species richness in grassland and found that species richness significantly declined relative to the estimated cumulative nitrogen deposition. According to Stevens et al. [35], a decrease in plant species richness is linked to long-term chronic nitrogen addition in acidic grasslands in Great Britain. However, other authors have contended that species richness increases with the increase in fertility [36,37]. The results of the present study supported the hypothesis that plant species richness, diversity, and soil parameters are correlated. Evaluating the factors controlling plant species richness and diversity distribution patterns is crucial to conclude the unresolved debate regarding the association between plant diversity and soil properties [38]. The relationship between the soil and plant response is vital for succession and competition dynamics [39]. Environmental factors such as soil properties positively and negatively influence species diversity and richness [40].
In the present study, clay and sand content (i.e., soil texture) positively affected species diversity. This finding differs from the observation of Abbasi-Kesbi et al. [40] that species diversity was negatively correlated with sand and clay content. In general, the effect of soil texture on the distribution of plant species is due to the influence of moisture on the soil. Similarly, species richness was negatively correlated with clay and nitrogen content in the present study, as previously observed by [41], who reported a negative correlation between species richness and soil clay content. This study also showed that longitude had a positive impact on species diversity and a negative effect on species richness.
5. Conclusions
The objectives of this study were to determine the effects of environmental factors on plant species richness and diversity in the study area. Nitrogen showed an inverse relationship with species richness. The results from this study add to an overall understanding of vegetation structure and distribution in relation to environmental factors in mountainous grassland regions. Future research should examine the influence of environmental factors on plant biomass. This will enhance our understanding of the structure of plant communities, and the relationships between environmental factors and plant species of semi-arid vegetation.
Author Contributions
Proposal drafting, formal analysis, manuscript writing: N.M.; conceptualization: A.R., S.A. and H.B.; methodology: N.M., A.R., S.A. and H.B.; review and editing: A.R., S.A. and H.B.; data analysis and editing: N.M. and H.S. All authors have read and agreed to the published version of the manuscript.
Funding
This research was funded by the JRS6 Biodiversity Foundation, Washington DC, through South African National Parks (grant number SP-GK-1377).
Data Availability Statement
The data supporting this study’s findings are available from the corresponding author (NM), upon reasonable request.
Acknowledgments
We thank Masindi Raselabe, Senior Section Ranger for MZNP, for assisting in the field data collection.
Conflicts of Interest
The authors declare no conflict of interest.
References
- Heydari, M.; Mahdavi, A. The survey of plant species diversity and richness between ecological species groups (Zagros ecosystem, Ilam). J. App. Sci. 2009, 9, 745–751. [Google Scholar] [CrossRef]
- Brown, L.R.; Bezuidenhout, H. The vegetation of the farms Ingleside and Welgedacht of the Mountain Zebra National Park, Eastern Cape. Koedoe 2005, 48, 23–42. [Google Scholar] [CrossRef]
- Noss, R.F. Indicators for monitoring biodiversity: A hierarchical approach. Conserv. Biol. 1990, 4, 355–364. [Google Scholar] [CrossRef]
- Wang, B.; Zha, T.S.; Jia, X.; Gong, J.N.; Wu, B.; Bourque, C.P.A.; Zhang, Y.; Qin, S.G.; Chen, G.P.; Peltola, H. Microtopographic variation in soil respiration and its controlling factors vary with plant phenophases in a desert–shrub ecosystem. Biogeosciences 2015, 12, 5705–5714. [Google Scholar] [CrossRef]
- Pienaar, E.; Esler, K.J.; Mucina, L. Vegetation of mesas and surrounding plains in the southeastern Nama Karoo, South Africa. S. Afr. J. Bot. 2004, 70, 540–558. [Google Scholar] [CrossRef]
- Le Houérou, H.N.; Bingham, R.L.; Skerbek, W. Relationship between the variability of primary production and the variability of annual precipitation in world arid lands. J. Arid Environ. 1988, 15, 1–18. [Google Scholar] [CrossRef]
- Eskelinen, A.; Stark, S.; Männistö, M. Links between plant community composition, soil organic matter quality, and microbial communities in contrasting tundra habitats. Oecologia 2009, 161, 113–123. [Google Scholar] [CrossRef]
- Huang, K.Y. Evaluation of the topographic sheltering effects on the spatial pattern of Taiwan fir using aerial photography and GIS. Int. J. Remote Sens. 2002, 23, 2051–2069. [Google Scholar] [CrossRef]
- Bezuidenhout, H.; Brown, L.R. Mountain Zebra National Park phytosociological classification: A case study of scale and management in the Eastern Cape, South Africa. S. Afr. J. Bot. 2021, 138, 227–241. [Google Scholar] [CrossRef]
- Todd, S.W.; Hoffman, M.T. A fence line in time demonstrates grazing-induced vegetation shifts and dynamics in the semiarid Succulent Karoo. Ecol. Appl. 2009, 19, 1897–1908. [Google Scholar] [CrossRef] [PubMed]
- Hanke, W.; Böhner, J.; Dreber, N.; Jürgens, N.; Schmiedel, U.; Wesuls, D.; Dengler, J. The impact of livestock grazing on plant diversity: An analysis across dryland ecosystems and scales in southern Africa. Ecol. Appl. 2014, 24, 1188–1203. [Google Scholar] [CrossRef]
- Brown, L.R.; Bezuidenhout, H. Ecosystem description and diversity of the Jurisdam–Seekoegat sections of the mountain zebra national park, South Africa. S. Afr. J. Bot. 2018, 118, 166–178. [Google Scholar] [CrossRef]
- Bezuidenhout, H.; Brown, L.R. Vegetation description of the Doornhoek section of the Mountain Zebra National Park (MZNP), South Africa. Koedoe 2018, 50, 82–92. [Google Scholar] [CrossRef]
- Dean, W.; Richard, J.; Milton, S. (Eds.) The Karoo: Ecological Patterns and Processes; Cambridge University Press: Cambridge, UK, 1999. [Google Scholar]
- Mucina, L.; Rutherford, M.C. (Eds.) The Vegetation of South Africa, Lesotho and Swaziland; South African National Biodiversity Institute: Pretoria, South Africa, 2006. [Google Scholar]
- Palmer, A.R.; Hoffman, M.T. Nama-karoo. In Vegetation of Southern Africa; Cowling, R.M., Richardson, D.M., Pierce, S.M., Eds.; Pierce: Houston, TX, USA; Cambridge University Press: Cambridge, UK, 1997; pp. 167–188. [Google Scholar]
- Hoffman, M.T. Rationale for karoo grazing systems: Criticisms and research implications. S. Afr. J. Sci. 1988, 84, 556–559. [Google Scholar]
- Lloyd, J.W.; Nama, K. The Magnificent Natural Heritage of South Africa; Knobel, J., Ed.; Sunbird Publishing: Cape Town, South Africa, 1999; pp. 84–93. [Google Scholar]
- Milton, S.J.; Zimmermann, H.G.; Hoffmann, J.H. Alien plants. In The Karoo, Ecological Patterns and Processes; Dean, W.R.J., Milton, S.J., Eds.; Cambridge University Press: Cambridge, UK, 1999; pp. 274–287. [Google Scholar]
- Lovegrove, B. The Living Deserts of Southern Africa; Fernwood Press: Cape Town, South Africa, 1993. [Google Scholar]
- Comley, J. Population Assessment and Feeding Ecology of Brown Hyenas (Hyaena brunnea) in Mountain Zebra National Park, Eastern Cape, South Africa. Master’s Thesis, Rhodes University, Grahamstown, South Africa, 2016. [Google Scholar]
- Gaylard, A.; Mjadu, M.; De Klerk, J.; Spies, A.; Mathumba, W.; Holness, S.; Novellie, P.; Knight, M.; Bradshaw, P.; Ferreira, S.; et al. Mountain Zebra National Park: Park Management Plan; South African National Parks: Cradock, South African, 2006; Available online: https://www.sanparks.org/assets/docs/conservation/park_man/mznp-plan.pdf (accessed on 15 June 2023).
- Novellie, P.; Gaylard, A. Long-term stability of grazing lawns in a small protected area, the Mountain Zebra National Park. Koedoe 2013, 55, a1108. [Google Scholar] [CrossRef]
- Pond, U.; Beesley, B.B.; Brown, L.R.; Bezuidenhout, H. Floristic analysis of the Mountain Zebra National Park, Eastern Cape. Koedoe 2002, 45, 35–58. [Google Scholar] [CrossRef]
- Mentis, M.T. Evaluation of the wheel-point and step-point methods of veld condition assessment. Proc. Annu. Congr. Grassl. Soc. S. Afr. 1981, 16, 89–94. [Google Scholar] [CrossRef]
- Bothma, J.D.P.; Van Rooyen, N.; Van Rooyen, M.W. Using diet and plant resources to set wildlife stocking densities in African savannas. Wildl. Soc. Bullet. 2004, 32, 840–851. [Google Scholar] [CrossRef]
- R Development Core Team. R: A Language and Environment for Statistical Computing; R Foundation for Statistical Computing: Vienna, Austria, 2011; Available online: http://www.R-project.org (accessed on 15 June 2023).
- Shannon, C.E. A mathematical theory of communication. Bell. Syst. Techn. J. 1948, 27, 379–423. [Google Scholar] [CrossRef]
- Benjamini, Y.; Hochberg, Y. Controlling the false discovery rate: A practical and powerful approach to multiple testing. J. R. Stat. Soc. B 1995, 57, 289–300. [Google Scholar] [CrossRef]
- Akaike, H. Maximum likelihood identification of Gaussian autoregressive moving average models. Biometrika 1973, 60, 255–265. [Google Scholar] [CrossRef]
- Tilman, D. The ecological consequences of changes in biodiversity: A search for general principles. Ecology 1999, 80, 1455–1474. [Google Scholar] [CrossRef]
- Harpole, W.S.; Tilman, D. Grassland species loss resulting from reduced niche dimension. Nature 2007, 446, 791–793. [Google Scholar] [CrossRef]
- Dybzinski, R.; Fargione, J.E.; Zak, D.R.; Fornara, D.; Tilman, D. Soil fertility increases with plant species diversity in a long-term biodiversity experiment. Oecologia 2008, 158, 85–93. [Google Scholar] [CrossRef] [PubMed]
- Duprè, C.; Stevens, C.J.; Ranke, T.; Bleeker, A.; Peppler-Lisbach, C.; Gowing, D.J.G.; Dise, N.B.; Dorland, E.; Bobbink, R.; Diekmann, M. Changes in species richness and composition in European acidic grasslands over the past 70 years: The contribution of cumulative atmospheric nitrogen deposition. Glob. Chang. Biol. 2010, 16, 344–357. [Google Scholar] [CrossRef]
- Stevens, C.J.; Dise, N.B.; Mountford, J.O.; Gowing, D.J. Impact of nitrogen deposition on the species richness of grasslands. Science 2004, 303, 1876–1879. [Google Scholar] [CrossRef]
- Stark, N. The nutrient content of plants and soils from Brazil and Surinam. Biotropica 1970, 2, 51–60. [Google Scholar] [CrossRef]
- Gentry, A.H. Changes in plant community diversity and floristic composition on environmental and geographical gradients. Ann. Mo. Bot. Gard. 1988, 75, 1–34. [Google Scholar] [CrossRef]
- Silva, D.M.; Batalha, M.A.; Cianciaruso, M.V. Influence of fire history and soil properties on plant species richness and functional diversity in a neotropical savanna. Acta Bot. Brasilica 2013, 27, 490–497. [Google Scholar] [CrossRef]
- Kulmatiski, A.; Beard, K.H.; Stevens, J.R.; Cobbold, S.M. Plant–soil feedbacks: A meta-analytical review. Ecol. Lett. 2008, 11, 980–992. [Google Scholar] [CrossRef]
- Abbasi-Kesbi, M.; Tataian, M.R.; Tamartash, R.; Fattahi, B. Relationships between soil properties and plant diversity indices (Case study: Lashgardar protected rangeland, Malyer, Iran). J. Rangel. Sci. 2016, 7, 79–89. [Google Scholar]
- Shimono, A.; Zhou, H.; Shen, H.; Hirota, M.; Ohtsuka, T.; Tang, Y. Patterns of plant diversity at high altitudes on the Qinghai-Tibetan Plateau. J. Plant Ecol. 2010, 3, 1–7. [Google Scholar] [CrossRef]
Disclaimer/Publisher’s Note: The statements, opinions and data contained in all publications are solely those of the individual author(s) and contributor(s) and not of MDPI and/or the editor(s). MDPI and/or the editor(s) disclaim responsibility for any injury to people or property resulting from any ideas, methods, instructions or products referred to in the content. |
© 2023 by the authors. Licensee MDPI, Basel, Switzerland. This article is an open access article distributed under the terms and conditions of the Creative Commons Attribution (CC BY) license (https://creativecommons.org/licenses/by/4.0/).