
Article

Traceable and Biocompatible Carbon Dots from Simple Precursors: A Pre-Deployment Safety Baseline


by
Christian Silva-Sanzana
1,2,*,
Plinio Innocenzi
3,
Luca Malfatti
3,
Federico Fiori
3,
Francisca Blanco-Herrera
2,4,5,
Juan Hormazabal
6,
María Victoria Gangas
2,5,
Oscar Diaz
1 and
Iván Balic
1,*
1
Departamento de Acuicultura y Recursos Agroalimentarios, Universidad de Los Lagos, Av. Alberto Fuchslocher 1305, Región de los Lagos, Osorno 5290000, Chile
2
Centro de Biotecnología Vegetal, Facultad de Ciencias de la Vida, Universidad Andrés Bello, República 330, Santiago 8370146, Chile
3
Laboratory of Materials Science and Nanotechnology (LMNT), Department of Biomedical Sciences, CR-INSTM, University of Sassari, Viale S. Pietro 43C, 07100 Sassari, Italy
4
Center of Applied Ecology and Sustainability (CAPES), Santiago 8331150, Chile
5
Millennium Science Initiative Program (ANID), Millennium Institute for Integrative Biology (iBio), Santiago 8331150, Chile
6
Instituto de Ciencias e Innovación en Medicina, Facultad de Medicina, Clínica Alemana, Universidad del Desarrollo, Santiago 7610658, Chile
*
Authors to whom correspondence should be addressed.
Agrochemicals 2025, 4(4), 20; https://doi.org/10.3390/agrochemicals4040020
Submission received: 11 October 2025 / Revised: 9 November 2025 / Accepted: 14 November 2025 / Published: 20 November 2025
(This article belongs to the Section Fungicides and Bactericides)

Abstract

Carbon dots (CDs) are promising for agro-environmental applications; however, clear connections between synthesis, photophysical properties, size, and biosafety are often not well established. In this study, we map these relationships for glucose–arginine CDs (GA-CDs). By using microwave and hydrothermal routes at precursor ratios of 1:3, 1:9, and 1:15, we produced sub-10 nm nanoparticles (analyzed by dynamic light scattering and atomic force microscopy) that exhibit tunable absorption and emission properties, as well as surface properties (demonstrated through UV–Vis spectroscopy, 3D photoluminescence, and FTIR analysis). The hydrothermal 1:9 condition yielded the narrowest size distribution and red-shifted photoluminescence. Across biological models spanning plants, insects, plant-growth-promoting bacteria (PGPR), and human cells, GA-CDs were well tolerated, with no adverse changes detected in plant stress markers, aphid feeding behavior or fecundity, or PGPR growth. In A549 cells, viability remained stable up to a concentration of 0.125 mg mL−1, while exposure to 0.5 mg mL−1 reduced viability, establishing a practical operating range. These results provide a clearer picture of how the structure and properties of carbon dots derived from arginine and glucose are correlated to their safety. The GA-CDs are, therefore, useful, and traceable tools for agro-environmental research. The findings support their use as biocompatible nanomaterials for studying interactions among plants, insects, and microbes in agriculture.

1. Introduction

Conventional crop protection is an essential need for ensuring food production; however, the ecological and human health risks associated with traditional chemicals have increased interest in nano-enabled strategies that are proven to be safe, sustainable, and traceable in real agricultural ecosystems. In this context, carbon dots, generally defined as quasi-spherical nanoparticles smaller than 10 nm and characterized by abundant surface groups and bright, excitation-dependent photoluminescence, can play an important role. They are water-dispersible and generally display low toxicity across biological systems [1,2]. Several studies have highlighted their potential applications in agriculture and plant research, also including their use for imaging, sensing, and enhancing crop performance. These works have also emphasized the importance of establishing their safety before deployment in the field [3,4].
In agro-environmental settings, the fluorescence of carbon dots (CDs) enables direct in situ tracing. This property allows checking where CDs are deposited, how they move, and where they end up in plant tissues, all without using heavy metal labels. As a result, it is possible to track tissue localization and bioaccumulation using optical imaging and spectroscopy, thereby avoiding the need for destructive extraction methods. In comparison, traditional methods for assessing pesticide bioaccumulation usually require time-consuming sample preparation [5,6]. Research has shown that carbon dots can be seen in plant cells under UV or near-UV light, and they have good photostability and biocompatibility [7,8]. The size of carbon dots plays an important role in determining how effectively they enter target cells. Particles between 5 and 20 nm can pass through plant cell walls, giving them access to plant tissues. Particles smaller than 10 nm can also pass through insect cuticles, making them more effective as nanocarriers for RNAi technologies by improving delivery to target sites [9,10,11,12]
Although there have been recent advances, two main gaps still exist. The first is a limited understanding of how the synthesis parameters, such as the method used and the ratios of precursors, influence photophysics, surface chemistry, and particle size. This makes it hard to set design rules for specific uses [1,2]. The second gap relates to biosafety testing, which is often conducted in just one model, despite agroecosystems involving plants, insects, microbes, and potential human exposure. Addressing both gaps reinforces the idea of safe and sustainable by design, meaning safety is planned from the outset, and the safe conditions for using the material are clearly defined [13].
In this study, we address these needs for glucose–arginine carbon dots (GA-CDs) [14]. We have studied how different processing methods, microwave and hydrothermal, as well as varying precursor ratios of 1:3, 1:9, and 1:15, influence UV-visible absorption, fluorescence maps of excitation-emission intensity, and FTIR signatures. Our results indicate that both hydrothermal and microwave syntheses with specific glucose-to-arginine ratios affect photophysics, surface chemistry, and particle size. Among the tested conditions, the sample prepared in hydrothermal conditions and with the 1(glucose):9(arginine) weight ratio represents a good benchmark, yielding sub-10 nm particles with improved passivation and stable photoluminescence. Overall, GA-CDs (1:9 h) exhibit (i) a size previously reported to support dsRNA delivery via topical application in plant and insect tissues; (ii) stable blue–green photoluminescence, which enables reliable in-tissue traceability within Arabidopsis leaves under 405 nm excitation; and (iii) a favorable biosafety profile, with no detectable stress markers in Arabidopsis, no measurable effect on aphid performance, no inhibition of plant-growth promoting bacteria (PGPB) Pseudomonas putida or Pseudomonas protegens up to 0.5 mg mL−1, and no significant cytotoxicity in human-derived A549 cells within an operational window of ≤0.25 mg mL−1. By combining material tuning and biosafety within accessible, green chemistry-aligned synthesis, this work identifies a non-toxic operating range across various model organisms that supports the potential use of GA-CDs in agricultural ecosystems.

2. Materials and Methods

Synthesis of GA-CDs was carried out by dissolving glucose and arginine in 20 mL of Milli-Q water at glucose–arginine ratios of 1:3, 1:9, and 1:15. We evaluated glucose–arginine mass ratios of 1:3, 1:9, and 1:15 a priori to sample a practical range from moderate to high excess of the amine-rich precursor (arginine), aiming to tune the density of nitrogen-containing surface functionalities (amine/amide/imine) introduced during the green thermal condensation of glucose and arginine. This rationale is consistent with prior reports where amine-rich co-precursors modulate N-related surface states and photophysical behavior in carbon dots. For the microwave route, the solutions were irradiated in a microwave oven (LG MC2146BV; LG Electronics, Seoul, South Korea) at 800 W for 4 min. For the hydrothermal route, the solutions were transferred to Teflon-lined vessels and heated at 180 °C for 2 h. The crude dispersions were then passed through 0.22 µm syringe filters and dialyzed against ultrapure water using 2 kDa MWCO tubing for 48 h. Finally, the purified samples were freeze-dried and stored as dry powders for subsequent analyses.
Ultraviolet-Visible (UV-Vis) spectra were acquired in absorbance mode from 200 to 800 nm, with a bandwidth of 1.5 nm, by a Nicolet Evolution 300 spectrophotometer (Thermo Fisher). The pure products were diluted with Milli-Q water at 0.8 mg mL−1, and data were collected using quartz test cuvettes.
Absorption Fourier-transform infrared (FTIR) spectra were recorded by a Vertex 70 interferometer (Bruker) in the 4000−400 cm−1 range with a 4 cm−1 resolution and 32 scans. The spectra were recorded using KBr pellets with 1 mg of sample and 500 mg KBr.
Photoluminescence (PL) spectroscopy measurements were performed in 3D fluorescence mapping mode [excitation (y) − emission (x) − intensity (z)] using a Horiba Jobin Yvon NanoLog spectrofluorometer equipped with a 450 W Xenon lamp as excitation source. Data were collected in an excitation/emission range of 250–700 nm (increment = 5 nm). Slits were fixed at 3 nm for both excitation and emission, and integration time was set at 0.1 s. GA-CDs concentration of 0.1 mg mL−1 was used for the analysis.
Dynamic Light Scattering (DLS) measurements were performed with a Zetasizer Nano ZSP (Malvern Instruments, Westborough, MA, USA) to evaluate the hydrodynamic diameters (size) of the products. The scattering cell temperature was maintained at 25 °C. Samples were prepared by dissolving the freeze-dried powders in Milli-Q water at 1 mg mL−1 and left to equilibrate for 120 s before measurement. Data were finally elaborated using the Zetasizer software version 7.12. The result was obtained by averaging three replicates.
Atomic Force Microscopy (AFM) measurements were performed in semicontact mode with an NT-MDT Ntegra microscope, with a scan speed of 0.2 Hz, using a silicon tip with a nominal resonance frequency of 150 kHz, 5 N m−1 force constant, and 10 nm typical curvature radius. The samples were prepared for analysis by drying one drop of the product’s diluted solutions (0.5 mg mL−1) on pre-washed silicon wafers
Confocal microscopy was used to trace GA-CDs in fresh tissue. Fresh Arabidopsis leaves were infiltrated with a solution of 0.5 mg/mL GA-CDs dissolved in pure water. Leaves were placed between glass slides and coverslip using low-melting agarose to avoid sample movement during image acquisition. Imaging was performed using TCS LSI confocal microscope equipped with PlanApo 53/0.5 LWD objective lens (Leica Microsystems, Wetzlar, Germany). Laser lines of 405 nm, 488 nm, 561 nm, and 635 nm were used to trace GA-CDs infiltrated in fresh tissue.
Semi-quantitative analysis of fluorescence. Confocal fluorescence images were analyzed in Fiji/ImageJ (fiji-java6-20170530, NIH) from Leica .lif files imported with Bio-Formats. For each dataset, the fluorescence channel of interest was isolated, and the Z-stack was converted to a two-dimensional image by maximum-intensity projection. Display settings (brightness/contrast) were adjusted with the same min/max range for that channel across all biological replicates. Semi-quantitative measurements were then obtained by recording the Mean gray value [a.u.] with the “Set Measurements/Measure” tools. At least four independent leaves from different plants were used as biological replicates.
Non-destructive measurements of chlorophyll, anthocyanins, and flavonoid content were performed using a Dualex fluorimeter (Dualex Scientific+; FORCE-A, Orsay, France). 1-week-old Arabidopsis plants were weekly sprayed during 4 weeks with a solution of 0.5 mg mL−1 GA-CDs dissolved in pure water and 0.1% v/v Tween-20. Measurements were performed after the first and the fourth week of treatment using a solution of pure water and 0.1% v/v Tween-20 as a control (mock). Four plants per condition were used as biological replicates.
Aphid fecundity was assessed on four-week-old Arabidopsis plants treated with GA-CDs (0.5 mg mL−1, 1:9 h) by leaf infiltration and subsequent foliar spraying to ensure aphid exposure via ingestion and direct contact. Two 1-day-old M. persicae nymphs were placed on fully expanded leaves previously infiltrated with GA-CDs (0.5 mg mL−1, 1:9 h) and confined using transparent plastic clip cages. Caged plants were then sprayed with GA-CDs (0.5 mg mL−1, 1:9 h) every 6 days. The total number of offspring was counted 12 days after confinement, and the results are reported as offspring per aphid
Feeding behavior of aphids was monitored using electrical penetration graphs (EPG). Briefly, Adult wingless M. persicae aphids were immobilized on a pipette tip coupled to a vacuum pump; then, a 12 nm diameter gold wire was attached to the insect dorsum using water-based silver glue (EPG Systems, Wageningen, The Netherlands). The other end of the gold wire was attached to the EPG probe provided with the Giga-8 device. The EPG circuit was completed by inserting a copper electrode into the plant–soil (ground). Wired aphids were placed on leaves, and the feeding behavior was monitored for 8 h. The number of replications for each condition (mock or GA-CDs) was at least 15. EPG waveforms were recorded using a Giga-8 DC-EPG device (EPG Systems, Wageningen, the Netherlands) and manually analyzed using Stylet1 (EPG System, Wageningen, the Netherlands). The parameters derived from EPGs were expressed as the total duration in minutes.
Plant growth-promoting bacteria (PGPB), P. putida KT2440 (Ppu KT2440) and P. protegens, Pf-5 were evaluated to observe the effect of GA-CDs on their growth kinetics. Bacterial inoculate were prepared from cryogenic glycerol stocks stored at −80 °C. The bacteria were cultured in King’s B (KB) medium supplemented with kanamycin (Km, 50 µg mL−1). Cultures were incubated with shaking at 200 rpm for 16 h at 28 °C. After incubation, cultures were centrifuged at 5000× g for 5 min at room temperature and washed with 10 mM MgCl2. The optical density was then adjusted to 0.5 for the agar plates diffusion assay and to 0.05 for the growth curve experiments. For the agar diffusion assay, bacteria were inoculated onto 9 cm diameter KB solid agar plates. GA-CDs 1:9 h solution (0.5 mg mL−1) were then applied by dropping 0, 1, 5, and 10 μL onto the inoculated agar. The plates were incubated at 28 °C for 2 days, after which bacterial growth was observed.
To evaluate growth kinetics, bacteria were exposed to different nanoparticle concentrations (0, 0.025, 0.3, and 0.5 mg mL−1) in KB medium using 24-well transparent plates (Falcon, New York, USA; cat. no. 353047). The plates were incubated at 28 °C in an Infinite® M200 Pro reader (Tecan, Männedorf, Suiza). The optical density at 600 nm (OD600 nm) was measured every hour for 24 h. The collected data were analyzed using the Growthcurver package in R to determine the carrying capacity (k) and growth rate (µ).
Cytotoxicity of GA-CDs 1:9 h on human cells was evaluated in A549 (WT) cells cultured in DMEM + 10% FBS and seeded into 96-well clear plates (8 × 10³ cells/well, 100 µL). GA-CDs were sterile-filtered and serially diluted (1:2) in complete medium to 0.50–0.0078 mg mL−1; vehicle and medium blanks were included. After 48 h incubation at 37 °C, viability was quantified using the MTS assay (CellTiter 96® AQueous One Solution, Promega, WI, USA) 20 µL reagent/well, 2 h at 37 °C, and absorbance read at 490 nm. To control nanoparticle interference, compound-only wells (medium + GA-CDs + MTS, no cells) were run. Each concentration was tested in four technical replicates and two independent experiments. Raw A490 values were blank/compound-corrected, and normalized according to values obtained from cell culture without CDs (used as a reference of 100% cell viability).

3. Results

3.1. UV–Vis, FTIR, and 3D Maps of Fluorescence Emission-Excitation-Intensity of GA-CDs Show Different Signatures Depending on Precursor Ratio and Heat Treatment

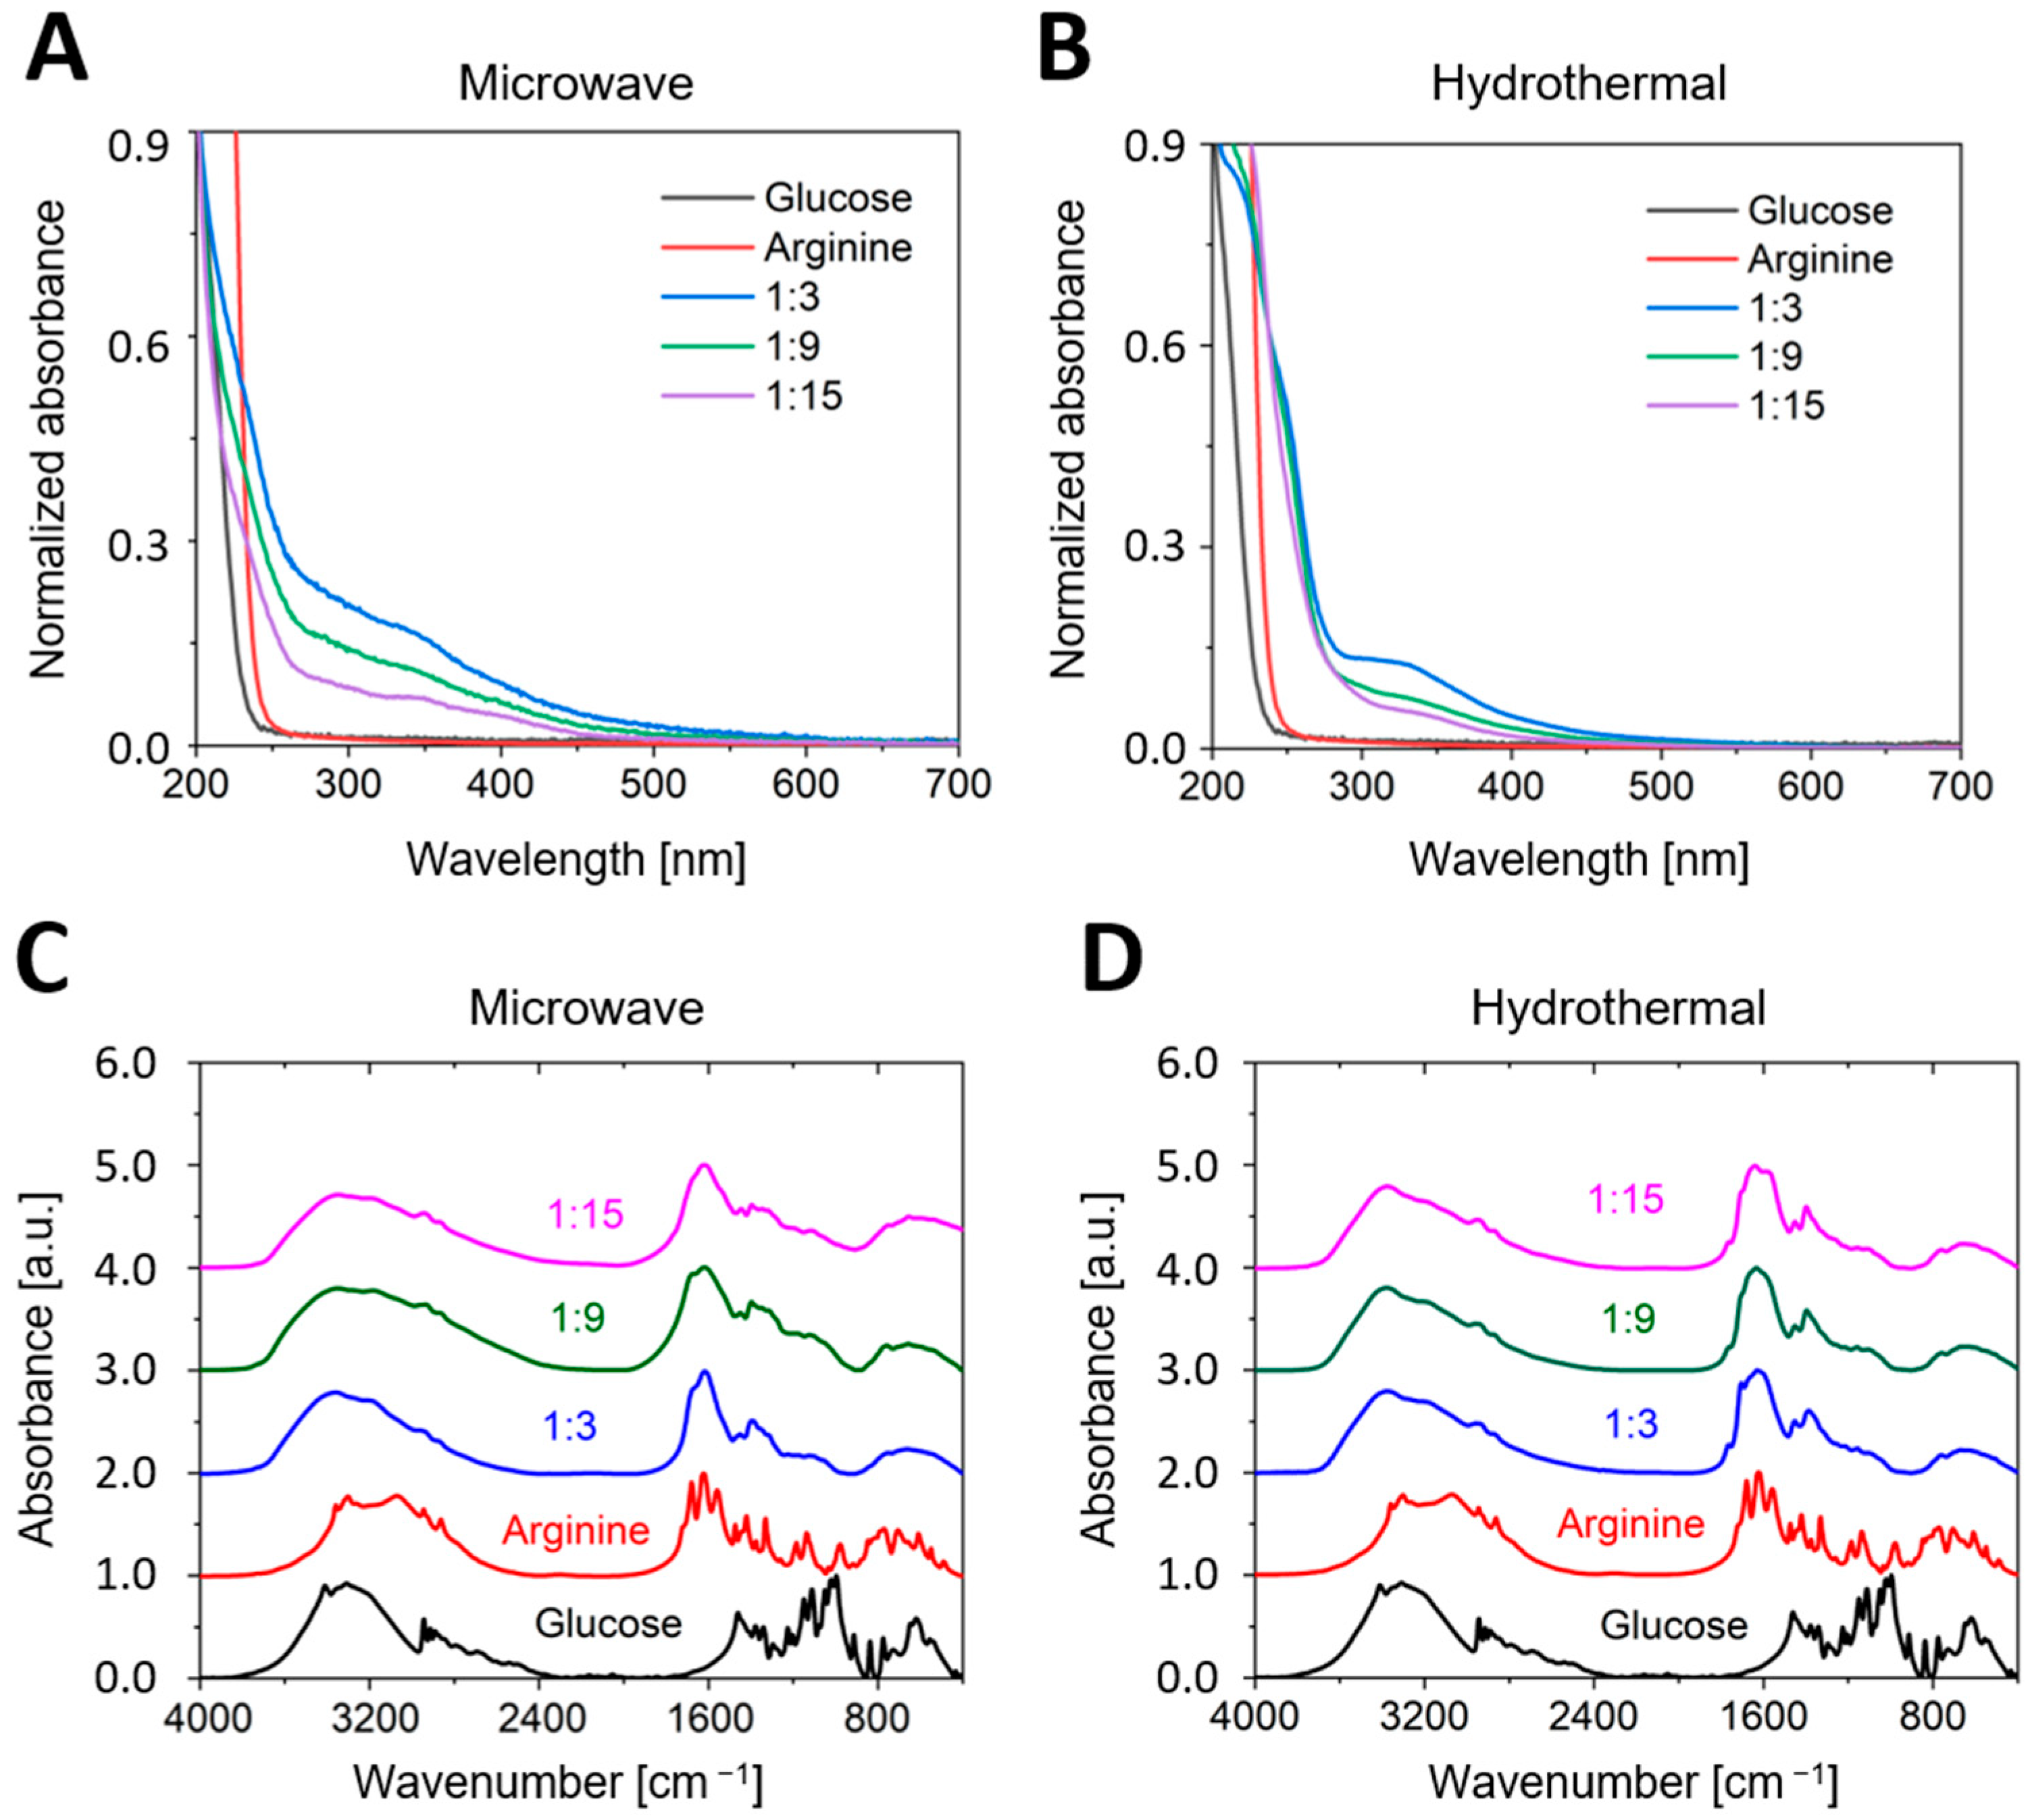
Compared to the sharp deep-UV peaks of the precursors (200–220 nm; negligible signal > 260 nm), all GA-CD spectra broadened, showing (i) a shoulder at ~230–280 nm attributed to π–π* transitions of aromatic C=C and/or conjugated C=O groups, and (ii) a long tail extending into 400–500 nm assigned to n–π* transitions from carbonyl/heteroatom surface states and extended conjugation (Figure 1A). Notably, at matched precursor ratios, hydrothermal synthesis displayed slightly more pronounced long-wavelength tails than microwave synthesis (e.g., 1:3). For both synthesis routes, the 1:3 ratio exhibited the strongest visible tail, followed by 1:9 and then 1:15 (Figure 1A). Overall, these observations indicate that the electronic transitions are route- and ratio-dependent.
FTIR spectra of GA-CDs prepared through microwave and hydrothermal routes, examined in the range of 1500–1750 and 2750–3000 cm−1, reveal distinct changes compared to glucose and arginine. These changes indicate surface condensation (Figure 1). In the 1500–1750 cm−1 region, all GA-CDs exhibit a dominant vibrational mode at 1630–1660 cm−1, which corresponds to amide I [ν(C=O), with possible sp2 C=C/C=N contributions]. Along with a secondary feature at 1540–1560 cm−1 that aligns with amide II [δ(N–H) + ν(C–N)]. Concurrently, there is a significant reduction in the precursor carbonyl signal at 1720–1735 cm−1, indicating that free carbonyls have been consumed and that amide/imine functionalities have formed during the condensation of glucosamine/arginine. These characteristic bands are more clearly defined and exhibit greater intensity in the hydrothermal samples, particularly in the ratio of Glu:Arg 1:9 (Figure 1B), suggesting a higher degree of passivation/ordering of surface groups under hydrothermal conditions.
In the range of 2750–3000 cm−1, weak CH-stretching doublets at approximately 2920 and 2850 cm−1 (ν_as/ν_s CH2/CH3) confirm the presence of residual aliphatic moieties. The relative intensity is higher in microwave-derived CDs (Figure 1B), which is consistent with partial carbonization while retaining alkyl fragments. In contrast, the hydrothermal series displays broader and lower-intensity CH signals, indicating a greater degree of aromatization of the carbon core. Overall, the emergence of amide I/II bands, along with the loss of the carbonyl band in the range of 1720–1735 cm−1, suggests that efficient condensation has occurred between the precursors, resulting in surfaces rich in amide/imine groups. Furthermore, the differences observed between the preparation routes reflect variation in aliphatic content and structural ordering.
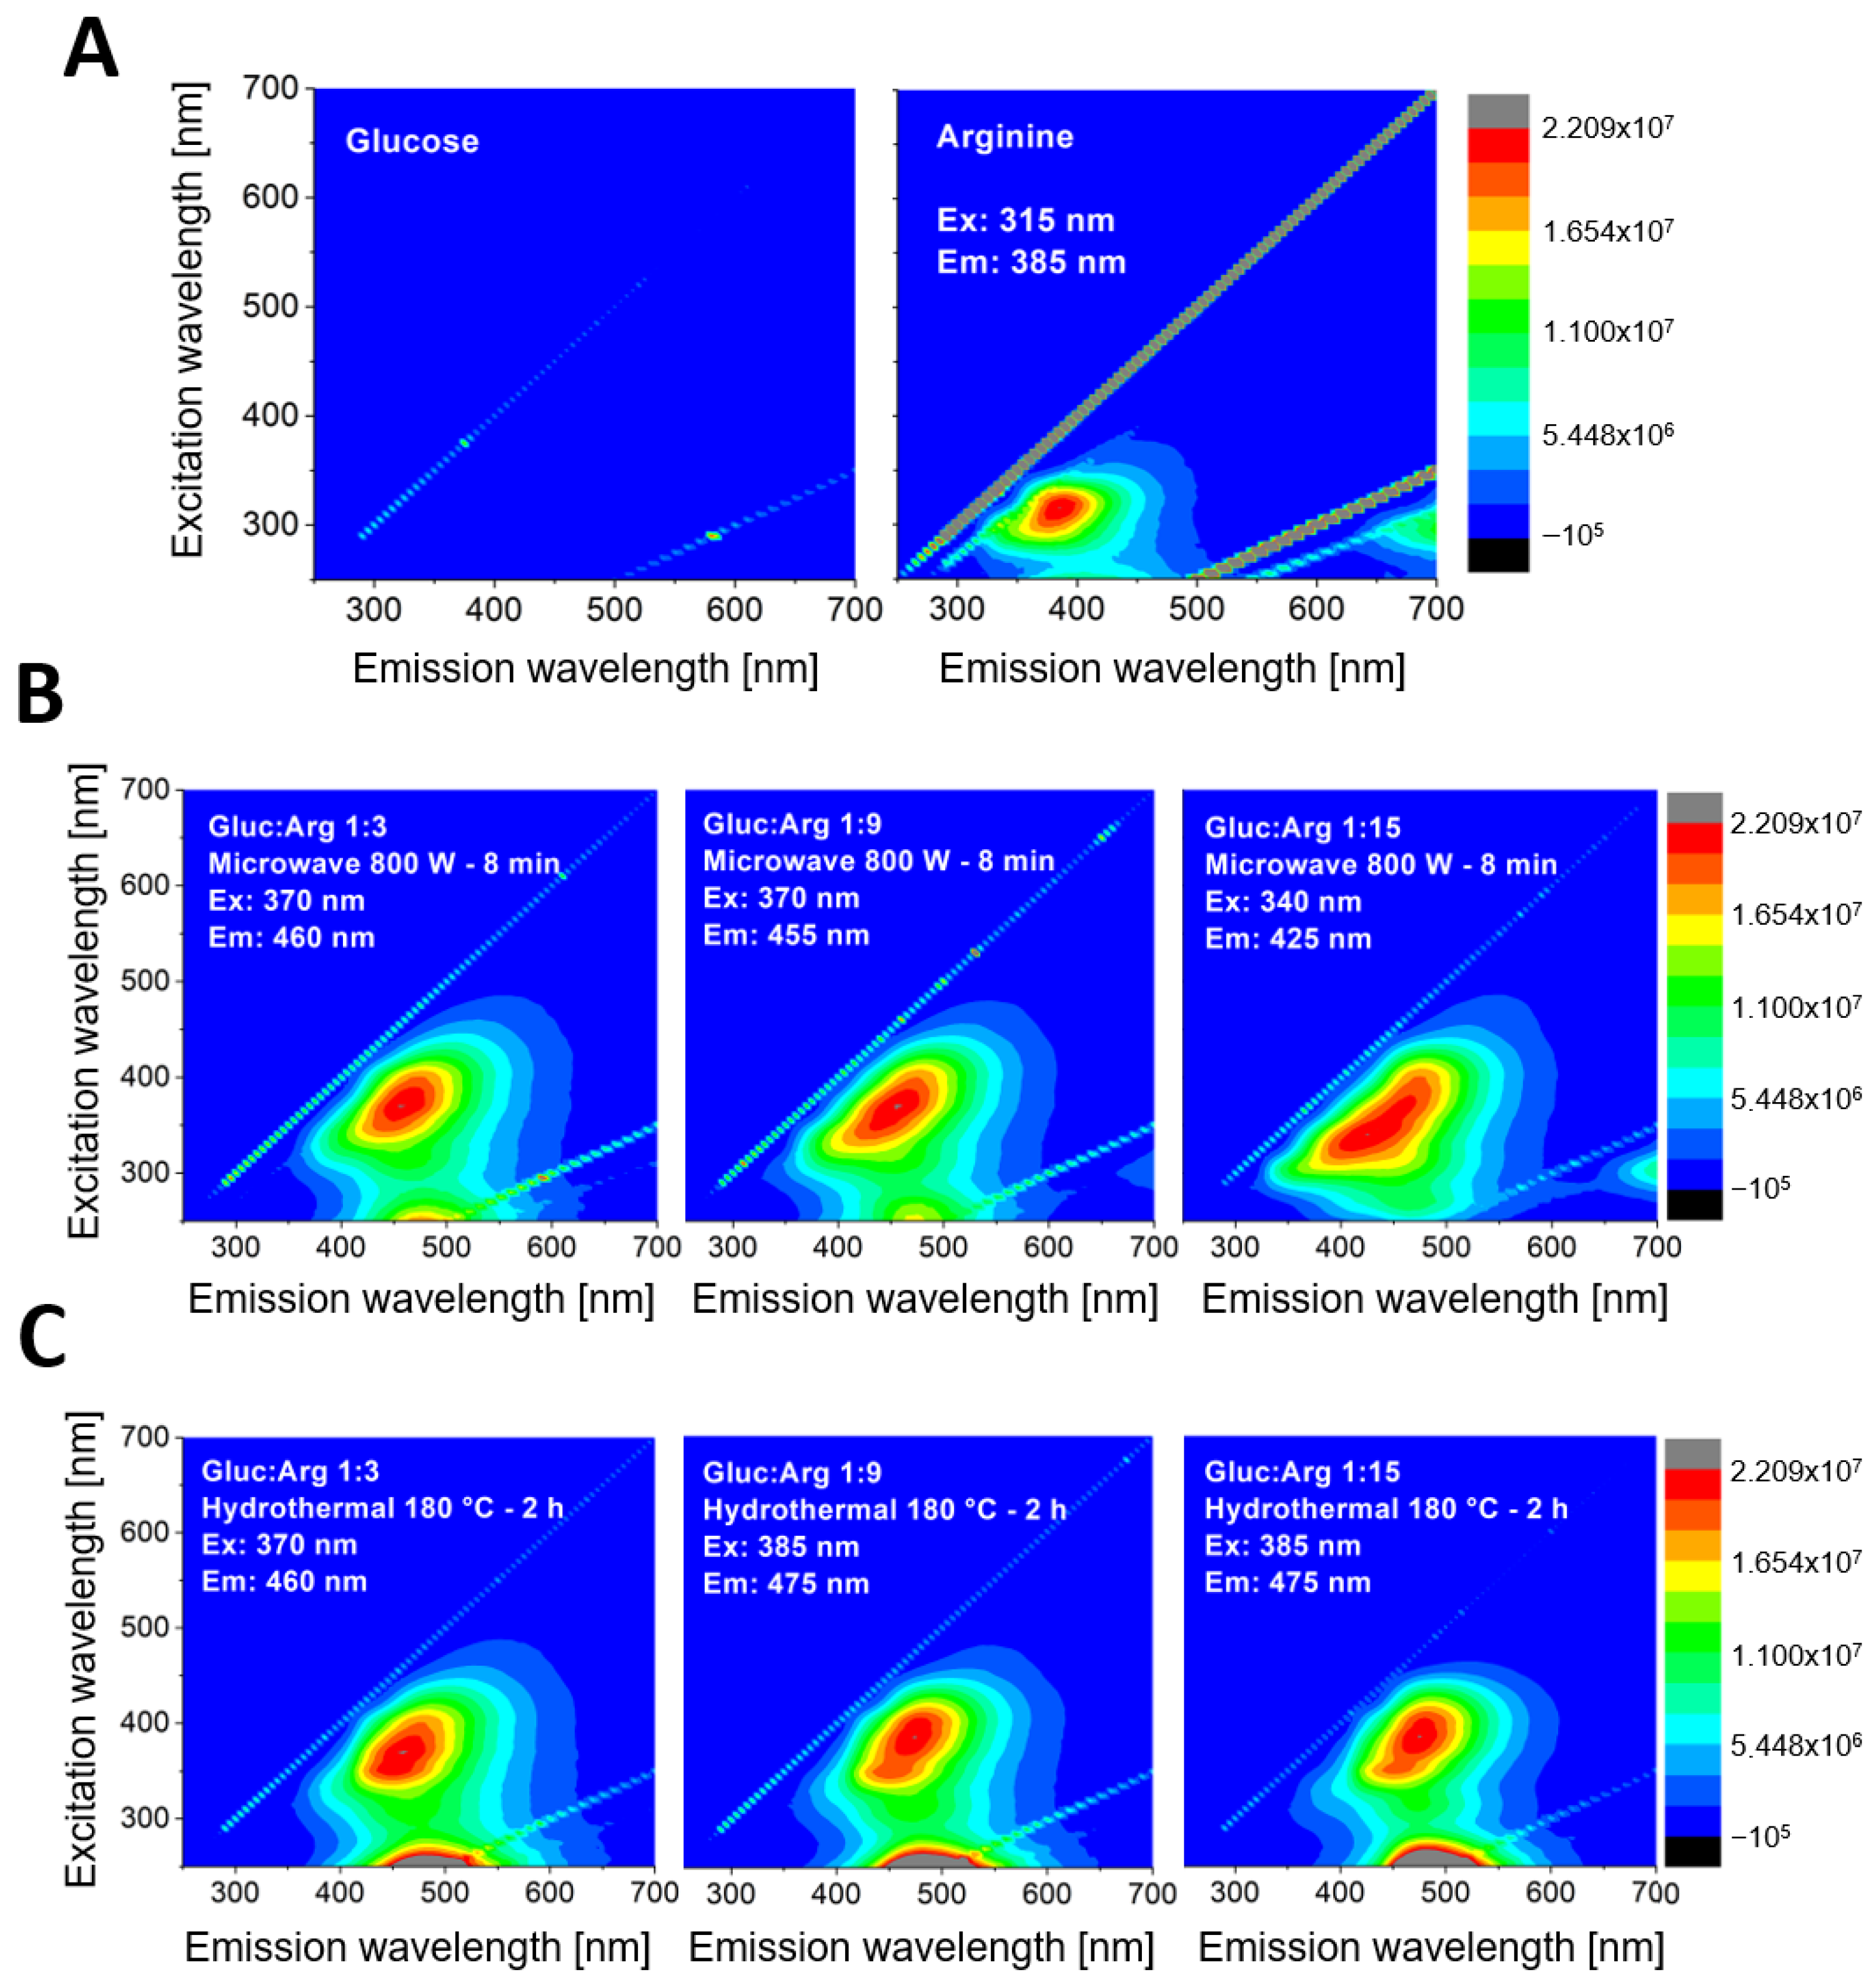
Three-dimensional excitation–emission–intensity maps showed that GA-CDs differ from their molecular precursors (Figure 2). Glucose was non-emissive, whereas arginine displayed a narrow band centered at Ex 315 nm/Em 385 nm (Figure 2A). All GA-CDs exhibited a single apparent blue–green maximum whose coordinates depended on synthesis route and precursor ratio: microwave synthesis 1:3 at Ex ≈ 370 nm/Em ≈ 460 nm; 1:9 at 370/455 nm; 1:15 at 340/425 nm; hydrothermal synthesis 1:3 at 370/460 nm; 1:9 at 385/475 nm; and 1:15 at 385/475 nm (Figure 2B,C).

3.2. GA-CDs Obtained from Hydrothermal Treatment of Glu:Arg 1:9 Precursors Yield Spherical < 10 nm Nanoparticles

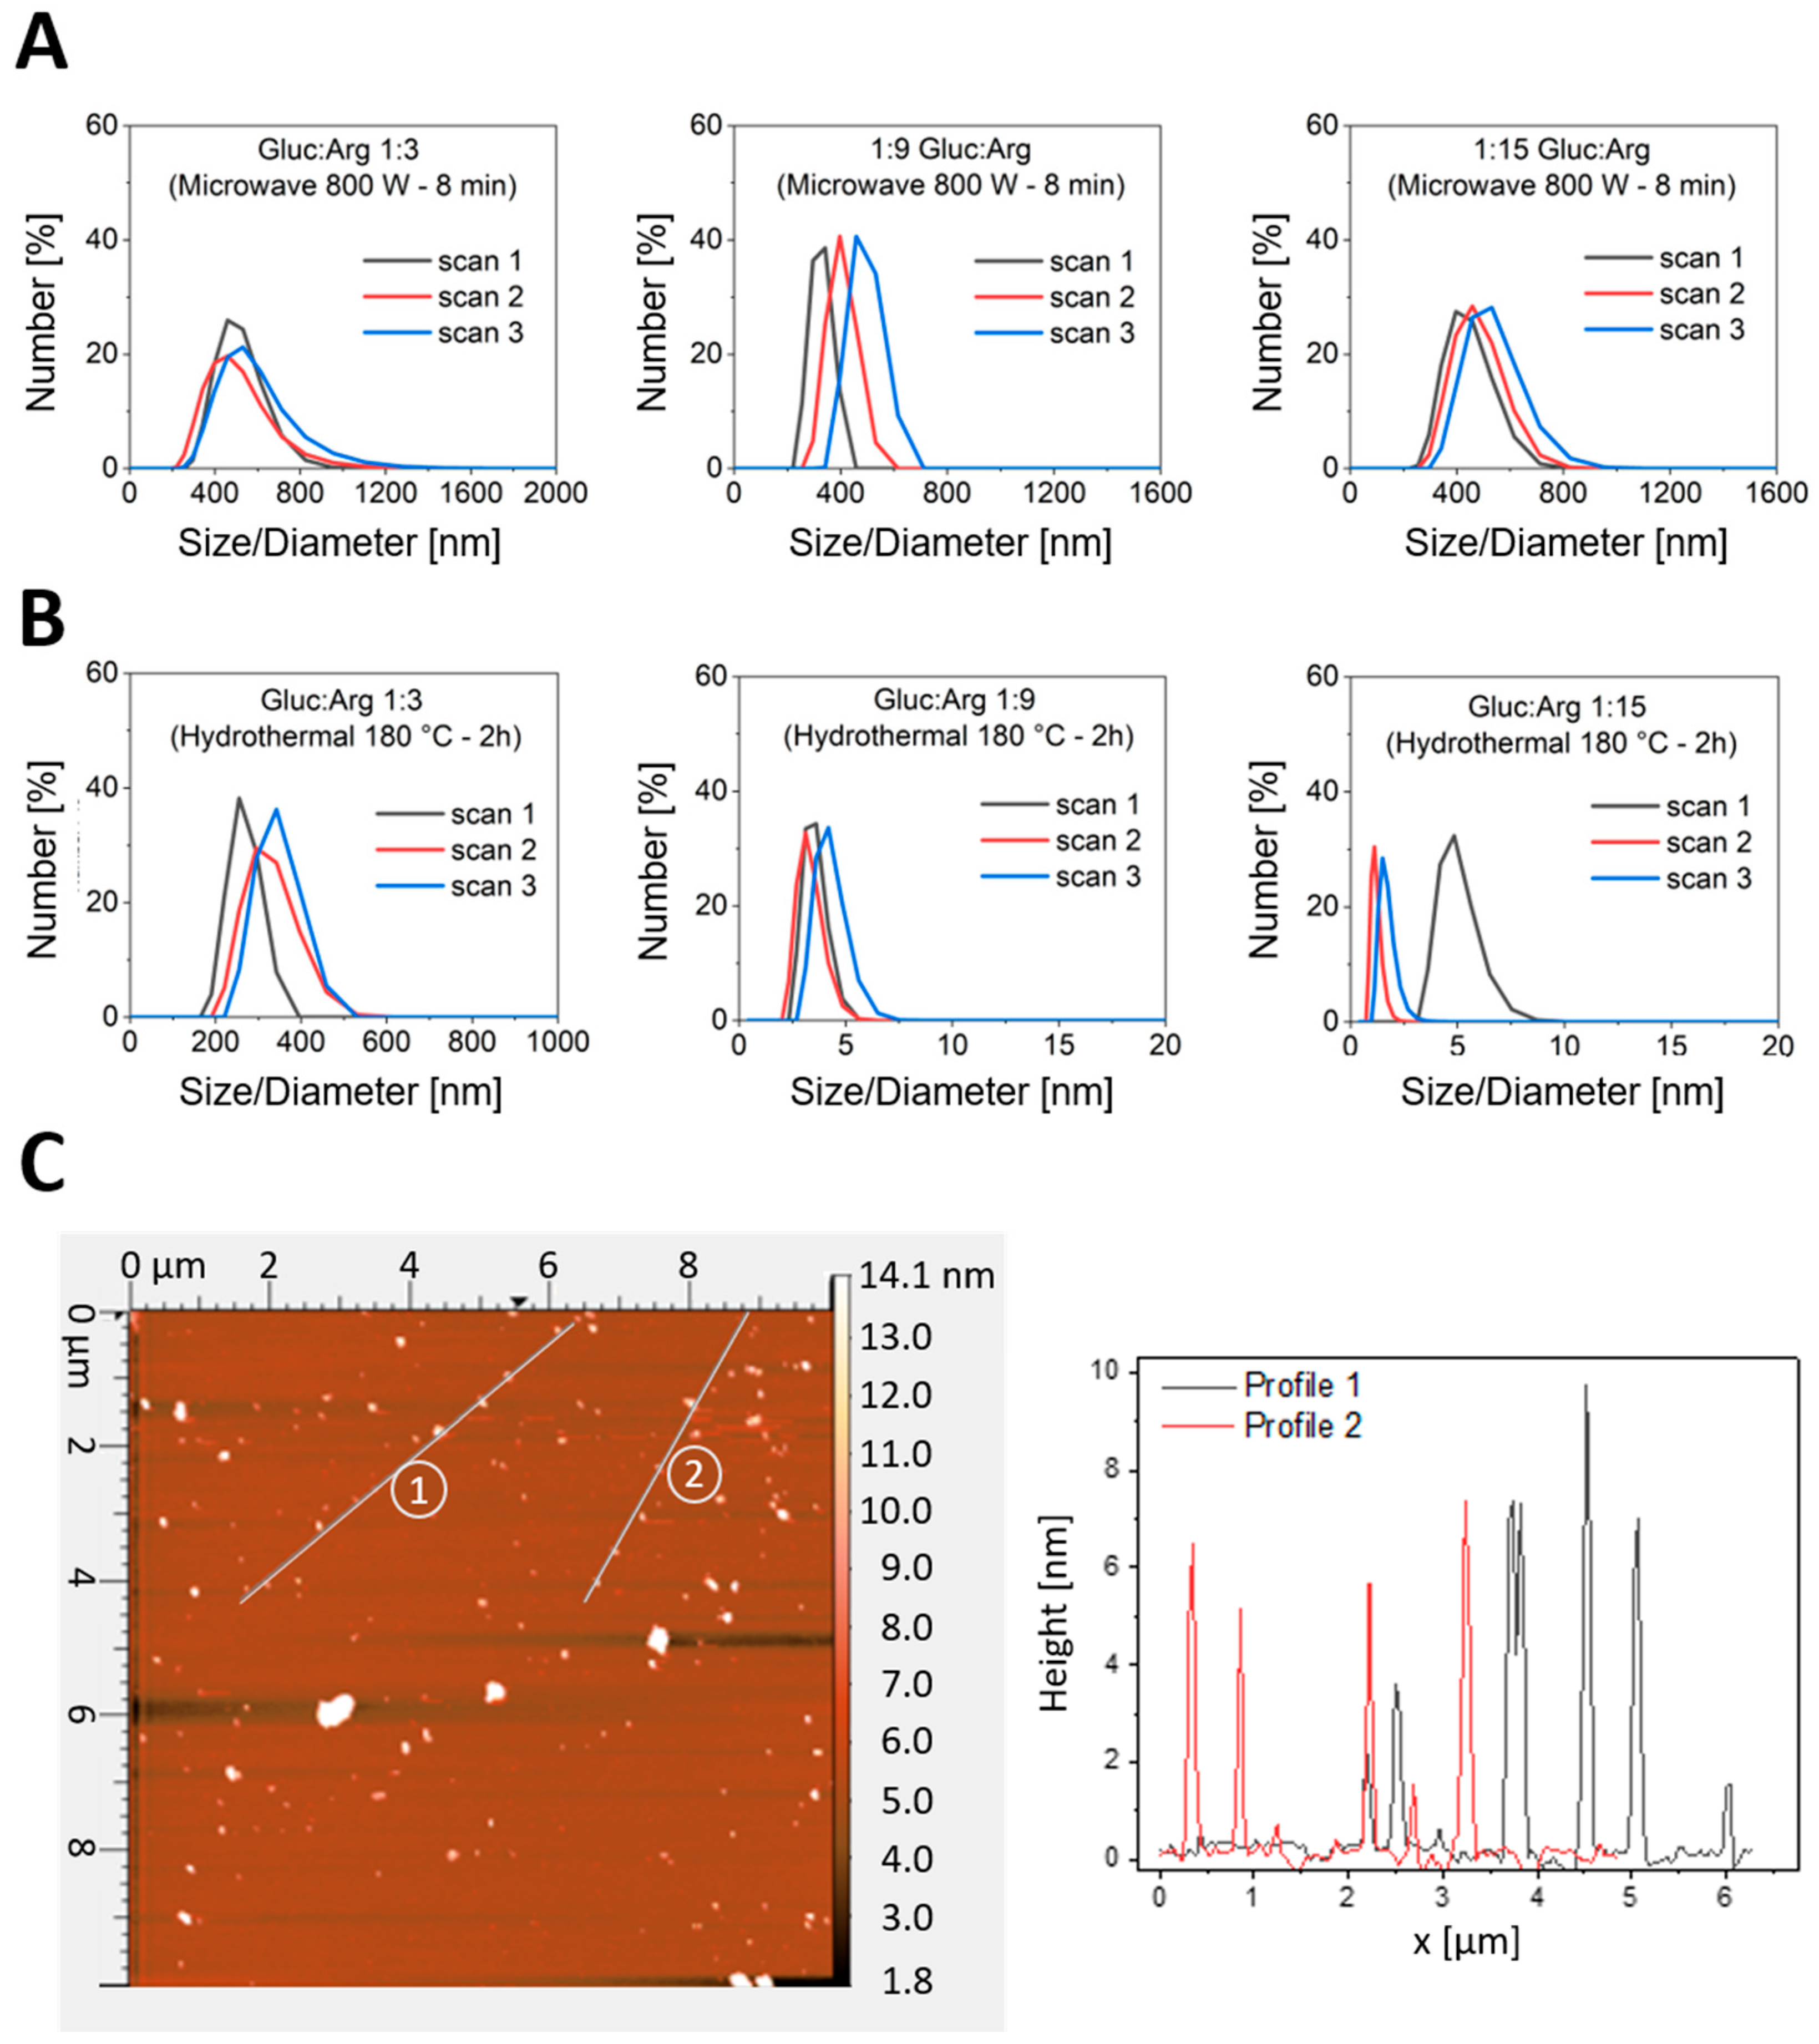
Dynamic light scattering (DLS) profiles showed clear differences between the two synthesis methods. In particular, microwave synthesis produced samples with broad number-weighted distributions, peaking between 100 and 300 nm (Figure 3A). This suggests the formation of agglomerates, rather than a dispersion of single dots. In comparison, hydrothermal synthesis with glucose–arginine ratios of 1:9 and 1:15 mostly produced particles smaller than 10 nm in all replicates (Figure 3B). To match common biological size limits, we used a 10 nm cut-off. Based on this, we chose the hydrothermal 1:9 formulation (GA-CDs 1:9 h) because its size distribution is well below 10 nm.
Atomic force microscopy (AFM) imaging of GA-CDs 1:9 h revealed the presence of quasi-spherical nanoparticles scattered across a flat substrate without forming a continuous film (Figure 3C). Height measures along two lines showed heights between 1 and 4 nm, with occasional particles as large as ~8–10 nm. This indicates a dot-like shape and a few small clusters, similar to those seen in supported samples. The sub-10 nm heights are consistent with the hydrodynamic measurements for the hydrothermal series.

3.3. Fluorescence of GA-CDs Infiltrated in Arabidopsis Leaves Reveals Epidermal Cell Contour

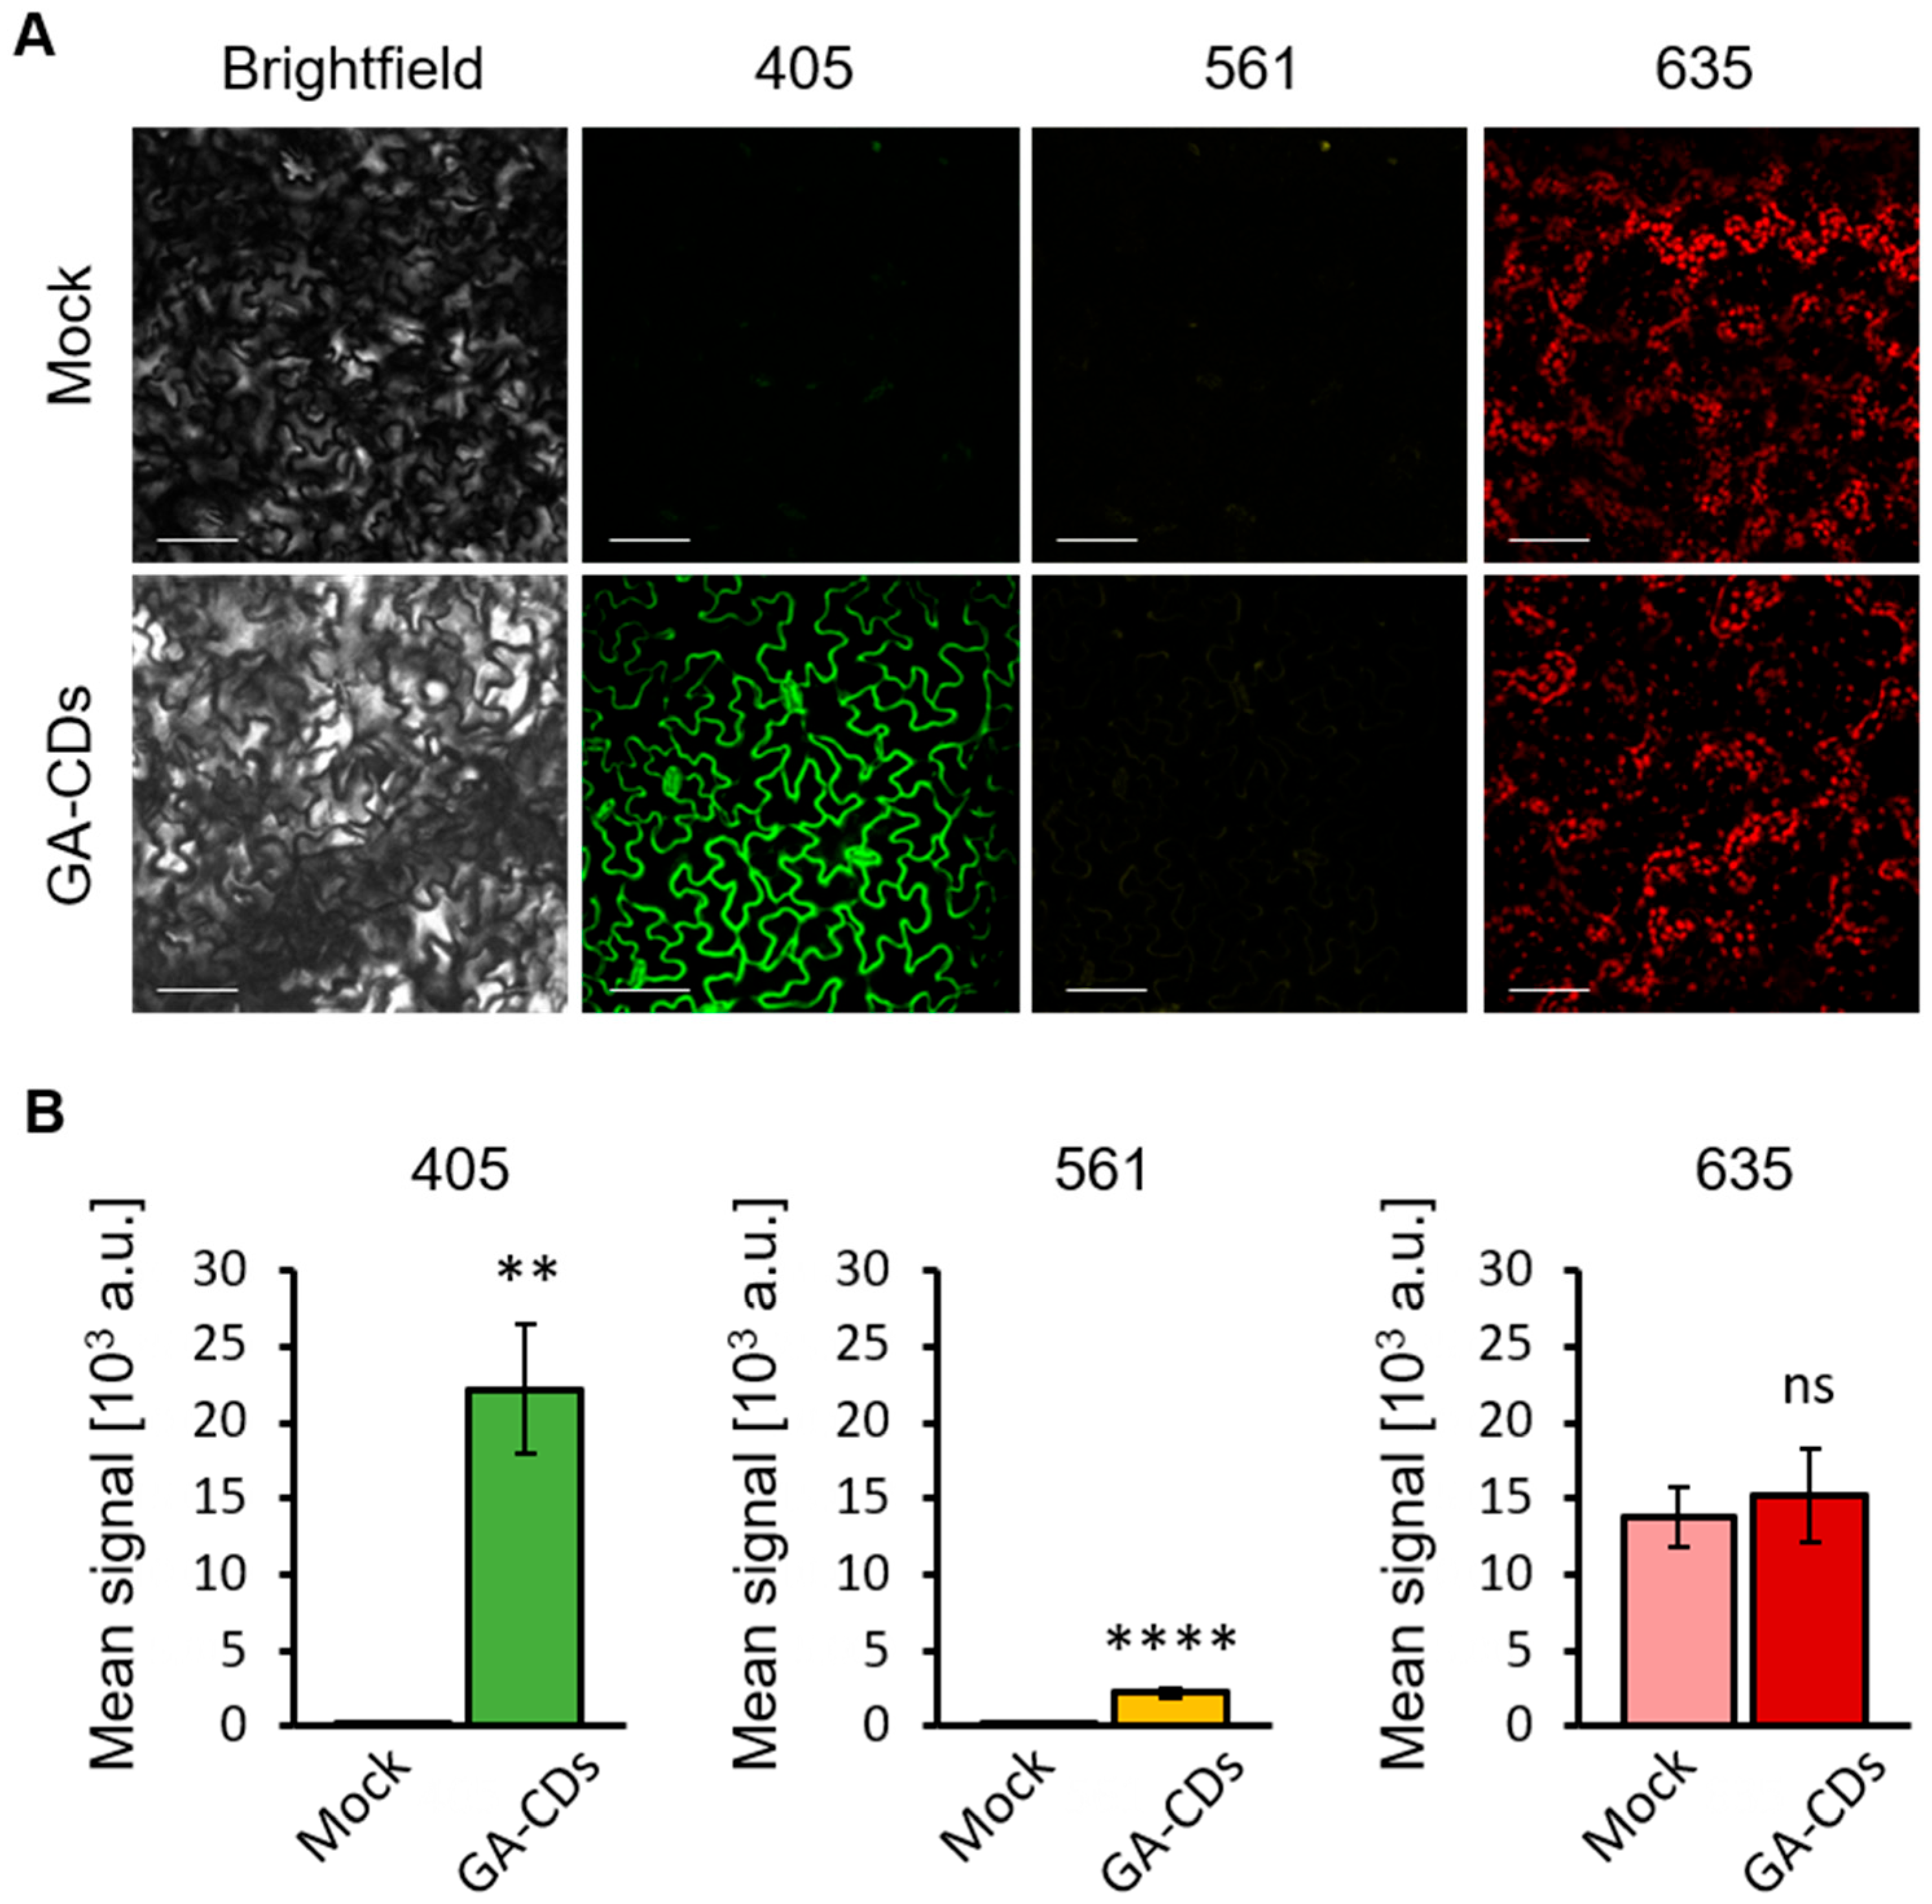
Arabidopsis thaliana leaves infiltrated with GA-CDs 1:9 h (0.5 mg mL−1) exhibited strong fluorescence associated with the CDs when observed under a 405 nm laser filter, while mock-treated leaves showed no signal (Figure 4). In addition, a visually subtle but significantly different (p < 0.0001) fluorescence emission was detected under a 561 nm laser filter (Figure 4B). Both emissions delineated the epidermal walls, suggesting a peripheral enrichment consistent with the apoplast or wall–plasma-membrane interface. No CD-associated fluorescence was detected under 635 nm excitation; the red channel only displayed chlorophyll autofluorescence (Figure 4A). The near-UV requirement detected in the tissues aligns with the fluorescence behavior shown in solution (Figure 2; max 385/475 nm; sharply reduced excitation efficiency beyond 440 nm), indicating that the core photophysics are largely unchanged in the tissue environment.

3.4. GA-CDs Treatments Show No Toxic or Stressful Effect on Plants, Insects, and Beneficial Soil Bacteria

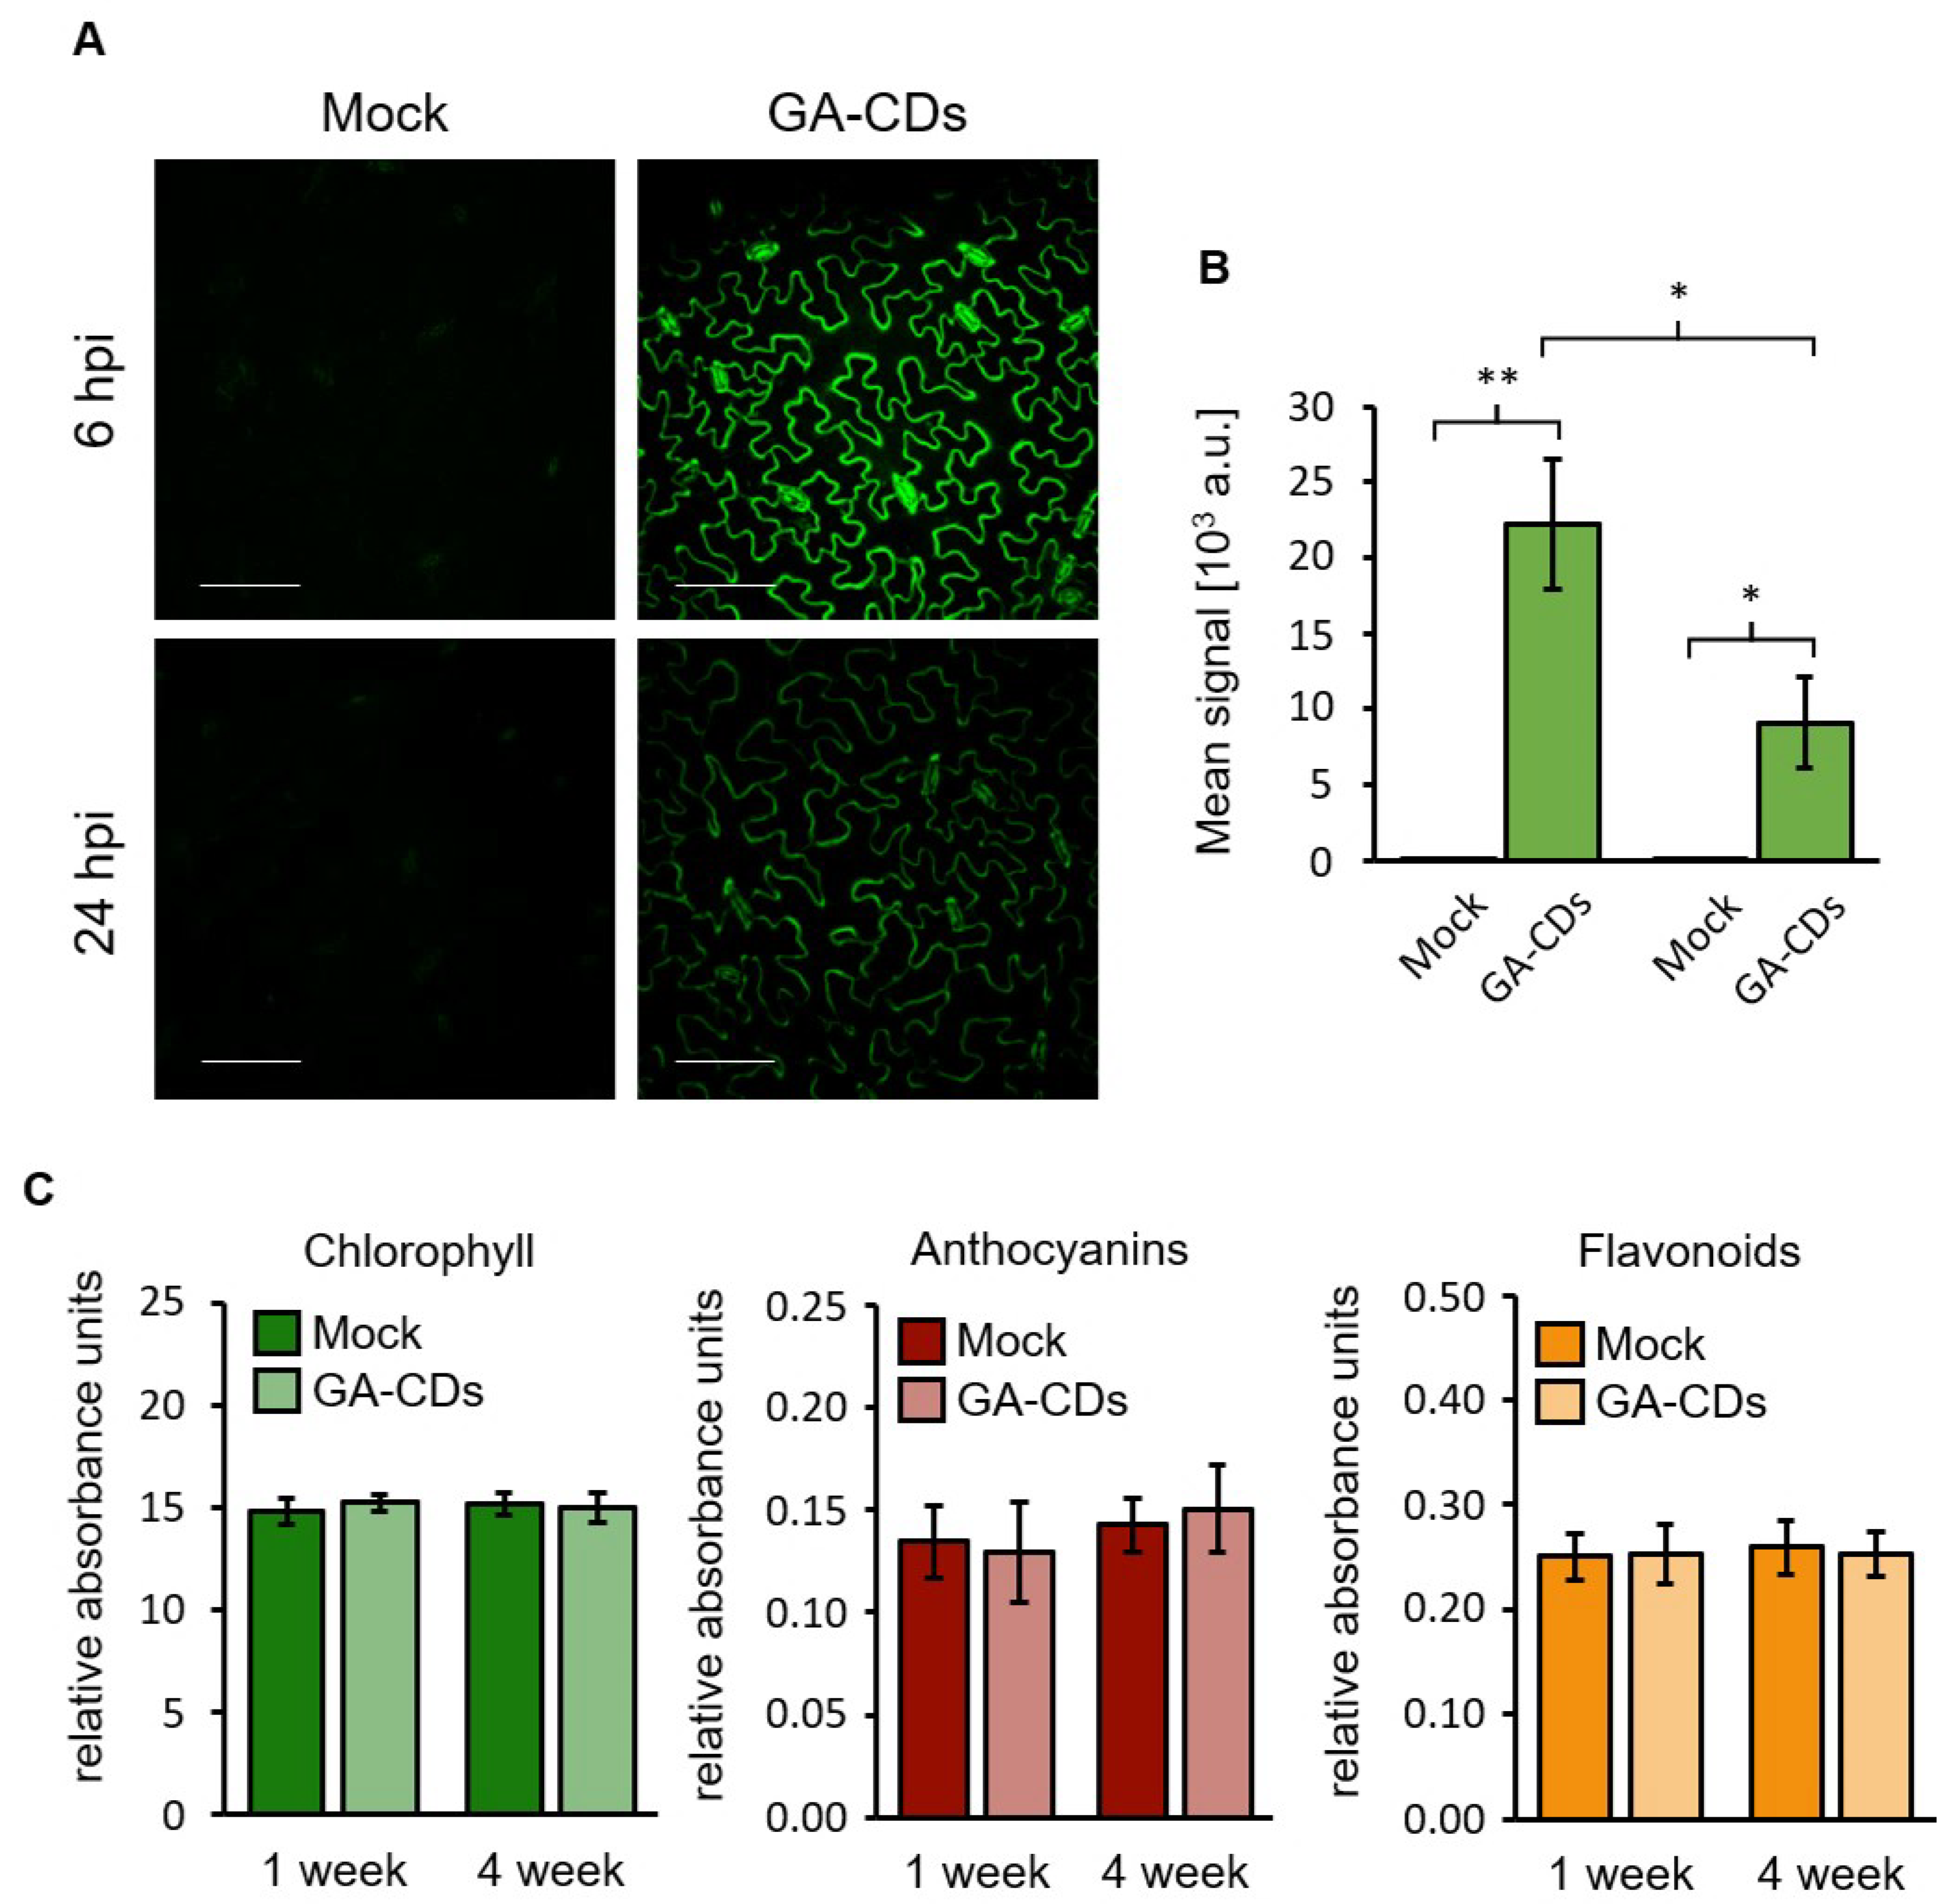
Arabidopsis plants infiltrated with GA-CDs (hydrothermal 1:9, 0.5 mg mL−1) show no evident morphological changes in cells delineated by the fluorescent CDs (Figure 5A). After 24 h treatment, the fluorescence signal of GA-CDs remains detectable under 405 nm excitation, revealing no evident symptoms of stress or morphological changes at early stages. In addition, Arabidopsis plants that were both infiltrated and sprayed every 7 days with GA-CDs (hydrothermal 1:9, 0.5 mg mL−1) for 4 weeks showed no difference in chlorophyll, anthocyanins, and flavonoid content compared to the control condition (Figure 5). Since these measured parameters are known indicators of plant stress, our results suggest that GA-CDs treatments do not induce any toxic or stressful effects on this model plant, even at concentrations 8 to 25 times higher than those used in previous studies (0.06–0.02 mg mL−1) [15,16,17].
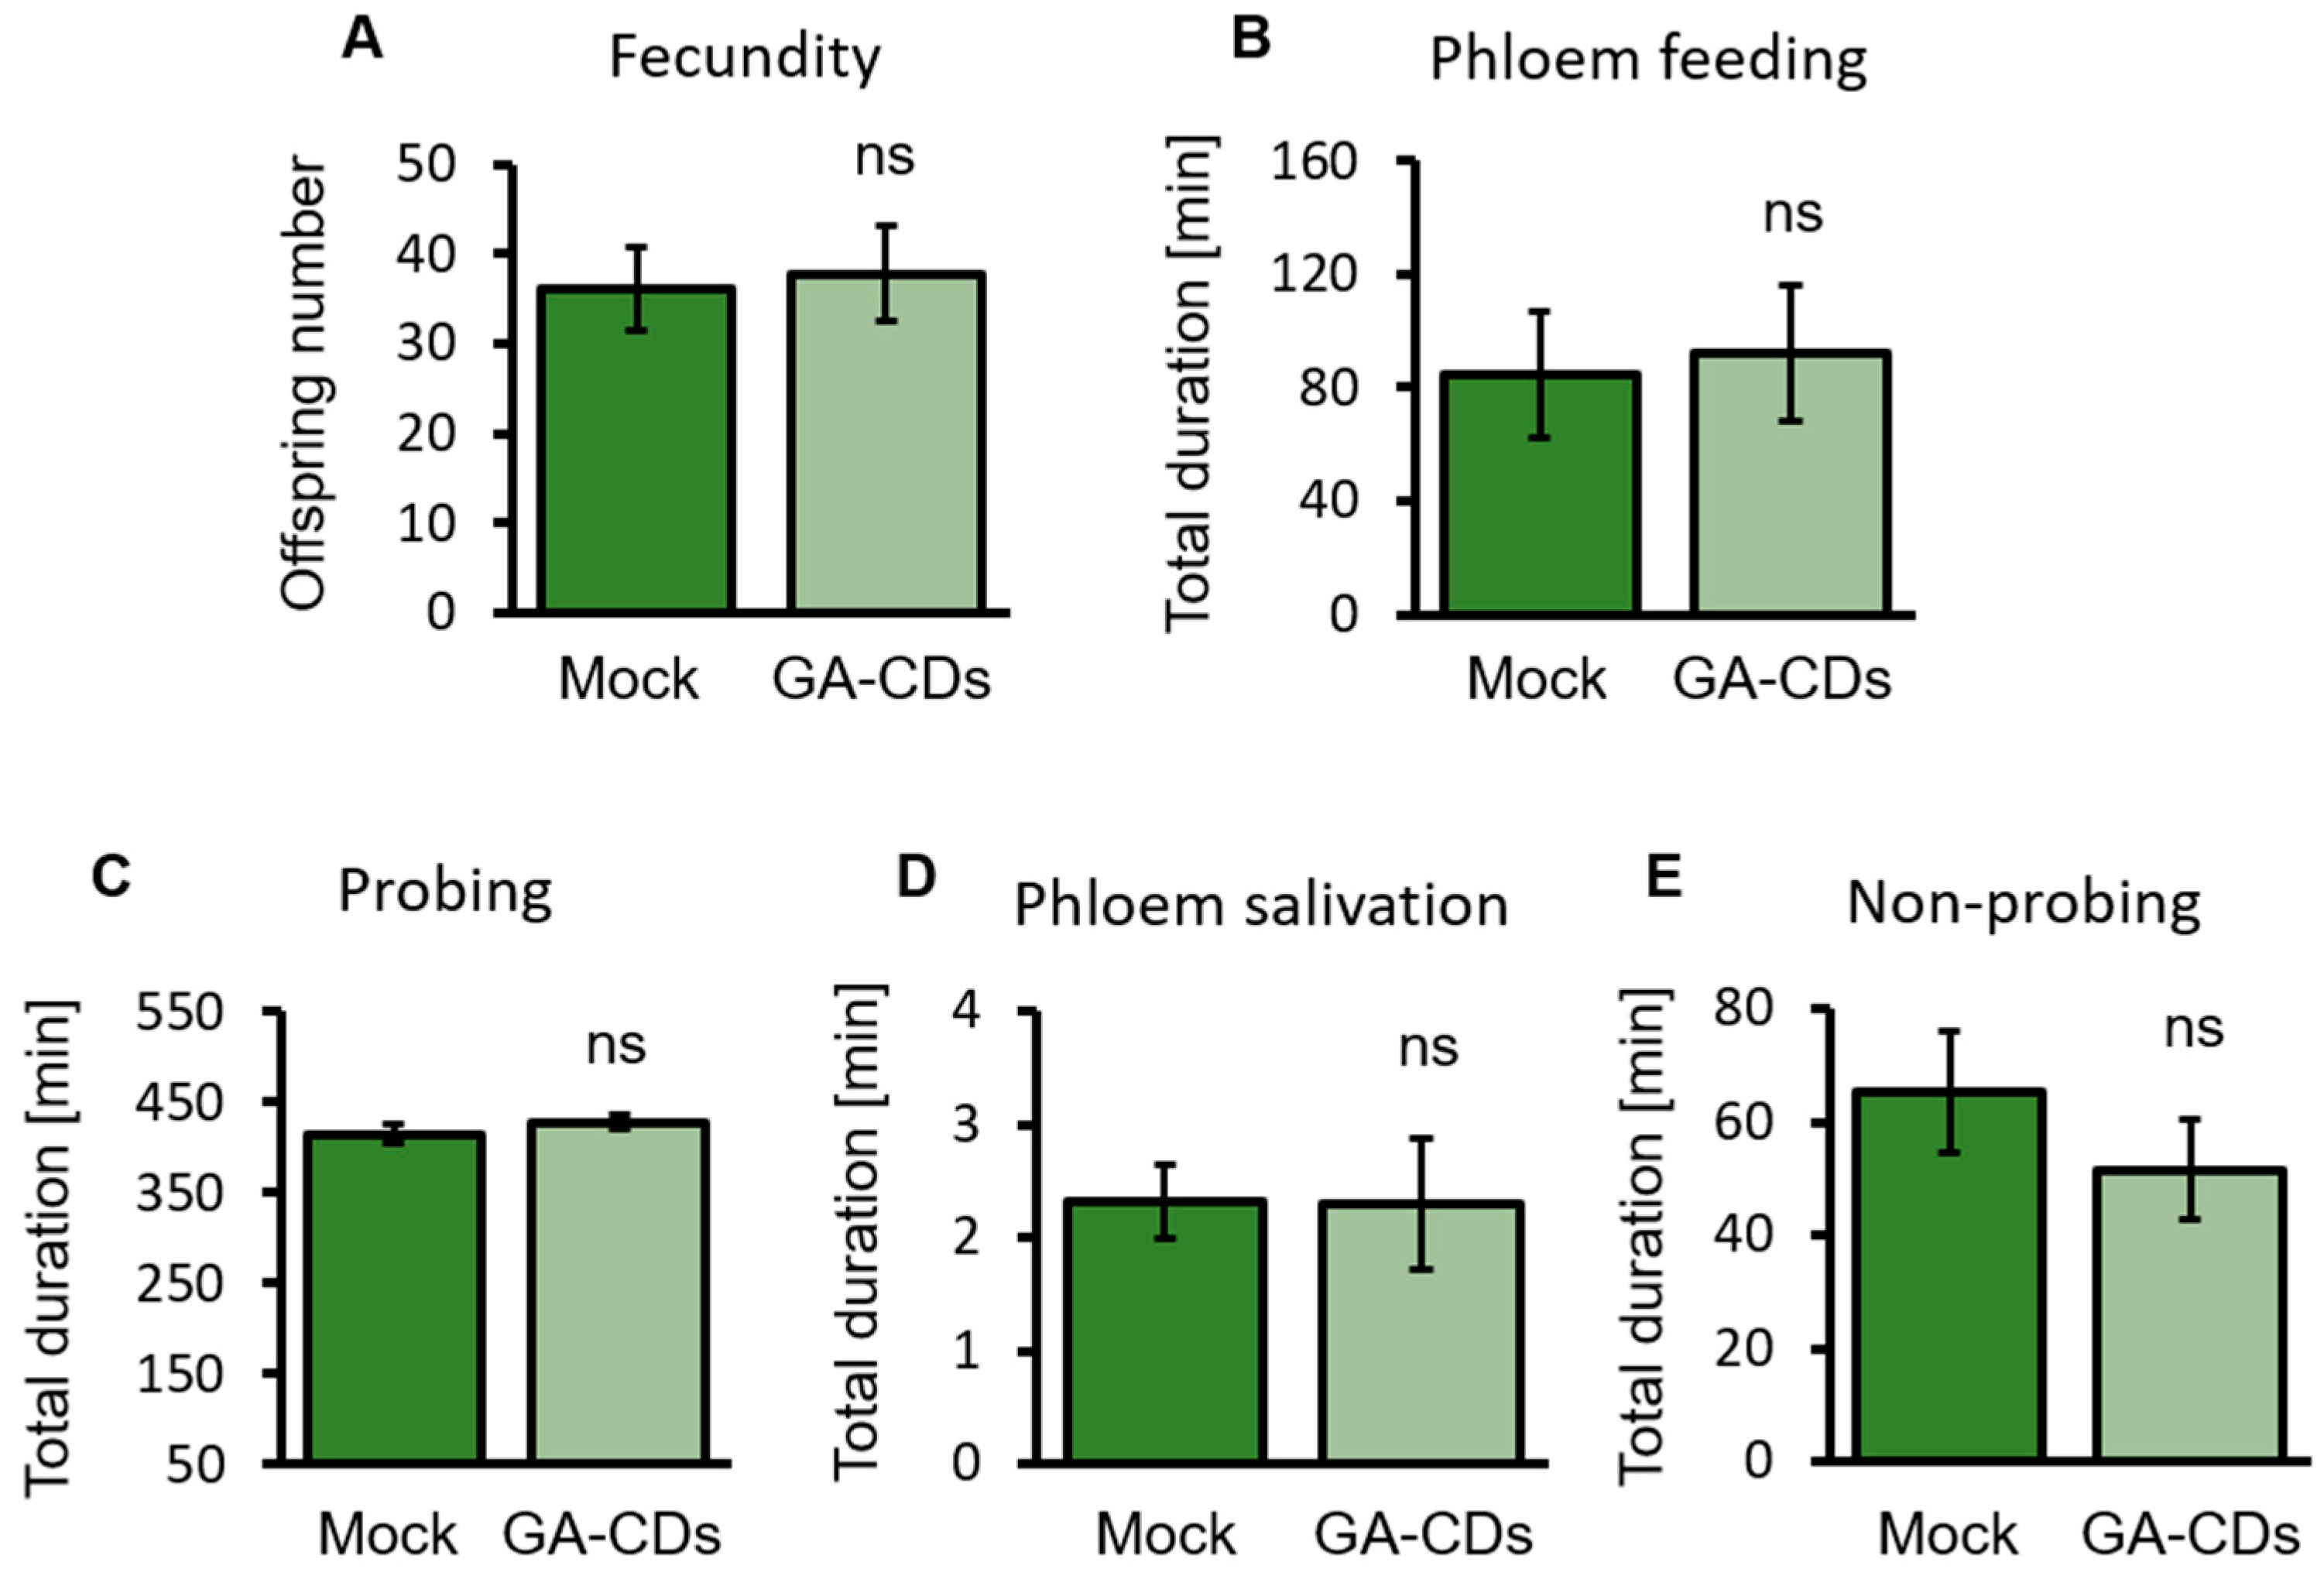
In our study on pest insect model, we confined Myzus persicae aphids and forced them to feed on Arabidopsis plants infiltrated with GA- CDs (hydrothermal 1:9, 0.5 mg mL−1). Figure 6A shows that the fecundity of aphids that fed on treated leaves did not differ in offspring number compared to the mock treatment. In addition, we observed no significant differences in the feeding behavior of aphids on plants infiltrated with GA-CDs compared to the control condition, since EPG parameters, including total duration of non-probing, total probing, phloem salivation, and phloem ingestion, showed no treatment effects (Figure 6B–E). These results suggest that exposure to GA-CDs, whether through ingestion or spray, does not induce toxic effects or alter aphid performance.
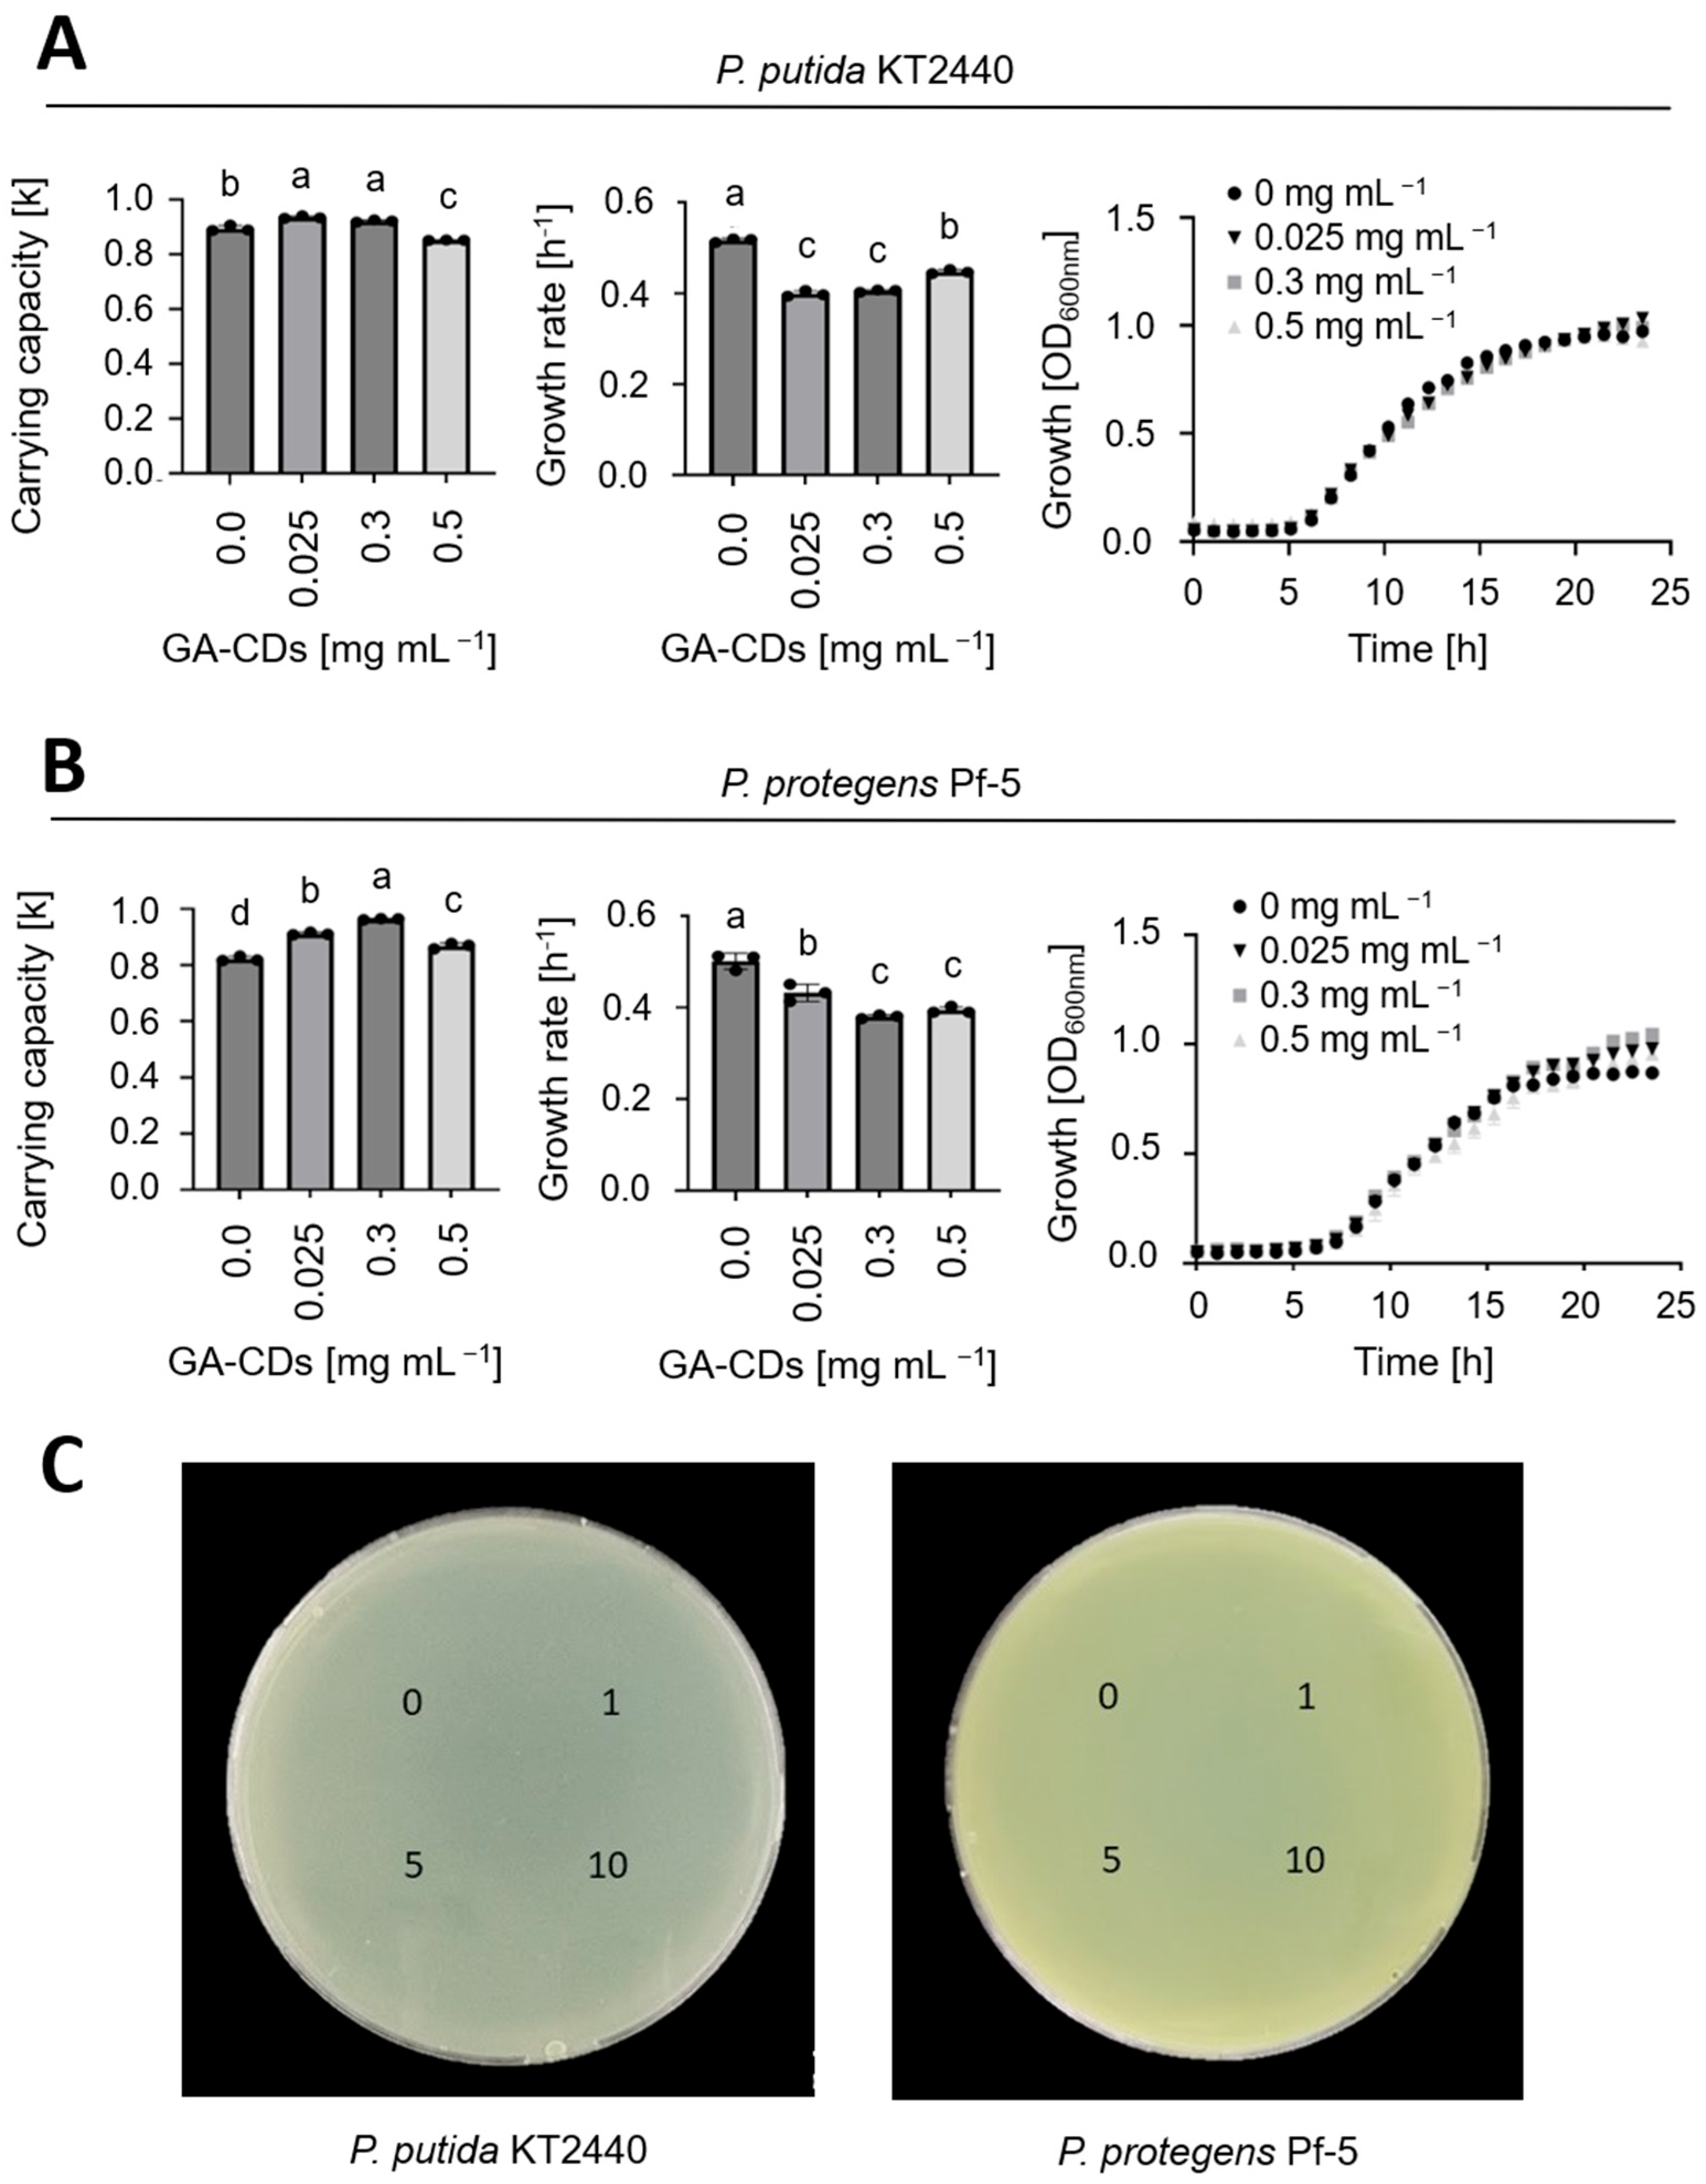
In the case of Plant Growth-Promoting Bacteria, GA-CDs 1:9 h showed no inhibitory effects on the growth of P. putida or P. protegens at any of the tested concentrations (Figure 7). Liquid culture kinetics (OD600) of both species assayed show no significant changes in lag and exponential phases for all concentrations assayed (Figure 7A,B). When evaluating growth parameters, there is a decrease in the specific growth rate but an increase in the carrying capacity of the medium in both bacteria (Figure 7A,B), suggesting that although there is an effect on the speed of growth, the number of bacteria at the end of the culture is higher than the control. Notably, for P. protegens, the stationary phase began earlier in the control condition compared to all concentrations of GA-CDs 1:9 used, suggesting modulation of the culture milieu by GA-CDs, for example, through extracellular electron-transfer facilitation or trace auxiliary nutrient inputs originating from their carbohydrate-amine composition (Figure 7B). Furthermore, plates containing bacterial lawn of both species showed no inhibition zones around 1–10 µL droplets of 0.5 mg mL−1 GA-CDs 1:9 (Figure 7C). Overall, the lack of inhibition zones on the plates and the nearly overlapping OD600 trajectories in liquid media indicate no evidence of growth suppression for either P. putida or P. protegens within the tested concentrations.

3.5. GA-CD Exposure Shows No Significant Cytotoxicity at Working Concentrations on Human Cells

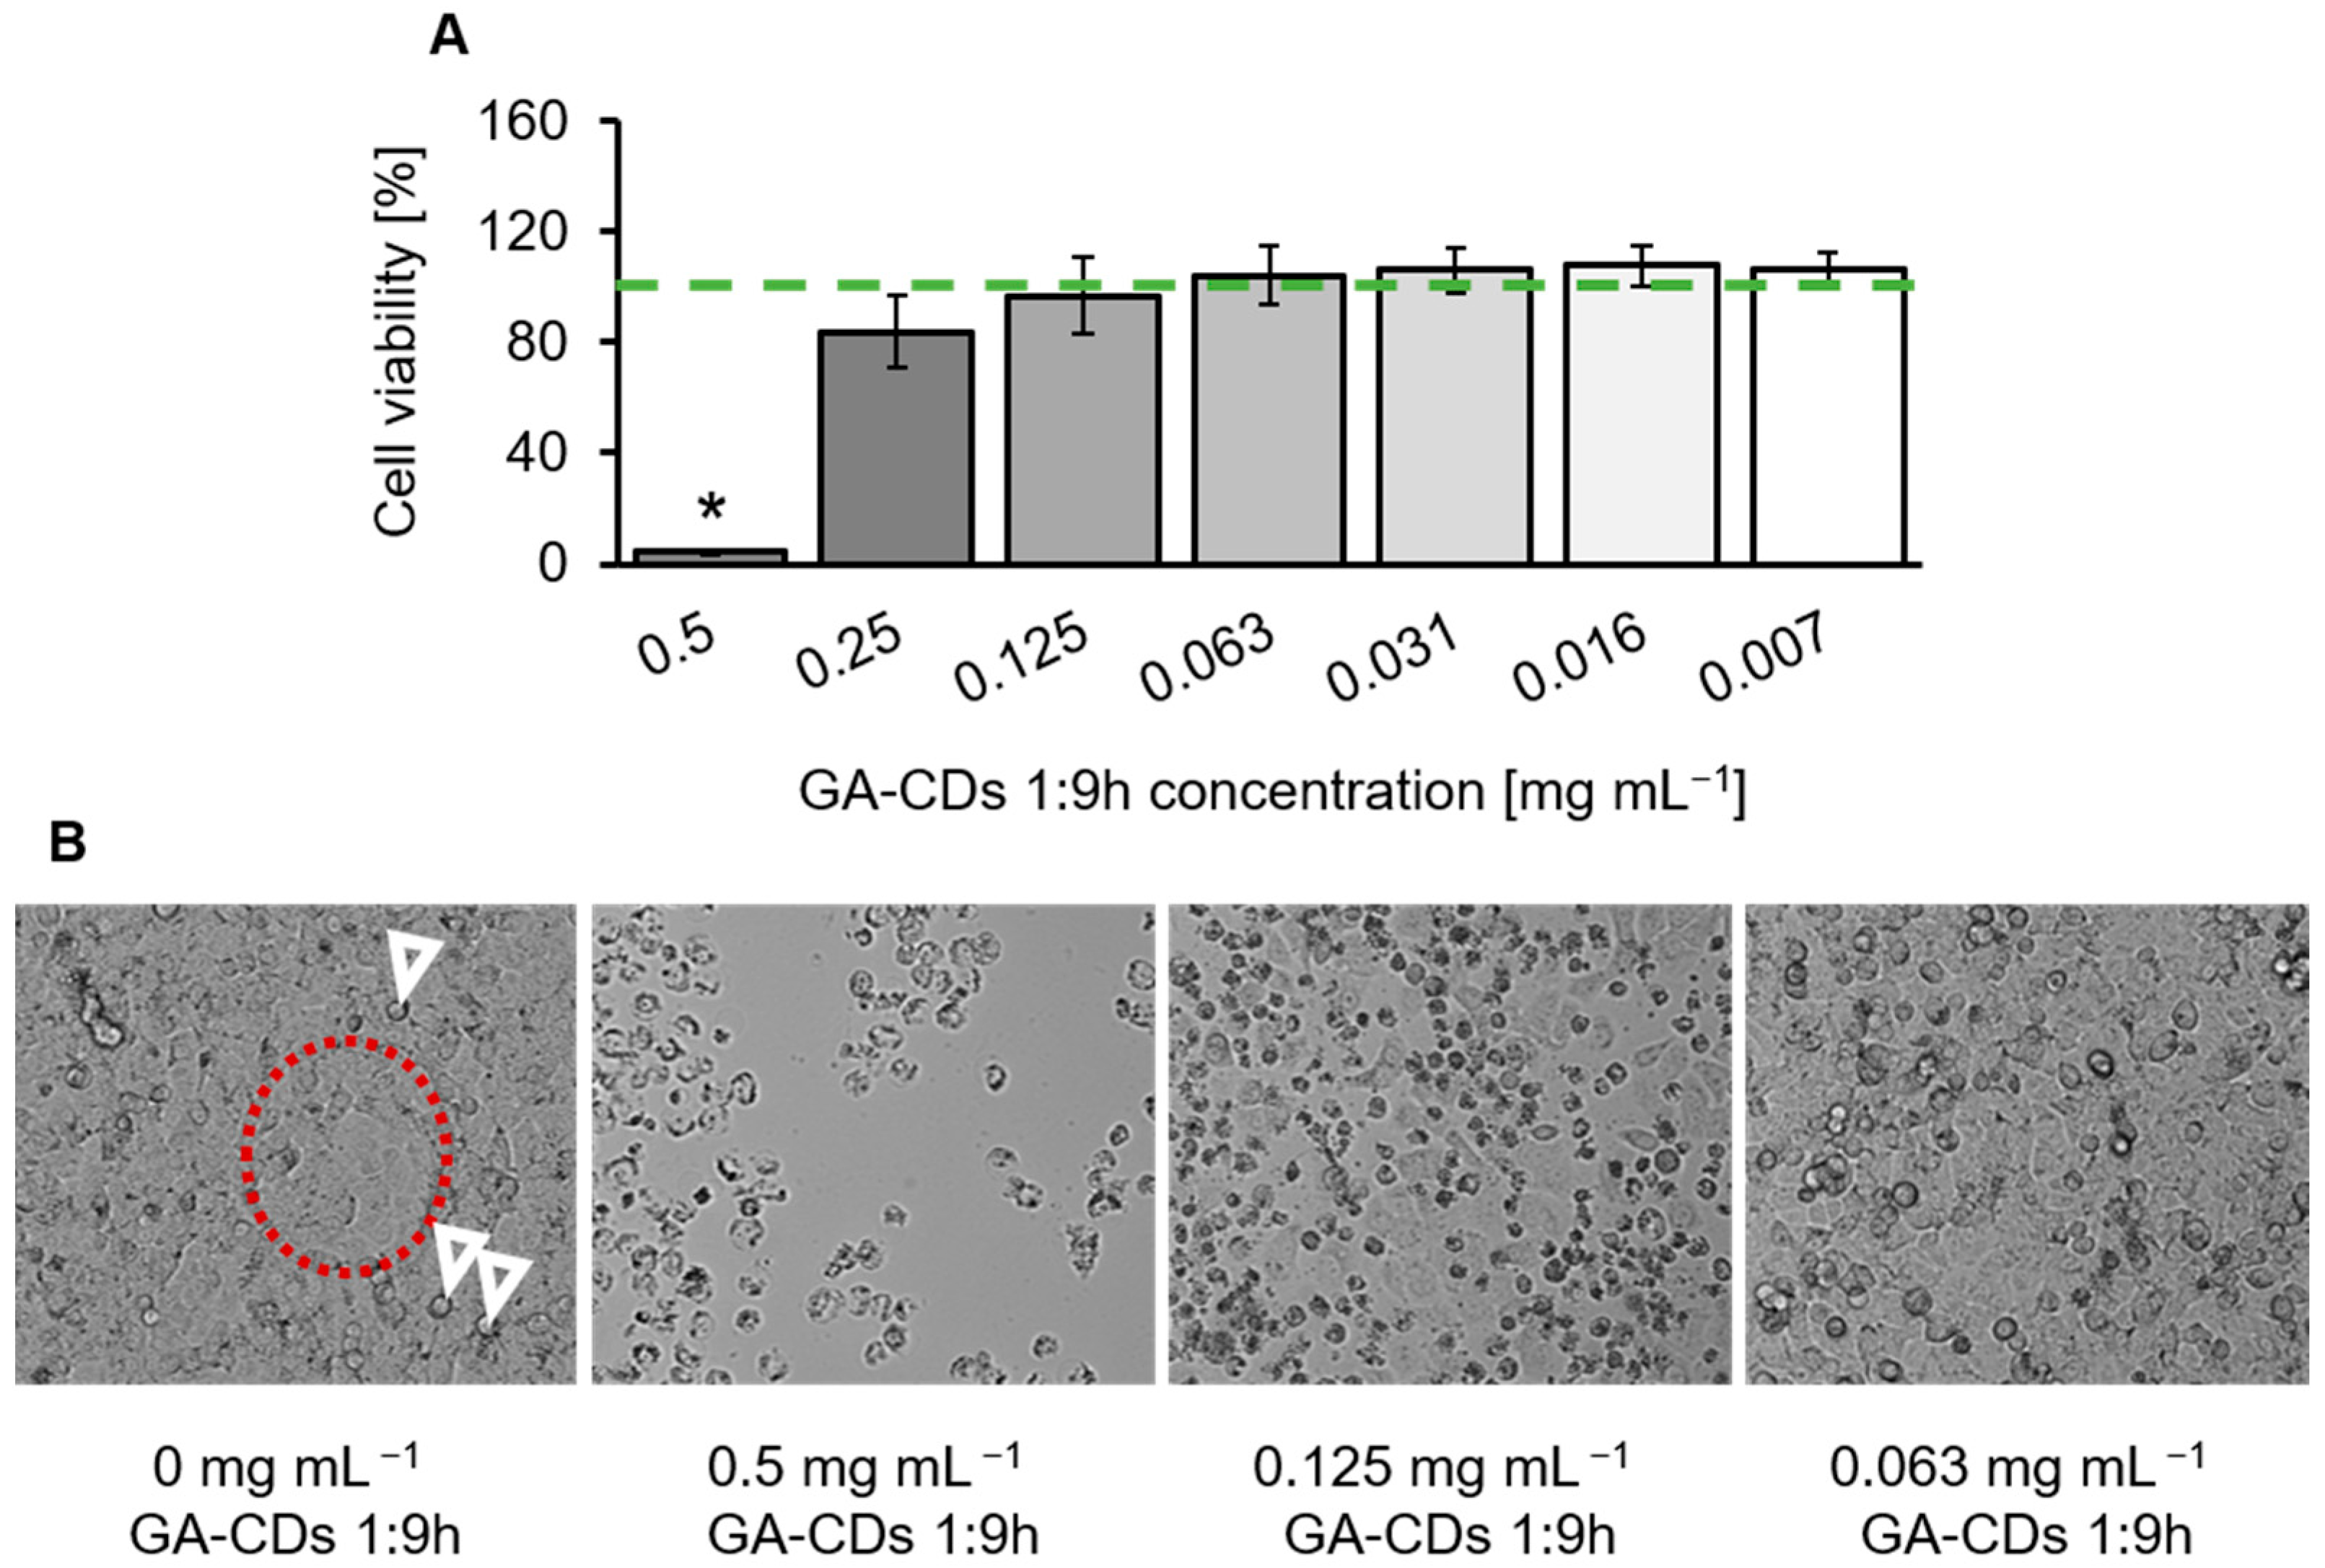
A549 WT cells, derived from a human lung adenocarcinoma, were used to assess GA-CDs 1:9 h cytotoxicity. Figure 8 shows that a concentration of 0.5 mg mL−1 was the most toxic, reducing cell viability to just 4% (Figure 8A). In contrast, cell viability increased significantly by 83% in those treated with a 0.25 mg mL−1 concentration of GA-CDs. Lower concentrations of GA-CDs 1:9 h, ranging from 0.125 to 0.007 mg mL−1, showed no signs of toxicity, with cell viability remaining between 97% and 106% compared to the control condition (Figure 8A). Images in Figure 8B depict the normal morphology of cultured cells in the control condition (0 mg mL−1 GA-CDs), displaying a predominantly homogeneous monolayer with only minor events of non-viable, round-shaped, detached cells. Conversely, the 0.5 mg mL−1 concentration induced severe cytotoxicity, characterized by widespread detachment of unviable cells and the absence of a continuous cell monolayer (Figure 8B). In contrast, concentrations of 0.125 mg mL−1 and lower showed a significant recovery in cell viability with a predominant monolayer of cells, and only a few detached cells were observed.

4. Discussion

4.1. A Practical Window for Customizing GA-CDs

We compared hydrothermal and microwave syntheses using glucose-to-arginine ratios of 1:3, 1:9, and 1:15, and found that these methods enable systematic control over optical properties and particle size. The UV–visible absorption and FTIR spectra changed with the synthesis method and precursor ratio, showing differences in conjugation and surface features (Figure 1). Excitation–emission maps revealed different fluorescence centers depending on the conditions and precursors, which matches the idea that emissive states depend on the synthesis route and stoichiometry (Figure 2). These results also allow us to suggest that CD emissive states are provided by surface passivation rather than a single chromophore present in the samples [15]. Thus, passivated CDs behave as label-free fluorescent reporters whose signal is not governed by dissolution products or photocatalytic reactions which, compared to inorganic nanomaterials, (e.g., Ag, CuO, ZnO, TiO2) where material bioactivity acts through ion release or photocatalytic pathways demanding tighter dose and context control [16,17]. In agricultural settings, that distinction matters since reactive platforms that can be powerful for disease suppression and stress priming could also pose risks to non-target organisms if they are not properly managed [16,17]. In contrast, our passivated GA-CDs emphasize traceability and transport with low perturbation. Their intrinsic fluorescence allows for monitoring deposition and redistribution, while size and interfacial properties ease movement through plant tissues without using redox or catalytic mechanisms [15,18].

4.2. The Intrinsic Fluorescence of Carbon Dots Allows for Traceability Within Living Plant Tissues

When infiltrated Arabidopsis leaves are excited with a 405 nm light source, they display distinct fluorescence associated with GA-CDs, which outlines the boundaries of epidermal cells. In contrast, mock leaves show no fluorescence (Figure 3). The fluorescence observed in living tissue is consistent with the values of GA-CDs 1:9 h fluorescence in solution (Figure 2), as 3D maps indicate a maximum intensity of fluorescence at Ex385/Em475 nm, which sharply decreases beyond Ex450 nm. This suggests that the core photophysics of GA-CDs 1:9 h does not change within the microenvironment of inner plant tissues.
In addition, the blue–green emission of GA-CDs under 405 nm excitation enables in situ verification of spray deposition. This remarkable characteristic of carbon dots allows for the rapid monitoring of field applications using only UV lamps. The high photostability of these CDs (Figure 4 and Figure 5) supports time-lapse tracking of their persistence and redistribution in application zones. At the molecular level, it can be advantageous to confirm whether dsRNA has been successfully delivered into the cells of treated plants

4.3. GA-CDs Exhibit a Consistent Biocompatibility Profile Across Organisms Tested

Across the biological systems assayed, GA-CDs were well tolerated at the concentrations evaluated. In Arabidopsis, weekly foliar applications did not alter the levels of chlorophyll, anthocyanin, or flavonoids (Figure 5C). Confocal images of infiltrated leaves showed intact cell contours without morphological disruption relative to the controls (Figure 5A). These observations indicate low phytotoxicity and align with reports describing neutral or occasionally beneficial plant responses to carbon dots at comparable or lower doses [19,20,21].
In aphids, feeding on GA-CD–treated leaves showed no changes in probing or phloem ingestion activities and no effects on fecundity (Figure 6). Given that aphid stylets penetrate through cell walls, intercellular spaces, and intramural pathways [22,23], the same tissue allocations where GA-CDs were visualized in Arabidopsis (Figure 4 and Figure 5), we considered the potential for interference with feeding. However, none of the EPG parameters differed from those of the controls (Figure 6). The finding indicates a non-significant impact on this insect model. This is consistent with the literature, which shows that the antimicrobial or insecticidal effects of carbon dots often require specific surface chemistries and photoactivation regimes. Without photoactivation, many carbon dot formulations are non-toxic [24,25].
In the case of PGPBs, neither agar-drop nor liquid cultures showed growth inhibition in P. putida or P. protegens. Notably, P. protegens exhibited a transient growth increase between 20 and 25 h when exposed to GA-CD 1:9 h (Figure 7). Carbon dots could be altering the microbial milieu in different ways that help explain this earlier onset of the stationary phase and increased carrying capacity observed in P. protegens with GA-CDs 1:9 h (Figure 7B). In addition to facilitating extracellular electron transfer that alters pericellular redox balances [26], carbohydrate- and amine-derived CDs may retain or generate organic traces that function as auxiliary nutrient inputs [15,17]. In parallel, CDs could be interfering with quorum sensing (QS) and biofilm regulation by adsorbing or quenching autoinducers, perturbing redox-linked signaling, or otherwise shifting QS thresholds, thereby changing colony behavior without directly accelerating growth rates [27,28]. This phenomenon should be deeper studied, since from an agroecological perspective, transient stimulation of a beneficial Pseudomonas species may be advantageous for nutrient cycling and biocontrol; however, it could also shift the microbiome balance, favoring plant-pathogenic species.
Although several studies have demonstrated the antimicrobial capacity of CDs, this trait is formulation-dependent. Cationic or otherwise interactive surfaces frequently disrupt membranes and promote ROS generation, producing strong bactericidal effects. Conversely, uncharged glucose-type CDs often display minimal killing under comparable conditions [29]. Biomass-derived CDs can also act via enzyme-level targets (e.g., LPXC inhibition in Gram-negatives), but such selectivity is tied to specific surface chemistries and doses [30]. In our study, GA-CDs were synthesized and used as passivated, label-free fluorescent reporters under non-photoactivated conditions and at exposures selected for biosafety; the absence of growth inhibition in Pseudomonas is therefore consistent with CDs positioned toward traceability with low perturbation, rather than antimicrobial or photodynamic action [15,17,18,29,30].
In A549 cells, viability remained stable (97–106%) up to 0.125 mg mL−1, while exposure to 0.5 mg mL−1 reduced viability to 4%, establishing a practical operating range below 0.25 mg mL−1 (Figure 8A). This range matches the concentrations used in previous studies that report biocompatibility in plants, usually below 0.1 mg mL−1 [19,20,21]. Other studies have also found that carbon dots from different sources and synthesis methods are non-toxic to human and animal cells at concentrations below 0.5 mg mL−1 [31,32]. However, it is important for future studies to consider the emerging evidence showing that prolonged or high-energy illumination can photodegrade certain CDs into low-molecular-weight species that are cytotoxic, highlighting the importance of controlling light exposure during cell assays and of reporting illumination regimes alongside dose [33]. Although our assays were conducted under non-photoactivated conditions, the photodegradation phenomenon will be considered and studied to ensure the safety of future in vitro protocols and any other application that involves intense irradiation, such as greenhouses and fields [33].

5. Conclusions

The present data allow us to suggest that the combination of tunable properties, optical traceability, and multi-taxa tolerance could make GA-CDs adaptable tools for agricultural biotechnology. Their sub-10 nm scale is consistent with passage through plant cell-wall porosity and selected insect cuticular features, which may facilitate foliar penetration and interaction with target tissues. In addition, intrinsic fluorescence offers a practical readout to monitor distribution during foliar sprays, infiltrations, or seed coatings, potentially enabling estimates of retention, wash-off, and bioaccumulation using the same particles applied in situ. These attributes could be useful for staged development of nano-enabled inputs (including nucleic-acid delivery), where traceability and size control are relevant prior to formal efficacy claims.
Building on the present link between synthesis conditions, accessible particle features, and biocompatibility in model systems, the next steps will involve deeper physicochemical characterization to strengthen broader applicability. Transmission electron microscopy (TEM) will be incorporated to assess morphology and size distribution, alongside elemental analysis, purity profiling, and quantum yield (QY) determinations under defined conditions. These measurements are expected to clarify in-sample particle distribution, composition, and optical performance, enabling a tighter connection between synthesis routes, environmental interactions, and biological outcomes. In parallel, the nanoparticle repertoire will be expanded (alternative cores and surface chemistries) and the panel of model organisms will be broadened (including pollinators, and representative plant pathogens and beneficial microbes), with standardized dose–response and light-regime controls. Collectively, this broader, staged screening framework is intended to increase the likelihood of identifying biocompatible yet functional nanomaterials and to delineate the conditions under which GA-CDs remain neutral versus exert selective effects within complex agro-ecosystems

Author Contributions

Conceptualization, C.S.-S., P.I. and L.M.; methodology, C.S.-S., P.I., L.M. and F.F.; formal analysis, O.D., C.S.-S., F.F., M.V.G., J.H.; investigation, C.S.-S., F.F.; resources, C.S.-S., F.B.-H., O.D., I.B.; writing—original draft preparation, C.S.-S.; writing—review and editing, O.D., C.S.-S., P.I., M.V.G., F.B.-H., I.B.; supervision, L.M., F.B.-H., I.B.; project administration, C.S.-S.; funding acquisition, C.S.-S., FBH, I.B. and O.D. All authors have read and agreed to the published version of the manuscript.

Funding

This research was funded by Agencia Nacional de Investigación y Desarrollo (ANID, postdoctorado 3200902 and doctorado nacional 2021/21211568), PIA/BASAL AFB240003, and Programa Iniciativa Científica Milenio—(IBio) ICN17_022 to F.B.-H.

Institutional Review Board Statement

Not applicable.

Informed Consent Statement

Not applicable.

Data Availability Statement

The original contributions presented in the study are included in the article, further inquiries can be directed to the corresponding author.

Conflicts of Interest

The authors declare no conflicts of interest. The funders had no role in the design of the study; in the collection, analyses, or interpretation of data; in the writing of the manuscript or in the decision to publish the results.

Abbreviations

CDsCarbon Dots
GA-CDs Glucose-Arginine Carbon Dots
DLSDynamic Light Scattering
AFMAtomic Force Microscopy
FTIRFourier Transform Infrared

References

  1. Liu, J.; Li, R.; Yang, B. Carbon Dots: A New Type of Carbon-Based Nanomaterial with Wide Applications. ACS Cent. Sci. 2020, 6, 2179–2195. [Google Scholar] [CrossRef] [PubMed]
  2. Reckmeier, C.J.; Schneider, J.; Xiong, Y.; Häusler, J.; Kasák, P.; Rogach, A.L. Origin of Excitation-Dependent Fluorescence in Carbon Nanodots. J. Phys. Chem. Lett. 2016, 7, 476–480. [Google Scholar]
  3. García-Millán, T.; Swift, T.A.; Morgan, D.J.; Harniman, R.L.; Masheder, B.; Hughes, S.; Davis, S.A.; Oliver, T.A.A.; Galan, M.C. Small Variations in Reaction Conditions Tune Carbon Dot Fluorescence. Nanoscale Adv. 2022, 4, 2329–2338. [Google Scholar]
  4. Lim, S.Y.; Shen, W.; Gao, Z. Carbon Quantum Dots and Their Applications. Chem. Soc. Rev. 2015, 44, 362–381. [Google Scholar] [CrossRef] [PubMed]
  5. Hola, K.; Zhang, Y.; Wang, Y.; Giannelis, E.P.; Zboril, R.; Rogach, A.L. Carbon Dots—Emerging Light Emitters for Bioimaging, Cancer Therapy and Optoelectronics. Nano Today 2014, 9, 590–603. [Google Scholar] [CrossRef]
  6. Stetefeld, J.; McKenna, S.A.; Patel, T.R. Dynamic Light Scattering: A Practical Guide and Applications in Biomedical Sciences. Biophys. Rev. 2016, 8, 409–427. [Google Scholar] [CrossRef]
  7. Barman, M.K.; Patra, A. Current Status and Prospects on Chemical Structure Driven Photoluminescence of Carbon Dots. Chem. Phys. Lett. 2018, 692, 210–223. [Google Scholar] [CrossRef]
  8. Cagliari, D.; Dias, N.P.; Galdeano, D.M.; Dos Santos, E.Á.; Smagghe, G.; Zotti, M.J. Management of Pest Insects and Plant Diseases by Non-Transformative RNAi. Front. Plant Sci. 2019, 10, 1319. [Google Scholar] [CrossRef]
  9. Qiao, L.; Lan, C.; Capriotti, L.; Ah-Fong, A.; Sanchez, J.N.; Hamby, R.; Heller, J.; Zhao, H.; Glass, N.L.; Judelson, H.S.; et al. Spray-Induced Gene Silencing for Disease Control Is Efficient and Environmentally Friendly. Plant Biotechnol. J. 2021, 19, 1495–1497. [Google Scholar] [CrossRef]
  10. Mitter, N.; Worrall, E.A.; Robinson, K.E.; Li, P.; Jain, R.G.; Taochy, C.; Fletcher, S.J.; Carroll, B.J.; Lu, G.Q.; Xu, Z.P. Clay Nanosheets for Topical Delivery of RNAi for Sustained Protection against Plant Viruses. Nat. Plants 2017, 3, 16207. [Google Scholar] [CrossRef]
  11. Yong, J.; Wu, M.; Zhang, R.; Bi, S.; Mann, C.W.G.; Mitter, N.; Carroll, B.J.; Xu, Z.P. Clay Nanoparticles Efficiently Deliver Small Interfering RNA to Intact Plant Leaf Cells. Plant Physiol. 2022, 190, 2187–2202. [Google Scholar] [CrossRef]
  12. Chen, C.; Imran, M.; Feng, X.; Shen, X.; Sun, Z. Spray-Induced Gene Silencing for Crop Protection. Trends Plant Sci. 2025, 16, 1527944. [Google Scholar]
  13. Frontiers Research Topic: RNAi-Based Pesticides (OECD 2019). Frontiers in Plant Science. Available online: https://www.frontiersin.org/research-topics/11066/rnai-based-pesticides (accessed on 25 September 2025).
  14. Fois, L.; Stagi, L.; Carboni, D.; Alboushi, M.; Khaleel, A.; Anedda, R.; Innocenzi, P. The Formation of Carbon Dots from D-Glucose Studied by Infrared Spectroscopy. Chem.–Eur. J. 2024, 30, e202400158. [Google Scholar] [CrossRef] [PubMed]
  15. Chaudhary, M.; Singh, P.; Singh, G.P.; Rathi, B. Structural Features of Carbon Dots and Their Agricultural Potential. ACS Omega 2024, 9, 4166–4185. [Google Scholar] [CrossRef] [PubMed]
  16. Li, G.; Xu, J.; Xu, K. Physiological Functions of Carbon Dots and Their Applications in Agriculture: A Review. Nanomaterials 2023, 13, 2684. [Google Scholar] [CrossRef]
  17. Bouhadi, M.; Javed, Q.; Jakubus, M.; Elkouali, M.H.; Fougrach, H.; Ansar, A.; Ban, S.G.; Ban, D.; Heath, D.; Černe, M. Nanoparticles for Sustainable Agriculture: Assessment of Benefits and Risks. Agronomy 2025, 15, 1131. [Google Scholar] [CrossRef]
  18. Wahyudi, S.; Bahtiar, A.; Panatarani, C.; Risdiana, A. Recent Advanced Carbon Dots Derived from Natural Products and Aptasensor-Based Carbon Dots for Pesticide Detection. Sens. Bio-Sens. Res. 2023, 41, 100576. [Google Scholar]
  19. Wang, H.; Zhang, M.; Song, Y.; Li, H.; Huang, H.; Shao, M.; Liu, Y.; Kang, Z. Carbon Dots Promote the Growth and Photosynthesis of Mung Bean Sprouts. Carbon 2018, 136, 94–102. [Google Scholar] [CrossRef]
  20. Kou, E.; Yao, Y.; Yang, X.; Song, S.; Li, W.; Kang, Y.; Qu, S.; Dong, R.; Pan, X.; Li, D.; et al. Regulation Mechanisms of Carbon Dots in the Development of Lettuce and Tomato. ACS Sustain. Chem. Eng. 2021, 9, 944–953. [Google Scholar] [CrossRef]
  21. Hu, J.; Jia, W.; Wu, X.; Zhang, H.; Wang, Y.; Liu, H.; Li, X.; Wang, S.; Sun, S. Carbon Dots Can Strongly Promote the Photosynthesis in Lettuce (Lactuca sativa L.). Environ. Sci. Nano 2022, 9, 1600–1613. [Google Scholar] [CrossRef]
  22. Tjallingii, W.F.; Esch, T.H. Fine structure of aphid stylet routes in plant tissues in correlation with EPG signals. Physiol. Entomol. 1993, 18, 317–328. [Google Scholar] [CrossRef]
  23. Silva-Sanzana, C.; Estevez, J.M.; Blanco-Herrera, F. Influence of cell wall polymers and their modifying enzymes during plant–aphid interactions. J. Exp. Bot. 2020, 71, 3854–3864. [Google Scholar] [CrossRef] [PubMed]
  24. Dong, X.; Liang, W.; Meziani, M.J.; Sun, Y.-P.; Yang, L. Carbon dots as potent antimicrobial agents. Theranostics 2020, 10, 671. [Google Scholar] [CrossRef]
  25. Wu, X.; Xu, M.; Wang, S.; Abbas, K.; Huang, X.; Zhang, R.; Bi, H. F,N-doped carbon dots as efficient Type I photosensitizers for photodynamic therapy. Dalton Trans. 2022, 51, 2296–2303. [Google Scholar] [CrossRef]
  26. Vishwanathan, A.S.; Joseph, K.; Pugazhendi, A.; Valappil, S.K.; Kandasamy, S.; Iyer, S.; Sridhar, S. Carbon Quantum Dots Shuttle Electrons to the Anode of a Microbial Fuel Cell. Sci. Rep. 2016, 6, 26720. [Google Scholar] [CrossRef]
  27. Dong, X.; Wang, P.; Rodriguez, C.E.; Tang, Y.; Kathariou, S.; Sun, Y.P.; Yang, L. Photoactivated carbon dots inducing bacterial functional and molecular alterations. Mater. Adv. 2022, 3, 6253–6261. [Google Scholar] [CrossRef]
  28. Priyadarshini, E.; Raghunath, S.; Mallick, S.; Basu, S. Biofilm Inhibition on Medical Devices and Implants Using Carbon Dots: Recent Advances and Future Prospects. Biomedicines 2024, 12, 1051. [Google Scholar]
  29. Bing, W.; Sun, H.; Yan, Z.; Ren, J.; Qu, X. Programmed Bacteria Death Induced by Carbon Dots. Small 2016, 12, 4713–4722. [Google Scholar] [CrossRef]
  30. Wang, H.; Zhang, M.; Ma, Y.; Wang, B.; Shao, M.; Huang, H.; Liu, Y.; Kang, Z. Selective Inactivation of Gram-Negative Bacteria by Carbon Dots Derived from Artemisia argyi. J. Mater. Chem. B 2020, 8, 2503–2510. [Google Scholar]
  31. Nocito, G.; Calabrese, G.; Forte, S.; Petralia, S.; Puglisi, C.; Campolo, M.; Esposito, E.; Conoci, S. Carbon Dots as Promising Tools for Cancer Diagnosis and Therapy. Cancers 2021, 13, 1991. [Google Scholar] [CrossRef] [PubMed]
  32. Lin, F.; Jia, C.; Wu, F.-G. Carbon Dots for Intracellular Sensing. Small Struct. 2022, 3, 2200033. [Google Scholar] [CrossRef]
  33. Liu, Y.Y.; Yu, N.Y.; Fang, W.D.; Tan, Q.G.; Ji, R.; Yang, L.Y.; Wei, S.; Zhang, X.W.; Miao, A.J. Photodegradation of carbon dots causes cytotoxicity. Nat. Commun. 2021, 12, 812. [Google Scholar] [CrossRef] [PubMed]
Figure 1. UV–Visible and FTIR characterization of GA-CDs. (A,B) Normalized UV–Visible spectra of microwave and hydrothermal synthesis routes, respectively, at glucose–arginine ratios of 1:3 (blue), 1:9 (green), and 1:15 (magenta); glucose (black) and arginine (red) are shown as references. (C,D) FTIR absorption spectra for GA-CDs prepared by microwave and hydrothermal synthesis, respectively, at glucose–arginine ratios of 1:3 (blue), 1:9 (green), and 1:15 (magenta); glucose (black) and arginine (red) are shown as references.
Agrochemicals 04 00020 g001
Figure 2. Three-dimensional excitation–emission–intensity (Ex–Em–I) fluorescence maps of GA-CDs and precursors. (A) Molecular precursors (arginine and glucose). (B) GA-CDs obtained through microwave synthesis using glucose–arginine ratios of 1:3, 1:9, and 1:15. (C) GA-CDs obtained through hydrothermal synthesis at the same ratios. Emission intensities are reported to each maximum and shown in the false color scales.
Agrochemicals 04 00020 g002
Figure 3. Characterization of GA-CDs using DLS and AFM. Number-weighted hydrodynamic diameter distributions from DLS for (A) microwave and (B) hydrothermal samples at glucose–arginine ratios of 1:3, 1:9, and 1:15; three independent scans are shown per sample; the vertical green line marks the 10 nm reference. (C) Representative AFM height image of drop-cast GA-CDs 1:9 h with two marked profile traces; corresponding height profiles are shown to the right.
Agrochemicals 04 00020 g003
Figure 4. In-tissue traceability of GA-CDs fluorescence in Arabidopsis leaves. (A) Representative confocal images of fresh Arabidopsis thaliana leaves (4-week-old). The leaves were infiltrated with ultrapure water (mock; upper panel) and with GA-CDs 1:9 h (0.5 mg mL−1; lower panel). The same fields are shown under transmitted light and under microscope channels: 405 nm (green bars), 561 nm (yellow bars), and 635 nm (red bars). Scalebar = 50 µm. (B) Graphs show the mean fluorescence signal visualized by confocal microscopy. Bars represent the SEM obtained from four biological replicates (four leaves from different plants). Asterisks represent significant differences determined by Student’s t test (** p < 0.005, **** p < 0.0001, ns = not significant).
Agrochemicals 04 00020 g004
Figure 5. Physiological status of Arabidopsis plants treated with GA-CDs 1:9 h. (A) Confocal images of 4-week-old Arabidopsis leaves showing the presence of GA-CDs 1:9 h inside plant tissues after 6 h and 24 h post-infiltration under 405 nm excitation. Representative images of n = 4. Scalebar = 50 µm. (B) Graphs show the mean fluorescence signal visualized by confocal microscopy. Bars represent the SEM obtained from four biological replicates (four leaves from different plants). Asterisks represent significant differences determined by Student’s t test (* p < 0.05, and ** p < 0.005). (C) Non-destructive measurements of chlorophyll, flavonoids, and anthocyanins in 4-week-old Arabidopsis following treatment with GA-CDs (0.5 mg mL−1). Bars show mean ± SE, n = 4. Student’s t-test was used for comparing means.
Agrochemicals 04 00020 g005
Figure 6. Biocompatibility assay of GA-CDs 1:9 h on M. persicae aphids. (A) No-choice assay was performed to determine the effect of OG treatment on aphid fecundity. Four-week-old Arabidopsis leaves were infiltrated with GA-CDs 1:9 h (0.5 mg mL−1) or ultrapure water (mock). One-day-old nymphs were confined to the treated leaves, and 12 days after treatment, the number of offspring was counted. Bars show mean ± SE, n = 7. (BE) EPG analyzed the feeding behavior of aphids to determine the effect of GA-CDs (1:9 h). Then, one adult wingless aphid was placed over the treated leaves, and its feeding profile was recorded using EPG for 8 h. Bars show mean ± SE. At least twelve independent plants and aphids (n = 12) were used for each condition. Student’s t-test was used for comparing means (ns = not significant).
Agrochemicals 04 00020 g006
Figure 7. Effect of GA-CDs on plant-growth–promoting bacteria. Growth kinetics of (A) P. putida KT2440 and (B) P. protegens Pf-5. Bacteria were treated with different GA-CDs (1:9 h) at 0, 0.025, 0.3, and 0.5 mg/mL in KB medium using 24-well transparent plates. The plates were incubated at 28 °C, and the optical density at 600 nm (OD600 nm) was measured every 30 min for 24 h. Bars show mean ± SE. Different letters above the bars indicate statistically significant differences among treatments (one-way ANOVA followed by a post hoc multiple-comparison test, p < 0.05). (C) Agar diffusion assay. Homogeneous lawns of P. putida KT2440 and P. protegens were grown on KB solid agar plates. Then, GA-CDs were applied as 1:9 h droplets in volumes of 0, 1, 5, and 10 μL onto the inoculated agar. The plates were incubated at 28 °C for 2 days, after which bacterial growth was observed.
Agrochemicals 04 00020 g007
Figure 8. Cell viability after exposure to GA-CDs 1:9 h. (A) Percentage viability of A549 WT cells after 24 h with GA-CDs 1:9 h at the indicated concentrations. Bars show mean ± SE; n = 4. The green dashed line indicates 100% cell viability, as determined by A549 WT cells without GA-CDs. Significant treatment–Control differences were assessed by one-way Welch ANOVA followed by Holm-adjusted Welch t-tests (α = 0.05). Asterisk show significant differences. Green dashed line indicates a visual reference for 100% cell viability. (B) Representative phase-contrast images of cultures under the same conditions. White arrowheads indicate non-viable cells detached from the viable monolayer; the dotted circle highlights intact adherent regions.
Agrochemicals 04 00020 g008
Disclaimer/Publisher’s Note: The statements, opinions and data contained in all publications are solely those of the individual author(s) and contributor(s) and not of MDPI and/or the editor(s). MDPI and/or the editor(s) disclaim responsibility for any injury to people or property resulting from any ideas, methods, instructions or products referred to in the content.