Article

Metabolomics-Driven Investigation of Harpin αβ and Laminarin Effects on Cannabis sativa L. Employing GC/EI/MS and 1H NMR Metabolomics

by
Christos N. Kerezoudis
1,
Maria Zervou
2,
Manolis Matzapetakis
2,
Dimitrios Bilalis
3 and
Konstantinos A. Aliferis
1,4,*
1
Laboratory of Pesticide Science, Department of Crop Science, Agricultural University of Athens, Iera Odos 75, 118 55 Athens, Greece
2
Institute of Chemical Biology, National Hellenic Research Foundation, 48 Vas. Constantinou Ave., 116 35 Athens, Greece
3
Laboratory of Agronomy, Department of Crop Science, Agricultural University of Athens, Iera Odos 75, 118 55 Athens, Greece
4
Department of Plant Science, Macdonald Campus of McGill University, Sainte-Anne-de-Bellevue, QC H9X 3V9, Canada
*
Author to whom correspondence should be addressed.
Agrochemicals 2025, 4(3), 16; https://doi.org/10.3390/agrochemicals4030016
Submission received: 8 August 2025 / Revised: 4 September 2025 / Accepted: 11 September 2025 / Published: 13 September 2025
(This article belongs to the Section Plant Growth Regulators and Other Agrochemicals)

Abstract

Hemp (Cannabis sativa L.) is a polymorphic species that synthesizes an array of bioactive metabolites, with cannabinoids and terpenoids constituting the major chemical classes. Until recently, the lack of legislative framework led to limited research on hemp’s plant protection and nutrition. Biostimulants have recently attracted scientific attention as sustainable alternatives to plant protection products (PPPs). Herein, we investigated the effects of biostimulant harpin (αβ) proteins and the PPP polysaccharide laminarin on hemp (cv. Futura 75), employing GC/EI/MS and 1H NMR metabolomics. Analyses demonstrated that treatments induced distinct shifts in the metabolism of the plants, thus, enabling the discovery of metabolite-biomarkers of physiological adaptation, defense mechanisms (α-linolenic acid), and bioactivity (cannabinoids). Harpin and laminarin altered the concentration of bioactive compounds such as cannabidiol, essential amino acids including L-phenylalanine and GABA, salicylate, and caffeate. Pathway analysis revealed treatment-specific modulation of key metabolic networks, with harpin triggering early, yet transient activation of phenylpropanoid- and amino acid-related pathways before broad repression, whereas laminarin maintained a more balanced regulation, sustaining defense-related biosynthesis while preserving core primary metabolism. Results advance the understanding of molecular mechanisms underlying biostimulants’ action in hemp and support their potential for improving plant health and attributes of cannabis-derived products, providing insights for its sustainable cultivation.

1. Introduction

Cannabis sativa L. is a highly polymorphic species that includes four sub-species (subsp.) and four varieties (var.) [1]. Their cannabinoid content exhibits substantial fluctuation; C. sativa subsp. sativa var. sativa (domestication traits) and C. sativa subsp. sativa var. spontanea (wild-type traits) with low Δ9-tetrahydrocannabinol (Δ9-THC) content, and C. sativa subsp. indica var. indica (domestication traits) and C. sativa subsp. indica var. kafiristanica (wild-type traits), with high Δ9-THC content [2]. In Europe, the legal upper Δ9-THC content for hemp or fiber varieties is below 0.3%, and they are included in the first category [3], whereas marijuana or medical cannabis are included in the third category, with either high Δ9-THC or high Δ9-THC and cannabidiol (CBD) levels [4,5].
Hemp is one of the first crops exploited by humans, with its first use estimated approximately 10,000 years ago [6]. There is a wide range of hemp-derived products produced from the fiber, wooden core, or seeds [7]. Currently, there is an increased interest in its nutritional value [8], its potential as a thermal insulation material in the construction industry [9,10], its use as a biodiesel fuel [11], and notably, for its therapeutic properties [12,13], including epilepsy treatment [14]. The latter is mainly due to its content in a group of secondary metabolites present only in cannabis species, known as cannabinoids, with the most abundant being Δ9-THC, CBD, and cannabichromene (CBC), and others present in small abundances like cannabigerol (CBG) and cannabinol (CBN) [15,16].
Nonetheless, because of the recent legalization of its cultivation and the relevant research, there is only a small amount of plant protection products (PPPs) registered, which include essential oils produced by plants (e.g., rosemary oil, garlic oil), microorganisms used as biological agents against fungal infections and infestations (e.g., strains of Bacillus sp., Beauveria sp., Trichoderma sp.), and sulfur and copper that are used widely in organic farming [17,18]. This represents a major obstacle towards the further development of the sector. For example, in Greece, there are only three pesticides approved for use in cannabis cultivation by the Ministry of Rural Development and Food: two herbicides and one molluscicide [19].
Within this context, cannabis growers increasingly seek to incorporate sustainable agricultural practices that not only ensure a high productivity but also align well with environmental stewardship and regulatory compliance. The application of biostimulants and alternative PPPs, has a high potential, and represents a frontier in sustainable crop management. Biostimulants are substances or microorganisms that, when applied to plants or soils, stimulate natural processes to enhance nutrient uptake, abiotic/biotic stress tolerance, and crop quality. There are many different categories of biostimulants, with the most widely used being the seaweed extracts, plant growth-promoting rhizobacteria or microorganisms, humic and fulvic acids, and protein hydrolysates [20]. In the European Union (EU), biostimulants are registered under the Regulation (EU) 2019/1009 of the European Parliament and of the Council [21]. PPPs, conversely, encompass a wide range of chemical and biological agents aimed at controlling pests, pathogens, and competing weeds. While their primary function is to protect crops from biotic stress, PPPs can also indirectly influence plant metabolism by altering metabolic pathways and nutrient assimilation dynamics, and triggering plant defense responses [22].
The use of biostimulants has grown exponentially, been implemented into integrated plant protection programs, contributing to the reduction in conventional PPPs use and the promotion of an environmentally friendly agriculture model [23]. They have many advantages over conventional PPPs because, in addition to their ability to induce the defense system of the plants against biotic and abiotic stresses [24,25,26,27,28], they are able to improve phenotypes (e.g., shoots, roots, growth, yield) [29,30,31,32,33]. Additionally, they can activate the biosynthetic pathways for the production of antioxidants and other important enzymes [34,35,36,37].
Cannabis has a very complex chemical profile and it has been shown that its cannabinoid content is prone to change from exogenous parameters (e.g., light) or applications (biostimulants, fertilization, phytohormones) [1,38,39,40]. All these changes to the plants’ metabolite profiles can be successfully recorded by metabolomics [15,16].
Within this context, here, combined Gas Chromatography/Electron Impact/Mass Spectrometry (GC/EI/MS) and Proton Nuclear Magnetic Resonance Spectroscopy (1H NMR) metabolomics was employed to systematically investigate the impact of two bioactives, harpin (αβ) proteins (harpin) (biostimulant) and laminarin (PPP) on the metabolic landscape of C. sativa L. plants (cv. Futura 75). Harpin triggers plant defense responses by activating systemic acquired resistance (SAR) and inducing the expression of pathogenesis-related (PR) genes. It modulates metabolic pathways associated with the biosynthesis of a secondary metabolite, such as phenylpropanoids, flavonoids, or anthocyanins [41]. Additionally, harpin enhances energy metabolism and redox homeostasis, improving plant stress resilience [42]. On the other hand, the β-1,3-glucan polysaccharide laminarin, activates plant immune responses by priming defense-related metabolic pathways. It enhances the production of reactive oxygen species (ROS) and upregulates genes involved in jasmonic acid and salicylic acid signaling. It also stimulates secondary metabolite biosynthesis, contributing to increased plant resistance against pathogens [43]. The thorough mining of the metabolic perturbations induced by these inputs under controlled experimental conditions is of paramount importance, and it is highly foreseen that it will assist in the discovery of the involved metabolic pathways and the corresponding biomarkers. Therefore, such an approach could determine whether specific treatments promote or suppress the biosynthesis of cannabinoids and other high-value compounds, and evaluate the potential of these inputs to enhance plant fitness and chemical consistency.
The integration of metabolomics data with phenotypic observations is highly foreseen, which will not only deepen our understanding of the effect of harpin and laminarin on cannabis physiology but also support the development of more precise and sustainable cultivation strategies tailored to both medicinal and industrial applications.

2. Materials and Methods

2.1. Chemicals and Reagents

All chemicals and reagents used in the experiments were of the highest commercially available purity. A mixture of methanol-ethyl acetate 50:50 v/v (GC/MS grade, purity 99.9%, Carlo Erba Reagents, val de Reuil, France) was used for the extraction of cannabis leaves for GC/EI/MS metabolomics. For the derivatization of samples, pyridine (99.8%, v/v), methoxylamine hydrochloride (98%, w/w), and N-methyl-N-(trimethyl-silyl) tri-fluoroacetamide (MSTFA) (Sigma-Aldrich Ltd., Steinheim, Germany), were used. The extraction of samples for 1H NMR metabolomics was performed with deuterium oxide (D2O, 99.9% purity), containing 200 mM 3- (trimethylsilyl)-propionic acid-2,2,3,3-d4-sodium salt (TSP) (Sigma-Aldrich, St. Gallen, Switzerland). The products evaluated in this study were Vacciplant® 4.5 SL (UPL, Bandra West, India) and ProAct® (Plant Health Care TM, Manchester, UK). Vacciplant® 4.5 SL contains β-1,3-glucan laminarin, a storage polysaccharide extracted from the brown alga Laminaria digitata. ProAct® contains a second-generation harpin, composed of gene expression products from the following sources: (a) hrpN from Erwinia amylovora, (b) hrpZ from Pseudomonas syringae pv. syringae, and (c) PopA from Ralstonia solanacearum.

2.2. Biological Material and Growth Conditions

Here, as a model organism, the cannabis variety ‘Futura 75’, a monoecious variety originating from France (HEMP IT AND, 9 Route d’Angers, Beaufort en Vallé, Beaufort en Anjou, 49250, France) was used for the monitoring of the effect of harpin and laminarin. The metabolite profile of the variety is characterized by a CBD concentration of 1.5–2.0%, and a very low Δ9-THC content (<0.12%). Plants were propagated from seeds sown in a 3:2 peat-perlite mixture in 567 mL pots (9 × 9 × 7 cm, L × W × H). Plants were grown in a phytotron under a 18/6 h light/dark photoperiod. The relative humidity was maintained at 60–70%, and the temperature was kept constant at 25 °C. Light of 500 μmol/m2/s at the leaf level was provided by the LED Lumi-VF lights (Valoya, Helsinki, Finland). Plants were manually irrigated, starting with 40 mL per pot, with volumes gradually increasing over time to prevent water stress. The humidity of the substrate was monitored regularly using a soil humidity meter.

2.3. Experimental Design and Sampling

A total of six treatments were performed, with twelve plants per treatment. The first application of the bioactives was performed three weeks following plants’ germination, and a second application, one week later, according to the manufacturers’ recommendations. To evaluate the effects, leaf samples were collected at two time points: 24 h (time point 1, T1) and seven days after the second application (time point 2, T2). The preparations of the bioactives were performed according to the manufacturers’ guidelines in sterile water, and plants were receiving the exact amount of spaying mix that corresponds to the field conditions. For metabolomics analysis, the first fully developed set of leaves from each plant was collected using scissors and the samples were placed into 50 mL falcon tubes and immediately were quenched in liquid N2 to halt all biological and enzymatic activities. Twelve plants were harvested per treatment group and time point. To generate pooled biological replicates, leaves from two individual plants were combined in a single Falcon tube in order to obtain six pooled replicates per treatment. To prevent cross-contamination, all the equipment was thoroughly cleaned with acetone between harvesting samples of the different treatment groups. All samples were subsequently stored at −80 °C until further processing and analysis.

2.4. Cannabis sativa L. GC/EI/MS & 1H NMR Metabolite Profiling

2.4.1. Extraction and Analysis of Cannabis Metabolites with GC/EI/MS

The extraction of metabolites from cannabis for the GC/El/MS metabolomics analysis was performed following a robust protocol developed by our Biostimulant, Biocontrol, and Pesticide Metabolomics Group (B2PMG, https://www.aua.gr/pesticide-metabolomicsgroup/team/default.html) (accessed on 7 August 2025) [44] with minor modifications. Briefly, the collected leaves were pulverized into a fine powder using a mortar and pestle under liquid N2. Then, a portion of the samples (50 mg) was weighed into 2 mL Eppendorf tubes and 600 μL of the extraction solution (methanol-ethyl acetate, 1:1, v/v) was added for metabolite extraction. In order to improve the extraction efficacy, the resulting suspensions were sonicated in an ultrasonic bath (Ultrasonic cleaner 3200 EP S3, SOLTEC S.r.l, Milano, Italy) for 20 min, followed by stirring at 150 rpm for 1 h at room temperature using a horizontal orbital shaker (GFL 3006, Geschacha für Labortechnik mbH, Burgwedel, Germany). The extracts were then filtered through 0.2 μm pore diameter filters (Macherey-Nagel, Duren, Germany) to remove debris. For quality control purposes, a 20 μL aliquot of a ribitol solution (0.2 mg mL−1 in methanol) was added as an internal standard (IS). The samples were evaporated using a vacuum concentrator (Eppendorf Concentrator Plus, Eppendorf, Hamburg, Germany). The resulting dry samples were derivatized following a two-step process based on previously described protocols [45,46]. The first step involved the addition of 80 μL of a methoxylamine hydrochloride solution (20 mg mL−1 in pyridine) and incubation in a dry block incubator (Digital Cooling Bath, Thermo Fisher Scientific, Waltham, MA, USA) at 30 °C for 2 h, under continuous agitation. This step stabilizes sugars, leading to improved chromatographic resolution. In the second step, 80 μL of N-methyl-N-(trimethylsilyl)trifluoroacetamide (MSTFA) were added, and the resulting solutions were incubated at 37 °C for 90 min under continuous agitation. During silylation, active hydrogens of metabolite functional groups are replaced with trimethylsilyl (TMS) moieties, substantially improving their volatility and stability for analysis. The derivatized extracts were transferred into 200 μL glass micro-inserts placed in 2 mL glass autosampler vials (Macherey-Nagel, Duren, Germany) for GC/EI/MS analysis. Experimental blanks were also prepared following the same protocol to identify features unrelated to the analyzed plant material.
Analyses were performed by employing an Agilent 6890 MS (Agilent Technologies Inc., Santa Clara, CA, USA) platform equipped with a 5973 inert mass selective detector (MSD). The derivatized cannabis extracts (1 μL) were injected on column (HP-5MS, 30 m long, 0.25 mm diameter, 0.25 μm film thickness, Agilent Technologies Inc.) at a split ratio of 5:1. As a carrier gas, He was used, at a flow rate of 1 mL min−1 and the temperature of the injector was set at 230 °C. The initial temperature of the oven was set at 70 °C, remained stable for 5 min, following a 5 °C min−1 rate increase until 310 °C, finally kept stable for 1 min. The temperature of the MS source was set at 230 °C and that of the quadrupole at 150 °C. Positive electron ionization was used (70 eV) and full scan mass spectra were acquired in the mass range 50–800 Da at a ratio of 4 scans s−1, with an initial signal acquisition delay of 6 min. For the control of experimental events, the Agilent’s MSD ChemStation E.02.01.1177 software was employed (Agilent Technologies Inc., Santa Clara, CA, USA).
The acquired GC/EI/MS chromatograms were initially deconvoluted using the software AMDIS v.2.66 and the mass spectra library of NIST24 (National Institute of Standards and Technology library, NIST, Gaithersburg, MD, USA). The detected metabolite features were tentative identified based on the matching of their mass spectra to those of known compounds with similarity >95%. Selected metabolites were absolutely identified using analytical standards that were analyzed in the same system under identical conditions. The total ion chromatograms (TIC) were further processed using the software MS DIAL v.5.4.241021 (e.g., baseline correction, alignment, feature removal). Then, the datasets were exported to Microsoft Excel® (Microsoft 365, Version 2508), for further curation and addition of information for the annotated metabolites (e.g., coding, biosynthetic pathways). Multivariate analyses was performed as previously described [45] using the bioinformatics software SIMCA-P+ v.18.0 (Umetrics, Sartorius Stedim Data Analytics AB, Umeå, Sweden). Orthogonal partial least square-discriminant analysis (OPLS-DA) regression coefficients (p < 0.05) was used for the discovery of signatory metabolites and trends within the datasets. Jack-knifing was employed for the calculation of standard errors, with 95% confidence intervals.

2.4.2. Extraction and Analysis of Cannabis Metabolites with 1H NMR

The extraction of cannabis leaves for 1H NMR metabolomics was based on a previously described method [47], with minor modifications. A portion of the pulverized cannabis leaf tissues (100 mg) were added into 2 mL Eppendorf tubes and they were lyophilized for 24 h to remove water. Subsequently, D2O containing 200 mM TSP (850 μL) was added to the lyophilized samples for the extraction of the polar metabolome. Samples were sonicated for 20 min in an ultrasonic bath (Branson 1210, Danbury, CT, USA), and then agitated at 120 rpm for 1 h at 24 °C. To remove possible debris that could interfere with analysis, the samples were centrifuged twice (10,000 rpm at 4 °C for 20 min), and the supernatants were collected for analysis. The obtained extracts were stored at −80 °C in 2 mL Eppendorf tubes until the 1H NMR spectra acquisition.
For analyses, the D2O cannabis extracts were transferred into 5 mm thin wall precision NMR sample tubes (Wilmad, Vineland, NJ, USA) (final volume 600 μL). Spectra were recorded using a 600 MHz Varian VRMS2 spectrometer equipped with an HCN helium-cooled cryoprobe. One-dimensional (1D) 1H spectra were acquired using the NOESY pulse sequence with a Carr-Purcell-Meiboom-Gill (CPMG) filter. Experimental parameters were as follows; 128 scans, a mixing time of 100 ms, 4 s presaturation with a 12 Hz window, a 90° pulse of 6.8 µs, an acquisition time of 2.6 s, and a spectral width of 12 kHz. The CPMG filter was applied for 102.4 ms, consisting of 128 loops with 100 µs delay.
For the deconvolution and analyses of the 1H NMR data, the software Spectrus v.2024.2.3 (Advanced Chemistry Development, Inc., ACD/Labs, Toronto, ON, Canada) was employed. Standard preprocessing steps, including automatic baseline correction and manual phasing, were applied to ensure robust peak integration and spectral alignment. Chemical shift assignments and coupling constants (J values) were annotated by referencing publicly available NMR spectral databases and the internal databases of the software. To facilitate semiquantitative analysis, the Intelligent Bucketing algorithm with a bin width of 0.01 ppm was applied. Spectral regions corresponding to the residual water signal and areas without discernible signals were excluded to enhance the robustness and accuracy of the analysis. A similar bioinformatics workflow to the one described above for GC/EI/MS was employed for the discovery of biomarkers and trends.

2.4.3. One Way-Analysis of Variance (ANOVA)

In addition to multivariate analysis, for selected metabolites, one-way ANOVA was performed. Significant differences were discovered using Student’s t-test, with a p-value < 0.05 considered statistically significant. All analyses were conducted using JMP Pro v.18.2.1 software (SAS Institute, Cary, NC, USA).

3. Results and Discussion

3.1. Overview of GC/EI/MS and 1H NMR Metabolomics Analyses

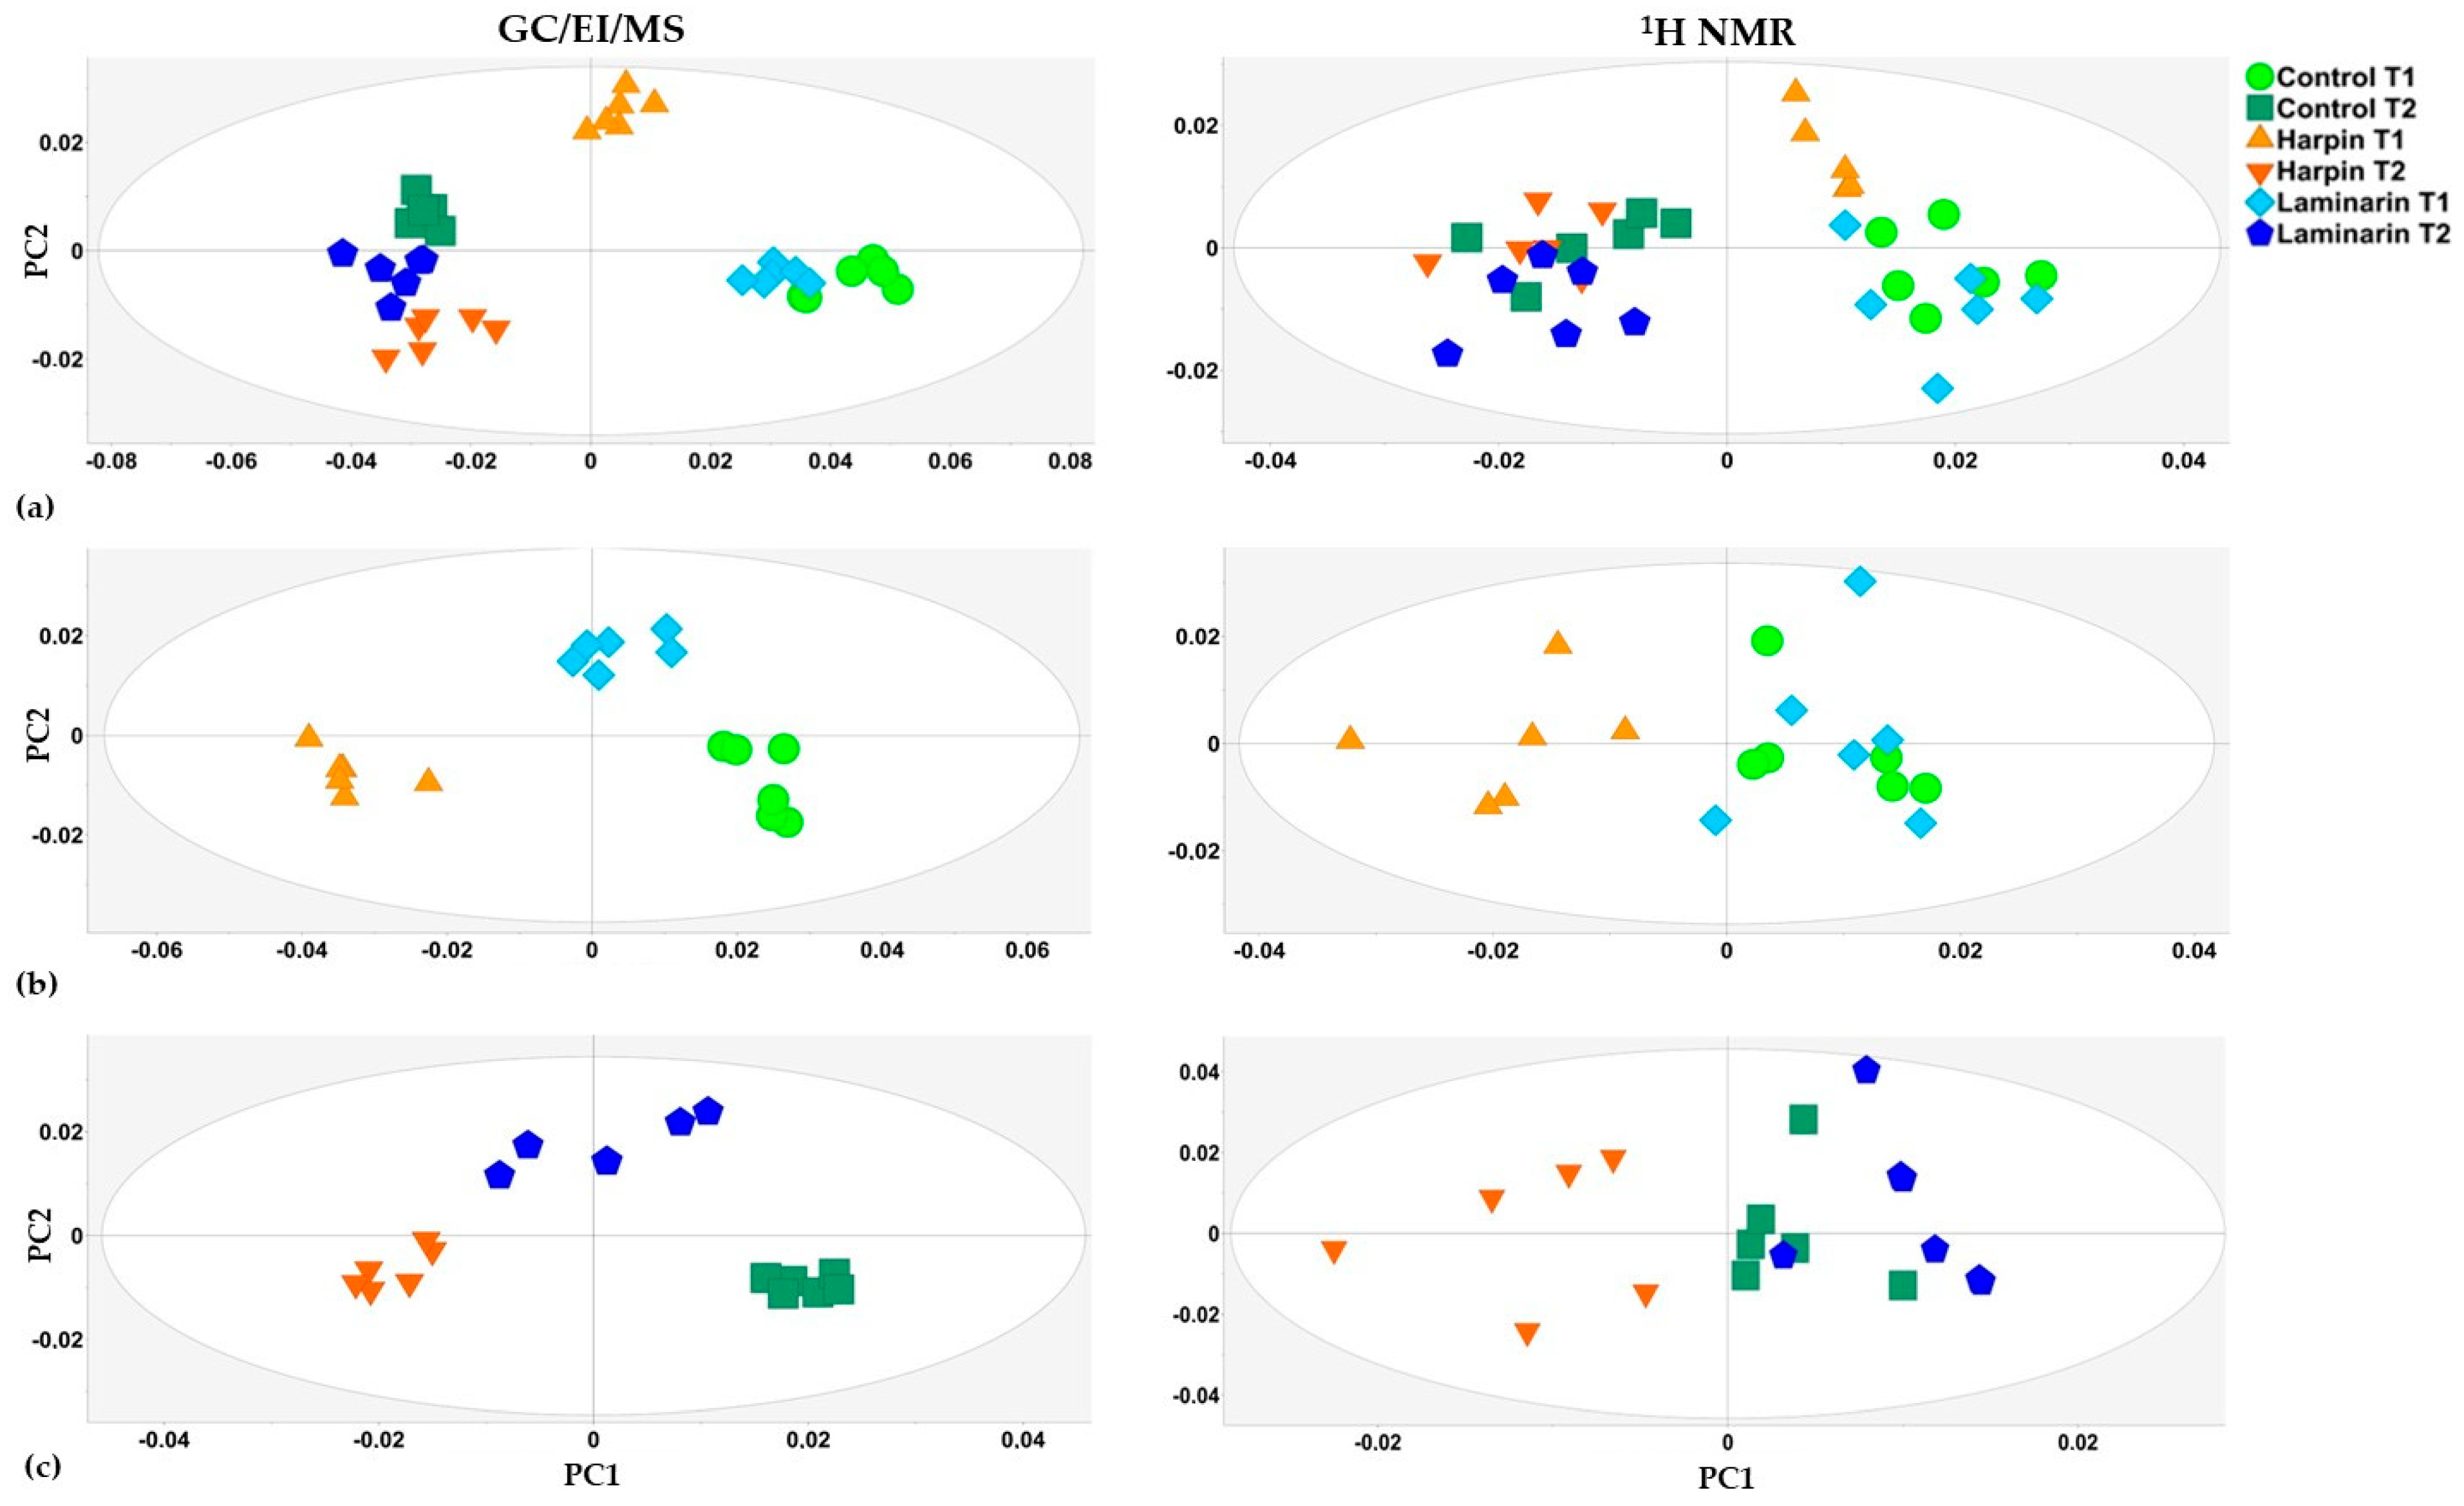
The robustness of both GC/EI/MS and 1H NMR bioanalytical protocols being applied, was confirmed by the high quality of the acquired Total Ion Chromatograms (TICs) and spectra, respectively (Figure 1), the absence of outliers, and the tight clustering among the biological replications of each treatment and time point, as displayed in the obtained OPLS-DA score plots (Figure 2). Representative raw data are publicly available through the website of our group https://www.aua.gr/pesticide-metabolomicsgroup/Resources/default.html (accessed on 7 August 2025) [Cannabis sativa L. (Cannabis) (PMG-08-25)]. The GC/EI/MS matrix of cannabis metabolite profiles comprised 296 reproducibly detected metabolite features, while the 1H NMR matrix included 211 integrated spectral bins. In total, 107 metabolite features were annotated in various identification levels (Table S1).
Application of OPLS-DA to both datasets, revealed a strong and distinct effect of harpin and laminarin treatments on the metabolic composition of cannabis leaves, with the developmental stage to have the highest leverage on the observed discrimination (Figure 2). This is evident by the clear separation between the T1 and T2 clusters in the total OPLS-DA score plot (Figure 2a), indicating a substantial shift in plants’ metabolism in the time course. Among the main observations is the sustained effect of harpin. Harpin protein-treated plants at T1 and T2, form two separate and well-defined clusters that are consistently distinct from those of the untreated ones. At T1, harpin-treated plants form a cluster that is notably the furthest from the rest, suggesting that it causes a substantial metabolic perturbation. By examining the time points individually, the OPLS-DA for T1 (Figure 2b) shows that all three groups of treatments form distinct clusters, which is indicative of the substantial and distinct metabolic changes in cannabis plants shortly following the application of these two bioactives. Similarly, the OPLS-DA for T2 (Figure 2c) reveals that the clusters for all three groups of treatments remained distinct, which is indicative of the effect of the two bioactives up to seven days post-treatment, and while both treatments induce sustained metabolic perturbations, the specific changes evolved between the two time points, highlight the dynamic nature of the plants’ responses.

3.2. Treatments of Cannabis sativa L. Plants with Harpin (α,β) and Laminarin Substantially Alter Their Global Leaf Metabolism

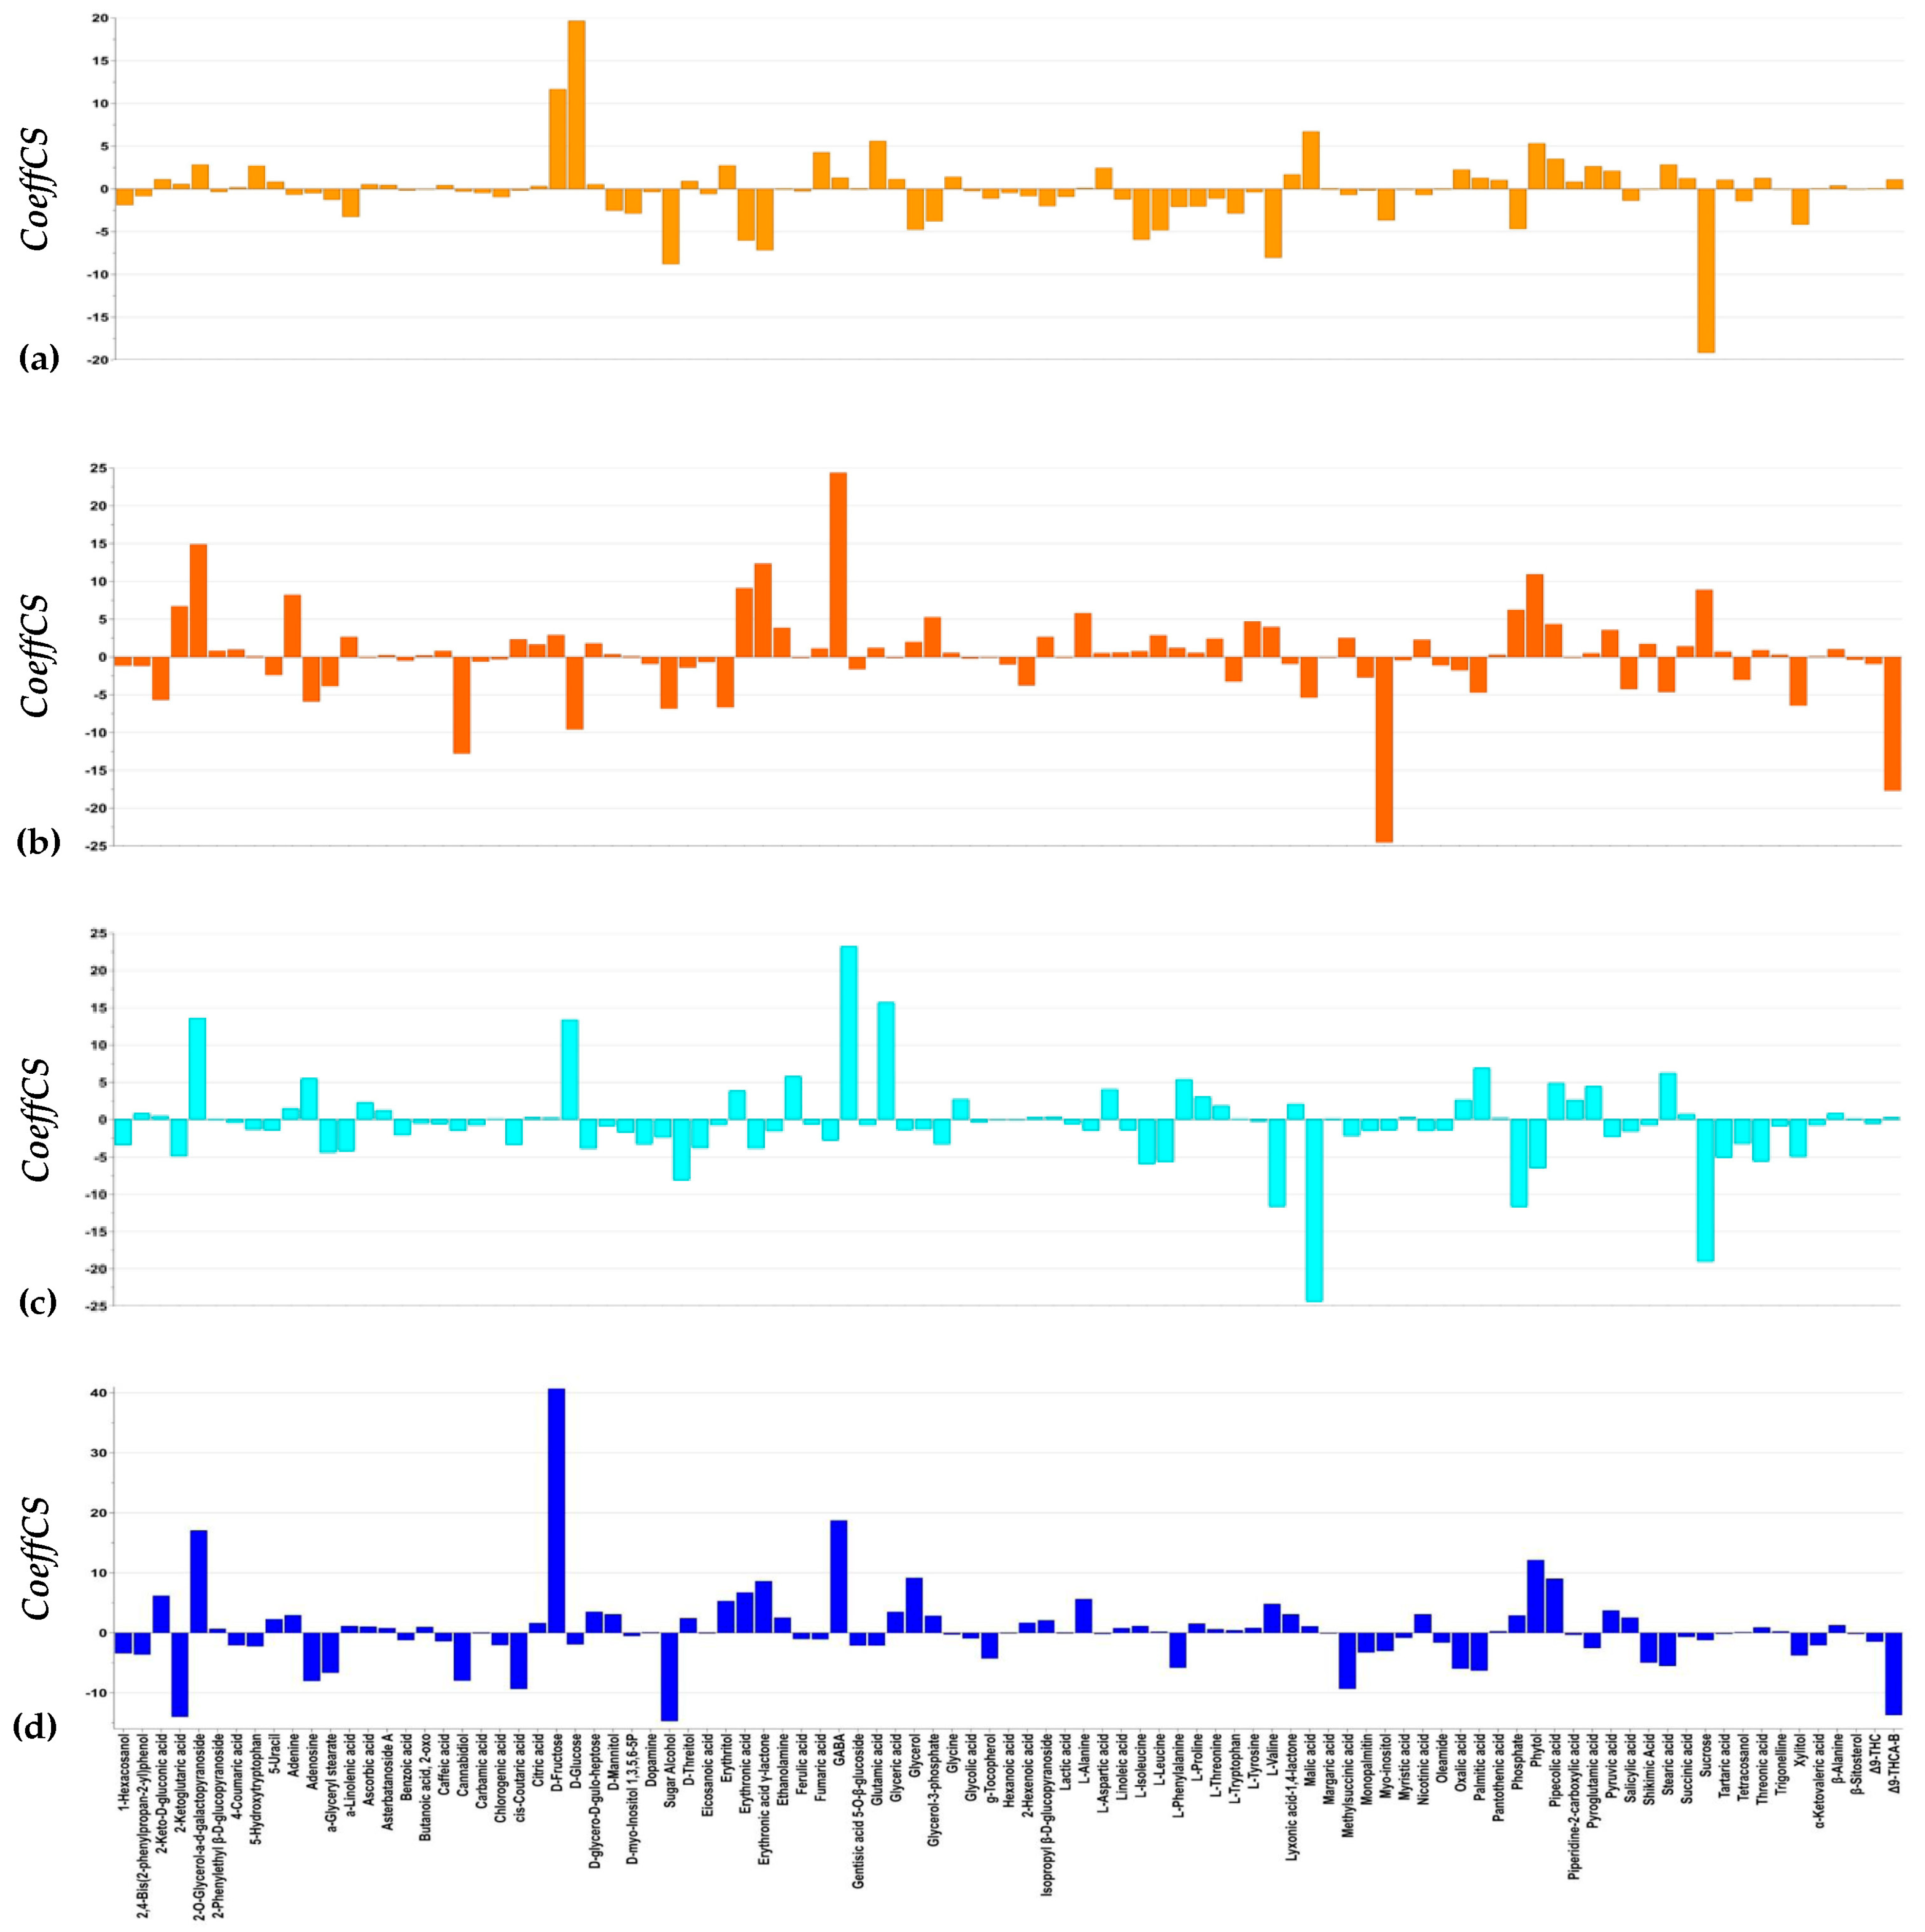
Bioinformatics analyses of GC/EI/MS and 1H NMR datasets revealed the global disturbance of cannabis plants’ metabolism 24 h (T1) and seven days (T2) following applications with harpin and laminarin, and specific metabolites-biomarkers of effect (Figure 3) and corresponding biosynthetic pathways being affected (Figure 4, Table 1) were discovered.
The metabolites-biomarkers of the effect of the bioactives being applied were discovered applying multivariate analysis using scaled and centered regression coefficients (CoeffCS) (Figure 3 and Figure 4). In the corresponding coefficient plots, metabolites driving the observed discriminations are displayed; positive coefficient values correspond to metabolites present at higher relative concentrations in the untreated plants compared to the treated ones, while negative values to those present at higher relative concentrations in the latter. Among these biomarkers, there are many that play key roles in plant metabolism and physiology and are discussed in detail below in Section 3.3.
In a first step, we attempted to record the effects of the bioactives on the global metabolism of cannabis plants at both time points. Therefore, we compiled a comprehensive table (Table 1), in which fluctuations of the plants’ metabolism have been encoded based on the KEGG’s coding system (https://www.genome.jp/kegg/pathway.html) (Accessed 7 August 2025). The annotated metabolites were classified according to their participation in major biosynthetic pathways.
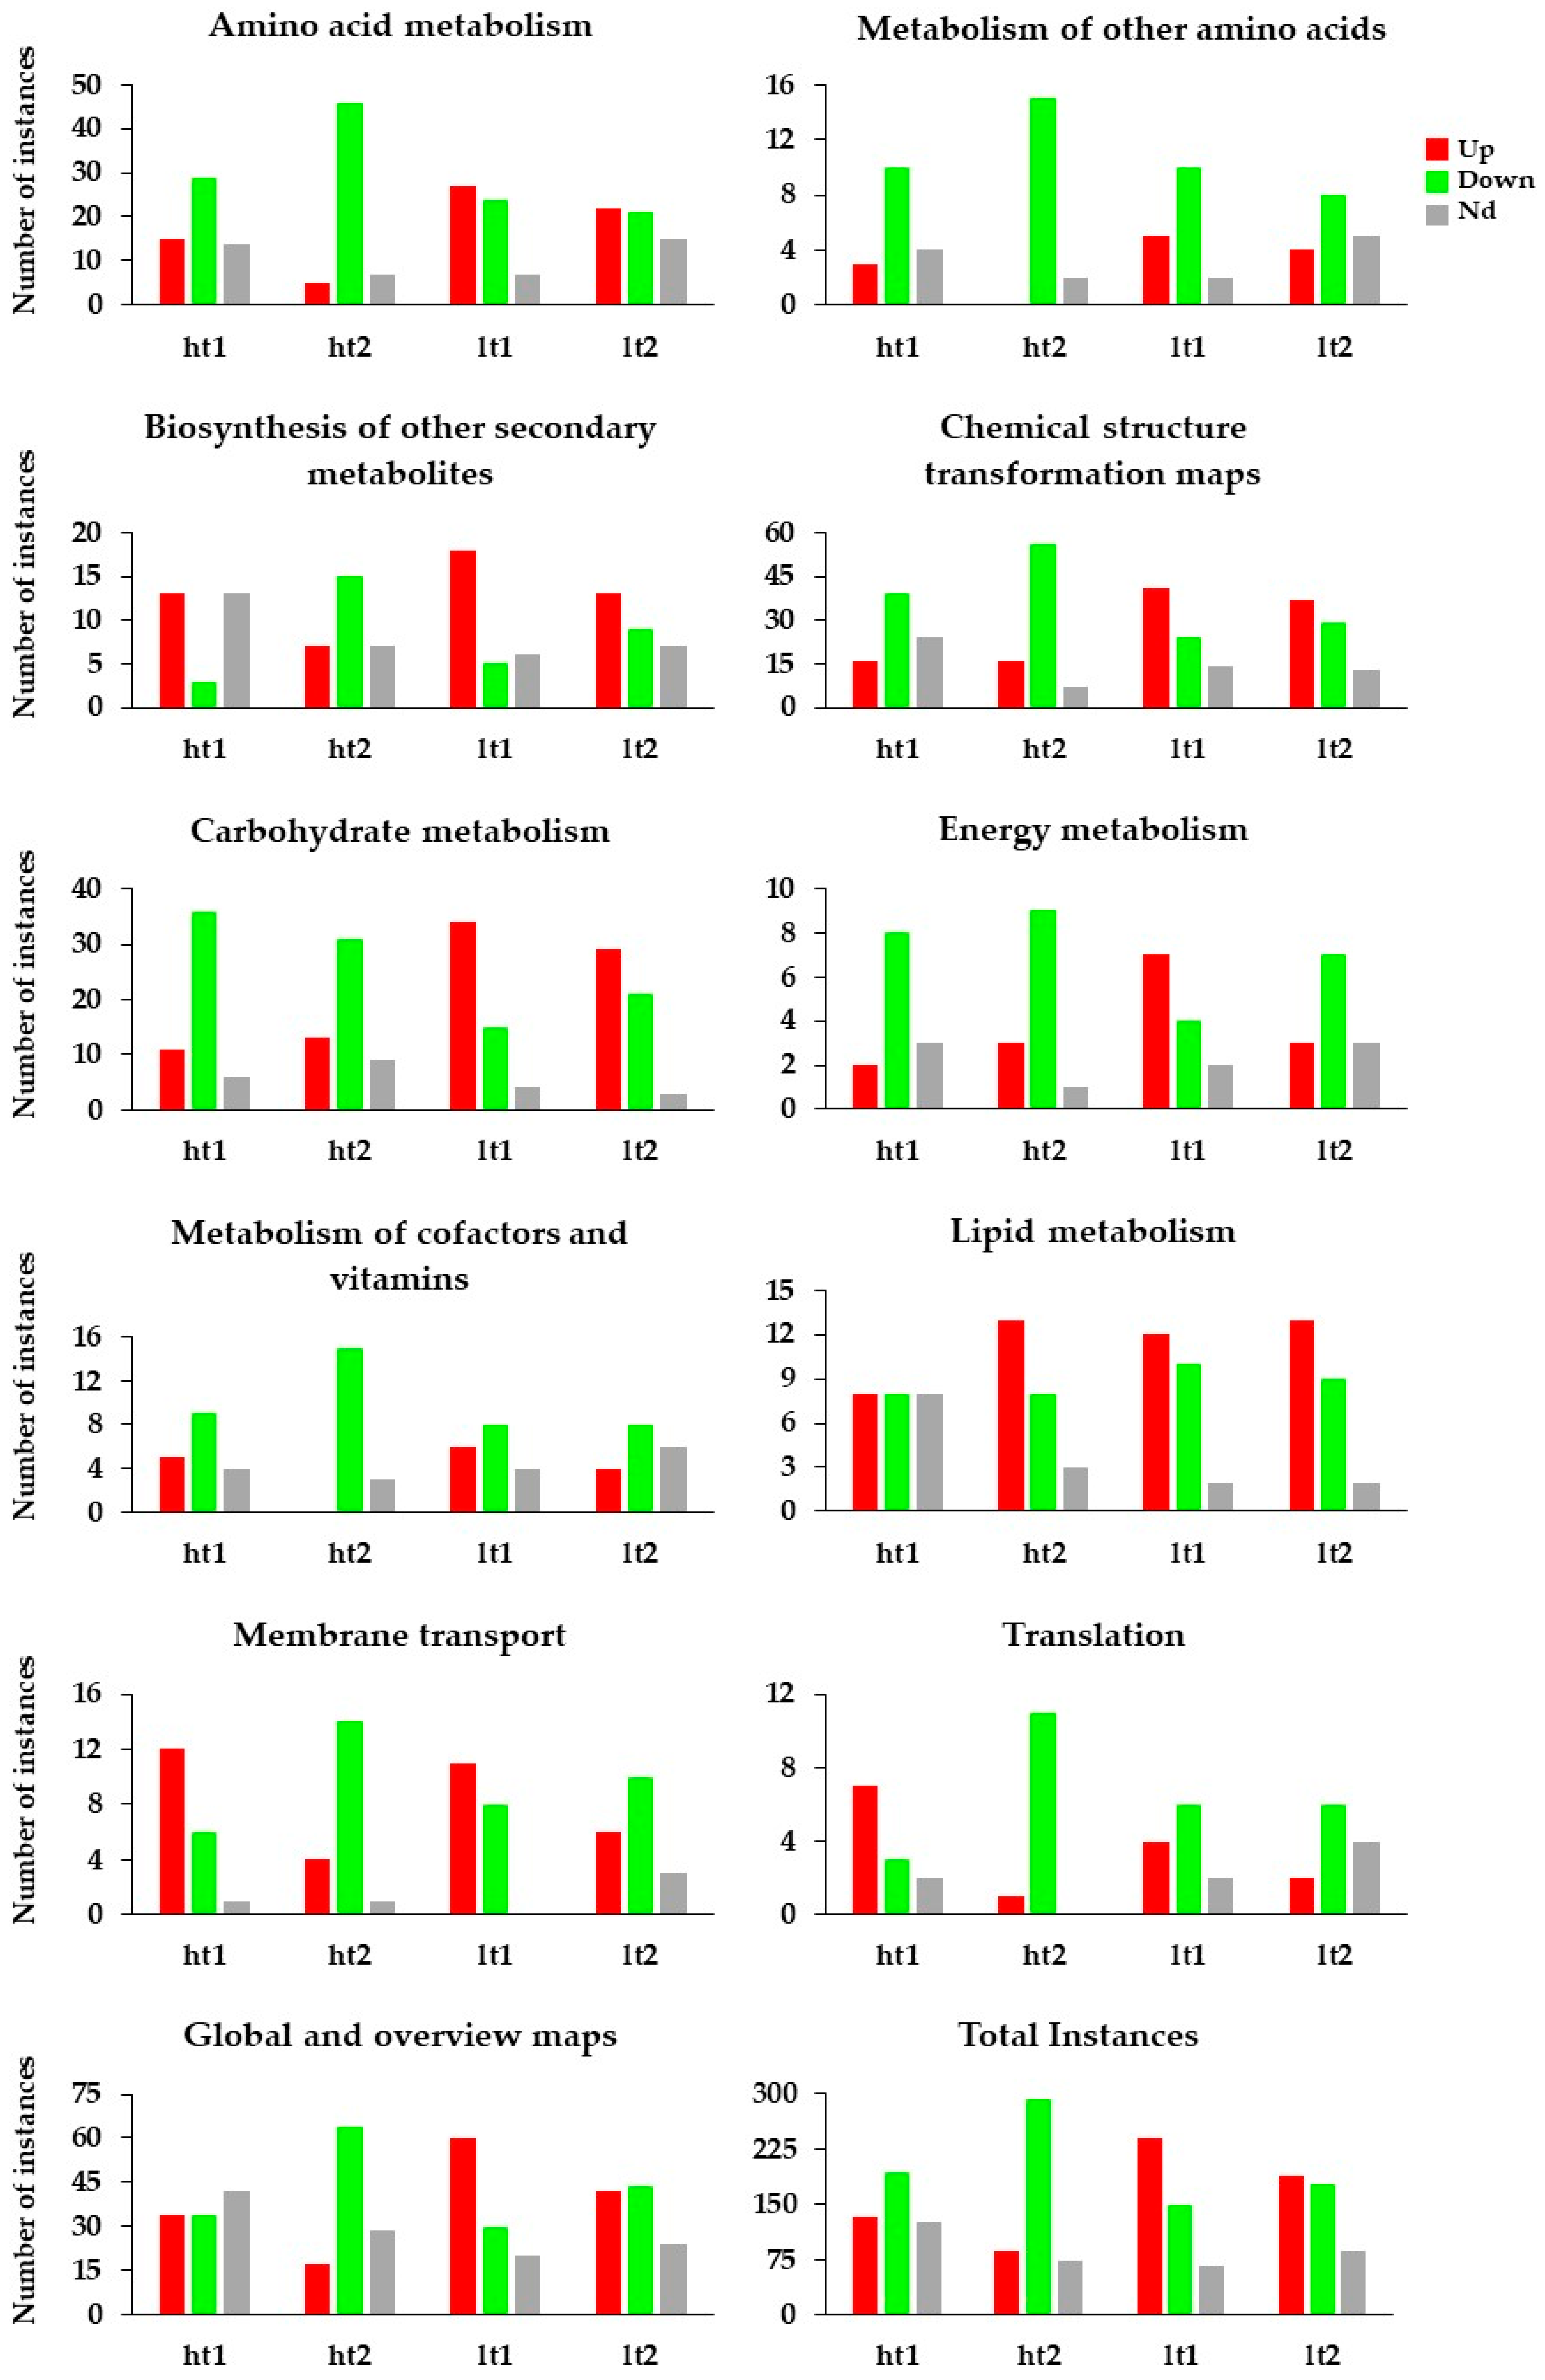
Such an approach could greatly assist towards the deconvolution of the elicitor-induced systemic responses of cannabis plants’ across key functional bio-synthetic categories, including, among others, amino acid, carbohydrate, and lipid metabolism, secondary metabolite biosynthesis, and other essential processes, such as energy, cofactor, and vitamin metabolism, and membrane transport. The distribution patterns of upregulated, downregulated, and unaffected pathways, provided insights into the underlying mechanism by which harpin and laminarin differentially influence specific metabolic networks in the time course (Figure 4).
Specifically, harpin-treated plants at T1 (ht1) exhibited a moderate metabolic adjustment, with downregulated (D) pathway instances (ht1D = 193) exceeding the upregulated (U) ones (ht1U = 134), while a significant portion of pathways remained unaffected (Nd) (ht1Nd = 127). This is indicative of an early-phase metabolic suppression or diversion, yet with a considerable subset of metabolic processes remaining stable. At T2, harpin-treated plants’ (ht2) metabolite profiles shifted substantially, exhibiting a sharp increase in the downregulated pathways (ht2D = 293) and a concurrent decline in upregulated instances (ht2U = 88). Interestingly, pathways with no substantial difference (ht2Nd = 73) were markedly reduced compared to ht1Nd, suggesting a broad transition towards metabolic down-regulation, affecting pathways that were previously stable. For laminarin-treated plants (lt), a more moderate response was observed; at T1 (lt1), upregulated pathways (lt1U = 239) outnumbered downregulated (lt1D = 149) and unaffected pathways (lt1Nd = 66), reflecting a balanced metabolic activation. At T2 (lt2), downregulated pathways increased (lt2D = 178); however, the number of instances for upregulated pathways (lt2U = 188) remained substantial. Notably, the number of pathways remained unaffected (lt2Nd = 88) increased slightly compared to lt1Nd, indicating a stabilization effect where laminarin maintains activity in specific metabolic routes, while selectively modulating others.
A more detailed interpretation of pathway-specific instances (Table 1) reveals distinct treatment- and time-dependent modulation across key metabolic cannabis networks, particularly impacting amino acid metabolism (map00360, map01230), phenylpropanoid biosynthesis (map00940, map01061), carbohydrate metabolism (map00020, map00630), and secondary metabolite pathways (map01060). In harpin-treated plants at T1, there was an early activation of phenylalanine metabolism (map00360) and phenylpropanoid biosynthesis (map00940, map01061), as evidenced by the upregulated instances (ht1U), suggesting an immediate engagement of pathways associated with secondary metabolite biosynthesis and defense priming. However, these pathways also exhibited downregulated components (ht1D), indicating a simultaneous redistribution of metabolic resources. Concurrently, central carbon metabolism, including the TCA cycle (map00020) and glyoxylate metabolism (map00630), was already experiencing downregulation, reflecting an early metabolic shift away from energy-generating pathways. At T2, harpin induced a substantial metabolic repression. A sharp increase in downregulated instances was observed across almost all pathways, notably in phenylalanine metabolism (map00360), glyoxylate metabolism (map00630), and biosynthesis of amino acids (map01230). Despite that, a few pathways related to phenylpropanoid biosynthesis (map00940; map01061) and secondary metabolism (map01060) remained activated, though at a lower intensity compared to T1, suggesting a narrowed focus on sustaining defense-related biosynthetic routes, while broader primary metabolism is repressed.
In contrast, laminarin-treated plants displayed a more balanced metabolic reprogramming. At T1, laminarin application resulted in the simultaneous upregulation of phenylpropanoid biosynthesis (map00940; map01061) and amino acid biosynthesis (map01230), while maintaining downregulation of glyoxylate metabolism (map00630) and other carbohydrate-related pathways. This dual modulation indicates a controlled allocation of metabolic fluxes, prioritizing defense metabolite production without inducing an extensive metabolic shutdown. At T2, laminarin maintained sustained activity in phenylalanine metabolism (map00360) and phenylpropanoid biosynthesis (map00940; map01061), alongside a moderate increase in downregulated pathways. Notably, amino acid biosynthesis (map01230) and glyoxylate metabolism (map00630) were less repressed compared to harpin treatments, indicating that laminarin preserves essential metabolic functions while selectively modulating secondary metabolism. This pattern reflects a strategic metabolic balancing, allowing defense responses to proceed without the systemic metabolic suppression observed in harpin-treated plants.
Summarizing the abovementioned observations, it is plausible to suggest that although both bioactives induce dynamic metabolic reprogramming, harpin triggers a more aggressive down-regulation over time, significantly reducing unaffected pathways, whereas laminarin promotes a more controlled and sustained metabolism modulation, with a considerable fraction of metabolic stability. Such a pattern is in agreement with observations in Arabidopsis thaliana, where harpin triggered strong transcriptional and protein-level upregulation of TCA cycle enzymes, consistent with a coordinated metabolic reprogramming from growth to defense [48]. Also, application of laminarin to Camellia sinensis plants upregulated key defense signal molecules (e.g., salicylate and abscisate) and several PR proteins against a pest [49].
While the global overview of the recorded metabolic profiles, as presented above, provides valuable insights into general treatment effects, it does not capture the intricate biochemical relationships and pathway-specific alterations induced by the application of the bioactives. To elucidate the underlying mechanisms, a more detailed metabolite network analysis is essential. This approach enables the identification of key metabolic hubs, regulatory nodes, and coordinated responses, offering a systems-level understanding of the plants’ physiological adaptation and biochemical resilience [50,51,52]. Within this context, we have de novo constructed a cannabis leaf metabolite network, which can reveal distinct metabolic shifts in response to harpin and laminarin applications (Figure 5).
A pronounced downregulation of Krebs cycle intermediates, particularly 2-ketoglutarate, succinate, and fumarate, was observed in harpin-treated plants at both time points. This pattern is consistent with its mode of action, rapidly reprogramming metabolism from growth to defense via HR-like responses, high energy demand for secondary metabolism, and diversion of carbon skeletons away from respiration [48]. In contrast, laminarin exerted a more moderate and mixed impact on the TCA cycle, with certain metabolites recorded in higher and others in lower content compared to the untreated. This pattern is in line with reports that laminarin perception is species-specific and often triggers selective, rather than maximal, immune signaling [46]. Such a response is consistent with a priming role, maintaining metabolic balance while preparing the plant for an enhanced reaction upon pathogen challenge [53].
Most of the annotated amino acids were either downregulated or unaffected across treatments and time points, with the exception of the branched-chain amino acids (valine, isoleucine, leucine), which exhibited a transient upregulation at T1, followed by downregulation at T2 in both treatments. The fatty acid metabolism displayed a variable response; metabolites such as palmitate, stearate, eicosanoate, and linoleate were upregulated at T1 and/or T2, while others like hexanoate, myristate, and margarate remained largely unaffected. Notably, α-linolenate exhibited a treatment-specific pattern, being downregulated by laminarin at both time points, whereas in harpin-treated plants, it was upregulated at T1 and downregulated at T2. Within the phenylpropanoid pathway, a general upregulation was recorded for metabolites such as salicylate and chlorogenate following both treatments. However, laminarin elicited a stronger response, particularly enhancing the accumulation of caffeate, ferulate, benzoate, and 4-coumarate, suggesting a more robust activation of secondary metabolism. Finally, in the cannabinoid biosynthetic pathway, significant upregulation of CBD was observed at T2 in response to both treatments, indicating a stimulatory effect on cannabinoid production, while a variable effect was recorded for Δ9-THC. A thorough interpretation of the major findings is presented below.

3.3. Effect of Harpin (α.β) and Laminarin Treatments on the Content of Cannabis sativa L. Plants in Bioactive Metabolites and Metabolites That Play Key Roles in Their Metabolism

As discussed above in Section 3.2, harpin and laminarin applications had a profound effect on the metabolism of C. sativa L. causing a general disturbance of the recorded metabolic networks. Here, the effect of these bioactives on the content of the plants in bioactive metabolites and metabolites that play key roles in plants’ metabolism is discussed (Figure 6). The findings aim to contribute towards a deeper understanding of elicitor-induced metabolic reprogramming in cannabis, which is a crop of emerging agronomic and medicinal interest.

3.3.1. Harpin (α,β) and Laminarin Treatments Had a Variable Effect on the Content of Cannabis sativa L. Leaves in CBD and Δ9-THC

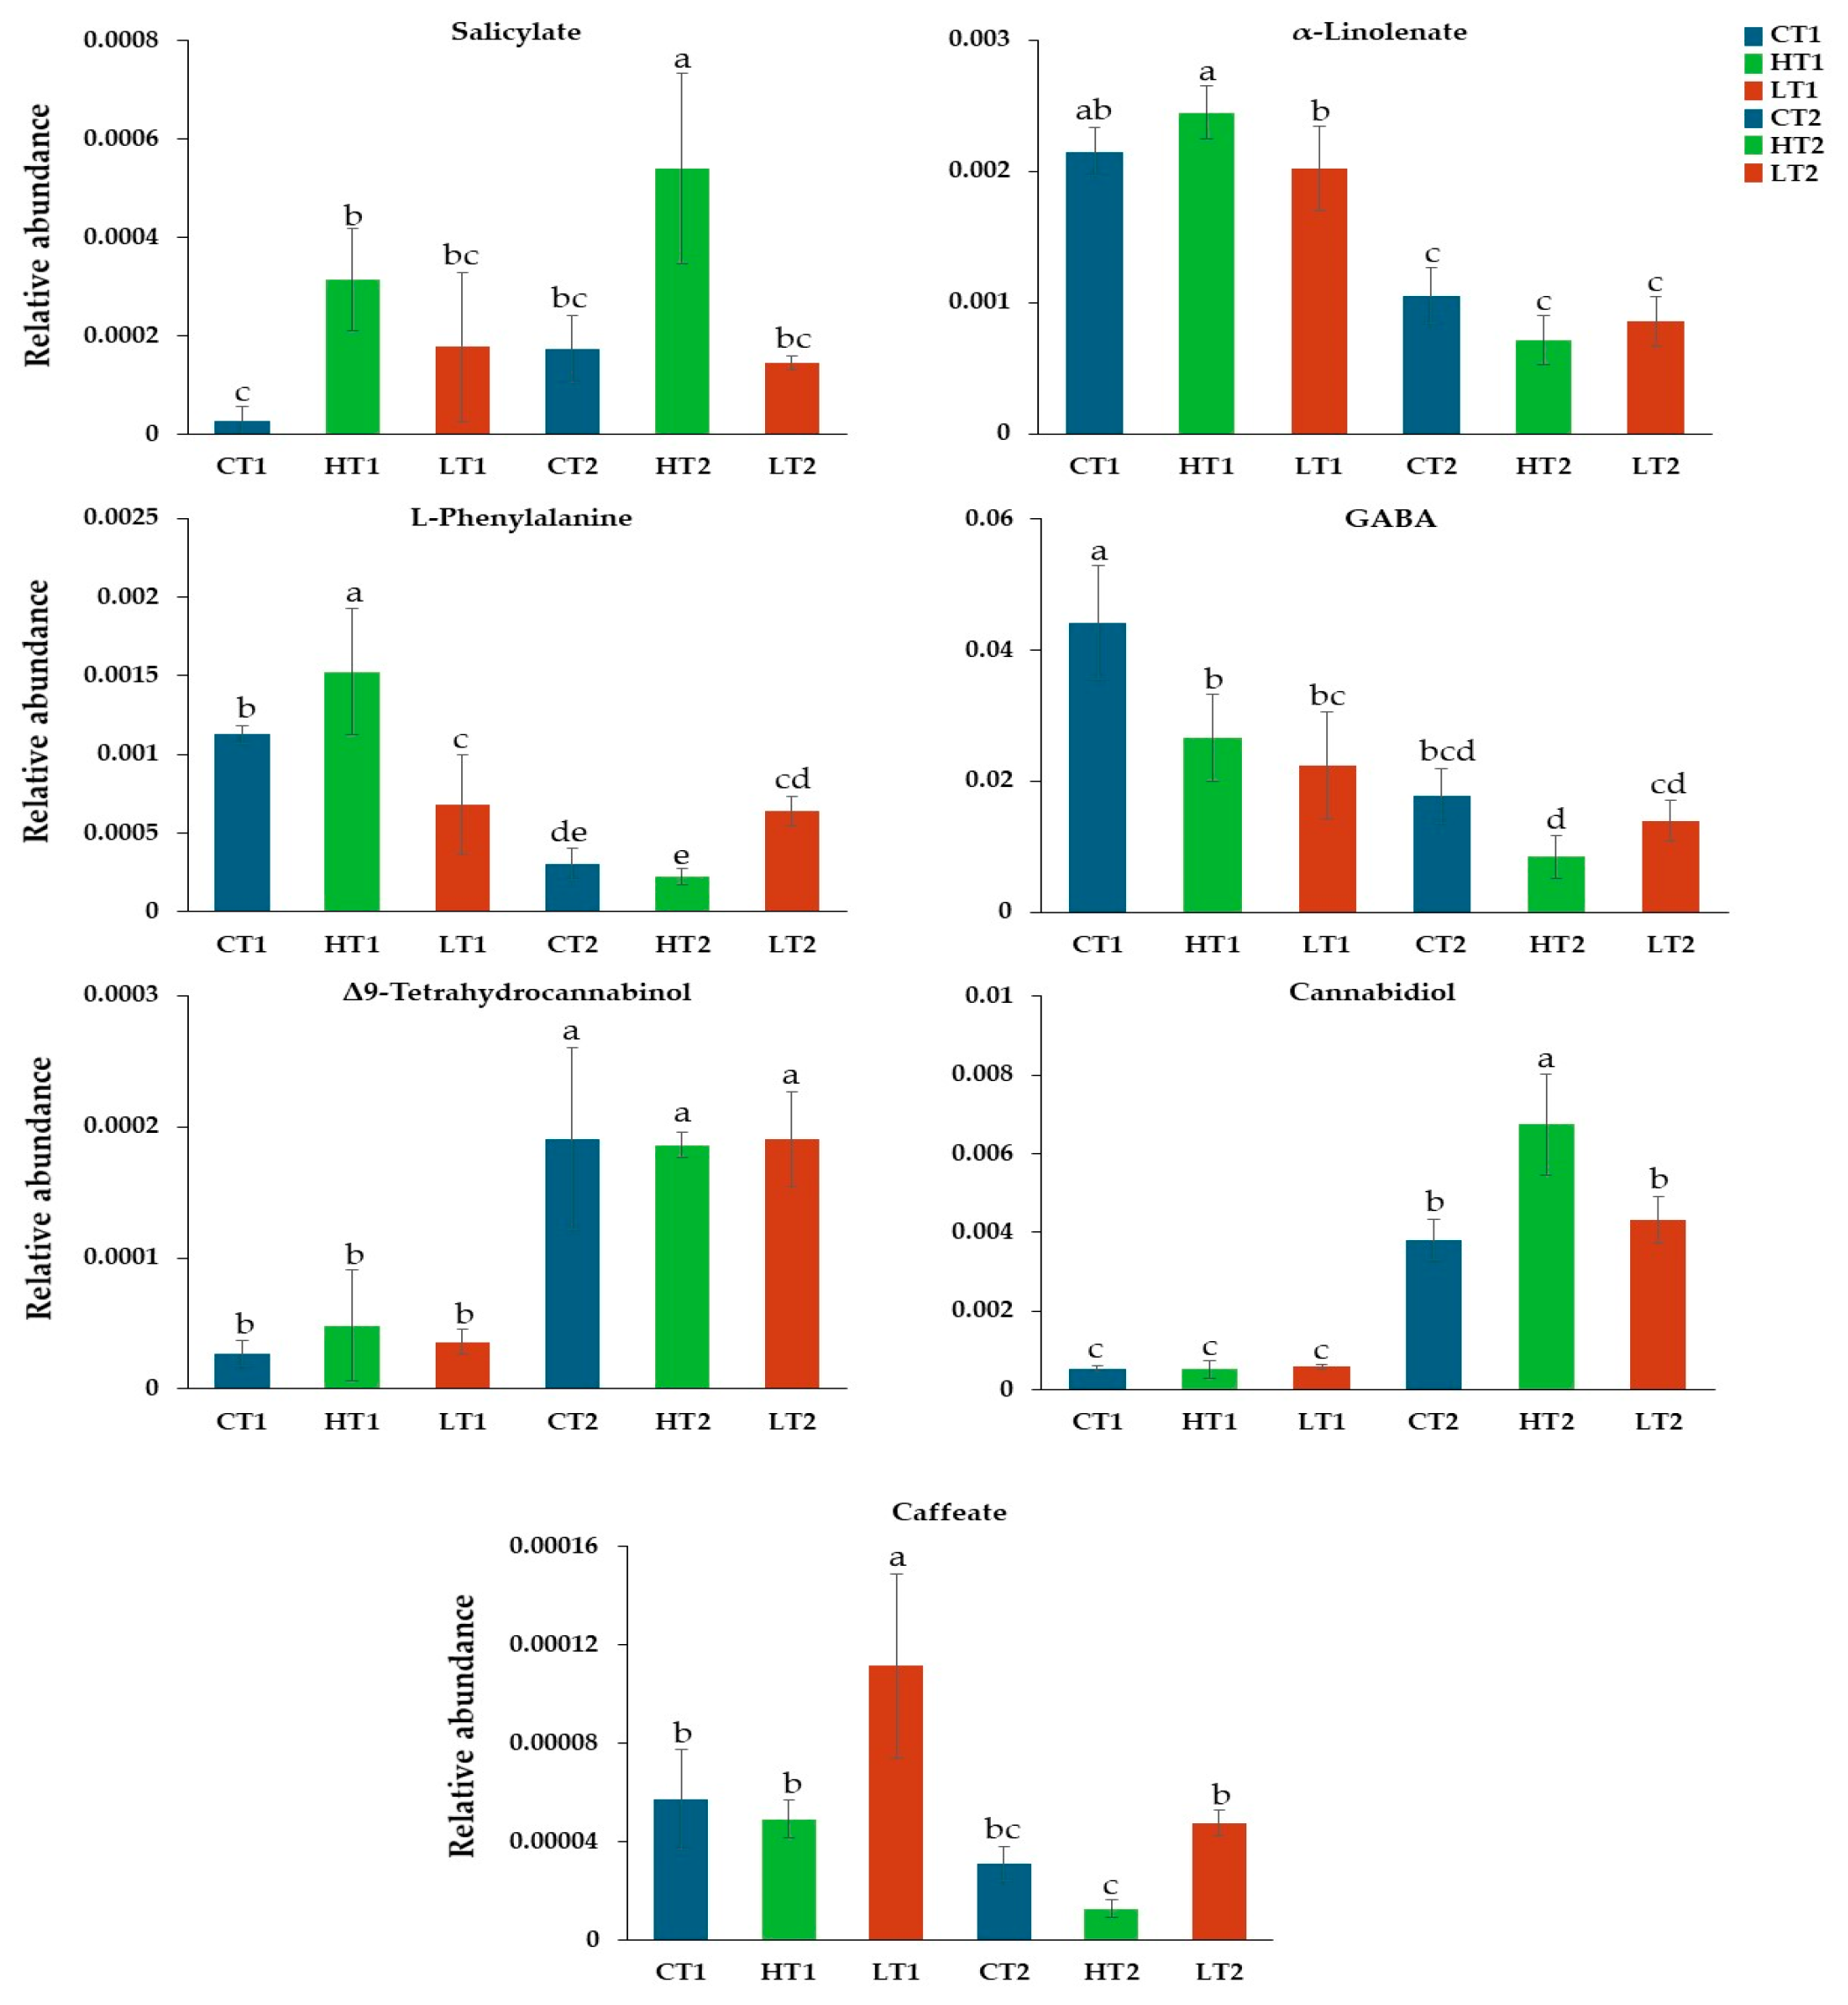
Across all treatments and sampling times, applying ANOVA, the Δ9-THC content remained stable, indicating that the biosynthesis of this metabolite is tightly regulated and resilient to the metabolic reprogramming triggered by either bioactive (Figure 6). In contrast, CBD content displayed a significant and selective increase seven days after harpin application, suggesting that harpin-induced signaling may upregulate key enzymes in the CBDA biosynthetic pathway or enhance precursor availability through secondary metabolism. This delayed response points to a possible transcriptional or post-transcriptional regulation rather than an immediate metabolic shift. A plausible hypothesis for such observation is that harpin is known to activate salicylic acid (SA) and ethylene signaling pathways, upregulating genes such as CsPR1 and CsERF1 that are linked to plant defense and secondary metabolism [42]. These signaling events can enhance the activity of enzymes involved in cannabinoid biosynthesis, explaining the observed increase in CBD content without significant changes in precursor levels. Nonetheless, with the current evidence, we cannot elaborate further on this mechanism. Laminarin treatment did not induce significant changes in CBD, consistent with its milder priming effect on metabolism compared to the more potent elicitation by harpin. These results highlight a compound- and metabolite-specific modulation of the cannabinoid biosynthetic network. Previous studies have also demonstrated that biostimulants can influence CBD accumulation. For example, application of a Trichoderma harzianum strain significantly increased the CBD content in two hemp varieties (Felina and Fedora 17) [39], while a microbial biostimulant altered the cannabinoid profile of medicinal cannabis, enhancing levels of cannabinoids such as CBD, which is not the dominant metabolite in these cultivars [54].
The observed harpin-induced increase in CBD content, without affecting Δ9-THC levels, offers a practical strategy for enhancing the value of compliant hemp cultivars through targeted, timed applications during key growth stages. This approach could enable growers to boost CBD content for pharmaceutical, nutraceutical, and cosmetic markets, while maintaining legal THC limits. Laminarin’s milder cannabinoid impact, combined with its priming of plant defenses, suggests that it could be integrated with harpin in crop management programs to simultaneously improve product quality and resilience. Both bioactives are compatible with sustainable and organic production systems, supporting market differentiation and regulatory compliance. Nonetheless, further research is required for the optimization of their application (dosage, developmental stage).

3.3.2. Harpin (αβ) and Laminarin Treatments Altered the Content of Cannabis sativa L. Leaves in Metabolites That Play a Key Role in Its Metabolism

Treatment of Cannabis plants with harpin and laminarin, altered their leaf content in metabolites that play a fundamental role in their metabolism. Among others, substantial fluctuations were recorded in the content of plants in SA, α-linolenate, phenylalanine (Phe), caffeic acid (CA), and γ-aminobutyric acid (GABA) (Figure 6). SA and α-linolenate are pivotal regulators of the plant defense mechanism. SA functions as a key signaling molecule in SAR, activating defense-related genes and enhancing long-term immunity, while α-linolenate serves as a precursor for jasmonic acid, a central metabolite that orchestrates responses to biotic and abiotic stresses, additionally contributing to induced systemic resistance (ISR) [55,56]. Phe is an essential metabolite in the phenylpropanoid pathway, leading to the synthesis of diverse secondary metabolites, including flavonoids and lignin, which are crucial for plants’ structural reinforcement and pathogen defense [57]. CA derived from Phe, is a key intermediate in lignin biosynthesis and plays an important role in the production of antioxidant phenolic compounds, thereby protecting plant cells against oxidative damage and limiting pathogen proliferation. In addition, CA contributes to cell wall strengthening, which enhances overall stress tolerance [58]. Finally, GABA serves as an important signaling metabolite, particularly under abiotic stresses such as drought, salinity, and temperature fluctuations. It is also involved in pH regulation, nitrogen metabolism, and osmotic adjustment, thereby maintaining cellular homeostasis and improving stress resilience [59]. Collectively, these metabolites represent critical components of plant metabolic networks, underpinning growth, defense, and adaptation to environmental challenges.
SA levels exhibited marked temporal fluctuations in response to the two elicitor treatments, revealing distinct patterns of defense signaling activation. In harpin-treated plants, SA content increased significantly at T1, compared to the untreated (CT1), and this elevated concentration was sustained through T2 (HT2). Such a prolonged elevation is indicative of a persistent activation of SA-mediated defense pathways, commonly associated with systemic acquired resistance (SAR) and long-term transcriptional reprogramming of defense-related genes. Similar findings have been observed in cannabis seedlings, where 24 and 48 h after harpin application, expression of the CsPR1 gene, a key component of the salicylic acid pathway was induced [42]. Also, the application of harpin from the bacterium Xanthomonas phaseoli to tobacco, overexpressed the NPR1 gene [60].
In contrast, the application of laminarin triggered a sharp but transient accumulation of SA at T1 (LT1), with levels returning to untreated values by T2 (LT2), pointing to a short-lived activation of SA-dependent signaling. This temporal distinction suggests that harpin induces a more durable defense state, potentially through continuous perception or amplification of defense signals, whereas laminarin primes an early but less sustained SA response. Although laminarin has been reported to stimulate both salicylate- and jasmonate-dependent pathways, in the present study α-linolenate, the key precursor for jasmonic acid biosynthesis, remained unaffected by either treatment. This absence of α-linolenate modulation implies that, under the tested conditions, the jasmonate branch was not substantially engaged, and that the primary hormonal response to both elicitors was dominated by SA-related signaling. Similar fluctuations have been documented, in tea plants where the application of laminarin led to the overexpression of SA and not JA [49].
Furthermore, in laminarin-treated cannabis plants, the observed reduction in Phe content coupled with the concomitant accumulation of CA at T1, is indicative of an enhanced metabolic flux through the phenylpropanoid pathway (Table 1, Figure 5). Phe serves as the primary substrate for phenylalanine ammonia-lyase (PAL), the gateway enzyme in phenylpropanoid biosynthesis, and its depletion is consistent with increased channeling toward downstream metabolites such as CA. The accumulation of CA suggests that laminarin elicitation stimulates phenolic compound biosynthesis as part of a defense-oriented metabolic reprogramming. In cannabis plants, this response may contribute to multiple protective mechanisms; CA acts as a key intermediate in lignin biosynthesis, promoting cell wall strengthening and thus impeding pathogen ingress, while also functioning as a potent antioxidant, mitigating reactive oxygen species generated during elicitor-induced stress responses. This has also been observed in tobacco plants, where laminarin application significantly enhanced the activity of key defense enzymes such as caffeic acid O-methyltransferase (COMT), an enzyme responsible for lignin biosynthesis and the strengthening of cell walls during defense responses [61,62]. Moreover, its role in modulating redox homeostasis could help enhance tolerance to abiotic challenges such as drought, salinity, or high light intensity factors particularly relevant for hemp grown under field conditions. Collectively, these metabolic adjustments highlight laminarin’s ability to activate phenylpropanoid-related defenses in cannabis plants, likely improving structural and biochemical resilience without negatively impacting primary growth processes.
In the leaves of cannabis plants, GABA reached its highest abundance in untreated plants at T1, whereas both harpin- and laminarin-treated plants exhibited significantly reduced levels at both time points. This suppression suggests that the elicitors’ application overrides or reduces the naturally elevated GABA accumulation, typical of the early vegetative stage. GABA is a central non-protein amino acid with multiple functions, including its function as a signaling molecule in stress perception, contributing to cytosolic pH regulation, serving as a compatible osmolyte, and linking carbon–nitrogen balance through the GABA shunt [62]. The observed decrease in GABA following the elicitors’ treatments may indicate that they alter the baseline stress signaling state, potentially lowering constitutive stress readiness in favor of specific, elicitor-driven defense pathways. In cannabis, this could involve metabolic reallocation toward phenylpropanoid- or cannabinoid-related pathways, or the reinforcement of salicylic acid-dependent responses, as observed for harpin above. Direct evidence for reduced GABA content following harpin or laminarin is, to our knowledge, unavailable. Nevertheless, given that both elicitors reinforce SA-dependent defenses and can reallocate carbon toward phenylpropanoid metabolism, a transient down-shift in GABA, tightly coupled to mitochondrial succinate supply via the GABA shunt, remains mechanistically plausible [59,63]. We therefore interpret the observed GABA dynamics as consistent with short-term reorganization of metabolic homeostasis during defense prioritization [64].

4. Conclusions

Although biostimulants and alternative PPPs hold the premise to become key components of the agricultural practice in the effort to combat issues that the sector is facing, their interactions with the plants are largely unexplored, which represents a major obstacle towards their further development and integration. Here, we have highlighted the significant impact of two important bioactive molecules, harpin and laminarin, on the metabolism of cannabis plants, applying metabolomics. The treatments induced distinct shifts in the plants’ metabolic pathways, enhancing the production of key bioactive compounds such as cannabinoids and essential amino acids. Harpin triggered a more aggressive down-regulation of metabolic pathways over time, while laminarin promoted a more balanced and sustained metabolic modulation. Harpin induced a sustained SA increase, consistent with prolonged activation of SA-mediated defenses, while laminarin induced a transient SA response and enhanced phenylpropanoid pathway flux, as evidenced by Phe depletion and CA accumulation. Both elicitors reduced GABA content, suggesting altered stress signaling and carbon–nitrogen balance, potentially reallocating resources toward targeted defense metabolism. These findings underscore the potential of biostimulants and alternative PPPs in improving plant health and the quality of cannabis-derived products. The insights gained from this research could contribute to the development of sustainable cultivation strategies for hemp and the resilience of cultivation. Of great interest will also be the investigation of the long-term effects of similar treatments on cannabis physiology and final product quality, as well as their influence on the broader cannabinoid profile, including minor cannabinoids such as CBG, CBC, and CBN, which hold significant relevance for their medicinal and industrial value. Overall, the research advances our understanding of the molecular mechanisms underlying biostimulant action in hemp cultivation.

Supplementary Materials

The following supporting information can be downloaded at: https://www.mdpi.com/article/10.3390/agrochemicals4030016/s1, Figure S1. Workflow of the metabolomics pipeline for cannabis leaf analysis. Plants were treated with laminarin, harpin (αβ) proteins, or water (control), sampled at 24 h and 7 days after the second treatments, and processed for GC/EI/MS and 1H NMR metabolomics; Table S1. Representative annotated cannabis metabolites.

Author Contributions

Conceptualization, C.N.K. and K.A.A.; methodology, C.N.K., M.M., M.Z., D.B. and K.A.A.; software, C.N.K., M.M., M.Z. and K.A.A.; validation, C.N.K. and K.A.A.; formal analysis, C.N.K. and K.A.A., investigation, C.N.K. and K.A.A., resources, M.M., M.Z., D.B. and K.A.A., data curation, C.N.K. and K.A.A.; writing—original draft preparation, C.N.K. and K.A.A.; writing—review and editing, C.N.K., M.M., M.Z., D.B. and K.A.A.; visualization, C.N.K. and K.A.A.; supervision D.B. and K.A.A. All authors have read and agreed to the published version of the manuscript.

Funding

This research received no external funding.

Informed Consent Statement

Not applicable.

Data Availability Statement

Representative raw data are publicly available through the website of the Biostimulant, Biocontrol, and Pesticide Metabolomics Group (B2PMG) at https://www.aua.gr/pesticide-metabolomicsgroup/Resources/default.html (accessed on 7 August 2025) [Cannabis sativa L. (Cannabis) (PMG-08-25)].

Acknowledgments

Access to the NMR infrastructure has been supported by the project "INSPIRED-The National Research Infrastructures on Integrated Structural Biology, Drug Screening Efforts and Drug target functional characterization" (MIS 5002550), implemented under the Action "Reinforcement of the Research and Innovation Infrastructure", funded by the Operational Programme "Competitiveness, Entrepreneurship and Innovation" (NSRF 2014–2020) and co-financed by Greece and the European Union (European Regional Development Fund).

Conflicts of Interest

The authors declare no conflicts of interest.

References

  1. Bernstein, N.; Gorelick, J.; Zerahia, R.; Koch, S. Impact of N, P, K, and humic acid supplementation on the chemical profile of medical cannabis (Cannabis sativa L). Front. Plant Sci. 2019, 10, 736. [Google Scholar] [CrossRef]
  2. Dal Martello, R.; Min, R.; Stevens, C.J.; Qin, L.; Fuller, D.Q. Morphometric approaches to Cannabis evolution and differentiation from archaeological sites: Interpreting the archaeobotanical evidence from bronze age Haimenkou, Yunnan. Veg. His. Archaeobot. 2024, 33, 503–518. [Google Scholar] [CrossRef] [PubMed]
  3. Simiyu, D.C.; Jang, J.H.; Lee, O.R. Understanding Cannabis sativa L.: Current status of propagation, use, legalization, and haploid-inducer-mediated genetic engineering. Plants 2022, 11, 1236. [Google Scholar] [CrossRef]
  4. McPartland, J.M. Cannabis systematics at the levels of family, genus, and species. Cannabis Ccannabinoid Res. 2018, 3, 203–212. [Google Scholar] [CrossRef]
  5. Borroto Fernandez, E.; Peterseil, V.; Hackl, G.; Menges, S.; de Meijer, E.; Staginnus, C. Distribution of chemical phenotypes (Chemotypes) in European agricultural hemp (Cannabis sativa L.) cultivars. J. Forensic Sci. 2020, 65, 715–721. [Google Scholar] [CrossRef] [PubMed]
  6. Schultes, R.E.; Klein, W.M.; Plowman, T.; Lockwood, T.E. Cannabis: An example of taxonomic neglect. Cannabis Cult. 1975, 23, 21–38. [Google Scholar] [CrossRef]
  7. Ranalli, P.; Venturi, G. Hemp as a raw material for industrial applications. Euphytica 2004, 140, 1–6. [Google Scholar] [CrossRef]
  8. Rupasinghe, H.V.; Davis, A.; Kumar, S.K.; Murray, B.; Zheljazkov, V.D. Industrial hemp (Cannabis sativa subsp. sativa) as an emerging source for value-added functional food ingredients and nutraceuticals. Molecules 2020, 25, 4078. [Google Scholar] [CrossRef]
  9. Charai, M.; Sghiouri, H.; Mezrhab, A.; Karkri, M. Thermal insulation potential of non-industrial hemp (Moroccan Cannabis sativa L.) fibers for green plaster-based building materials. J. Clean. Prod. 2021, 292, 126064. [Google Scholar] [CrossRef]
  10. Sorrentino, G. Introduction to emerging industrial applications of cannabis (Cannabis sativa L.). Rend. Fis. Acc. Lincei 2021, 32, 233–243. [Google Scholar] [CrossRef]
  11. Parvez, A.M.; Lewis, J.D.; Afzal, M.T. Potential of industrial hemp (Cannabis sativa L.) for bioenergy production in Canada: Status, challenges and outlook. Renew. Sustain. Energy Rev. 2021, 141, 110784. [Google Scholar] [CrossRef]
  12. Pagano, C.; Navarra, G.; Coppola, L.; Avilia, G.; Bifulco, M.; Laezza, C. Cannabinoids: Therapeutic use in clinical practice. Int. J. Mol. Sci. 2022, 23, 3344. [Google Scholar] [CrossRef] [PubMed]
  13. Friedman, D.; French, J.A.; Maccarrone, M. Safety, efficacy, and mechanisms of action of cannabinoids in neurological disorders. Lancet Neurol. 2019, 18, 504–512. [Google Scholar] [CrossRef] [PubMed]
  14. Farrelly, A.M.; Vlachou, S.; Grintzalis, K. Efficacy of phytocannabinoids in epilepsy treatment: Novel approaches and recent advances. Int. J. Environ. Res. Public Health 2021, 18, 3993. [Google Scholar] [CrossRef]
  15. Tahir, M.N.; Shahbazi, F.; Rondeau-Gagné, S.; Trant, J.F. The biosynthesis of the cannabinoids. J. Cannabis Res. 2021, 3, 7. [Google Scholar] [CrossRef]
  16. Aliferis, K.A.; Bernard-Perron, D. Cannabinomics: Application of metabolomics in cannabis (Cannabis sativa L.) research and development. Front. Plant Sci. 2020, 11, 554. [Google Scholar] [CrossRef]
  17. Oregon Department of Agriculture. Available online: https://www.oregon.gov/oda/pesticides/pages/cannabis-and-pesticides.aspx (accessed on 7 August 2025).
  18. Government of Alberta. Available online: https://www.alberta.ca/registered-cannabis-pesticides.aspx (accessed on 7 August 2025).
  19. Hellenic Republic Ministry of Rural Develpoment and Food. Available online: https://1click.minagric.gr/oneClickUI/frmFytoPro.zul?lang=en (accessed on 7 August 2025).
  20. Rouphael, Y.; Colla, G. Biostimulants in agriculture. Front. Plant Sci. 2020, 11, 40. [Google Scholar] [CrossRef] [PubMed]
  21. Regulation (EU) 2019/1009 of the European Parliament and of the Council of 5 June 2019 laying down rules on the making available on the market of EU fertilising products and amending Regulations (EC) No 1069/2009 and (EC) No 1107/2009 and repealing Regulation (EC) No 2003/2003 (Text with EEA relevance). Off. J. Eur. Union 2019, L170, 1–114.
  22. Wu, L.; Gao, X.; Xia, F.; Joshi, J.; Borza, T.; Wang-Pruski, G. Biostimulant and fungicidal effects of phosphite assessed by GC-TOF-MS analysis of potato leaf metabolome. Physiol. Mol. Plant Pathol. 2019, 106, 49–56. [Google Scholar] [CrossRef]
  23. Rouphael, Y.; Colla, G. Toward a sustainable agriculture through plant biostimulants: From experimental data to practical applications. Agronomy 2020, 10, 1461. [Google Scholar] [CrossRef]
  24. Bajpai, S.; Shukla, P.S.; Asiedu, S.; Pruski, K.; Prithiviraj, B. A biostimulant preparation of brown seaweed Ascophyllum nodosum suppresses powdery mildew of strawberry. Plant Pathol. J. 2019, 35, 406. [Google Scholar] [CrossRef]
  25. Di Mola, I.; Conti, S.; Cozzolino, E.; Melchionna, G.; Ottaiano, L.; Testa, A.; Sabatino, L.; Rouphael, Y.; Mori, M. Plant-based protein hydrolysate improves salinity tolerance in Hemp: Agronomical and physiological aspects. Agronomy 2021, 11, 342. [Google Scholar] [CrossRef]
  26. Xu, D.; Deng, Y.; Xi, P.; Yu, G.; Wang, Q.; Zeng, Q.; Jiang, Z.; Gao, L. Fulvic acid-induced disease resistance to Botrytis cinerea in table grapes may be mediated by regulating phenylpropanoid metabolism. Food Chem. 2019, 286, 226–233. [Google Scholar] [CrossRef]
  27. Di Sario, L.; Boeri, P.; Matus, J.T.; Pizzio, G.A. Plant biostimulants to enhance abiotic stress resilience in crops. Int. J. Mol. Sci. 2025, 26, 1129. [Google Scholar] [CrossRef]
  28. Johnson, R.; Joel, J.M.; Puthur, J.T. Biostimulants: The futuristic sustainable approach for alleviating crop productivity and abiotic stress tolerance. J. Plant Growth Reg. 2024, 43, 659–674. [Google Scholar] [CrossRef]
  29. Bayat, H.; Shafie, F.; Aminifard, M.H.; Daghighi, S. Comparative effects of humic and fulvic acids as biostimulants on growth, antioxidant activity and nutrient content of yarrow (Achillea millefolium L.). Sci. Hortic. 2021, 279, 109912. [Google Scholar] [CrossRef]
  30. Ertani, A.; Nardi, S.; Francioso, O.; Sanchez-Cortes, S.; Foggia, M.D.; Schiavon, M. Effects of two protein hydrolysates obtained from Chickpea (Cicer arietinum L.) and Spirulina platensis on Zea mays (L.) plants. Front. Plant Sci. 2019, 10, 954. [Google Scholar] [CrossRef] [PubMed]
  31. Abbas, M.; Anwar, J.; Zafar-ul-Hye, M.; Iqbal Khan, R.; Saleem, M.; Rahi, A.A.; Danish, S.; Datta, R. Effect of seaweed extract on productivity and quality attributes of four onion cultivars. Horticulturae 2020, 6, 28. [Google Scholar] [CrossRef]
  32. González-González, M.F.; Ocampo-Alvarez, H.; Santacruz-Ruvalcaba, F.; Sánchez-Hernández, C.V.; Casarrubias-Castillo, K.; Becerril-Espinosa, A.; Castañeda-Nava, J.J.; Hernández-Herrera, R.M. Physiological, ecological, and biochemical implications in tomato plants of two plant biostimulants: Arbuscular mycorrhizal fungi and seaweed extract. Front. Plant Sci. 2020, 11, 999. [Google Scholar] [CrossRef] [PubMed]
  33. Sun, W.; Shahrajabian, M.H.; Soleymani, A. The roles of plant-growth-promoting rhizobacteria (PGPR)-based biostimulants for agricultural production systems. Plants 2024, 13, 613. [Google Scholar] [CrossRef]
  34. Hassan, S.M.; Ashour, M.; Soliman, A.A.; Hassanien, H.A.; Alsanie, W.F.; Gaber, A.; Elshobary, M.E. The potential of a new commercial seaweed extract in stimulating morpho-agronomic and bioactive properties of Eruca vesicaria (L.) Cav. Sustainability 2021, 13, 4485. [Google Scholar] [CrossRef]
  35. Cristofano, F.; El-Nakhel, C.; Pannico, A.; Giordano, M.; Colla, G.; Rouphael, Y. Foliar and root applications of vegetal-derived protein hydrolysates differentially enhance the yield and qualitative attributes of two lettuce cultivars grown in floating system. Agronomy 2021, 11, 1194. [Google Scholar] [CrossRef]
  36. Wang, Q.; Wen, J.; Zheng, J.; Zhao, J.; Qiu, C.; Xiao, D.; Mu, L.; Liu, X. Arsenate phytotoxicity regulation by humic acid and related metabolic mechanisms. Ecotoxicol. Environ. Saf. 2021, 207, 111379. [Google Scholar] [CrossRef]
  37. Monterisi, S.; Zhang, L.; Garcia-Perez, P.; Alzate Zuluaga, M.Y.; Ciriello, M.; El-Nakhel, C.; Buffagni, V.; Cardarelli, M.; Colla, G.; Rouphael, Y. Integrated multi-omic approach reveals the effect of a Graminaceae-derived biostimulant and its lighter fraction on salt-stressed lettuce plants. Sci. Rep. 2024, 14, 10710. [Google Scholar] [CrossRef] [PubMed]
  38. Reichel, P.; Munz, S.; Hartung, J.; Präger, A.; Kotiranta, S.; Burgel, L.; Schober, T.; Graeff-Hönninger, S. Impact of three different light spectra on the yield, morphology and growth trajectory of three different Cannabis sativa L. strains. Plants 2021, 10, 1866. [Google Scholar] [CrossRef]
  39. Kakabouki, I.; Tataridas, A.; Mavroeidis, A.; Kousta, A.; Karydogianni, S.; Zisi, C.; Kouneli, V.; Konstantinou, A.; Folina, A.; Konstantas, A. Effect of colonization of Trichoderma harzianum on growth development and CBD content of hemp (Cannabis sativa L.). Microorganisms 2021, 9, 518. [Google Scholar] [CrossRef] [PubMed]
  40. Formisano, C.; Fiorentino, N.; Di Mola, I.; Iaccarino, N.; Gargiulo, E.; Chianese, G. Effect of saline irrigation and plant-based biostimulant application on fiber hemp (Cannabis sativa L.) growth and phytocannabinoid composition. Front. Plant Sci. 2024, 15, 1293184. [Google Scholar] [CrossRef] [PubMed]
  41. Daler, S.; Karaca, I.; Delavar, H.; Kaya, O. Harnessing the potential of harpin proteins: Elicitation strategies for enhanced secondary metabolite accumulation in grapevine callus cultures. Processes 2024, 12, 1416. [Google Scholar] [CrossRef]
  42. Sands, L.B.; Cheek, T.; Reynolds, J.; Ma, Y.; Berkowitz, G.A. Effects of Harpin and Flg22 on growth enhancement and pathogen defense in Cannabis sativa seedlings. Plants 2022, 11, 1178. [Google Scholar] [CrossRef]
  43. de Borba, M.C.; Velho, A.C.; de Freitas, M.B.; Holvoet, M.; Maia-Grondard, A.; Baltenweck, R.; Magnin-Robert, M.; Randoux, B.; Hilbert, J.-L.; Reignault, P. A laminarin-based formulation protects wheat against Zymoseptoria tritici via direct antifungal activity and elicitation of host defense-related genes. Plant Dis. 2022, 106, 1408–1418. [Google Scholar] [CrossRef]
  44. Papadopoulou, E.-A.; Angelis, A.; Skaltsounis, A.-L.; Aliferis, K.A. GC/EI/MS and 1H NMR metabolomics reveal the effect of an olive tree endophytic Bacillus sp. lipopeptide extract on the metabolism of Colletotrichum acutatum. Metabolites 2023, 13, 462. [Google Scholar] [CrossRef]
  45. Papadopoulou, E.-A.; Giaki, K.; Angelis, A.; Skaltsounis, A.-L.; Aliferis, K.A. A Metabolomic Approach to Assess the Toxicity of the Olive Tree Endophyte Bacillus sp. PTA13 Lipopeptides to the Aquatic Macrophyte Lemna minor L. Toxics 2022, 10, 494. [Google Scholar] [CrossRef]
  46. Franzin, M.; Di Lenardo, R.; Ruoso, R.; Addobbati, R. Incomplete Decarboxylation of Acidic Cannabinoids in GC-MS Leads to Underestimation of the Total Cannabinoid Content in Cannabis Oils Without Derivatization. Pharmaceutics 2025, 17, 334. [Google Scholar] [CrossRef] [PubMed]
  47. Copley, T.R.; Aliferis, K.A.; Kliebenstein, D.J.; Jabaji, S.H. An integrated RNAseq–1H NMR metabolomics approach to understand soybean primary metabolism regulation in response to Rhizoctonia foliar blight disease. BMC Plant Biol. 2017, 17, 84. [Google Scholar] [CrossRef] [PubMed]
  48. Livaja, M.; Palmieri, M.C.; von Rad, U.; Durner, J. The effect of the bacterial effector protein harpin on transcriptional profile and mitochondrial proteins of Arabidopsis thaliana. J. Proteom. 2008, 71, 148–159. [Google Scholar] [CrossRef]
  49. Xin, Z.; Cai, X.; Chen, S.; Luo, Z.; Bian, L.; Li, Z.; Ge, L.; Chen, Z. A disease resistance elicitor laminarin enhances tea defense against a piercing herbivore Empoasca (Matsumurasca) onukii Matsuda. Sci. Rep. 2019, 9, 814. [Google Scholar] [CrossRef] [PubMed]
  50. Aliferis, K.A.; Faubert, D.; Jabaji, S. A metabolic profiling strategy for the dissection of plant defense against fungal pathogens. PLoS ONE 2014, 9, e111930. [Google Scholar] [CrossRef]
  51. Yao, X.; Yao, Y.; An, L.; Li, X.; Bai, Y.; Cui, Y.; Wu, K. Accumulation and regulation of anthocyanins in white and purple Tibetan Hulless Barley (Hordeum vulgare L. var. nudum Hook. f.) revealed by combined de novo transcriptomics and metabolomics. BMC Plant Biol. 2022, 22, 391. [Google Scholar] [CrossRef]
  52. Clark, T.J.; Guo, L.; Morgan, J.; Schwender, J. Modeling plant metabolism: From network reconstruction to mechanistic models. Ann. Rev. Plant Biol. 2020, 71, 303–326. [Google Scholar] [CrossRef]
  53. Wanke, A.; Rovenich, H.; Schwanke, F.; Velte, S.; Becker, S.; Hehemann, J.H.; Wawra, S.; Zuccaro, A. Plant species-specific recognition of long and short β-1, 3-linked glucans is mediated by different receptor systems. Plant J. 2020, 102, 1142–1156. [Google Scholar] [CrossRef]
  54. Lyu, D.; Ruan, E.D.; Backer, R.; Gagné-Bourque, F.; Smith, D.L. Changes in morpho-physiological traits and phytochemical composition of Cannabis sativa L. treated with microbial biostimulants across different substrates. Ind. Crop. Prod. 2025, 224, 120377. [Google Scholar] [CrossRef]
  55. Peng, Y.; Yang, J.; Li, X.; Zhang, Y. Salicylic acid: Biosynthesis and signaling. Annu. Rev. Plant Biol. 2021, 72, 761–791. [Google Scholar] [CrossRef] [PubMed]
  56. Yu, Y.; Gui, Y.; Li, Z.; Jiang, C.; Guo, J.; Niu, D. Induced systemic resistance for improving plant immunity by beneficial microbes. Plants 2022, 11, 386. [Google Scholar] [CrossRef]
  57. Dong, N.Q.; Lin, H.X. Contribution of phenylpropanoid metabolism to plant development and plant–environment interactions. J. Integr. Plant Biol. 2021, 63, 180–209. [Google Scholar] [CrossRef] [PubMed]
  58. Riaz, U.; Kharal, M.A.; Murtaza, G.; uz Zaman, Q.; Javaid, S.; Malik, H.A.; Aziz, H.; Abbas, Z. Prospective roles and mechanisms of caffeic acid in counter plant stress: A mini review. Pak. J. Agric. Res. 2019, 32, 8. [Google Scholar] [CrossRef]
  59. Bouché, N.; Fromm, H. GABA in plants: Just a metabolite? Trends Plant Sci. 2004, 9, 110–115. [Google Scholar] [CrossRef] [PubMed]
  60. Liu, Y.; Zhou, X.; Liu, W.; Huang, J.; Liu, Q.; Sun, J.; Cai, X.; Miao, W. HpaXpm, a novel harpin of Xanthomonas phaseoli pv. manihotis, acts as an elicitor with high thermal stability, reduces disease, and promotes plant growth. BMC Microbiol. 2020, 20, 4. [Google Scholar] [CrossRef]
  61. Klarzynski, O.; Plesse, B.; Joubert, J.-M.; Yvin, J.-C.; Kopp, M.; Kloareg, B.; Fritig, B. Linear β-1,3 glucans are elicitors of defense responses in tobacco. Plant Physiol. 2000, 124, 1027–1038. [Google Scholar] [CrossRef]
  62. Xu, B.; Sai, N.; Gilliham, M. The emerging role of GABA as a transport regulator and physiological signal. Plant Physiol. 2021, 187, 2005–2016. [Google Scholar] [CrossRef]
  63. Aziz, A.; Poinssot, B.; Daire, X.; Adrian, M.; Bézier, A.; Lambert, B.; Joubert, J.-M.; Pugin, A. Laminarin elicits defense responses in grapevine and induces protection against Botrytis cinerea and Plasmopara viticola. Mol. Plant Microbe Interact. 2003, 16, 1118–1128. [Google Scholar] [CrossRef]
  64. Zeier, J. New insights into the regulation of plant immunity by amino acid metabolic pathways. Plant Cell Environ. 2013, 36, 2085–2103. [Google Scholar] [CrossRef] [PubMed]
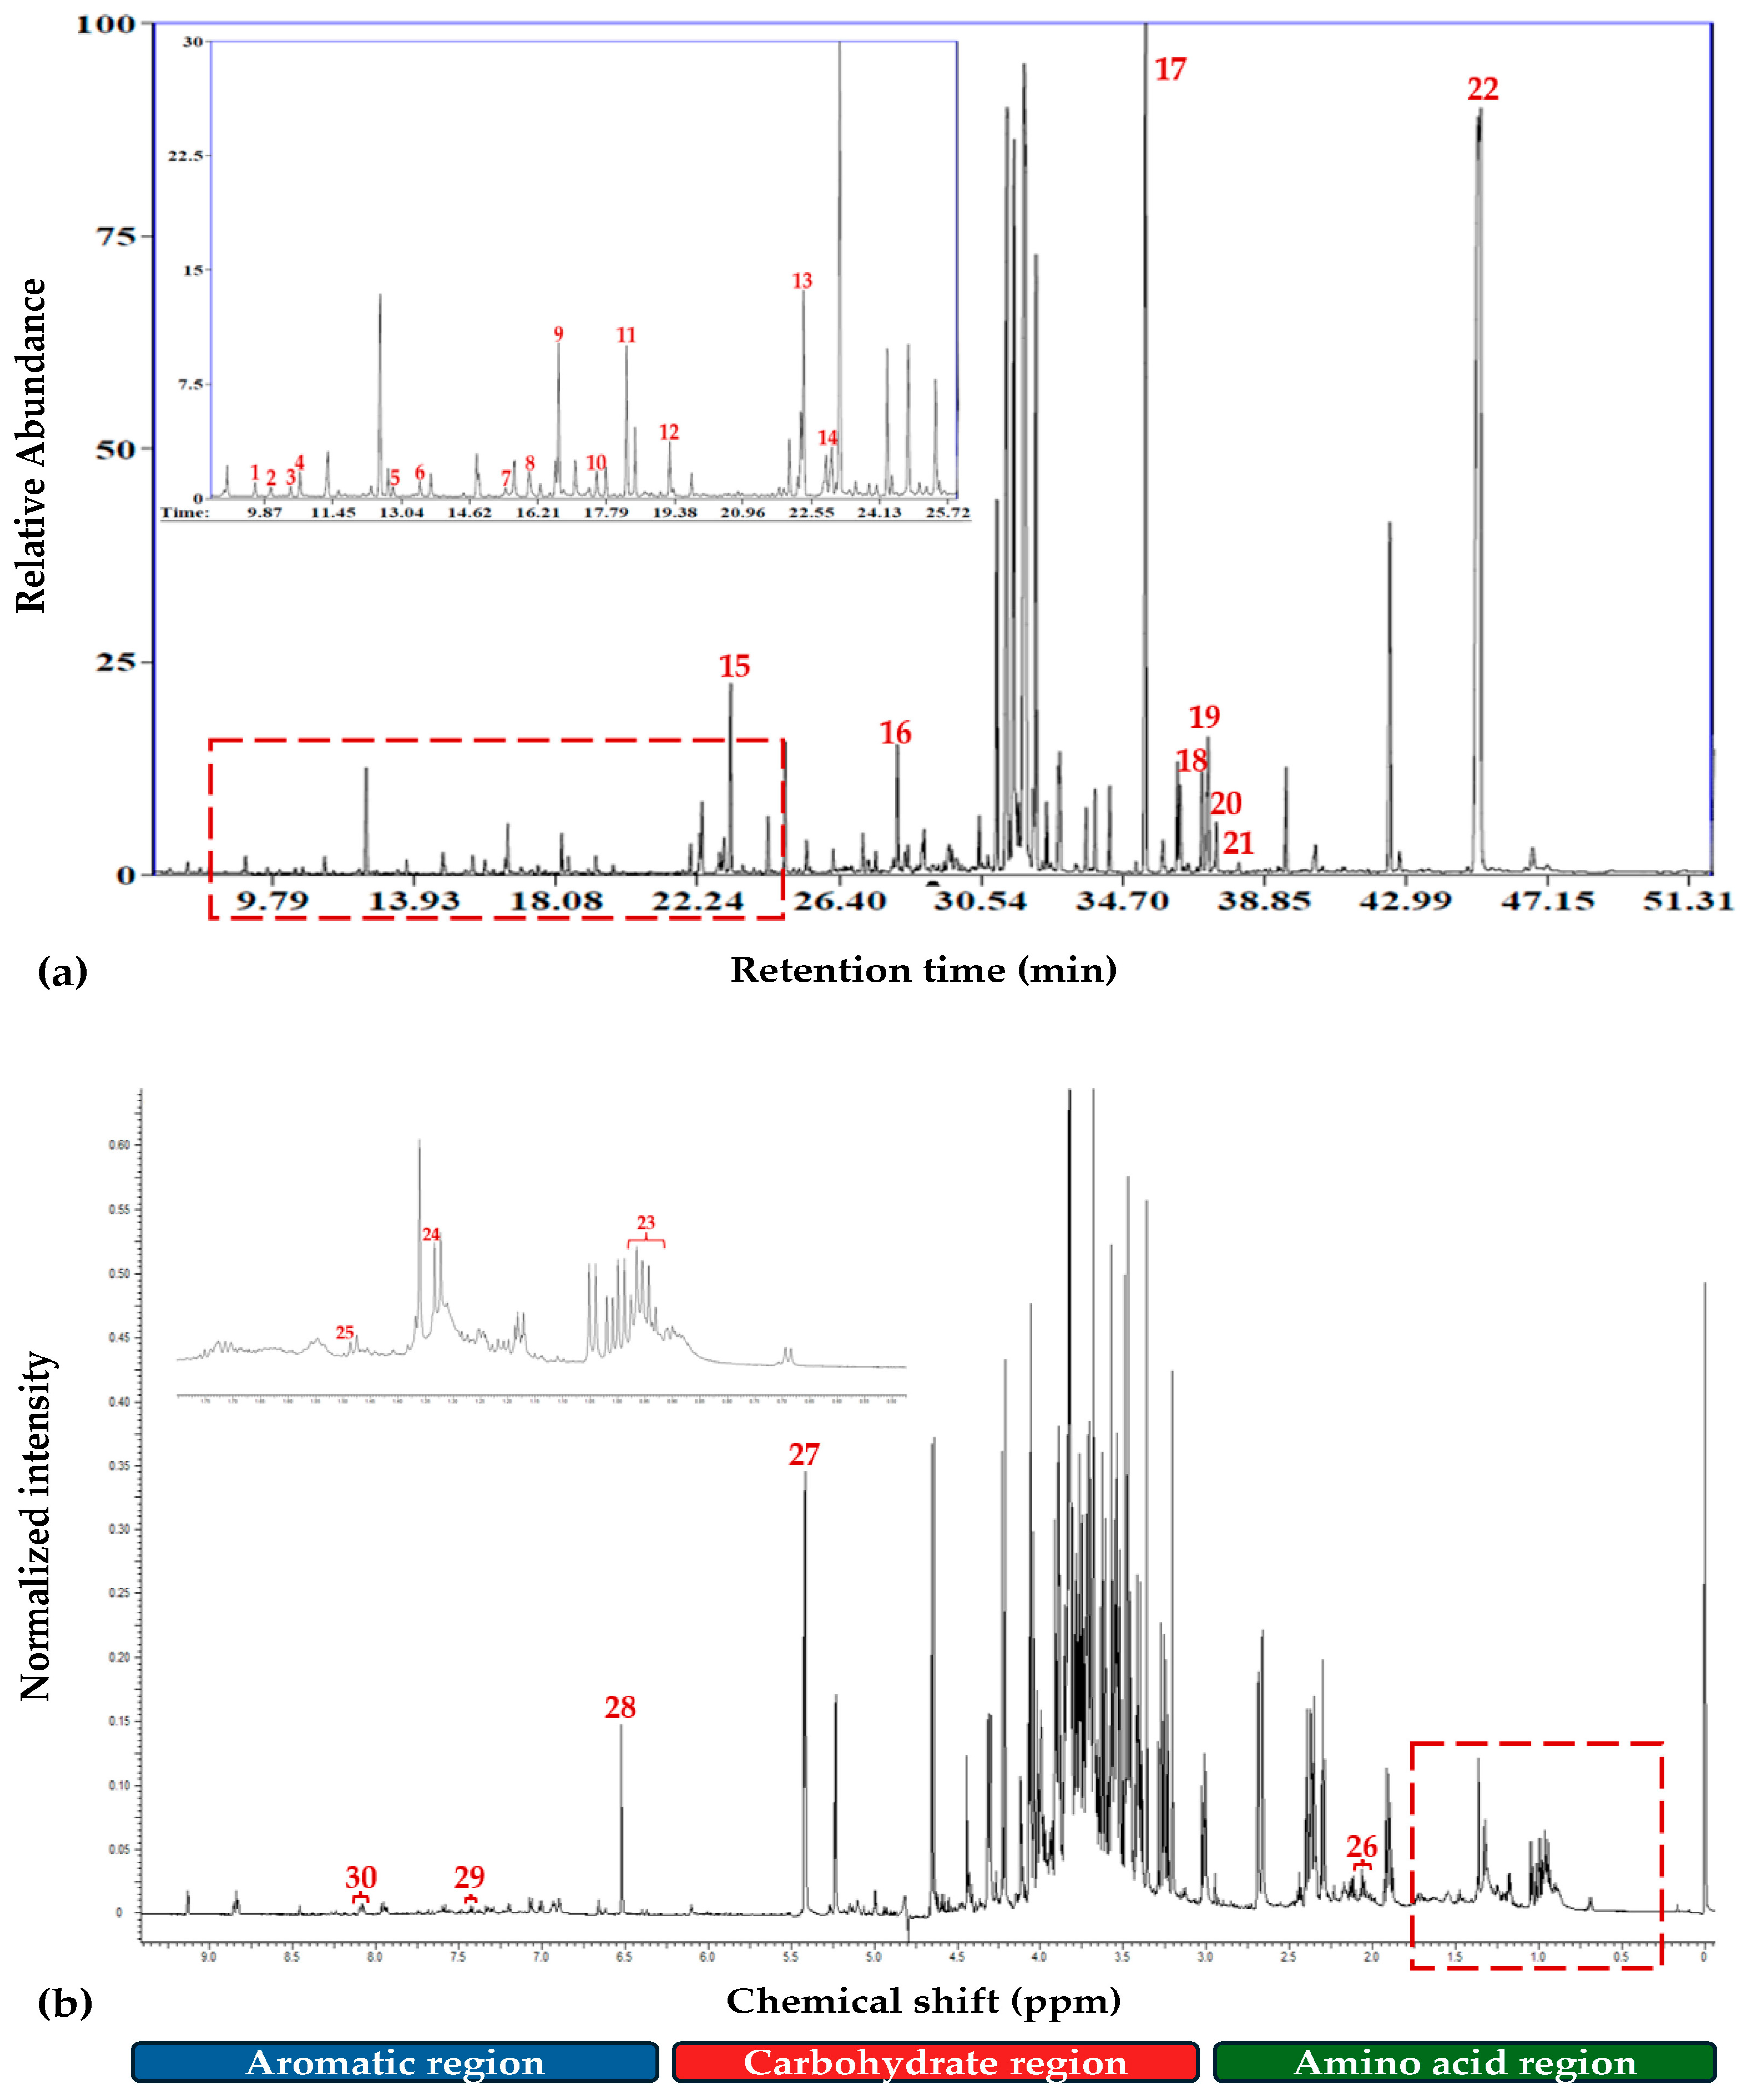
Figure 1. (a) Representative GC/EI/MS total ion chromatogram, and (b) Representative 1H NMR spectrum of Cannabis sativa L. leaf metabolite profiles. Magnification of the red dashed areas and annotations for representative metabolites are displayed. 1. Pyruvate; 2. Lactate; 3. L-Valine; 4. L-Alanine; 5. L-Leucine; 6. L-Isoleucine; 7. Benzoate; 8. Pipecolate; 9. Glycerol; 10. Succinate; 11. Glycerate; 12. Erythronate; 13. Malate; 14. D-Threitol; 15. GABA; 16. Ribitol (IS);17. Myo-Inositol; 18. Linoleate; 19. α-Linolenate; 20. Stearate; 21. Cannabidiol; 22. Sucrose; 23. Isoleucine: δ 0.91 ppm (t), δ 1.01 ppm (d)/Leucine: δ 0.95 ppm (d); 24. L-threonine: δ 1.34 ppm (d), δ 3.62 ppm (d), δ 4.28 ppm (m); 25. L-Alanine: δ 1.45 ppm (d); 26. Glutamate: δ 2.05 ppm (m), δ 2.33 ppm (m)/Pyroglutamate: δ 2.01 ppm (m), δ 2.50 ppm (m); 27. Sucrose: δ 3.48 ppm (t), δ 5.43 ppm (d); 28. Fumarate: δ 6.50 ppm (s); 29. L-Phenylalanine: δ 7.43 ppm (m); 30. Nicotinate: δ 8.25-(dt) (Multiplicity of 1H resonances: “s”, singlet; ‘’d”, doublet; “t”, triplet; “dt”, double of triplet, “m”, multiplet).
Agrochemicals 04 00016 g001
Figure 2. OPLS-DA PC1/PC2 score plots for the visualization of the effects of harpin and laminarin on the recorded GC/EI/MS and 1H NMR metabolite profiles of Cannabis sativa L. leaves applying orthogonal partial least squares-discriminant analysis (OPLS-DA). The metabolite profiles were recorded at two time points; T1 and T2. Score plots are displayed with 95% confidence interval. The ellipse represents the Hotelling’s T2. Left collumn: GC/EI/MS data; right collumn: 1H NMR data. (a) All treatments combined across T1 and T2; (b) Treatments at T1; (c) Treatments at T2.
Agrochemicals 04 00016 g002
Figure 3. Coefficient plots illustrating metabolite differences between untreated and treated plants across the two time points. Harpin-treated plants vs. untreated T1 (a) or vs. untreated T2 (b), and Laminarin-treated plants vs. untreated T1 (c) or vs. untreated T2 (d). Positive and negative CoeffCS values indicate higher and lower, respectively, metabolite relative content in the untreated plants compared to the treated ones.
Agrochemicals 04 00016 g003
Figure 4. Functional classification of signatory metabolites of Cannabis sativa L. leaves in response to harpin proteins and laminarin treatments at time point 1 (T1) and time point 2 (T2). Bars represent pathway instances categorized by functional groups. Each category includes four bars corresponding to treatment-time combinations: ht1 (harpin T1), ht2 (harpin T2), lt1 (laminarin T1), and lt2 (laminarin T2). The bars are color-coded as follows; red (higher content compared to the untreated), green (lower content compared to the untreated), and gray (no substantial change).
Agrochemicals 04 00016 g004
Figure 5. De novo constructed metabolite network of Cannabis sativa L. leaves, displaying the effect of harpin and laminarin application 24 h (time point 1, T1) and seven days (time point 2, T2) post-application. The fluctuations are presented via color-coded blocks, each representing a specific bioactive substance and time point. The color within each block indicates the fluctuation in the metabolites’ relative content in the treated versus the untreated plants. The color-coding is based on the means of scaled and centered Orthogonal Partial Least Squares (OPLS) regression coefficients (CoeffCS), reflecting the magnitude and direction of metabolic fluctuations. Solid lines represent one-step consecutive metabolic steps, while dashed lines indicate multi-step or incompletely elucidated pathway segments. The network was constructed using data retrieved from the Kyoto Encyclopedia of Genes and Genomes (KEGG, https://www.genome.jp/kegg/ (accessed on 7 August 2025)).
Agrochemicals 04 00016 g005
Figure 6. Relative abundances of key Cannabis sativa L. leaf metabolites and their fluctuations in response to harpin and laminarin application 24 h (T1) and seven days (T2) following treatments. Bars represent the mean ± standard deviation (SD) of the relative abundance of metabolites (C; control, H; harpin proteins, L; laminarin. Different letters (a, ab, b, bc, bcd, c, cd, d, de, e) above the bars denote statistically significant differences among treatments for each metabolite (Tukey’s HSD test, p < 0.05).
Agrochemicals 04 00016 g006
Table 1. Effect of harpin and laminarin treatments on Cannabis sativa L. global leaf metabolism at time point 1 (T1) and time point 2 (T2), displayed as instances of fluctuations of signatory metabolites in the corresponding biosynthetic pathways. Pathway instances indicate the involvement of metabolite in specific metabolic pathways. Note that a single metabolite may participate into multiple pathways. The distribution illustrates treatment and time-dependent shifts in metabolic network engagement following the application of the bioactives (ht1U: harpin, T1, upregulated; ht1D: harpin, T1, downregulated; ht1Nd: harpin, T1, no substantial difference; ht2U: harpin, T2, upregulated; ht2D: harpin, T2, downregulated; ht2Nd: harpin, T2, no substantial difference; lt1U: laminarin, T1, upregulated; lt1D: laminarin, T1, downregulated; lt1Nd: laminarin, T1, no substantial difference; lt2U: laminarin, T2, upregulated; lt2D: laminarin, T2, downregulated; lt2Nd: laminarin, T2, no substantial difference).
Biosynthetic Pathwayht1Uht1Dht1Ndht2Uht2Dht2Ndlt1Ult1Dlt1Ndlt2Ult2Dlt2NdFunction
map00400 Phenylalanine, tyrosine and tryptophan biosynthesis202130112211Amino acid metabolism
map00290 Valine leucine and isoleucine biosynthesis401041410041Amino acid metabolism
map00350 Tyrosine metabolism023140311311Amino acid metabolism
map00260 Glycine, serine and threonine metabolism231132231033Amino acid metabolism
map00360 Phenylalanine metabolism223151421520Amino acid metabolism
map00250 Alanine, aspartate and glutamate metabolism062080341431Amino acid metabolism
Varia Amino acid metabolism 512211538101577Amino acid metabolism
map00940 Phenylpropanoid biosynthesis204042411510Biosynthesis of other secondary metabolites
map00960 Tropane, piperidine and pyridine alkaloid biosynthesis321042330132Biosynthesis of other secondary metabolites
map00966 Glucosinolate biosynthesis501150312132Biosynthesis of other secondary metabolites
Varia Biosynthesis of other secondary metabolites317623803623Biosynthesis of other secondary metabolites
map00020 Citrate cycle (TCA cycle)041140311320Carbohydrate metabolism
map00630 Glyoxylate and dicarboxylate metabolism082262442532Carbohydrate metabolism
Varia Carbohydrate metabolism 612178415311180Carbohydrate metabolism
map01070 Biosynthesis of plant hormones332260431341Chemical structure transformation maps
map01064 Biosynthesis of alkaloids derived from ornithine, lysine and nicotinic acid281191461542Chemical structure transformation maps
map01061 Biosynthesis of phenylpropanoids345381822831Chemical structure transformation maps
map01063 Biosynthesis of alkaloids derived from shikimate pathway355382823742Chemical structure transformation maps
map01060 Biosynthesis of plant secondary metabolites4774122783585Chemical structure transformation maps
Varia Sum Energy metabolism 252270531342Energy metabolism
map01220 Degradation of aromatic compounds213132600321Global and overview maps
map01200 Carbon metabolism043151322232Global and overview maps
map01210 2-Oxocarboxylic acid metabolism533191533353Global and overview maps
map01230 Biosynthesis of amino acids7451141763484Global and overview maps
map00061 Fatty acid biosynthesis022301121400Lipid metabolism
map01040 Biosynthesis of unsaturated fatty acids321420330321Lipid metabolism
Varia Sum Lipid metabolism 545662851671Lipid metabolism
map02010 ABC transporters1261414111806103Membrane transport
map00760 Nicotinate and nicotinamide metabolism250061430232Metabolism of cofactors and vitamins
Varia Metabolism of cofactors and vitamins223061133232Metabolism of cofactors and vitamins
Varia Metabolism of other amino acids 012030300120Metabolism of other amino acids
map00410 beta-Alanine metabolism031031031022Metabolism of other amino acids
map00480 Glutathione metabolism040031040211Metabolism of other amino acids
map00460 Cyanoamino acid metabolism321060231132Metabolism of other amino acids
Varia Nucleotide metabolism 212230131122Nucleotide metabolism
Varia Signal transduction521431710431Signal transduction
map00970 Aminoacyl-tRNA biosynthesis7321110462264Translation
TOTAL MAPS INSTANCES13419312788293732391496618817888
Disclaimer/Publisher’s Note: The statements, opinions and data contained in all publications are solely those of the individual author(s) and contributor(s) and not of MDPI and/or the editor(s). MDPI and/or the editor(s) disclaim responsibility for any injury to people or property resulting from any ideas, methods, instructions or products referred to in the content.