Article

Deep Learning-Based Molecular Generation for Lung Cancer Therapeutics

by
Mohavia Ben Amid Sinon
* and
Uche A. K. Chude-Okonkwo
Institute for Artificial Intelligent Systems, University of Johannesburg, Johannesburg 2006, South Africa
*
Author to whom correspondence should be addressed.
Drugs Drug Candidates 2026, 5(3), 48; https://doi.org/10.3390/ddc5030048 (registering DOI)
Submission received: 7 May 2026 / Revised: 17 August 2026 / Accepted: 19 August 2026 / Published: 26 August 2026
(This article belongs to the Section In Silico Approaches in Drug Discovery)

Abstract

Background: The leading cause of cancer-related deaths globally is lung cancer, and the P2X7 receptor (P2X7R) is a promising therapeutic target due to its role in the disease progression. Methods: A deep learning-based molecular generation framework that integrates a fragment-based drug method with Relational Graph Convolutional Networks (RGCNs) and a Wasserstein Generative Adversarial Network (WGAN) was employed. Known P2X7R targeting drugs were fragmented to construct a fragment library, which was used to generate new candidate molecules. The generated molecules from the model were evaluated for chemical validity, novelty, Lipinski’s Rule of Five compliance, quantitative estimate of drug-likeness (QED), lipophilicity (LogP), similarity using the Tanimoto coefficient, and binding affinity through molecular docking. Results: The model generated 4498 chemically valid molecules, including 968 unique and 384 novel molecules. Approximately 97% satisfied standard drug-likeness criteria, with QED values predominantly above 0.6 and LogP values within acceptable pharmacokinetic ranges. The novel molecules demonstrated an improved docking score against P2X7R compared to the seed molecules. Conclusions: Despite training on 5000 SMILES due to limited computational resources, the model achieved high validity, strong molecular diversity, and drug-like physicochemical properties, demonstrating the feasibility of a scalable, target-specific AI pipeline for lung cancer drug discovery using fragment-based molecular generation, RGCN and WGAN. Nevertheless, the biological activity of the generated molecules remains experimentally unvalidated, and the findings are based solely on computational analyses.

1. Introduction

1.1. Background and Research Motivation

Cancer is driven by genetic and epigenetic alterations that enable uncontrolled cell proliferation, evasion of immune surveillance, and, in advanced stages, invasion and metastasis. In 2022, the new cases of cancer were around 20 million and caused around 9.7 million deaths; both incidence and mortality are predicted to continue to climb [1]. Lung cancer remains the most common cause of cancer-related fatalities worldwide, causing almost 18% of all cancer deaths [2,3].
The P2X7 receptor (P2X7R) is a significant purinergic ion channel that has attracted attention as a therapeutic target due to its role in inflammatory signalling and tumour biology. Pharmacological studies have demonstrated that P2X7R antagonists can affect receptor function through distinct allosteric binding mechanisms, highlighting their potential as therapeutic targets in disease pathways [4,5]. Recent studies have identified the P2X7 receptor (P2X7R) as a critical regulator of lung cancer progression, where its overexpression in non-small cell lung cancer (NSCLC) promotes tumour growth, invasion, and metastasis. Inhibition of P2X7R has been shown to significantly reduce tumour aggressiveness, positioning it as a promising therapeutic target for non-small cell lung cancer [6,7]. Experimental cancer models indicate a reduction in tumour development following receptor antagonism [8]. Overall, these findings support P2X7R as a biologically relevant and promising therapeutic target, supporting its use in computational drug discovery for this study. Traditional drug discovery for cancer is lengthy, costly, and inefficient, often taking more than a decade and costing millions to billions of dollars to bring a new drug to market [9,10].
In recent years, machine learning-based drug discovery has been rising as it significantly reduces time, financial expenditure, and labour costs associated with the development of novel pharmaceuticals [11,12,13]. Variational Autoencoders (VAEs) [14], Generative Adversarial Networks (GANs) [15,16], and stable diffusion models [17] have facilitated data-driven molecular generation and synthesis of molecular structures. The molecular structures are usually in simplified molecular input line entry system (SMILES) [18], self-referencing embedded strings (SELFIES) [19] or molecular graphs [20].
The progress in AI and deep generative models, including VAEs and GANs, has accelerated de novo molecular design; however, these models frequently encounter issues such as training instability, mode collapse, and the production of chemically invalid or therapeutically irrelevant molecules [21,22]. The Wasserstein Generative Adversarial Network (WGAN) presents a viable alternative by substituting the Jensen–Shannon divergence with the Wasserstein distance, thus enhancing training stability, gradient smoothness, and molecular diversity [23,24]. When integrated with a Relational Graph Convolutional Network (RGCN), as evidenced by recent research including MedGAN [25] and MolGAN [21], WGAN can proficiently represent complex molecular architectures, maintaining chemical validity while optimising for drug-likeness, novelty, and synthesizability.
Despite the advancement of generative models, a significant need exists in the implementation of domain-adapted WGAN models for lung cancer drug discovery, which can generate valid, unique, and bioactive molecules optimised for pharmacokinetic and pharmacodynamic characteristics. Bridging this gap could significantly expedite the development of novel and efficacious treatments for lung cancer targeting the P2X7R.
This study addresses this gap by developing and evaluating a fragment-based molecular generation framework that integrates WGAN with RGCN for the discovery of novel, bioactive molecules targeting the P2X7R in lung cancer therapeutics. The generated molecules from the proposed model targeting the P2X7R, novelty, validity and interpretability will be evaluated.

1.2. Related Work

Lung cancer accounts for numerous cancer-related deaths in the world [2,3]. Despite the advances in oncology and the development of targeted therapies, the search for new anti-cancer drugs is slow, costly, and unpredictable [9,10].
Recent advancements in AI enable de novo molecular generation, designing novel chemical molecules with desirable biological and pharmacological properties, thus accelerating early-stage drug design and reducing research costs [1,11,12,13]. Ref. [1] asserts that AI-driven models are progressively used to interpret extensive biological datasets, discover possible drug targets, and devise novel molecules with improved efficacy and safety. Traditional computational techniques such as molecular docking and quantitative structure–activity relationship (QSAR) modelling have been augmented by data-driven deep learning models, which enable generative design of molecules [26,27].
The VAE, presented by [28], was a significant advancement in molecular generative modelling. It encodes chemical representations, such as SMILES strings, into a latent space and subsequently decodes them into novel, syntactically valid molecules. Recent developments, like GxVAE [14], have shown that VAEs may produce molecules based on gene expression data, rendering them appropriate for disease-specific drug discovery. Nonetheless, VAEs frequently generate molecules that are less diverse and less chemically plausible than those produced by GANs [29].
GANs, introduced by [15], have significantly improved molecular generation quality. GANs consist of a generator and a discriminator trained in opposition to produce realistic outputs. Early models, such as MolGAN [21], represented molecules as graphs, demonstrating the potential of GANs for generating small molecules. Later developments, such as MedGAN [25], integrated GCN with a GAN to better capture molecular topology and improve chemical validity.
Despite their success, traditional GANs face challenges such as training instability, mode collapse, and chemical invalidity [22]. The introduction of the WGAN by [23] and its improved version with gradient penalty [24] addressed these issues by optimizing the Earth Mover (Wasserstein) distance, leading to more stable and diverse molecular generation.
Graph learning methods, particularly Graph Neural Networks (GNNs) and RGCNs, enable direct manipulation of molecular graphs. As shown by [30], these methods capture atom-level interactions and topological features critical to biological function. Integrating R-GCN within WGANs, as demonstrated in MedGAN [25], enhances molecular validity and structural consistency. A recent study highlights fragment-based molecular creation, which constructs molecules using chemically valid fragments instead of individual atoms. This methodology, as demonstrated by [31], enhances chemical interpretability, synthetic accessibility, and pharmacophoric significance for target-specific drug development.
AI-based methods have shown promise in finding new chemicals, predicting how medications will work, and using existing drugs in novel techniques for lung cancer [1]. The P2X7 receptor has recently been identified as a potential therapeutic target owing to its pivotal involvement in ATP-mediated tumour growth, inflammation, and metastasis [6,7,32]. Computational tools that combine deep generative modelling, fragment-based techniques, and graph learning can help researchers find molecules that target P2X7R. This is a potential route for precision lung cancer treatments.

2. Results and Discussion

2.1. Training Dataset

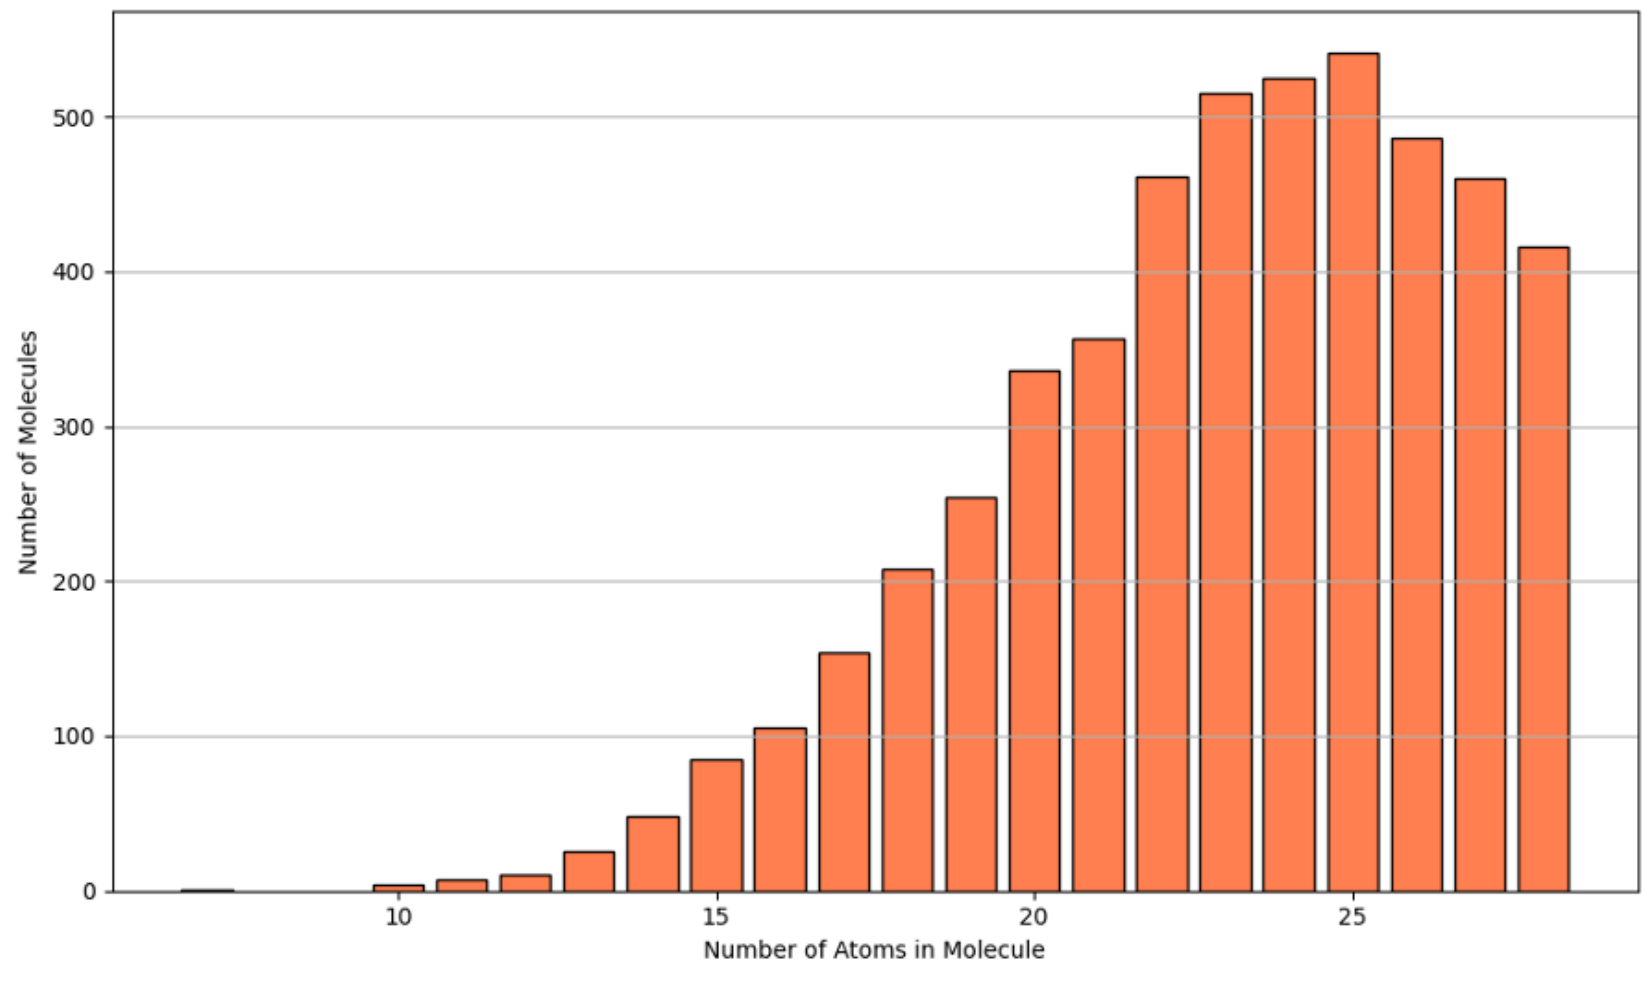
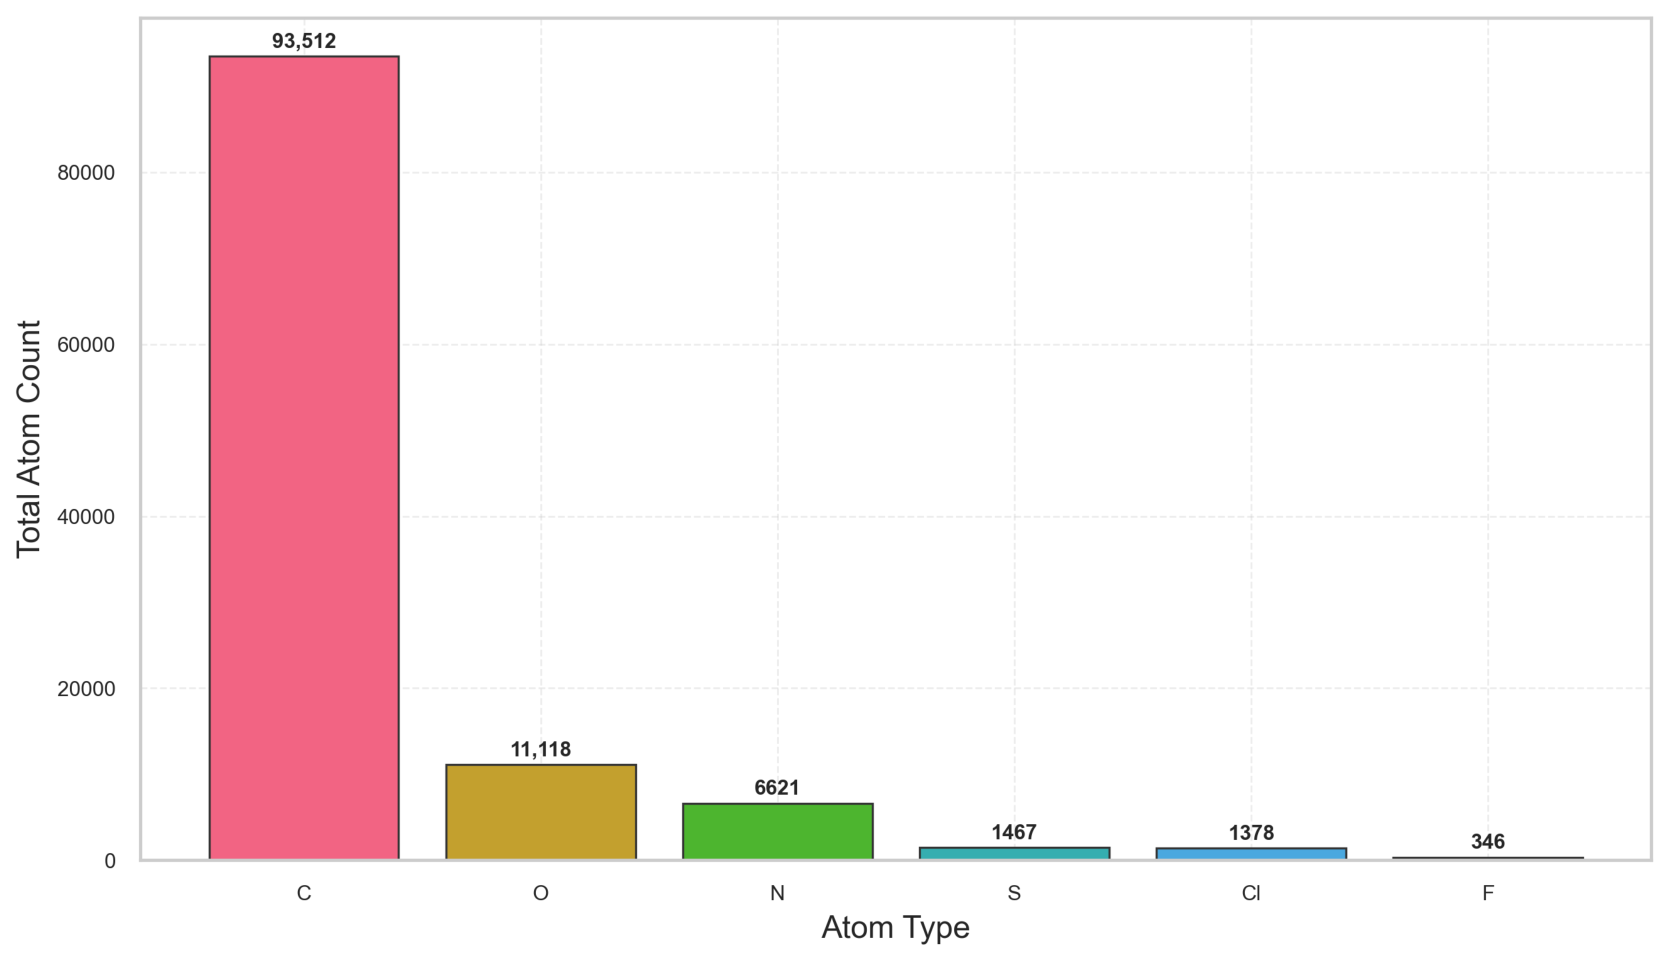
The initial dataset consisted of nine seed drug molecules known to interact with the P2X7 receptor, retrieved from ChEMBL and DrugBank. Using the RDKit version 2024.3.4 python package, the molecules were fragmented, and, subsequently, a total of 100,000 new SMILES strings were generated. A total of 5000 SMILES were randomly selected from the fragmented generated molecule dataset for this study. The data exhibited six atomic types: C, N, O, S, F, and Cl, consistent with typical organic drug-like molecules. The molecular size distribution (7 to 28 heavy atoms) and atom frequency profile (with carbon dominating at 93,512 occurrences) confirmed that the dataset adequately represented the chemical space relevant to drug-like molecules. The 5000 new SMILES strings were used to train and generate new molecules using RGCN with WGAN at 500 epochs.

2.2. Graph Representation Learning and Molecular Generation

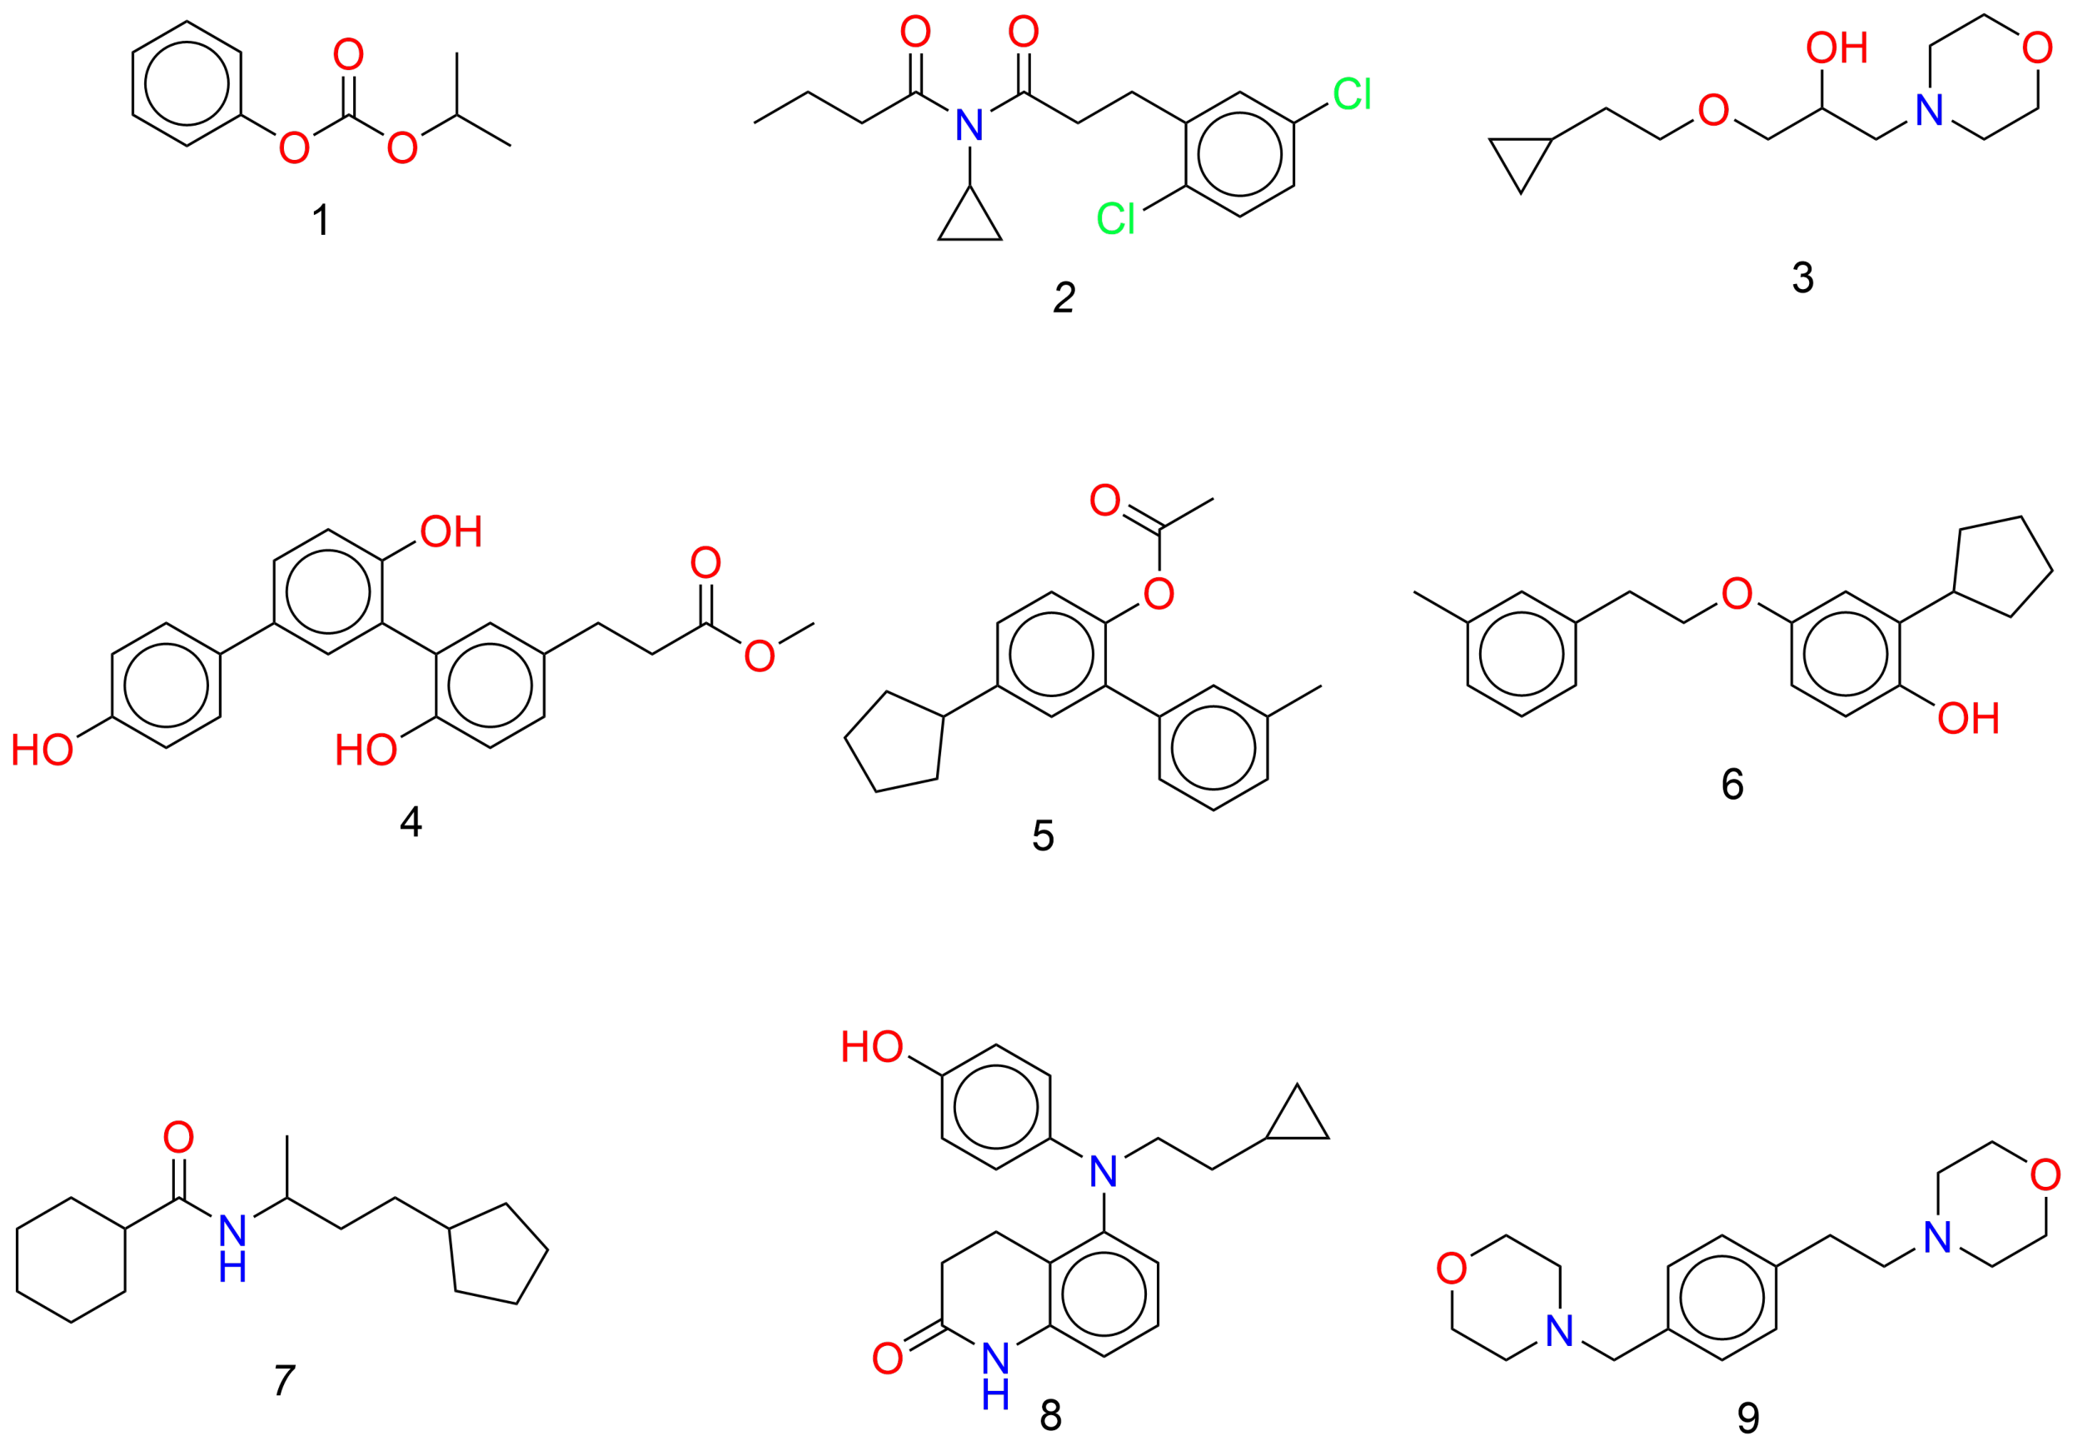
Each molecule was represented as a graph with atoms as nodes and bonds as edges, encoded via a node feature matrix and adjacency tensor. The RGCN learned embeddings that preserved chemical relationships and improved structural interpretability. These embeddings were used by a WGAN to generate novel molecular graphs. The WGAN was trained on 500 epochs with the generator producing diverse, chemically valid molecules. The model generated 4498 valid molecules, including 968 unique and 384 novel molecules. These results show a generation performance of 90% valid molecules, 21.5% unique, and 62.5% novel and chemically valid molecules as shown in Table 1. The random molecular representation of nine of the novel molecules is represented in Figure 1. Overall, the RGCN and WGAN framework effectively captured the molecular structure and enabled the generation of drug-like molecules.

2.3. Generated Molecules Analysis

2.3.1. Atomic Composition and Molecular Size Distribution

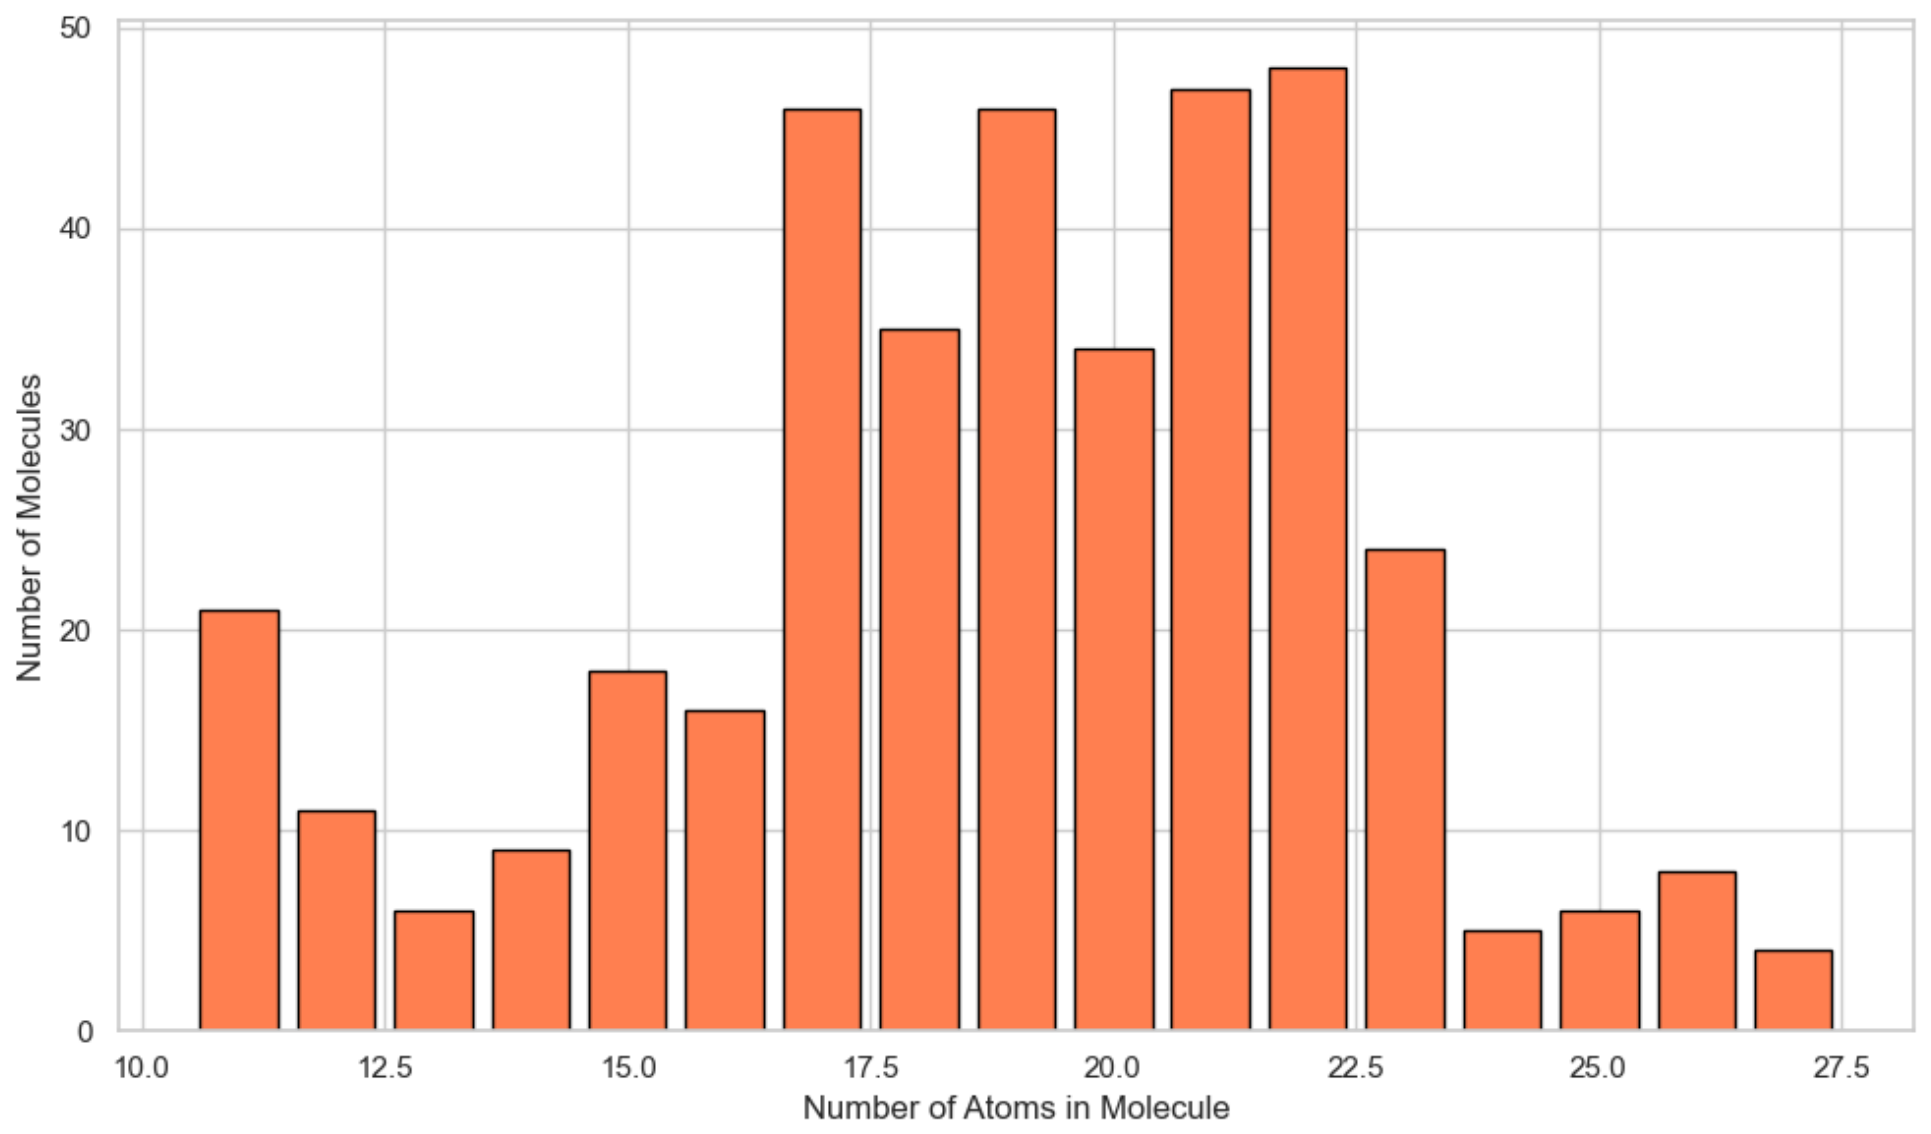
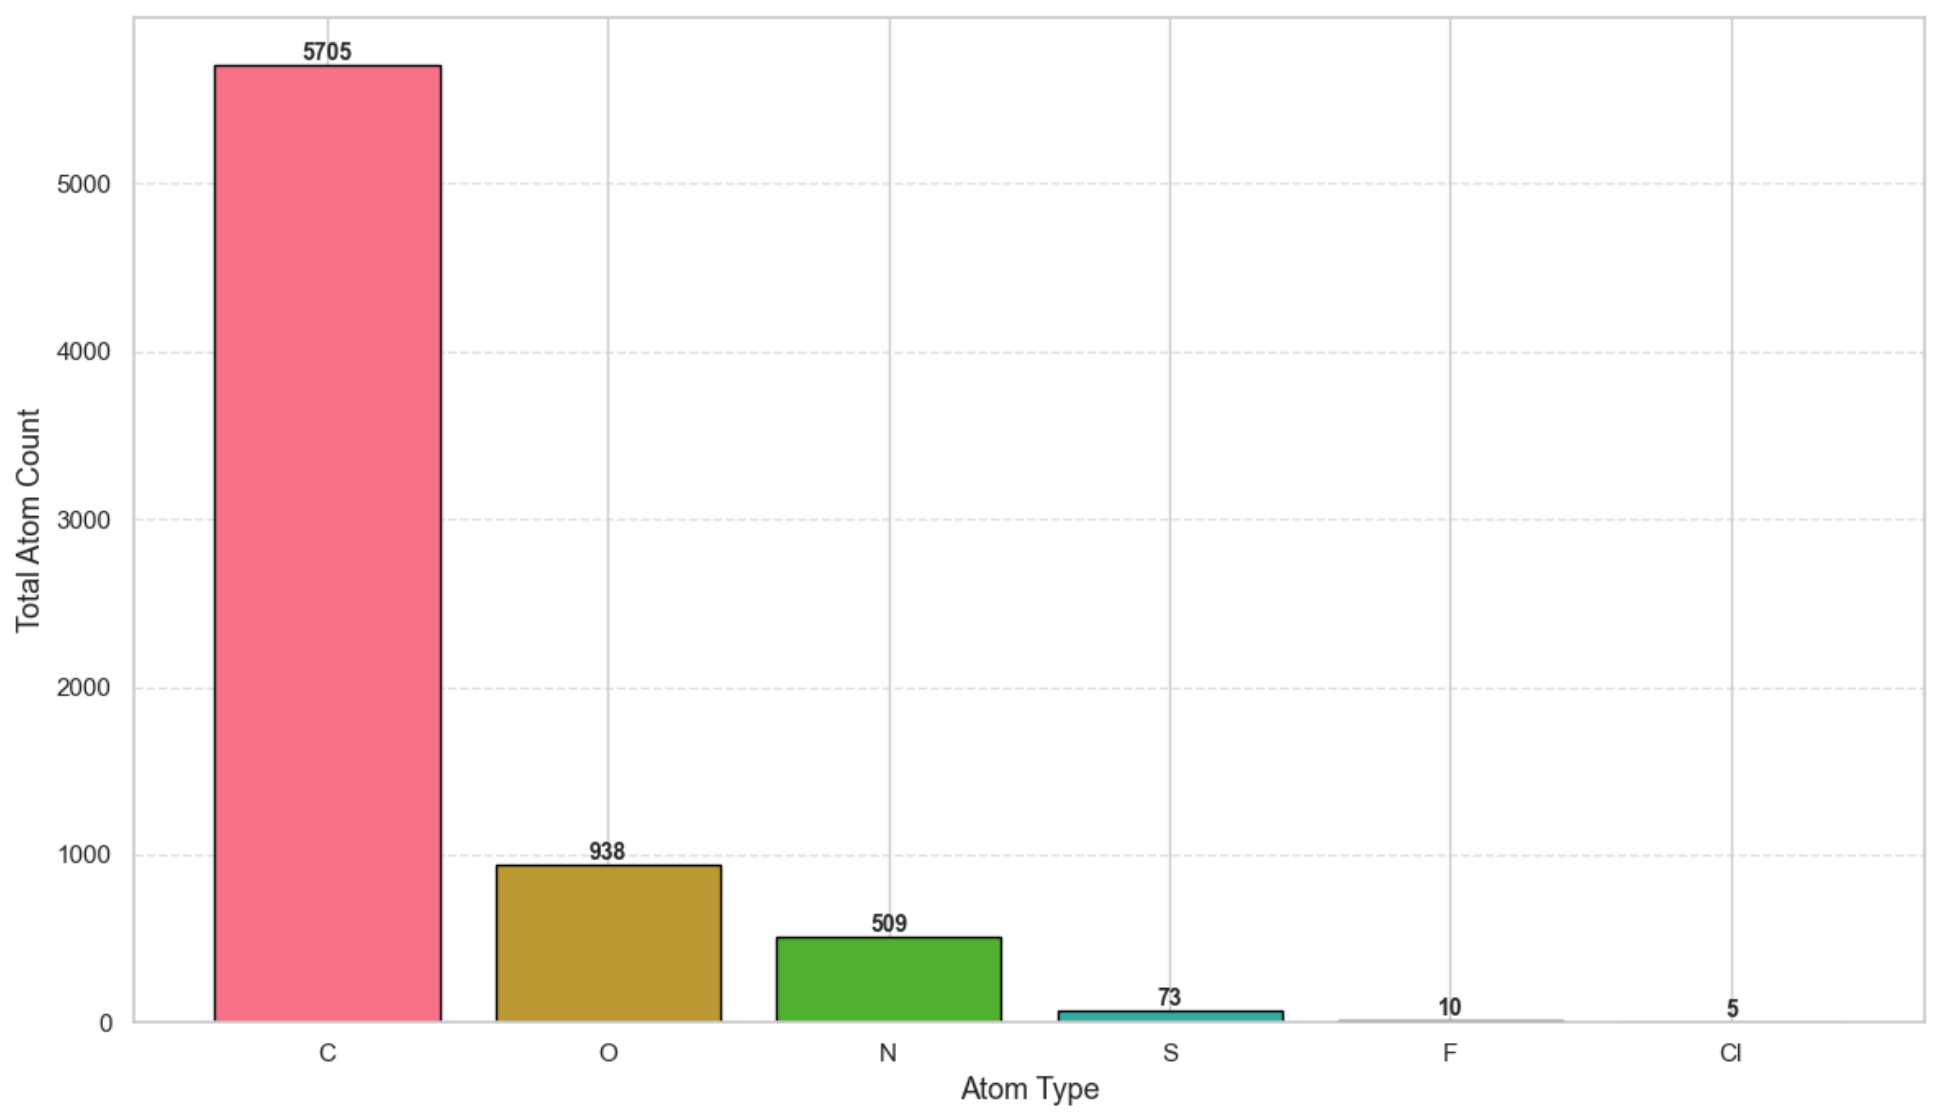
A total of 4498 valid molecules were generated, among which 384 were novel as shown in Table 1. The molecules generated varied in size, containing between 11 and 27 atoms, as illustrated in Figure 2, which presents the atom count distribution per molecule. The molecules comprised the following atomic elements: C, S, Cl, O, F, N, and the frequency of each atom type is shown in Figure 3. It is important to note that hydrogen atoms were excluded from these counts.The variation in the sizes of the generated molecules is mainly due to the small seed dataset used to generate 100,000 molecules through a fragment-based method, as well as the subsequent reduction of this dataset to 5000 SMILES for model training due to limited computational resources.

2.3.2. LogP and QED

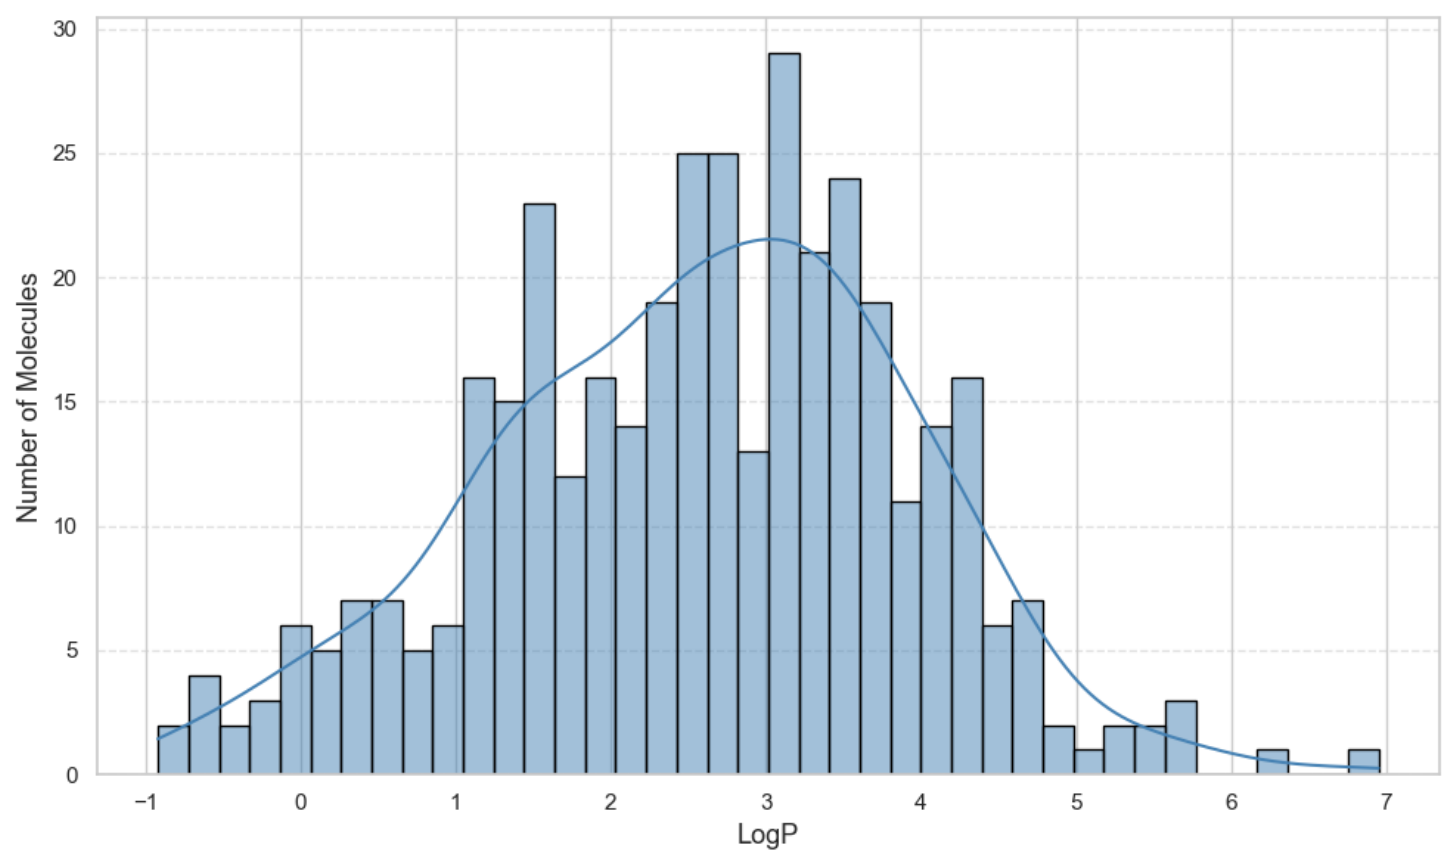
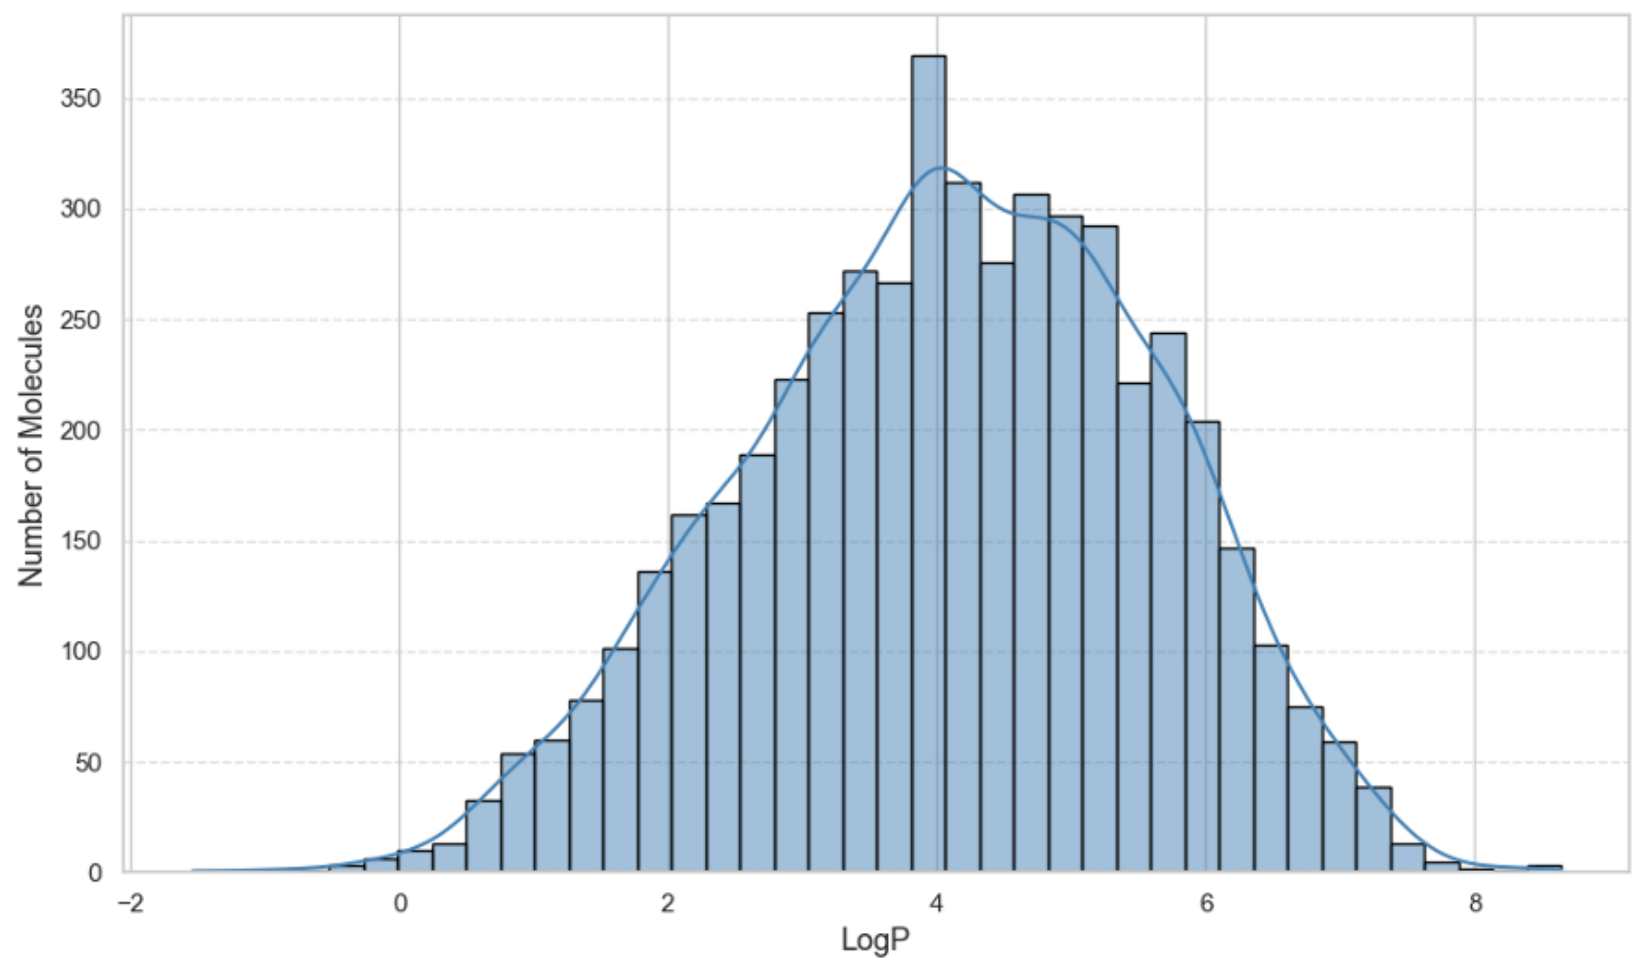
LogP, a critical parameter for assessing membrane permeability and a major factor in overall QED, was first analysed. Figure 4 presents a histogram with near-Gaussian distribution centred between LogP values of 2.5 and 3.5, ranging from approximately −1 to 7. This distribution indicates a propensity towards moderate to high lipophilicity, with the majority of molecules meeting the LogP ≤ 5 criterion for Ro5 compliance, a desirable characteristic for passive absorption [33].
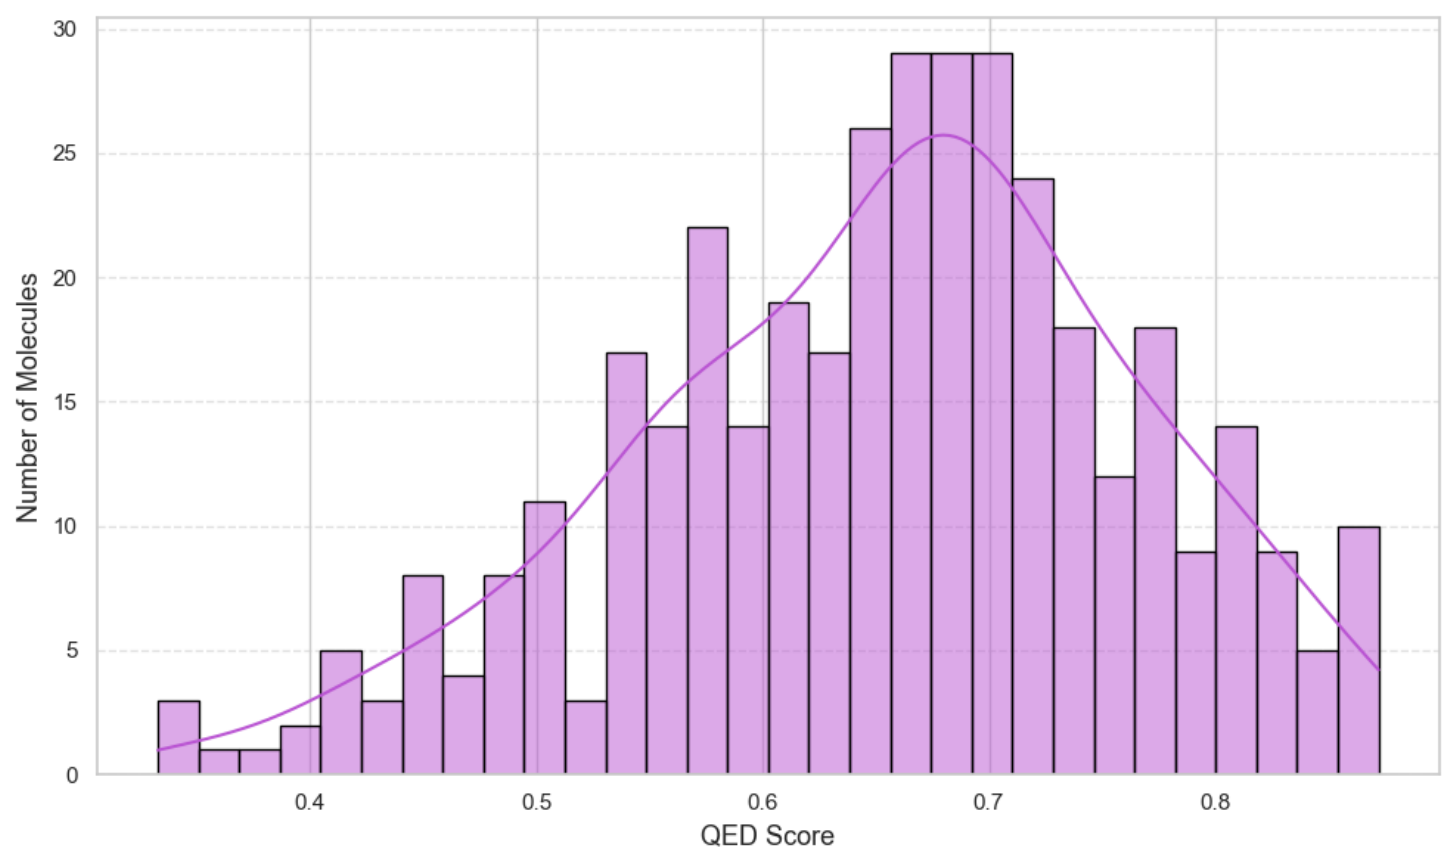
The QED score was calculated to quantify the overall desirability of the molecular set as a single metric. The distribution of QED scores in Figure 5 reveals a strongly favourable profile, heavily skewed towards the high end of the scale. The primary mode is concentrated between 0.60 and 0.75, with the bulk of the molecular set achieving QED scores greater than 0.6.
The high concentration of QED signifies that the molecular library successfully adheres to a calculated balance of properties considered optimal for clinical candidates. This result is a strong validation of the quality of the dataset and suggests that the generation method or the source criteria effectively prioritise molecules with high overall predicted druggability. The slight distribution tail towards lower QED values provides a small subset of molecules with less optimal, yet still relevant, profiles for further study.
These results are particularly relevant for molecules targeting membrane proteins such as the P2X7 receptor. Moderate lipophilicity (LogP between 2 and 5) facilitates membrane permeability, which is essential for molecules that must interact with transmembrane binding sites. Therefore, the observed LogP distribution suggests that a significant proportion of the generated molecules possess physicochemical properties compatible with effective interaction with membrane-bound receptors such as P2X7R.
Similarly, the high QED values indicate that the generated molecules maintain a balance of physicochemical properties associated with successful drug candidates. This suggests that the generative framework was able to learn the structural characteristics of drug-like molecules from the training dataset.

2.3.3. Drug-Likeness Test Results

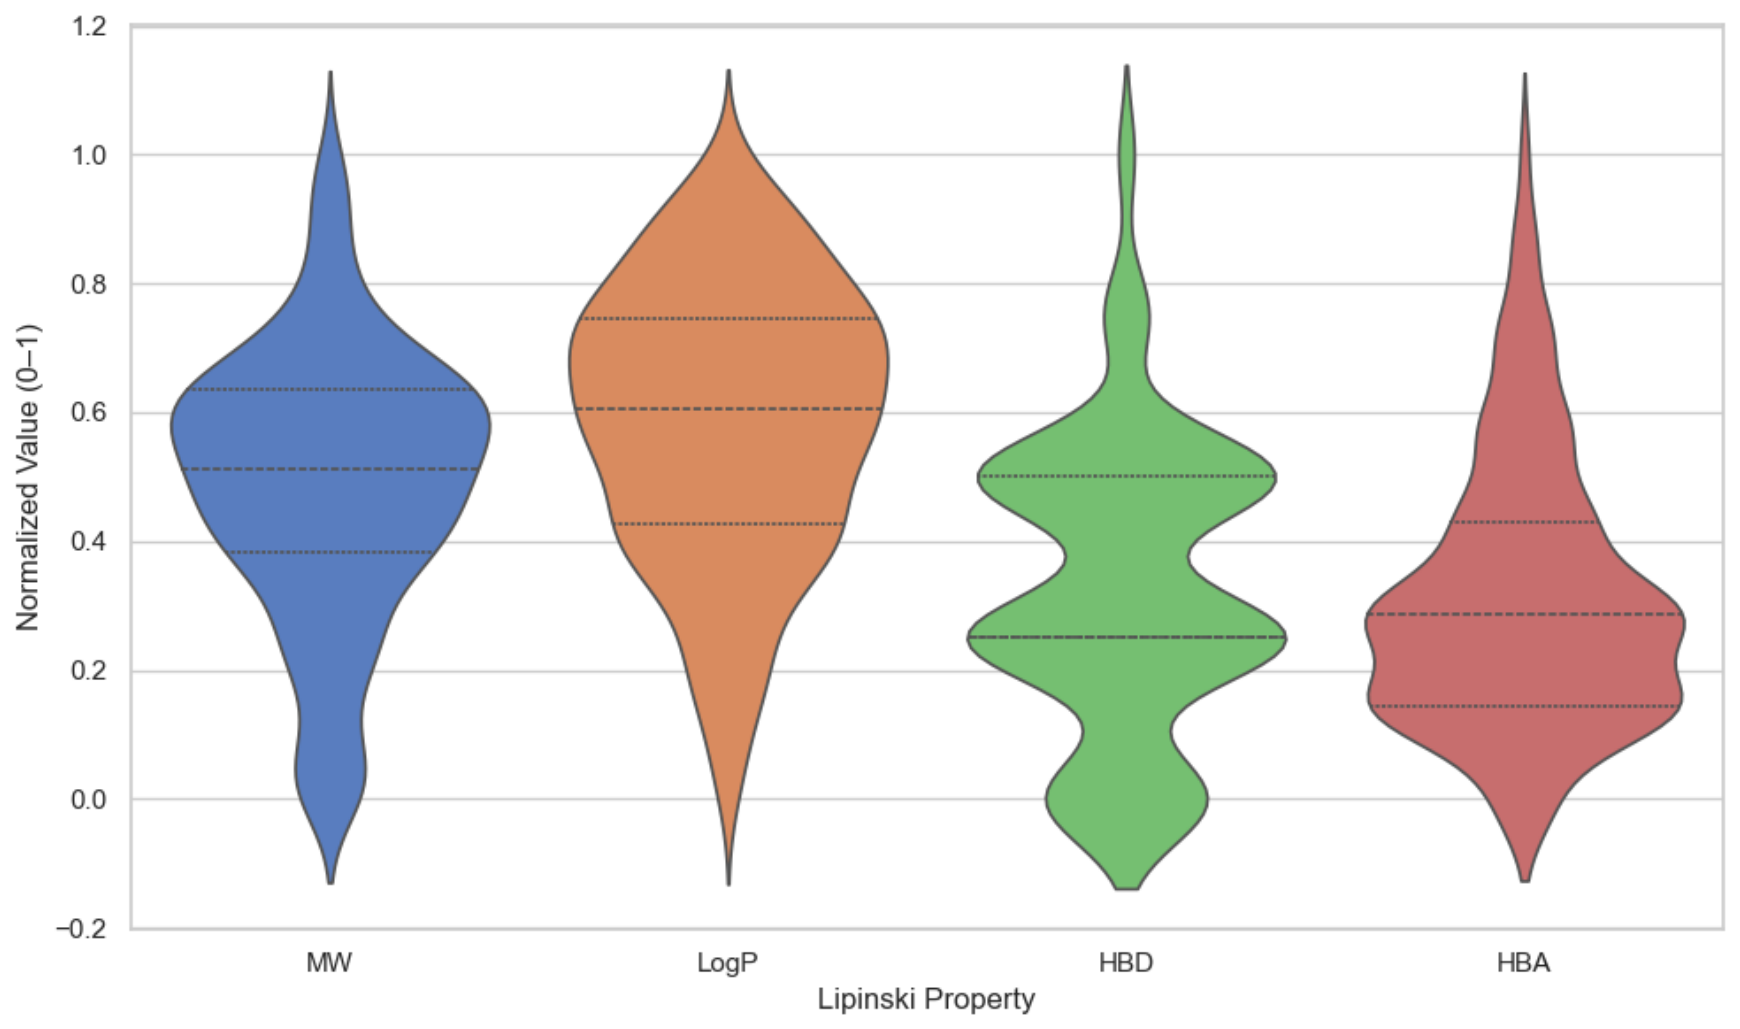
The 384 novel molecules were tested for Drug-likeness using Lipinski’s rule. Quantitatively, 97% of the dataset (374 out of 384 novel molecules) were found to be compliant with Lipinski’s Rule of Five, further confirming the strong predicted oral bioavailability profile. Analysis of the individual criteria shows that no violations were observed for molecular weight (≤500 Da), hydrogen bond donors (≤5), or hydrogen bond acceptors (≤10). The only violations occurred for the LogP criterion, where 10 molecules exceeded the recommended threshold of LogP ≤ 5. Figure 6 illustrates the normalised values of the Ro5 characteristics, specifically molecular weight (MW), LogP, hydrogen donor (HD), and hydrogen acceptor (HA). Overall, the physicochemical profiles suggest that the dataset represents a collection of drug-like small molecules with favourable properties for oral drug development; however, Lipinski’s Rule of Five compliance is only indicative and does not guarantee oral bioavailability.

2.3.4. Comparison Between Seed and Generated Molecules

The characteristics of the seed molecules were evaluated and compared with those of the generated molecules. The comparison focused on LogP, quantitative estimate of drug-likeness (QED), molecular size (number of atoms), and compliance with Lipinski’s Rule of Five (Ro5). The results presented in Table 2 indicate that the generated molecules exhibit physicochemical characteristics comparable to those of the seed molecules while also expanding the explored chemical space.
In particular, the generated molecules show slightly higher lipophilicity and improved QED scores, suggesting a stronger balance of drug-like properties. Although the generated molecules tend to be smaller in size than the seed molecules, they remain within the typical range for small-molecule ligands targeting membrane receptors such as P2X7R.
Overall, the comparison suggests that the proposed model successfully generated molecules that retain key drug-like characteristics of the seed molecules while improving certain properties such as overall drug-likeness and structural diversity.

2.3.5. Similarity Test Results

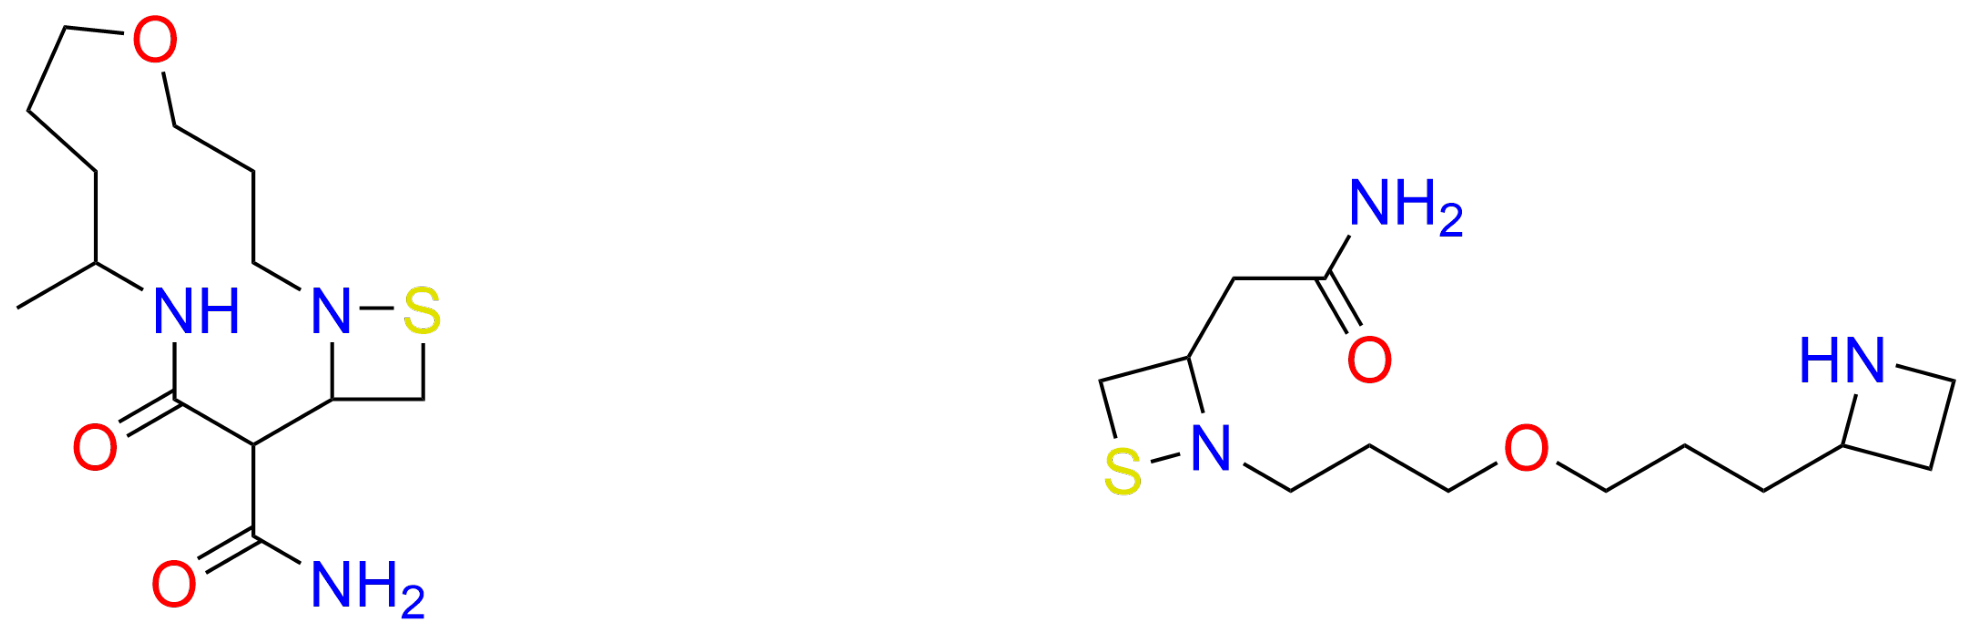
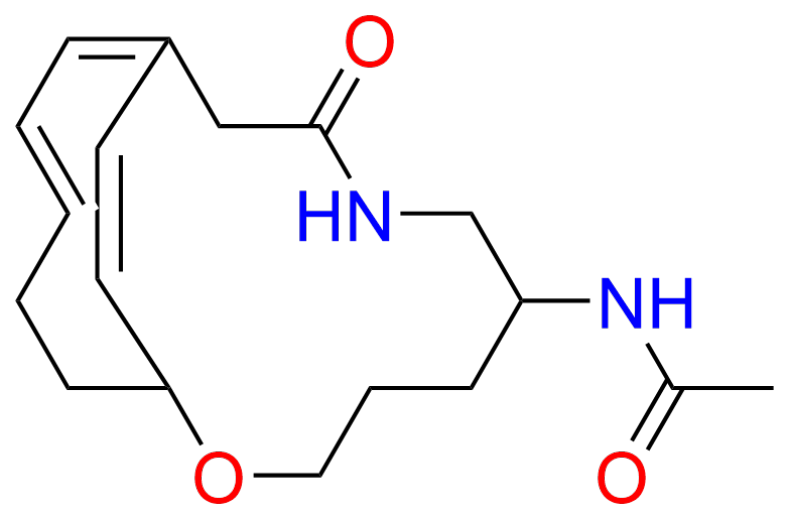
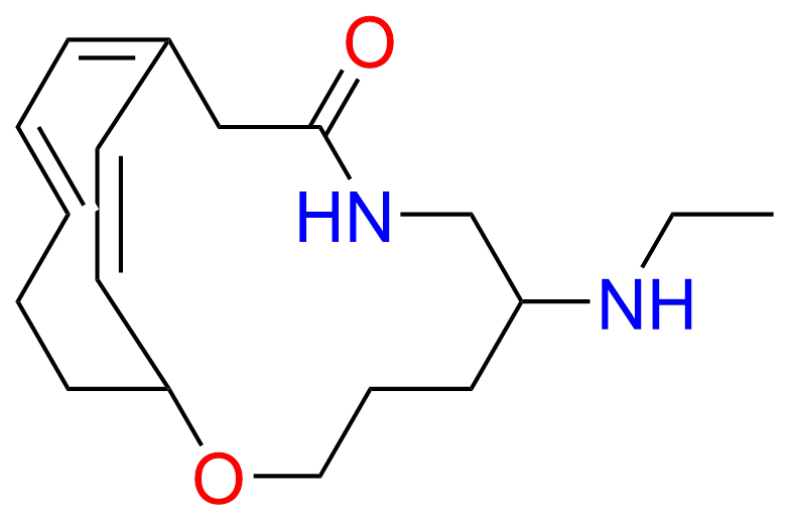
The ideal Tanimoto similarity score should be ≥0.65; however, our highest score is only 0.62 relative to the seed data molecules. This result indicates that the generated molecules exhibit moderate structural similarity to the seed data molecules. This outcome may indicate that the model is exploring novel regions of chemical space while remaining partially anchored to the seed data molecules. In de novo drug design, such moderate similarity can be interpreted as a trade-off between novelty and structural conservation, where lower similarity values may reflect increased molecular diversity. This might also be due to the model being trained on just 5000 SMILES from the 100,000 generated fragmented molecules. This limited training set may cause the model to lack adequate structural diversity, resulting in lower Tanimoto scores even when generated molecules remain structurally similar to the seeds. Despite the score not reaching the ideal Tanimoto similarity threshold, the generated molecules show sufficient diversity, a key indicator of chemical novelty. Two molecules with the highest Tanimoto are represented in Figure 7. The Tanimoto similarity results for all novel molecules with similarity scores greater than or equal to 0.50 are summarised in Table 3.

2.3.6. Molecular Docking Scores

After performing the Tanimoto similarity test between the novel molecules and the seed molecules, twenty-seven novel molecules with the highest Tanimoto scores were selected, along with the six seed molecules to which they showed the highest similarity, for docking against P2X7R. This criterion ensures that the evaluated molecules retain partial structural correspondence to known P2X7R active molecules while still exhibiting novelty. This approach was adopted to prioritise molecules most likely to occupy relevant binding regions of the receptor.
In molecular docking studies, increasingly negative binding scores are indicative of stronger and more favourable binding interactions. Analysis of the docking results obtained from PyRx of the selected molecules revealed that all the molecules exhibited negative binding affinity scores. The novel molecule C20 exhibited the highest binding score, with a value of −8.1 as shown in Table 4 and Table 5, indicating the strongest predicted binding affinity among the evaluated molecules. Conversely, novel molecules C17 and C24 showed the lowest binding scores, both with values of −4.7. Among the six seed molecules, S1 demonstrated the strongest binding score of −9.0, while S2 exhibited the weakest binding score of −6.6. These results indicate that, although some generated molecules showed favourable binding interactions with the P2X7 receptor, the seed molecules generally demonstrated stronger predicted binding affinity compared with the generated molecules.
The docking scores for the generated molecules with the highest Tanimoto similarity scores are shown in Table 4, while Table 6 presents the docking scores for the seed molecules that exhibited the highest similarity to the generated molecules. Ligand–receptor docking diagrams for two of the novel molecules are represented in Figure 8 and Figure 9.
The docking results indicate that several generated molecules demonstrate stronger predicted binding affinities than the original seed molecules. In molecular docking studies, more negative binding scores generally indicate more favourable ligand–receptor interactions. The presence of generated molecules with docking scores lower than −6 suggests the possibility of stronger binding interactions with the P2X7 receptor compared to several seed molecules. These findings support the potential of the proposed model to identify promising candidate molecules for further experimental validation in lung cancer drug discovery.
To provide statistical context for the docking results, the mean, median, and standard deviation of the docking scores were computed for both the novel molecules and the seed molecules, as shown in Table 7. The novel molecules exhibited a mean score of −6.20, a median of −6.50, and a standard deviation of 0.9213, whilst the seed molecules showed a mean score of −8, a median of −8.1, and a standard deviation of 0.9273. The two top-ranked molecules based on docking scores are presented in Figure 10 and Figure 11. Since more negative docking scores generally indicate stronger predicted binding, the lower mean and median scores observed for the seed molecules indicate more favourable predicted binding interactions with the P2X7 receptor compared with the novel molecules. Nevertheless, the novel molecules demonstrated promising binding potential, with docking scores within a favourable range and some molecules showing competitive interactions with the target receptor. These findings suggest that although the seed molecules exhibited stronger overall predicted binding affinity, the generated molecules were able to produce novel structures with comparable binding potential.

2.3.7. Synthetic Accessibility, PAINS Filtering, and ADMET Assessment

To provide a broader evaluation of the twenty-seven novel molecules with the highest Tanimoto scores, additional analyses, including synthetic accessibility (Synth), PAINS filtering, and ADMET-related properties, were performed using ADMETlab 3.0 (https://admetlab3.scbdd.com/server/evaluation; accessed on 30 July 2026). The analysis results are presented in Table 8 and Table 9.
Synthetic accessibility scores estimate the ease with which a molecule may be synthesised experimentally by combining molecular complexity and fragment contributions [34]. The synthetic accessibility score of a molecule is between 1 (easy to make) and 10 (very difficult to make) [34]. The generated molecules demonstrated favourable synthetic feasibility, with SA scores ranging from 2 to 5 and an average score of 3.52, indicating that the generated molecules are likely to be synthetically accessible.
PAINS filtering was performed to identify substructures known to produce false-positive biological assay results [35]. The analysis revealed that all molecules were free of PAINS alerts, reducing the likelihood of misleading biological activity.
Molecular weights ranged from 211.19 to 339.19 Da with a mean value of approximately 283.96 Da, remaining well below the Lipinski threshold of 500 Da [33]. The molecules exhibited a mean QED of 0.72, indicating favourable drug-likeness. The mean TPSA was 55.50 Å2, which is generally associated with favourable permeability and oral absorption characteristics [36]. The hydrogen bond acceptors and donors showed mean values of 4.22 and 1.63, respectively, which met the recommended limits for orally active molecules.
The molecules further demonstrated acceptable solubility and lipophilicity profiles. Predicted aqueous solubility (logS) values ranged from −3.785 to −0.724 with a mean value of −2.10, while lipophilicity (logP) values ranged from −0.294 to 3.967 with a mean value of 1.49. These values indicate balanced physicochemical properties that may support favourable absorption characteristics.

3. Materials and Methods

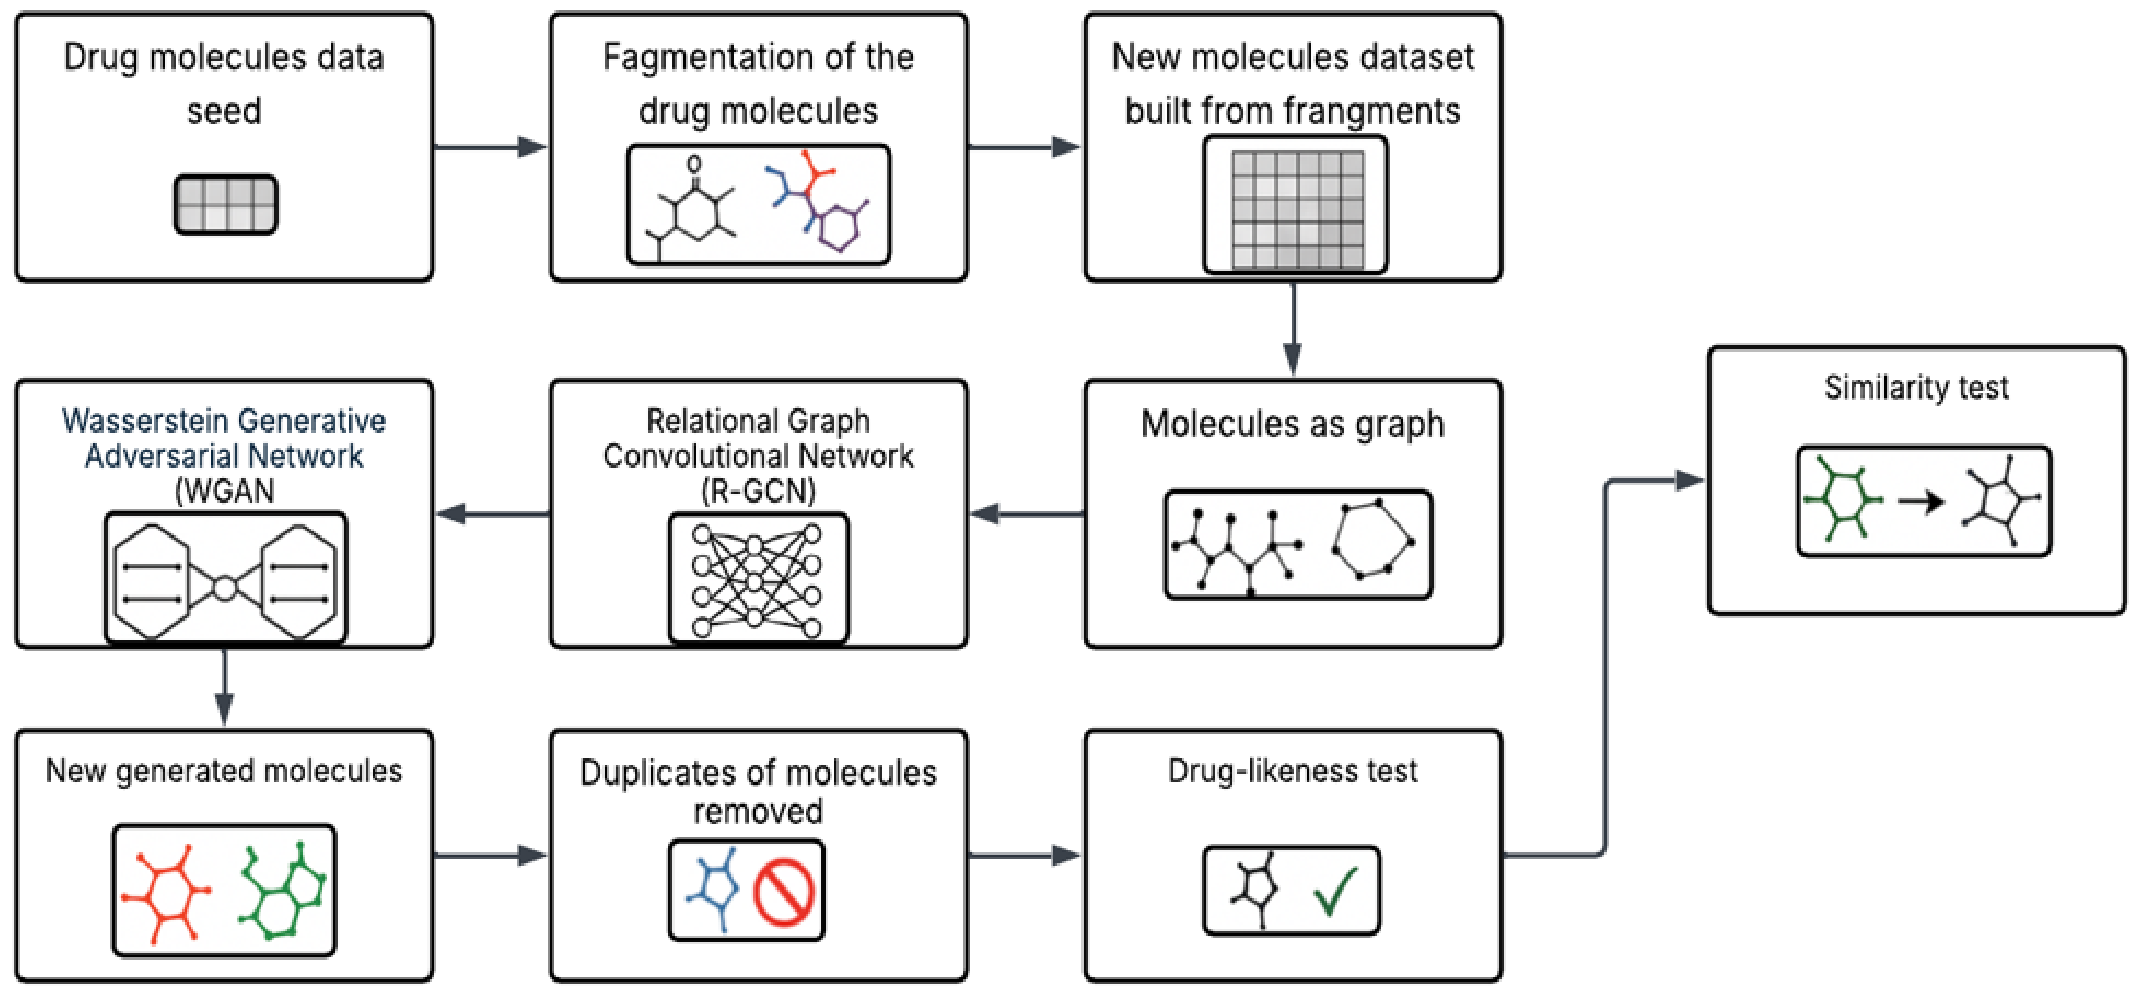
Drug molecules targeting P2X7R implicated in tumour progression and tumour cell growth regulation were collected as seed data. New molecules were generated from the seed molecules using a fragment-based method. The new molecules were converted into graph representations, enabling structural information to be effectively captured. RGCN was employed to learn feature representations of these molecular graphs, followed by WGAN to generate molecules with desired chemical properties. Duplicate generated molecules were removed to ensure uniqueness and novelty. The generated molecules were evaluated for drug-likeness, similarity to the seed molecules, and molecular docking against the P2X7R as illustrated in Figure 12.

3.1. Data Seed

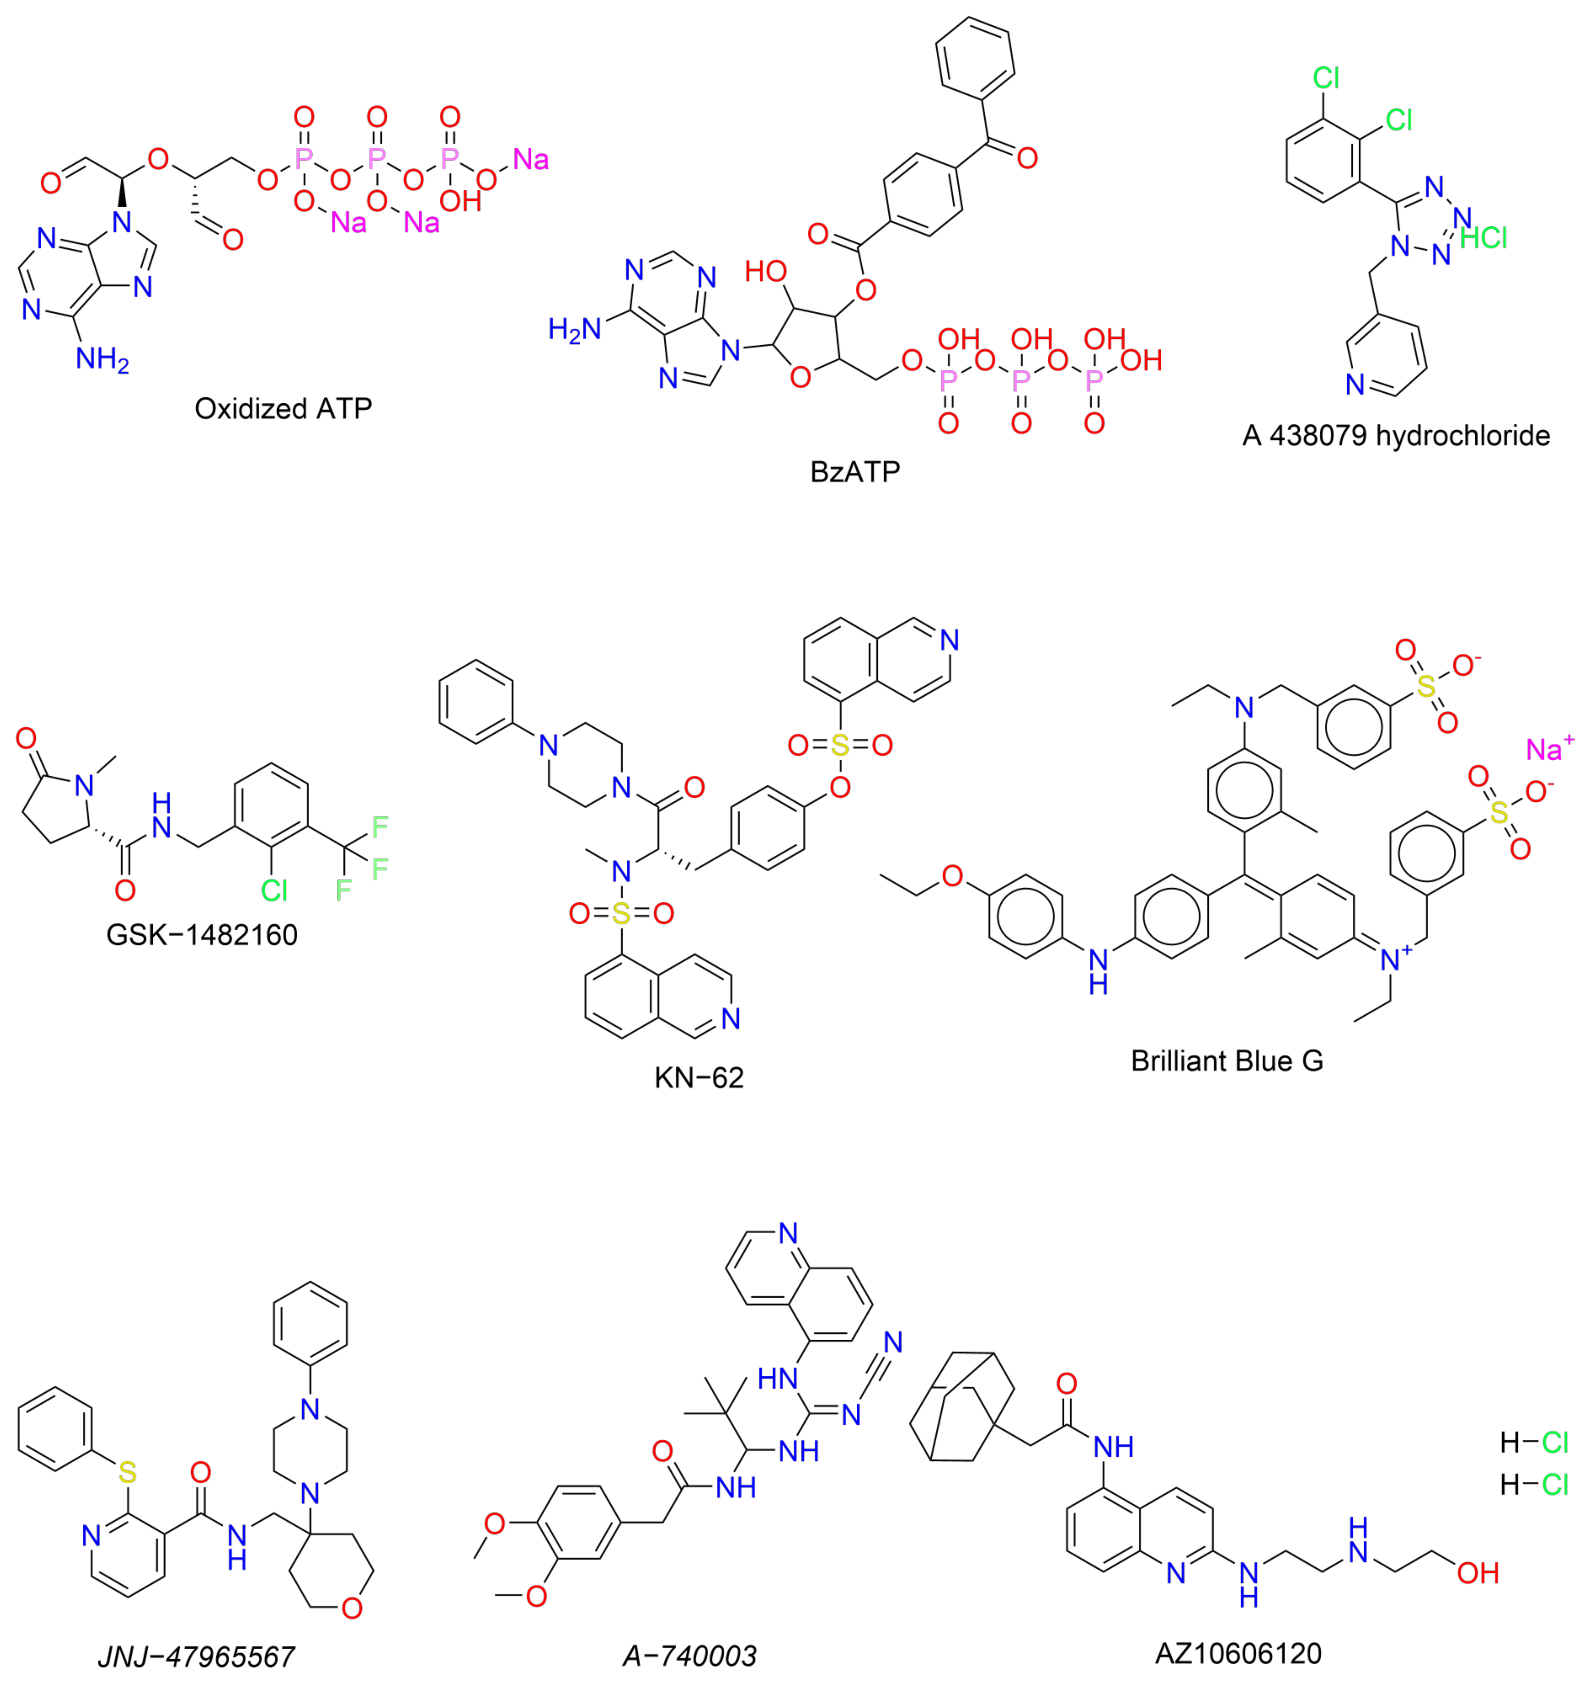
A dataset D of nine chemically diverse molecules, which has been reported as P2X7R modulators and studied in the literature [4,5,8,37,38,39,40,41], was obtained from ChEMBL and DrugBank. The drug molecules and their respective representation from SMILES to molecular graph are presented in Figure 13.

3.2. Fragmentation of Molecules

Data seed D obtained from ChEMBL was used for fragment-based de novo drug discovery, as demonstrated by [31]. Consequently, the seed dataset molecules D can be expressed as
D = { a 1 , a 2 , a 3 , , a 29 } { a ( i ) } i = 1 N
where a ( i ) represents a drug molecule’s SMILES and N represents the total number of molecules.
The dataset D is partitioned to generate a collection of fragments for further investigation. The RDKit BRICS module, which denotes Breaking of Retrosynthetically Interesting Chemical Substructures, is utilised for the fragmentation of molecules. All input molecules in D are fragmented, yielding a library of 49 distinct fragments, referred to as D frag , as illustrated below:
D F D frag = { b 1 , b 2 , b 3 , , b 49 }
where F denotes the fragmentation operator and b i represents the ith molecular fragment.

3.3. Constructing Novel Molecules Utilising the Fragments

The fragments in the library D frag are randomly merged using the BRICS Build function in RDKit to produce a collection of molecules that are unique from the original seed molecules in D . A total of 100,000 novel molecules are randomly synthesised, referred to as D m :
D frag B D m = { m 1 , m 2 , m 3 , , m 100000 }
where B denotes a defragmentation operator and m i represents the SMILES notation of the newly synthesised molecules derived from the fragments [31].

3.4. Dataset

A dataset containing 100,000 unique SMILES was generated using a fragment-based molecular generation method [31] from nine P2X7R targeting seed molecules. Due to computational resource limitations, a random subset of 5000 SMILES was selected for this study. While this reduction improves training efficiency, it may limit the coverage of the chemical space represented in the dataset and constrain the model’s ability to fully represent all chemically relevant structures associated with the P2X7R. However, random sampling helps mitigate selection bias and increases the likelihood that the subset retains the statistical characteristics of the original dataset. We acknowledge that this reduction may still restrict the diversity of chemical space explored. The selected molecules’ sizes and characteristics were analysed using the open-source cheminformatics toolkit RDKit.
A visual representation of nine randomly selected molecules from the dataset is shown in Figure 14.
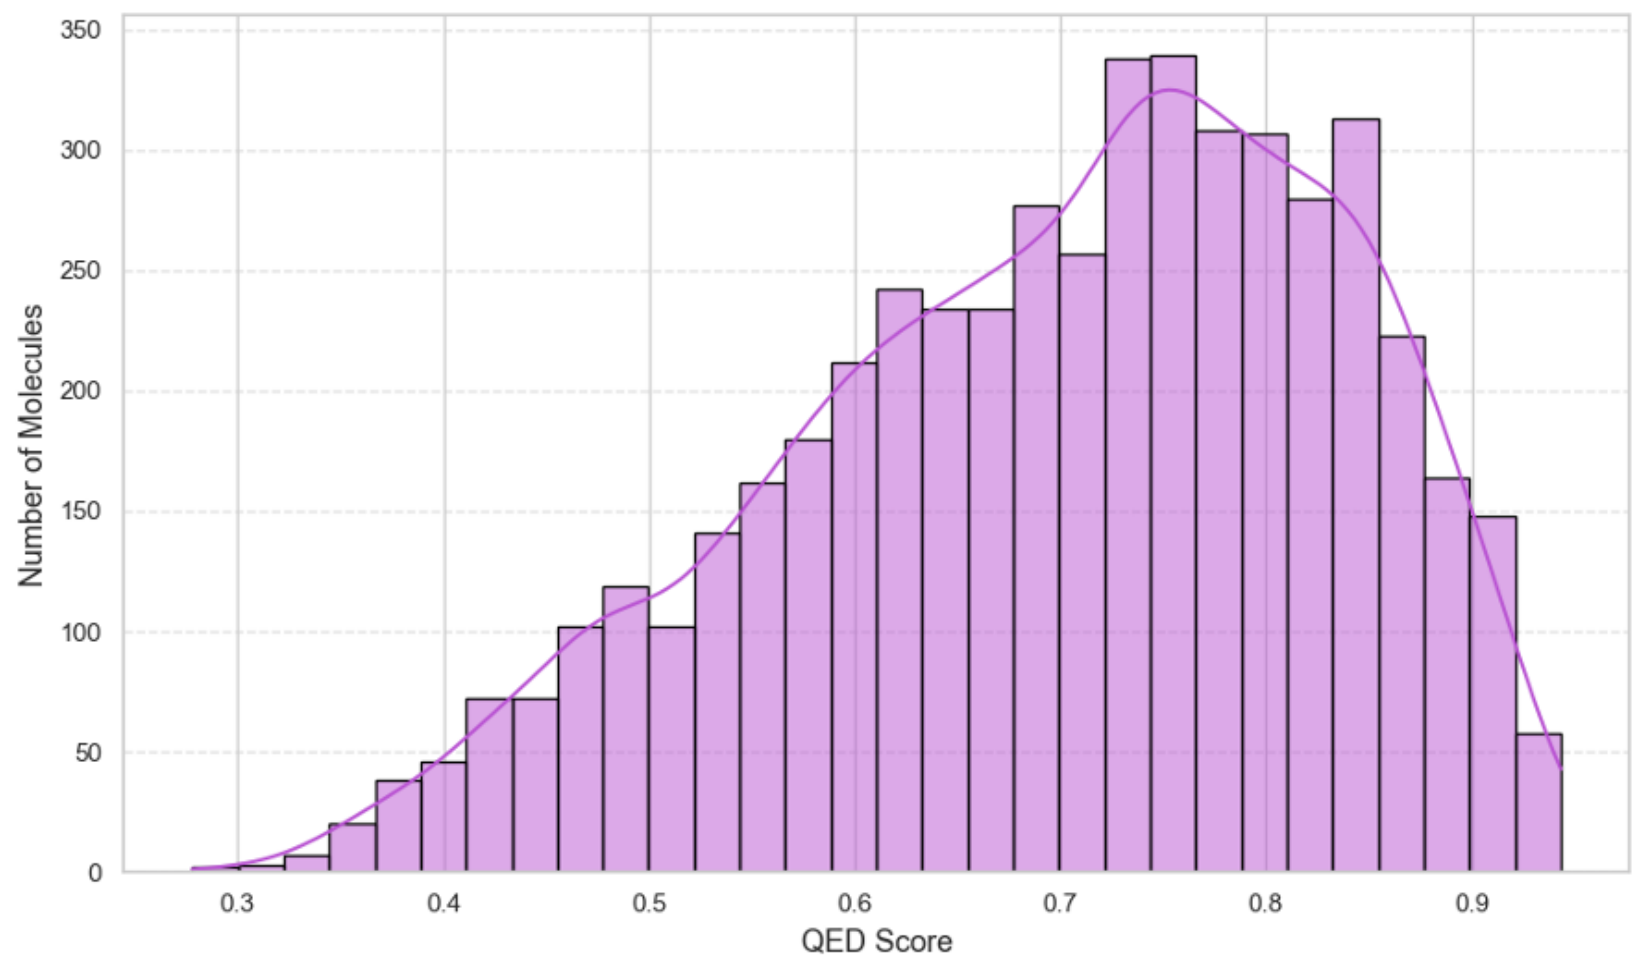
The smallest molecule in the dataset contains seven atoms, while the largest contains twenty-eight atoms, as illustrated in Figure 15. It is important to note that these atom counts exclude hydrogen atoms. Figure 16 illustrates that our dataset comprises six different types of atoms within the molecules excluding the hydrogen atoms. A count of different atoms per molecule reveals a balanced distribution, with carbon (C) atoms predominating at 93,512 occurrences, while fluorine (F) is the least prevalent at 346 occurrences. Drug-likeness is a notion in pharmacological design that assesses the extent to which a material possesses characteristics typical of drugs, specifically regarding its bioavailability, a component of absorption. Drug-likeness is assessed based on a molecule’s structure and encompasses various variables, including solubility in aqueous and lipid environments, molecular weight, and overall efficacy, among others. This quality is measured using QED (quantitative estimate of drug-likeness), which spans from zero, signifying entirely unfavourable properties, to one, denoting entirely favourable properties [42]. The mean quantitative estimate of drug-likeness (QED) for approved medications is 0.492, whereas for approved oral pharmaceuticals, it increases somewhat to 0.539, accompanied by an average standard deviation of 0.231 per target [42]. The QED distribution of the dataset is illustrated in Figure 17. A molecule’s partitioning between an aqueous and lipid environment is described by LogP. Hydrophilic molecules are primarily soluble in water, while lipophilic molecules are soluble in lipids. The partition measure is a crucial metric of a substance’s physical properties and thus a predictor of its behaviour in various situations. A negative LogP indicates that the molecule exhibits a greater affinity for the aqueous phase. When LogP equals 0, the chemical is uniformly distributed throughout the lipid and aqueous phases. A positive LogP indicates an increased concentration in the lipid phase. LogP = 1 indicates a 10:1 distribution between organic and aqueous phases. This value can direct scientists towards more productive research and development. The LogP distribution of the dataset is illustrated in Figure 18.
For molecules intended for oral administration, the LogP value should generally be below 5. More specifically, drugs designed to target the central nervous system ideally have a LogP around 2, while molecules intended for optimal oral and intestinal absorption typically fall within the range of 1.35 to 1.8.

3.5. Graphs Representation

Prior deep generative models for molecular data mostly produced SMILES representations, which were susceptible to errors and invalid structures due to the inherent fragility of the SMILES syntax. Grammar VAEs addressed this issue by enforcing grammatical rules during generation. More recently, models that operate directly on molecular graphs have emerged as a promising alternative, ensuring that all produced outputs are proper graphs, although not always chemically valid molecules [21]. Each molecule is represented as an undirected graph G = ( V , E ) with a set of nodes V and edges E. Nodes V represent atoms, where each atom v i is characterised by a T-dimensional one-hot vector x i indicating its atom type. Edges E represent chemical bonds, with each bond ( v i , v j ) classified by a bond type y { 1 , , Y } .
For a molecular graph consisting of N nodes, this representation can be encapsulated in a node feature matrix,
X = [ x 1 ; ; x N ] T R N × T ,
and an adjacency tensor,
A R N × N × Y ,
where A i j R Y is a one-hot vector denoting the edge type between nodes i and j [21]. The atomic and bond properties used in this study are summarised in Table 10.

3.6. Relational Graph Convolutional Networks (RGCN)

The proposed model builds on Graph Convolutional Networks (GCN) that process local graph neighbourhoods, extending them to handle large-scale relational data [43].
h i ( l + 1 ) = σ m M i g m h i ( l ) , h j ( l )
In each layer l of the network, every node v i possesses a hidden state h i ( l ) R d ( l ) , where d ( l ) denotes the dimensionality of the representations in that layer. Incoming messages of the form g m ( . , . ) are aggregated and subjected to an element-wise activation function σ ( . ) , such as the ReLU ( . ) = max ( 0 , . ) . M i represents the collection of incoming messages for node v i and is frequently selected to correspond with the set of incoming edges. g m ( . , . ) is generally selected as a neural network-like function particular to message or as a linear transformation, defined as
g m ( h i ( l ) , h j ( l ) ) = W h j
where W represents a weight matrix, as referenced in [44]. This transformation effectively captures and encodes information from local, structured neighbourhoods, resulting in significant performance gains in tasks such as graph classification and graph-based semi-supervised learning [44,45].
Ref. [43] suggested a straightforward propagation model for computing the forward-pass update of an entity or node within a relational multi-graph, inspired by these architectures:
h i ( l + 1 ) = σ r R j N i r 1 c ( i , r ) W r ( l ) h j ( l ) + W 0 ( l ) h i ( l )
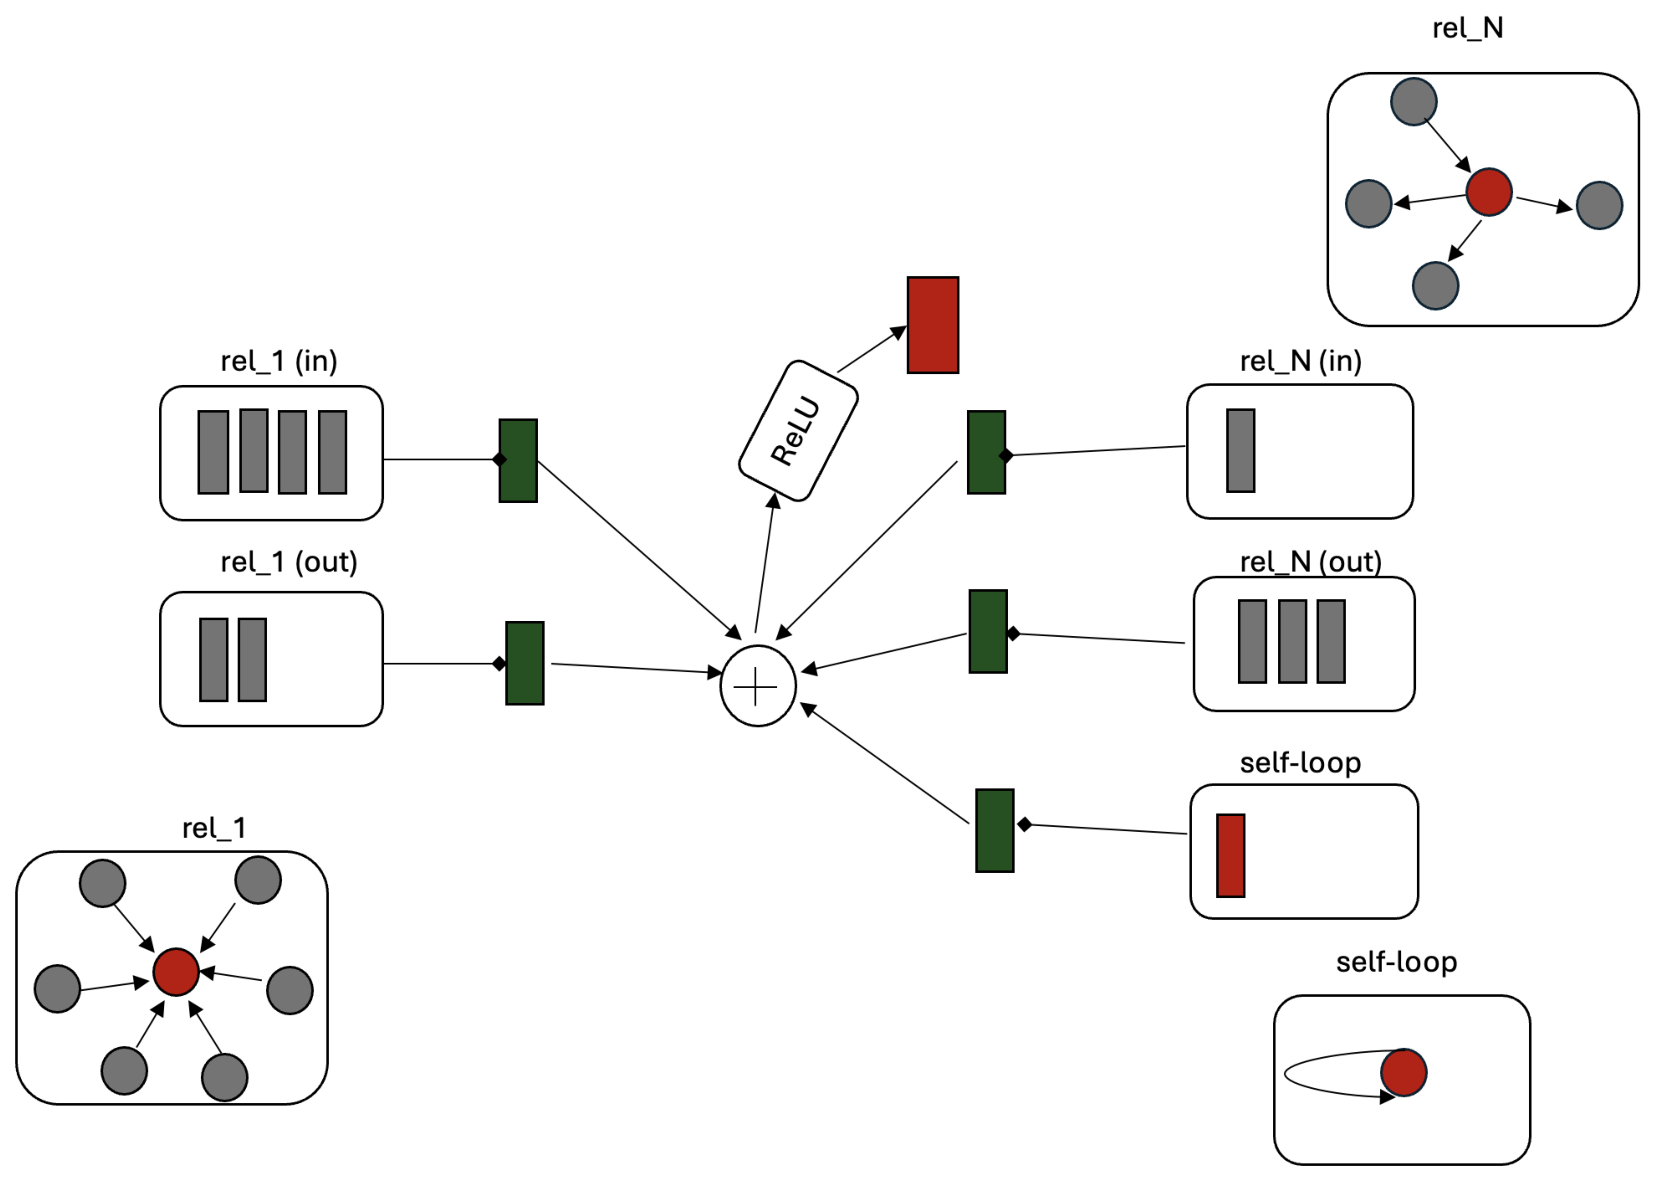
N i r represents the set of neighbouring indices of node i with respect to relation r R . c ( i , r ) is a normalisation constant specific to the problem that can be either learnt or predetermined (for instance, c ( i , r ) = | N i r | ). Equation (6) aggregates the transformed feature vectors of neighbouring nodes using a normalised sum. By using linear transformations, W h j , that depend only on neighbouring nodes, the model gains key computational advantages: it avoids storing large edge-based representations and allows efficient vectorised implementation through sparse–dense matrix multiplications, as in [44]. Unlike standard GCNs, the model introduces relation-specific transformations that account for the type and direction of each edge. Additionally, self-connections are added so that each node retains information from its previous layer. Each neural layer updates all nodes in parallel, and stacking multiple layers enables learning from multi-hop relationships. This approach defines the Relational Graph Convolutional Network (RGCN). Figure 19 illustrates how a single node (red) in the RGCN model is updated by gathering activations from neighbouring nodes (grey), transforming them by relation type, aggregating the results (green) through a normalised sum, and applying an activation function like ReLU [43].

3.7. Wasserstein Generative Adversarial Network (WGAN)

WGAN substitutes the conventional GAN loss with the Wasserstein (Earth Mover) distance, with the intention of enhancing training stability and mitigating mode collapse [23,24]. Rather than producing a probability, WGAN employs a critic D that evaluates the authenticity of a sample as “real” or “fake”. The WGAN loss is represented as
min G max D D L ( D , G ) = E x P d t log D ( x ) + E z p z log 1 D ( G ( z ) )
W ( P r , P g ) = inf γ Π ( P r , P g ) | x y | d γ ( x , y )
λ GP · E x p | x D ( x ˜ ) | 2 1 2
where [23,24]
  • D is the collection of 1-Lipschitz functions, characterised by linear output variations in relation to their input, resulting in smooth and well-behaved gradients. This constraint is commonly enforced using weight clipping or gradient penalties. This distance metric yields more informative gradients and enhances generator updates.
  • The critic D seeks to optimise the disparity between its evaluations of real and generated data, thereby improving gradient flow to the generator.
  • L ( D , G ) is the objective (loss) function used to train the generator and critic.
  • G is the generator network, which learns to map a noise vector z from a latent space to generated samples G ( z ) that resemble real data.
  • x is a real data sample drawn from the real data distribution.
  • P d t is the real data distribution, representing the probability distribution of the true dataset.
  • p z is the latent noise distribution.
  • D ( x ) denotes the critic’s evaluation of a real sample x.
  • G ( z ) represents the output of the generator given a random noise input z.
  • D ( G ( z ) ) represents the critic’s evaluation of a generated sample.
  • The Wasserstein distance W ( P r , P g ) quantifies the amount of “mass” required to transform the generated distribution P g into the real distribution P r . In contrast to the Kullback–Leibler or Jensen–Shannon divergence used in conventional GANs, this metric provides meaningful gradients even when the distributions have little or no overlap.
  • Π ( P r , P g ) denotes the set of all joint probability distributions whose marginals are P r and P g .
  • | x y | represents the cost of transporting probability mass between points x and y.
  • γ ( x , y ) denotes a transport plan describing how probability mass is moved from P g to match P r .
  • The gradient penalty term λ G P ensures that the critic satisfies the 1-Lipschitz constraint by penalising deviations of | | x D ( x ˜ ) | | 2 from 1.
  • x ˜ represents interpolated samples between real and generated data, which helps prevent critic saturation and improve convergence.
  • p ( x ˜ ) is the distribution of interpolated samples used to compute the gradient penalty.
  • x D ( x ˜ ) is the gradient of the critic output with respect to the input sample x ˜ .
  • ( | | x D ( x ˜ ) | | 2 1 ) 2 is the penalty term enforcing the 1-Lipschitz constraint, ensuring that the gradient norm remains close to 1.
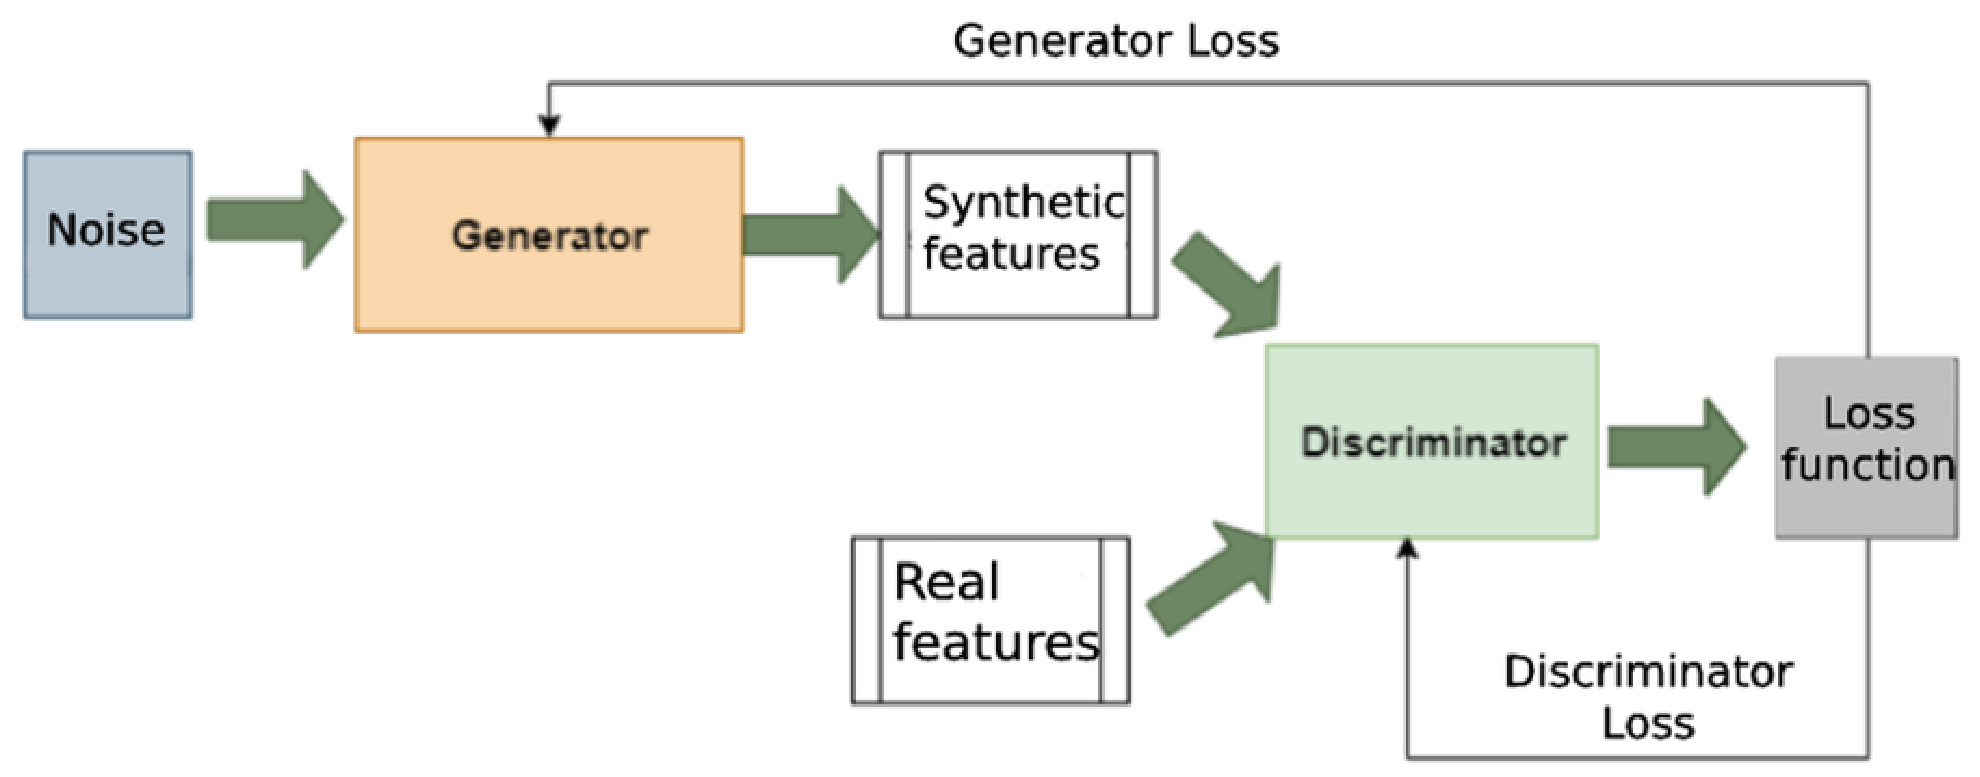
In contrast to weight clipping, which may result in suboptimal training dynamics, the gradient penalty enables the critic to learn more expressive and stable representations. These formulations illustrate the progression from the original GAN, which employs a binary cross-entropy loss, to the WGAN, which adopts a continuous and theoretically grounded loss based on the Wasserstein distance, thereby facilitating more stable and meaningful training dynamics. The conventional GAN loss (cross-entropy) results in gradient vanishing when the discriminator exhibits excessive confidence, but the Wasserstein loss provides significant gradients even when samples deviate from real data [23,24]. A diagram of the WGAN is represented in Figure 20.

3.8. Drug-Likeness Test

The molecules generated by the WGAN model were first validated to ensure they represent chemically valid structures, after which duplicate molecules were removed. The remaining molecules were then evaluated using a drug-likeness testing module, which determined how well each molecule satisfied the pharmaceutical criteria for bioactive potential and oral administration suitability. According to Lipinski’s Rule of Five (Ro5), a molecule is regarded as drug-like if it satisfies the following conditions [33]: a molecular weight of 500 daltons (Da) or less, a LogP value not exceeding five, no more than five hydrogen bond donors, and no more than 10 hydrogen bond acceptors [31]. The validation process was implemented programmatically using the RDKit cheminformatics toolkit in Python. First, the generated SMILES strings were parsed into molecular objects to verify chemical validity. Invalid SMILES and molecules were discarded, and duplicate molecules were then removed. For each remaining molecule, RDKit was used to compute molecular descriptors including molecular weight, LogP, hydrogen bond donors, and hydrogen bond acceptors. These descriptors were then evaluated against the Ro5 to identify molecules with favourable drug-like properties.

3.9. Similarity Test

The molecules that passed the drug-likeness test were then looked at more closely to see how similar they were to the seed molecules in the dataset. We used the Tanimoto similarity coefficient, which has a threshold range of 1 Γ 0.65 , to see how similar and original the synthesised molecules were. Molecules that met the similarity requirement were re-evaluated for drug-likeness, resulting in a final set of validated, drug-like molecules.

3.10. Molecular Docking

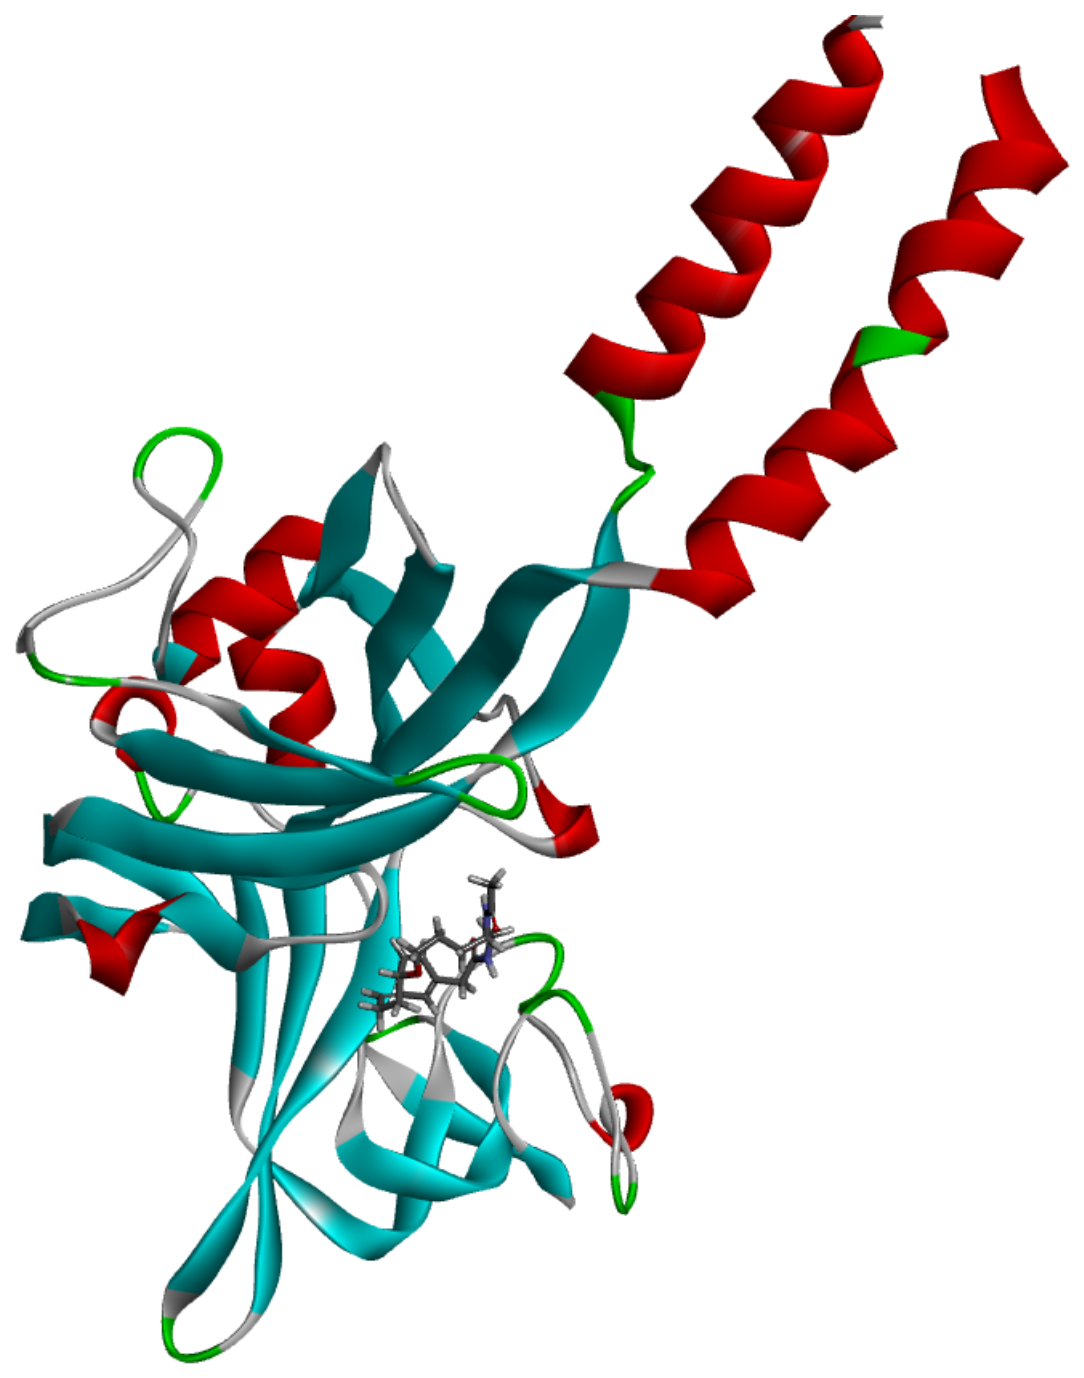
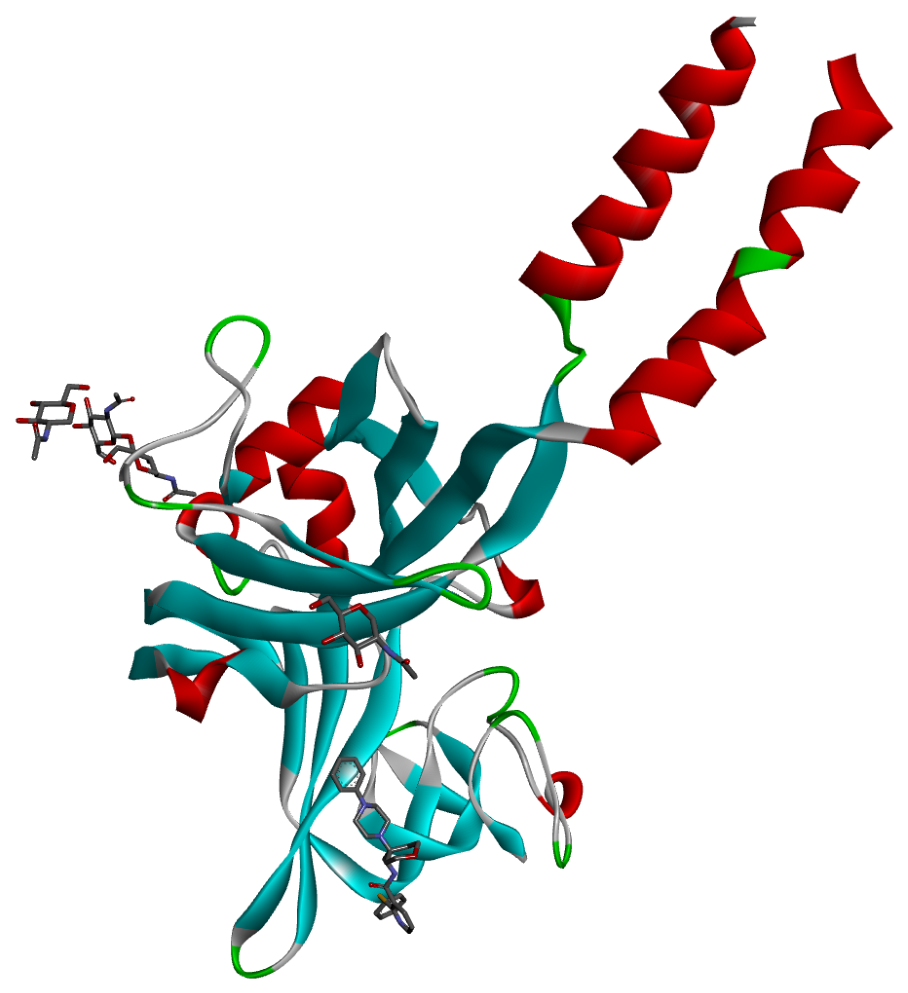
Molecular docking of the novel molecules generated by the WGAN was performed using PyRx 0.8, which integrates AutoDock 4 and AutoDock Vina version 1.1.2 for virtual screening and binding affinity prediction [47,48]. The docking workflow comprised three main steps: protein preparation, ligand preparation, and docking [49]. The crystal structure of the P2X7 receptor (P2X7R) was sourced from the Protein Data Bank, specifically the PDB ID: 5U1X, which represents the receptor in complex with an antagonist [50].
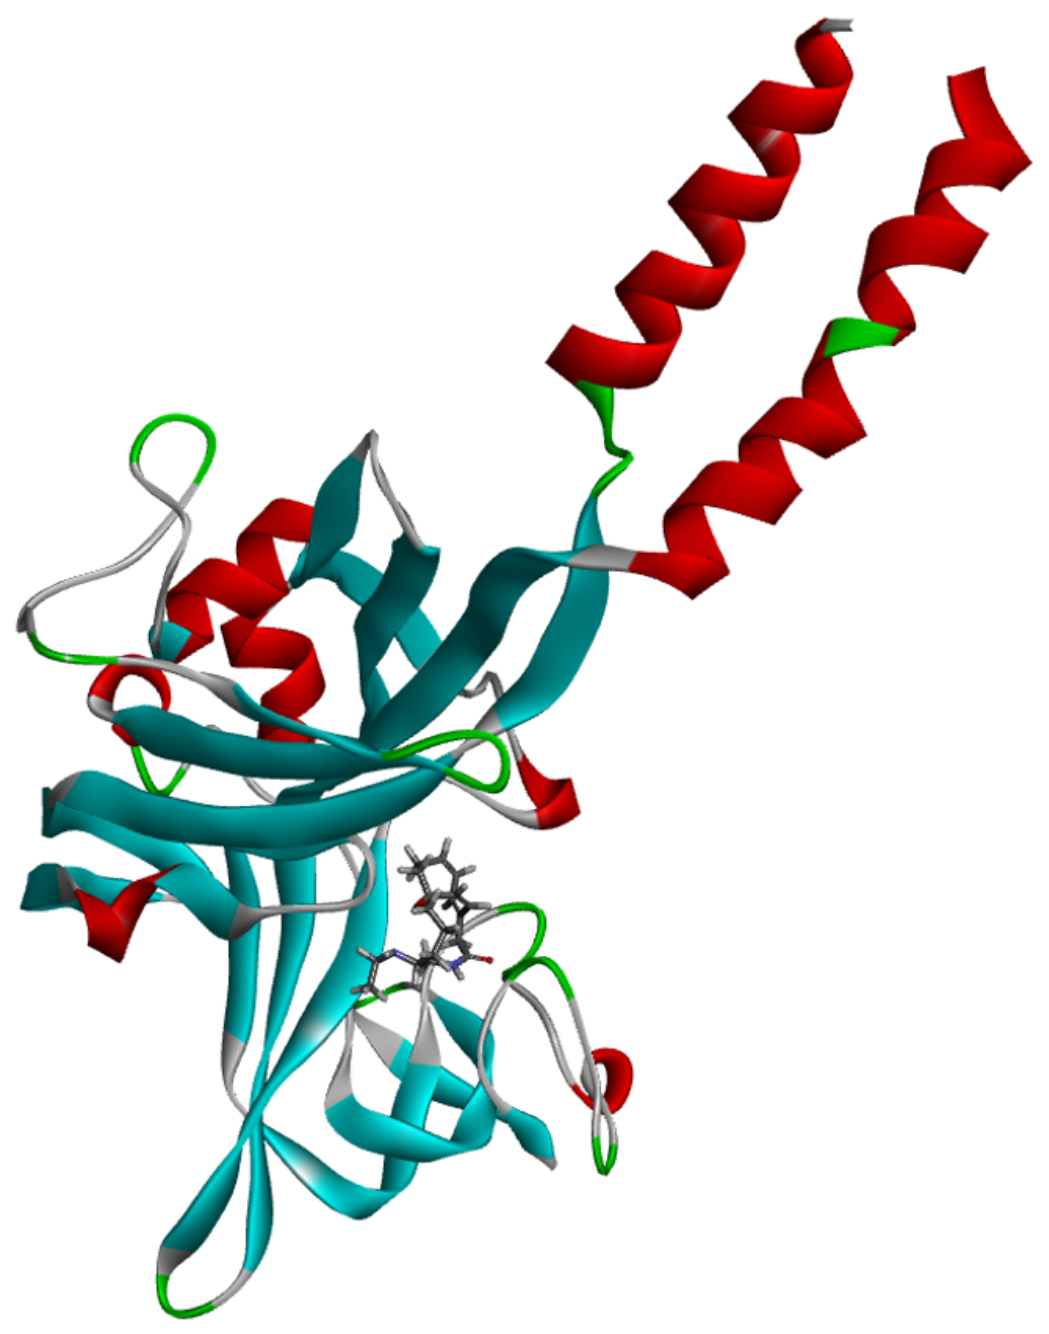
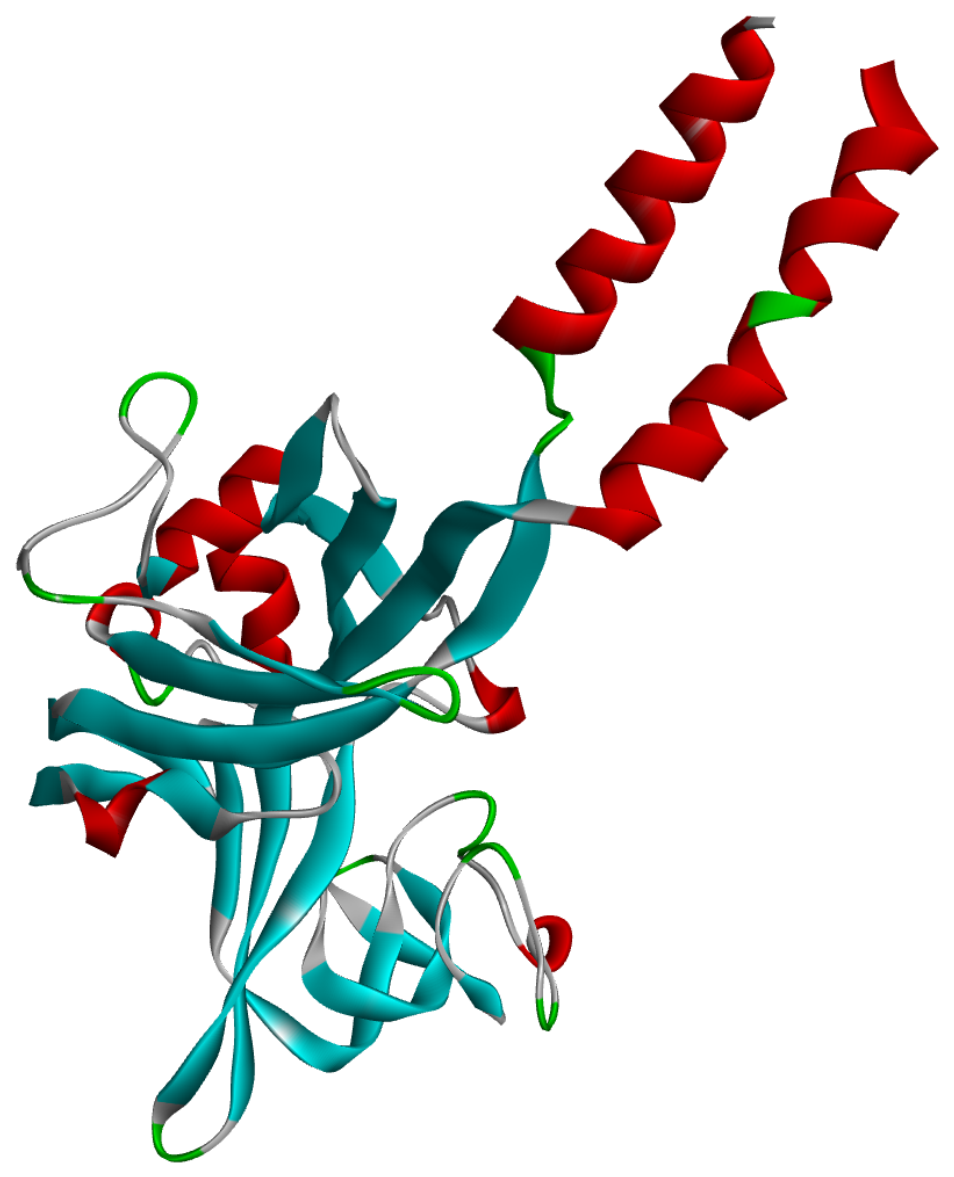
Prior to docking, the unprepared P2X7 receptor structure obtained from the PDB is shown in Figure 21. Following receptor preparation in BIOVIA Discovery Studio Visualizer, during which the co-crystallised ligand and water molecules were removed, the prepared protein structure shown in Figure 22 was used for molecular docking.
The prepared protein structure was converted to the PDBQT format required by AutoDock Vina. The generated molecules (ligands) were converted into three-dimensional structures and subjected to energy minimisation before being converted to the PDBQT format for docking. The molecular docking was performed in PyRx using the AutoDock Vina docking engine. The docked molecules were ranked according to their predicted binding affinity scores (kcal/mol), with more negative values indicating stronger predicted binding. The binding interactions of the top-performing molecules were subsequently analysed and visualised using BIOVIA Discovery Studio Visualizer.

4. Conclusions

This study successfully developed a deep learning-driven framework that combines fragment-based molecular generation, RGCN, and a WGAN to accelerate the discovery of novel drug-like molecules targeting the P2X7 receptor for lung cancer therapeutics. The framework demonstrated that deep generative models can effectively learn molecular structures and generate new molecules that are both chemically valid and pharmacologically meaningful.
The proposed model generated 4498 valid molecules, achieving a 90% validity rate. Among these, 968 were unique and 384 were novel molecules, with 97% satisfying Lipinski’s Rule of Five for drug-likeness. The QED and LogP distributions of generated molecules further confirmed that the framework effectively learned desirable molecular properties. Although the Tanimoto similarity scores (maximum ≈ 0.62) fell slightly below the desired threshold of 0.65, this result indicates that the generated molecules exhibit moderate structural resemblance to the seed molecules while maintaining strong chemical novelty. Molecular docking results from twenty-seven novel molecules with the highest Tanimoto scores showed strong binding scores to the P2X7R. Such structural diversity is advantageous in de novo drug design, as it broadens the exploration of new chemical spaces and enhances the likelihood of identifying unique bioactive scaffolds.
Beyond the quantitative metrics, this study’s methodological contribution lies in demonstrating how fragment-based molecular assembly, graph representation learning, and Generative Adversarial Network training can be integrated into a cohesive AI pipeline tailored to a specific oncogenic target. Despite constraints in dataset size and computational power, the model successfully produced a chemically rich library of P2X7R-targeted candidates, illustrating the potential of AI to reduce costs, time, and risk associated with early-stage drug discovery.
Despite its success, the study was constrained by limited computational resources and the relatively small training dataset, which may have affected the range of molecular diversity. Future work should focus on scaling the model with larger, experimentally annotated datasets, incorporating reinforcement learning for bioactivity optimisation, and validating top candidates through molecular docking and wet-lab screening. In addition, no direct comparison with alternative molecular generative models such as VAE, MolGAN, or MedGAN was performed. Future work should also include systematic comparisons using standard molecular generation methods to evaluate the performance of the proposed framework.
In conclusion, this research establishes a proof-of-concept for integrating deep generative models with graph-based learning in fragment-based drug discovery. The proposed framework successfully generated chemically valid, novel, and drug-like molecules and enabled the computational prioritisation of molecules with favourable predicted interactions with the P2X7 receptor. However, these findings are based solely on in silico analyses and do not establish therapeutic efficacy. Further experimental validation is required to determine the biological activity, safety, and clinical relevance of the generated molecules.

Author Contributions

Conceptualisation, M.B.A.S. and U.A.K.C.-O.; methodology, M.B.A.S.; software, M.B.A.S. and U.A.K.C.-O.; validation, M.B.A.S. and U.A.K.C.-O.; formal analysis, M.B.A.S.; investigation, M.B.A.S.; resources, M.B.A.S.; data curation, M.B.A.S. and U.A.K.C.-O.; writing original draft preparation, M.B.A.S.; writing review and editing, M.B.A.S. and U.A.K.C.-O.; visualisation, M.B.A.S.; supervision, U.A.K.C.-O.; project administration, M.B.A.S. and U.A.K.C.-O. All authors have read and agreed to the published version of the manuscript.

Funding

This research received no external funding.

Institutional Review Board Statement

Not applicable.

Informed Consent Statement

Not applicable.

Data Availability Statement

The data used in this work is available upon request from the corresponding author.

Acknowledgments

The University of Johannesburg is acknowledged for supporting this study.

Conflicts of Interest

The authors declare no conflicts of interest.

References

  1. Sarvepalli, S.; Vadarevu, S. Role of artificial intelligence in cancer drug discovery and development. Cancer Lett. 2025, 627, 217821. [Google Scholar] [CrossRef] [Scilit]
  2. Sung, H.; Ferlay, J.; Siegel, R.L.; Laversanne, M.; Soerjomataram, I.; Jemal, A.; Bray, F. Global cancer statistics 2020: GLOBOCAN estimates of incidence and mortality worldwide for 36 cancers in 185 countries. CA Cancer J. Clin. 2021, 71, 209–249. [Google Scholar] [CrossRef] [Scilit] [PubMed]
  3. McDowell, S. Lung Cancer Kills More People Worldwide Than Other Cancer Types. 2024. Available online: https://www.cancer.org/research/acs-research-news/lung-cancer-kills-more-people-worldwide-than-other-cancers.html (accessed on 8 August 2026).
  4. Dayel, A.B.; Evans, R.J.; Schmid, R. Mapping the site of action of human P2X7 receptor antagonists AZ11645373, brilliant blue G, KN-62, calmidazolium, and ZINC58368839 to the intersubunit allosteric pocket. Mol. Pharmacol. 2019, 96, 355–363. [Google Scholar] [CrossRef] [Scilit]
  5. Allsopp, R.C.; Dayl, S.; Dayel, A.B.; Schmid, R.; Evans, R.J. Mapping the allosteric action of antagonists A740003 and A438079 reveals a role for the left flipper in ligand sensitivity at P2X7 receptors. Mol. Pharmacol. 2018, 93, 553–562. [Google Scholar] [CrossRef] [Scilit]
  6. Yu, Q.; Peng, X.; Xu, G.; Bai, X.; Cao, Y.; Du, Y.; Wang, X.; Zhao, R. Overexpression or knockdown of the P2X7 receptor regulates the progression of non-small cell lung cancer, involving GSK-3β and JNK signaling pathways. Eur. J. Pharmacol. 2025, 995, 177421. [Google Scholar] [CrossRef] [Scilit]
  7. Bai, X.; Li, Q.; Peng, X.; Li, X.; Qiao, C.; Tang, Y.; Zhao, R. P2X7 receptor promotes migration and invasion of non-small cell lung cancer A549 cells through the PI3K/Akt pathways. Purinergic Signal. 2023, 19, 685–697. [Google Scholar] [CrossRef] [Scilit]
  8. Kan, L.K.; Drill, M.; Jayakrishnan, P.C.; Sequeira, R.P.; Galea, E.; Todaro, M.; Sanfilippo, P.G.; Hunn, M.; Williams, D.A.; O’Brien, T.J.; et al. P2X7 receptor antagonism by AZ10606120 significantly reduced in vitro tumour growth in human glioblastoma. Sci. Rep. 2023, 13, 8435. [Google Scholar] [CrossRef] [Scilit]
  9. Paul, S.M.; Mytelka, D.S.; Dunwiddie, C.T.; Persinger, C.C.; Munos, B.H.; Lindborg, S.R.; Schacht, A.L. How to improve R&D productivity: The pharmaceutical industry’s grand challenge. Nat. Rev. Drug Discov. 2010, 9, 203–214. [Google Scholar] [CrossRef] [Scilit]
  10. Prasad, V.; Mailankody, S. Research and development spending to bring a single cancer drug to market and revenues after approval. JAMA Intern. Med. 2017, 177, 1569–1575. [Google Scholar] [CrossRef] [Scilit]
  11. Jiménez-Luna, J.; Grisoni, F.; Schneider, G. Drug discovery with explainable artificial intelligence. Nat. Mach. Intell. 2020, 2, 573–584. [Google Scholar] [CrossRef] [Scilit]
  12. Kim, H.; Kim, E.; Lee, I.; Bae, B.; Park, M.; Nam, H. Artificial intelligence in drug discovery: A comprehensive review of data-driven and machine learning approaches. Biotechnol. Bioprocess Eng. 2020, 25, 895–930. [Google Scholar] [CrossRef] [Scilit]
  13. Zhu, H. Big data and artificial intelligence modeling for drug discovery. Annu. Rev. Pharmacol. Toxicol. 2020, 60, 573–589. [Google Scholar] [CrossRef] [Scilit]
  14. Li, C.; Yamanishi, Y. GxVAEs: Two Joint VAEs Generate Hit Molecules from Gene Expression Profiles. In Proceedings of the AAAI Conference on Artificial Intelligence, Vancouver, BC, Canada, 20–27 February 2024; pp. 13455–13463. [Google Scholar] [CrossRef] [Scilit]
  15. Goodfellow, I.J.; Pouget-Abadie, J.; Mirza, M.; Xu, B.; Warde-Farley, D.; Ozair, S.; Courville, A.; Bengio, Y. Generative Adversarial Nets. In Proceedings of the Advances in Neural Information Processing Systems; Curran Associates, Inc.: Red Hook, NY, USA, 2014; Volume 27, Available online: https://proceedings.neurips.cc/paper_files/paper/2014/hash/f033ed80deb0234979a61f95710dbe25-Abstract.html (accessed on 30 July 2026).
  16. Li, C.; Yamanaka, C.; Kaitoh, K.; Yamanishi, Y. Transformer-based Objective-reinforced Generative Adversarial Network to Generate Desired Molecules. In Proceedings of the Thirty-First International Joint Conference on Artificial Intelligence (IJCAI), Vienna, Austria, 23–29 July 2022; pp. 3884–3890. [Google Scholar] [CrossRef] [Scilit]
  17. Xu, M.; Powers, A.S.; Dror, R.O.; Ermon, S.; Leskovec, J. Geometric Latent Diffusion Models for 3D Molecule Generation. In Proceedings of the 40th International Conference on Machine Learning, Honolulu, Hawaii, USA, 23–29 July 2023; Volume 202, pp. 38592–38610. Available online: https://proceedings.mlr.press/v202/xu23n.html (accessed on 30 July 2026).
  18. Weininger, D. SMILES, a chemical language and information system. 1. Introduction to methodology and encoding rules. J. Chem. Inf. Comput. Sci. 2002, 28, 31–36. [Google Scholar] [CrossRef] [Scilit]
  19. Krenn, M.; Häse, F.; Nigam, A.; Friederich, P.; Aspuru-Guzik, A. Self-referencing embedded strings (SELFIES): A 100% robust molecular string representation. Mach. Learn. Sci. Technol. 2020, 1, 045024. [Google Scholar] [CrossRef] [Scilit]
  20. Liu, S.; Demirel, M.F.; Liang, Y. N-Gram Graph: Simple Unsupervised Representation for Graphs, with Applications to Molecules. In Proceedings of the Advances in Neural Information Processing Systems 32 (NeurIPS 2019); Curran Associates, Inc.: Vancouver, BC, Canada, 2019; Volume 32, Available online: https://proceedings.neurips.cc/paper_files/paper/2019/hash/2f3926f0a9613f3c3cc21d52a3cdb4d9-Abstract.html (accessed on 30 July 2026).
  21. De Cao, N.; Kipf, T. MolGAN: An implicit generative model for small molecular graphs. arXiv 2018, arXiv:1805.11973. [Google Scholar] [CrossRef] [Scilit]
  22. Soutullo Rendo, A. Molecule Generation with GANs. Master’s Thesis, Universitat Politècnica de Catalunya, Barcelona, Spain, 2022. Available online: https://hdl.handle.net/2117/363967 (accessed on 30 July 2026).
  23. Arjovsky, M.; Chintala, S.; Bottou, L. Wasserstein Generative Adversarial Networks. In Proceedings of the 34th International Conference on Machine Learning, Sydney, NSW, Australia, 6–11 August 2017; Precup, D., Teh, Y.W., Eds.; PMLR: London, UK, 2017; Volume 70, pp. 214–223. Available online: https://proceedings.mlr.press/v70/arjovsky17a.html (accessed on 30 July 2026).
  24. Gulrajani, I.; Ahmed, F.; Arjovsky, M.; Dumoulin, V.; Courville, A. Improved Training of Wasserstein GANs. In Proceedings of the Advances in Neural Information Processing Systems 30 (NIPS 2017); Guyon, I., Luxburg, U.V., Bengio, S., Wallach, H., Fergus, R., Vishwanathan, S., Garnett, R., Eds.; Curran Associates, Inc.: Long Beach, CA, USA, 2017; Volume 30, Available online: https://papers.nips.cc/paper_files/paper/2017/hash/892c3b1c6dccd52936e27cbd0ff683d6-Abstract.html (accessed on 30 July 2026).
  25. Macedo, B.; Ribeiro Vaz, I.; Taveira Gomes, T. MedGAN: Optimized generative adversarial network with graph convolutional networks for novel molecule design. Sci. Rep. 2024, 14, 1212. [Google Scholar] [CrossRef] [Scilit]
  26. Zeng, X.; Wang, F.; Luo, Y.; Kang, S.G.; Tang, J.; Lightstone, F.C.; Fang, E.F.; Cornell, W.; Nussinov, R.; Cheng, F. Deep generative molecular design reshapes drug discovery. Cell Rep. Med. 2022, 3, 100794. [Google Scholar] [CrossRef] [Scilit]
  27. Meyers, J.; Fabian, B.; Brown, N. De novo molecular design and generative models. Drug Discov. Today 2021, 26, 2707–2715. [Google Scholar] [CrossRef] [Scilit]
  28. Kingma, D.P.; Welling, M. Auto-encoding variational bayes. arXiv 2013, arXiv:1312.6114. [Google Scholar] [CrossRef] [Scilit]
  29. Martinelli, D.D. Generative machine learning for de novo drug discovery: A systematic review. Comput. Biol. Med. 2022, 145, 105403. [Google Scholar] [CrossRef] [Scilit]
  30. Yang, N.; Wu, H.; Zeng, K.; Li, Y.; Bao, S.; Yan, J. Molecule generation for drug design: A graph learning perspective. Fundam. Res. 2024, 6, 40–52. [Google Scholar] [CrossRef] [Scilit]
  31. Chude-Okonkwo, U.A.; Lehasa, O. Integrated framework of fragment-based method and generative model for lead drug molecules discovery. Intell. Syst. Appl. 2025, 26, 200508. [Google Scholar] [CrossRef] [Scilit]
  32. Zalpoor, H.; Akbari, A.; Nabi-Afjadi, M.; Norouzi, A.; Seif, F.; Pornour, M. Purinergic P2X7 receptor as a potential targeted therapy for COVID-19-associated lung cancer progression. J. Cell. Signal. 2023, 4, 21–25. [Google Scholar] [CrossRef] [Scilit]
  33. Lipinski, C.A. Drug-like properties and the causes of poor solubility and poor permeability. J. Pharmacol. Toxicol. Methods 2000, 44, 235–249. [Google Scholar] [CrossRef] [Scilit]
  34. Ertl, P.; Schuffenhauer, A. Estimation of synthetic accessibility score of drug-like molecules based on molecular complexity and fragment contributions. J. Cheminform. 2009, 1, 8. [Google Scholar] [CrossRef] [Scilit]
  35. Baell, J.B.; Holloway, G.A. New substructure filters for removal of pan assay interference compounds (PAINS) from screening libraries and for their exclusion in bioassays. J. Med. Chem. 2010, 53, 2719–2740. [Google Scholar] [CrossRef] [Scilit] [PubMed]
  36. Veber, D.F.; Johnson, S.R.; Cheng, H.Y.; Smith, B.R.; Ward, K.W.; Kopple, K.D. Molecular properties that influence the oral bioavailability of drug candidates. J. Med. Chem. 2002, 45, 2615–2623. [Google Scholar] [CrossRef] [Scilit] [PubMed]
  37. Beigi, R.D.; Kertesy, S.B.; Aquilina, G.; Dubyak, G.R. Oxidized ATP (oATP) attenuates proinflammatory signaling via P2 receptor-independent mechanisms. Br. J. Pharmacol. 2003, 140, 507–519. [Google Scholar] [CrossRef] [Scilit]
  38. Michel, A.; Xing, M.; Humphrey, P. Serum constituents can affect 2-& 3-O-(4-benzoylbenzoyl)-ATP potency at P2X7 receptors. Br. J. Pharmacol. 2001, 132, 1501–1508. [Google Scholar] [CrossRef] [Scilit]
  39. Ozkanlar, S.; Ulas, N.; Kaynar, O.; Satici, E. P2X7 receptor antagonist A-438079 alleviates oxidative stress of lung in LPS-induced septic rats. Purinergic Signal. 2023, 19, 699–707. [Google Scholar] [CrossRef] [Scilit]
  40. Ali, Z.; Laurijssens, B.; Ostenfeld, T.; McHugh, S.; Stylianou, A.; Scott-Stevens, P.; Hosking, L.; Dewit, O.; Richardson, J.C.; Chen, C. Pharmacokinetic and pharmacodynamic profiling of a P2X7 receptor allosteric modulator GSK1482160 in healthy human subjects. Br. J. Clin. Pharmacol. 2013, 75, 197–207. [Google Scholar] [CrossRef] [Scilit]
  41. Bhattacharya, A.; Wang, Q.; Ao, H.; Shoblock, J.R.; Lord, B.; Aluisio, L.; Fraser, I.; Nepomuceno, D.; Neff, R.A.; Welty, N.; et al. Pharmacological characterization of a novel centrally permeable P2X7 receptor antagonist: JNJ-47965567. Br. J. Pharmacol. 2013, 170, 624–640. [Google Scholar] [CrossRef] [Scilit]
  42. Bickerton, G.R.; Paolini, G.V.; Besnard, J.; Muresan, S.; Hopkins, A.L. Quantifying the chemical beauty of drugs. Nat. Chem. 2012, 4, 90–98. [Google Scholar] [CrossRef] [Scilit] [PubMed]
  43. Schlichtkrull, M.; Kipf, T.N.; Bloem, P.; Van Den Berg, R.; Titov, I.; Welling, M. Modeling relational data with graph convolutional networks. In Proceedings of the European Semantic Web Conference; Springer: Heraklion, Greece, 2018; pp. 593–607. [Google Scholar] [CrossRef] [Scilit]
  44. Kipf, T. Semi-supervised classification with graph convolutional networks. arXiv 2016, arXiv:1609.02907. [Google Scholar] [CrossRef] [Scilit]
  45. Duvenaud, D.K.; Maclaurin, D.; Iparraguirre, J.; Bombarell, R.; Hirzel, T.; Aspuru-Guzik, A.; Adams, R. Convolutional Networks on Graphs for Learning Molecular Fingerprints. In Proceedings of the Advances in Neural Information Processing Systems 28 (NIPS 2015); Cortes, C., Lawrence, N., Lee, D., Sugiyama, M., Garnett, R., Eds.; Curran Associates, Inc.: Montréal, QC, Canada, 2015; Volume 28, Available online: https://proceedings.neurips.cc/paper_files/paper/2015/hash/f9be311e65d81a9ad8150a60844bb94c-Abstract.html (accessed on 30 July 2026).
  46. Bousmina, A.; Selmi, M.; Ben Rhaiem, M.A.; Farah, I.R. A hybrid approach based on gan and cnn-lstm for aerial activity recognition. Remote Sens. 2023, 15, 3626. [Google Scholar] [CrossRef] [Scilit]
  47. Trott, O.; Olson, A.J. AutoDock Vina: Improving the speed and accuracy of docking with a new scoring function, efficient optimization, and multithreading. J. Comput. Chem. 2010, 31, 455–461. [Google Scholar] [CrossRef] [Scilit] [PubMed]
  48. Dallakyan, S.; Olson, A.J. Small-molecule library screening by docking with PyRx. In Chemical Biology: Methods and Protocols; Springer: New York, NY, USA, 2014; pp. 243–250. [Google Scholar] [CrossRef] [Scilit]
  49. Madhavi Sastry, G.; Adzhigirey, M.; Day, T.; Annabhimoju, R.; Sherman, W. Protein and ligand preparation: Parameters, protocols, and influence on virtual screening enrichments. J.-Comput.-Aided Mol. Des. 2013, 27, 221–234. [Google Scholar] [CrossRef] [Scilit]
  50. Karasawa, A.; Kawate, T. Structural basis for subtype-specific inhibition of the P2X7 receptor. eLife 2016, 5, e22153. [Google Scholar] [CrossRef] [Scilit]
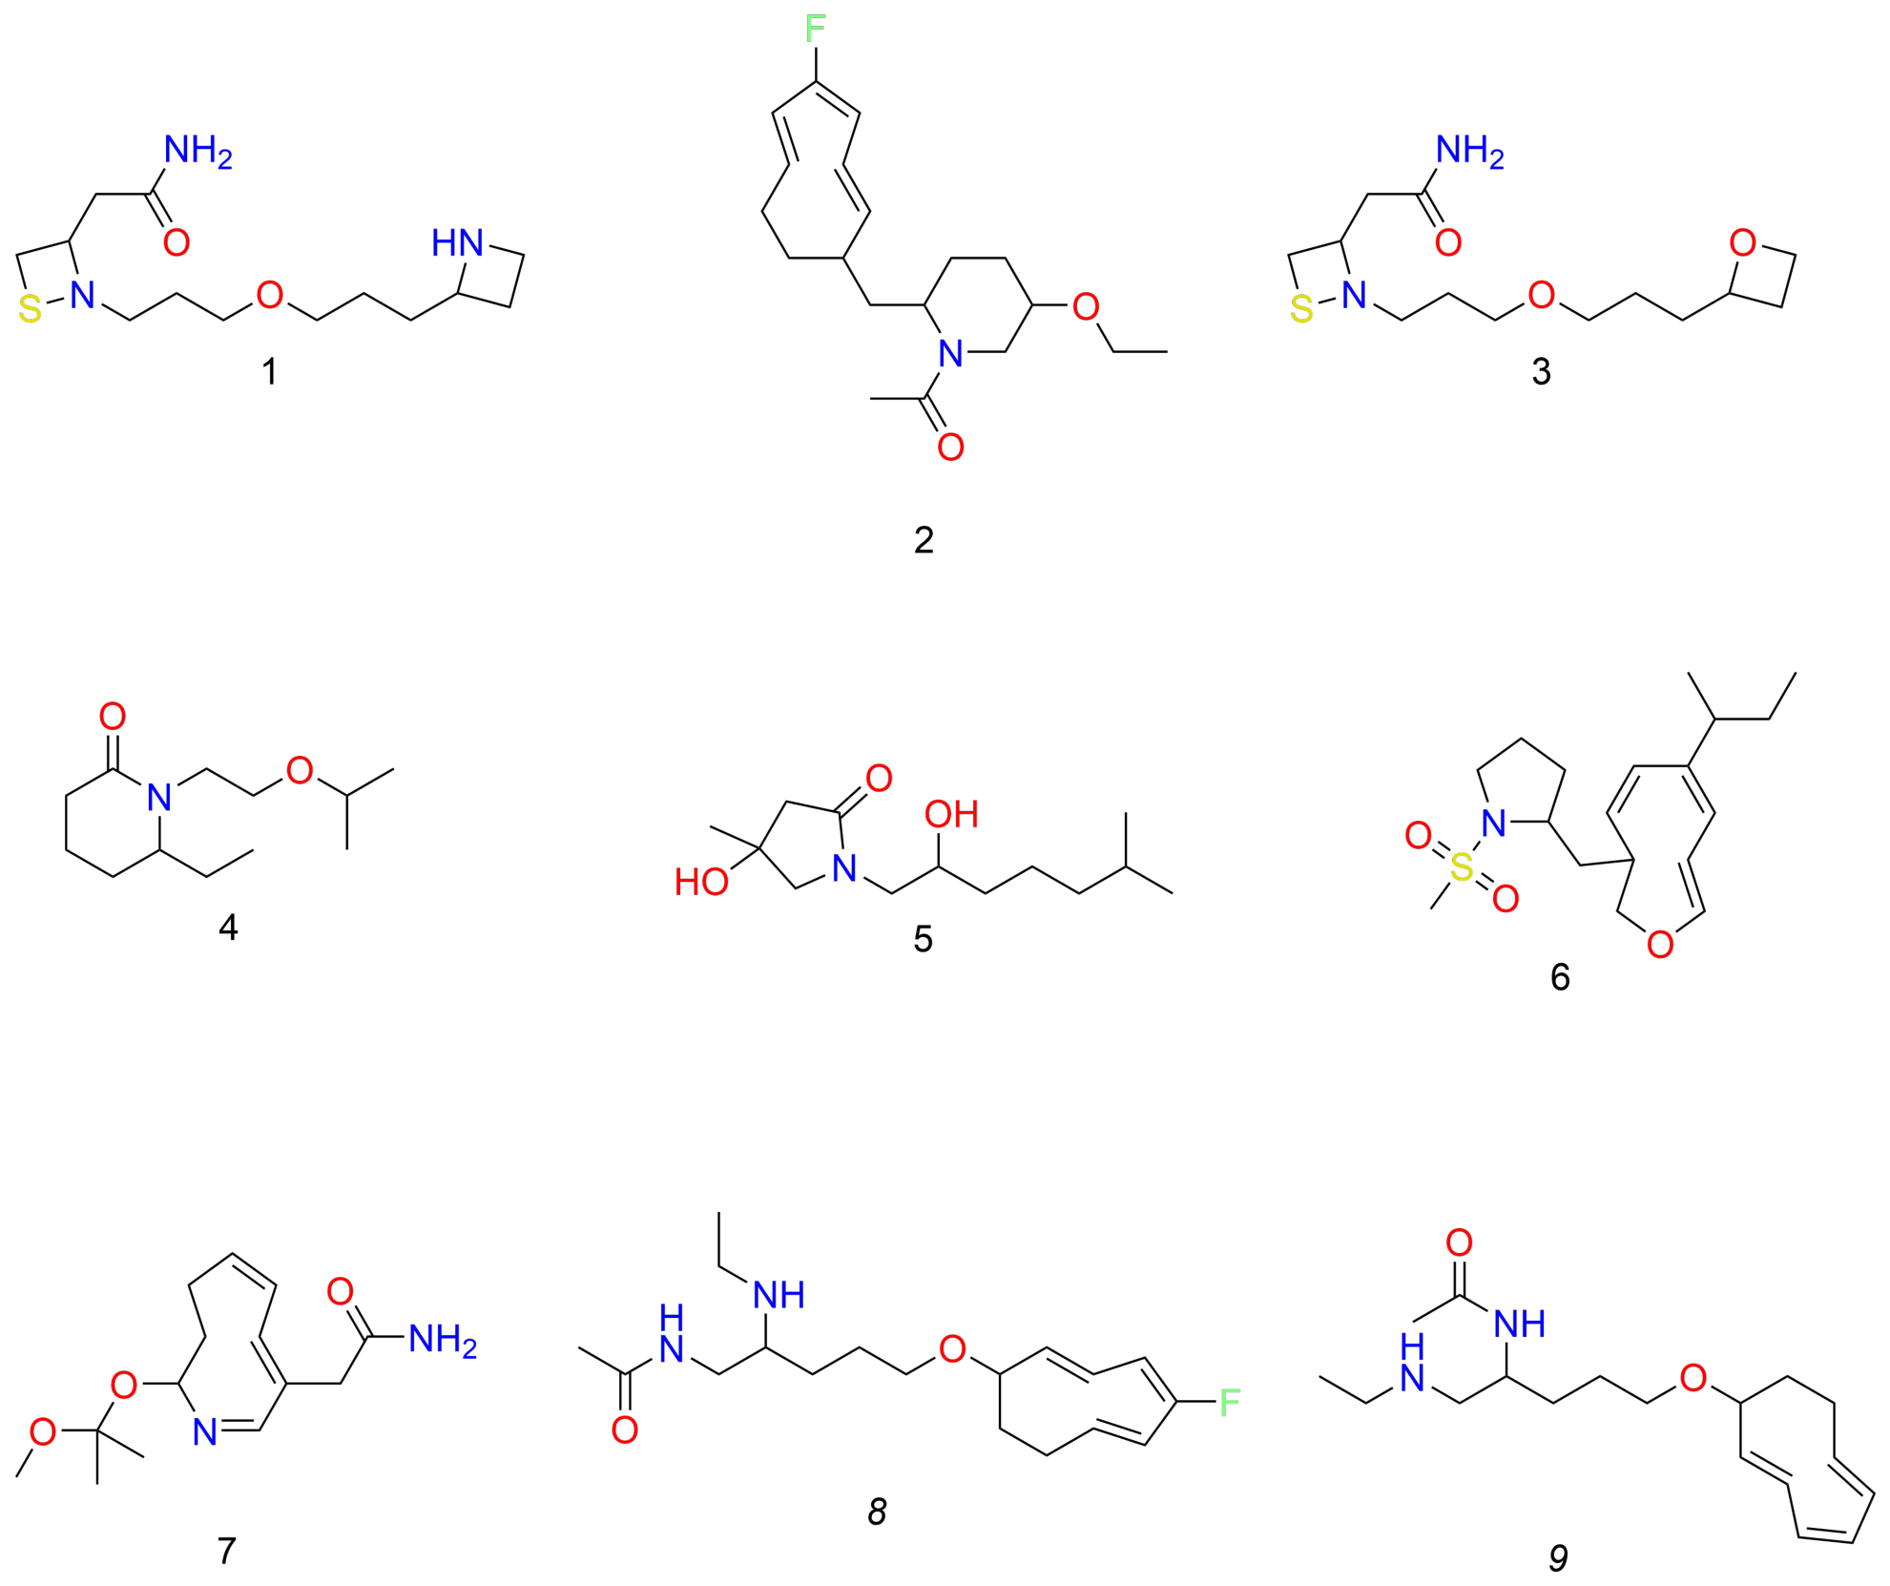
Figure 1. SMILES to molecules (novel molecules).
Ddc 05 00048 g001
Figure 2. Count of atoms per molecule (novel molecules).
Ddc 05 00048 g002
Figure 3. Count of different atoms (novel molecules).
Ddc 05 00048 g003
Figure 4. LogP distribution (novel molecules).
Ddc 05 00048 g004
Figure 5. QED distribution (novel molecules).
Ddc 05 00048 g005
Figure 6. Ro5 properties (novel molecules).
Ddc 05 00048 g006
Figure 7. Tanimoto test molecules sample.
Ddc 05 00048 g007
Figure 8. C20 ligand–receptor docking diagram.
Ddc 05 00048 g008
Figure 9. C9 ligand–receptor docking diagram.
Ddc 05 00048 g009
Figure 10. C20 2D Structure.
Ddc 05 00048 g010
Figure 11. C9 2D Structure.
Ddc 05 00048 g011
Figure 12. Schematic illustration of the methodology.
Ddc 05 00048 g012
Figure 13. Drugs molecules targeting P2X7 receptor (data seed).
Ddc 05 00048 g013
Figure 14. Nine randomly selected molecules from the training dataset (5000 SMILES).
Ddc 05 00048 g014
Figure 15. Count of atoms per molecule (5000 randomly selected SMILES).
Ddc 05 00048 g015
Figure 16. Count of atom type per molecule (5000 randomly selected SMILES).
Ddc 05 00048 g016
Figure 17. QED distribution (5000 randomly selected SMILES).
Ddc 05 00048 g017
Figure 18. LogP distribution (5000 randomly selected SMILES).
Ddc 05 00048 g018
Figure 19. RGCN illustration.
Ddc 05 00048 g019
Figure 20. WGAN illustration [46].
Ddc 05 00048 g020
Figure 21. P2X7 receptor (5U1X).
Ddc 05 00048 g021
Figure 22. Cleaned P2X7 receptor (5U1X).
Ddc 05 00048 g022
Table 1. Generative performance rates.
MoleculesCountPerformance (%)
Valid molecules449890
Unique molecules96821.5
Novel molecules38462.5
Table 2. Comparison between seed and generated novel molecules.
PropertySeed MoleculesGenerated Novel Molecules
LogPMostly 2.6–4.62Mostly 1.58–3.51
QED0.36% average0.65% average
Molecular Size21–60 atoms11–27 atoms
Drug-likeness (Ro5)56% compliant97% compliant
Table 3. Tanimoto similarity between the novel molecules and seed molecules.
Novel MoleculeSeed MoleculeSeed Molecule NameTanimoto Similarity
C1S1KN-620.6163
C2S2JNJ-479655670.6087
C3S3GSK-14821600.5714
C4S2JNJ-479655670.5714
C5S2JNJ-479655670.5588
C6S3GSK-14821600.5385
C7S3GSK-14821600.5373
C8S1KN-620.5341
C9S5AZ106061200.5303
C10S1KN-620.5269
C11S5AZ106061200.5238
C12S5AZ106061200.5231
C13S3GSK-14821600.5172
C14S3GSK-14821600.5172
C15S3GSK-14821600.5161
C16S4A-7400030.5152
C17S2JNJ-479655670.5132
C18S5AZ106061200.5079
C19S3GSK-14821600.5077
C20S5AZ106061200.5075
C21S6BzATP0.5059
C22S5AZ106061200.5000
C1S2JNJ-479655670.5000
C23S1KN-620.5000
C24S2JNJ-479655670.5000
C25S5AZ106061200.5000
C26S2JNJ-479655670.5000
C27S5AZ106061200.5000
Table 4. Novel molecule docking scores.
MoleculeBinding Affinity (kcal/mol)
C1−6.9
C2−4.8
C3−6.2
C4−5.2
C5−6.5
C6−6.7
C7−6.0
C8−6.9
C9−7.5
C10−5.0
C11−7.1
C12−7.2
C13−5.6
C14−6.1
C15−5.0
C16−6.0
C17−4.7
C18−6.7
C19−6.6
C20−8.1
C21−6.6
C22−6.7
C23−6.9
C24−4.7
C25−6.5
C26−5.0
C27−6.3
Table 5. Top-performing novel molecules ranked by docking score.
RankMoleculeBinding Affinity (kcal/mol)
1C20−8.1
2C9−7.5
3C12−7.2
4C11−7.1
Table 6. Seed molecule docking scores.
MoleculeBinding Affinity (kcal/mol)
S1−9.0
S2−6.6
S3−7.7
S4−7.4
S5−8.8
S6−8.5
Table 7. Molecule docking score statistics.
MoleculeMeanMedianStandard Deviation
Novel−6.20−6.500.9213
Seed−8−8.10.9273
Table 8. Synthetic accessibility, PAINS filtering, and ADMET assessment of the top generated molecules.
MoleculeMWHBAHBDTPSAQEDSynthPAINSlogSlogP
C1299.136386.350.7534−2.3332−0.2556
C2285.155369.280.6333−1.30150.1100
C3321.213029.540.7784−2.84502.8035
C4286.145266.480.6643−1.57080.5847
C5283.174360.050.6473−2.18341.3216
C6241.23140.540.7763−3.52833.4510
C7243.184260.770.7363−3.28712.0386
C8339.194046.610.7704−3.43083.4397
C9304.224250.360.8245−1.87400.8771
C10294.076283.550.8394−2.09660.4668
C11294.195267.430.7733−0.81450.2782
C12284.215267.430.7693−0.87610.2578
C13211.192020.310.6842−2.62793.0256
C14211.192020.310.6842−2.63113.0196
C15213.173029.540.7002−1.31681.2941
C16266.165273.910.7734−2.85581.9058
C17288.155266.480.6313−1.70450.8595
C18302.243241.130.8205−2.80292.0499
C19324.224250.360.6414−2.08331.5772
C20318.195267.430.7775−1.97590.8521
C21317.187288.460.5695−0.8392−0.2937
C22306.234250.360.6444−1.55811.5148
C23337.213037.380.7504−3.78503.9668
C24260.125266.480.5673−1.45540.6589
C25294.234250.360.8234−0.72410.7865
C26274.145266.480.6953−1.35090.9354
C27268.253241.130.8073−2.87022.7794
Note: – indicates that no PAINS alerts were detected.
Table 9. Mean and range of Table 8 results.
PropertyMeanRange
MW283.96211.19 to 339.19
HBA4.222 to 7
HBD1.630 to 3
TPSA55.5020.31 to 88.46
QED0.720.567 to 0.839
Synth3.522 to 5
PAINS
logS−2.10−3.785 to −0.724
logP1.49−0.294 to 3.967
Note: – indicates that no PAINS alerts were detected.
Table 10. Properties of the dataset.
DatasetAmountAtomic TypeBond Type
Fragmented data5000Cl, O, S, F, N, CSingle, Double, Triple, Aromatic
Disclaimer/Publisher’s Note: The statements, opinions and data contained in all publications are solely those of the individual author(s) and contributor(s) and not of MDPI and/or the editor(s). MDPI and/or the editor(s) disclaim responsibility for any injury to people or property resulting from any ideas, methods, instructions or products referred to in the content.