Abstract
The involvement of the prefrontal cortical dopaminergic system in the psychopathology of epilepsies and comorbid conditions such as autism spectrum disorder (ASD) still needs to be explored. We used autoradiography to study the D1-like (D1DR) and D2-like (D2DR) receptor binding density in the prefrontal cortex of normal Wistar rats and Wistar-derived strains with generalized convulsive and/or non-convulsive epilepsy. WAG/Rij rats served as a model for non-convulsive absence epilepsy, WAG/Rij-AGS as a model of mixed convulsive/non-convulsive form, and KM strain was a model for convulsive epilepsy comorbid with an ASD-like behavioral phenotype. The prefrontal cortex of rats with any epileptic pathology studied demonstrated profound decreases in binding densities to both D1DR and D2DR; the effects were localized in the primary and secondary anterior cingulate cortices, and adjacent regions. The local decreased D1DR and D2DR binding densities were independent of (not correlated with) each other. The particular group of epileptic rats with an ASD-like phenotype (KM strain) displayed changes in the lateral prefrontal cortex: D1DR were lowered, whereas D2DR were elevated, in the dysgranular insular cortex and adjacent regions. Thus, epilepsy-related changes in the dopaminergic system of the rat archeocortex were localized in the medial prefrontal regions, whereas ASD-related changes were seen in the lateral prefrontal aspects. The findings point to putative local dopaminergic dysfunctions, associated with generalized epilepsies and/or ASD.
1. Introduction
Dopamine (DA) is now one of the most mentioned neuromodulators in the literature as a substance of pleasure and reward [1,2,3]. DA participates in a wide spectrum of brain processes such as alertness, attention, cognition, memory, and mood modulation [4,5,6,7]. Studies of the brain’s dopaminergic system are made possible by a variety of different techniques [8]. One of the possible ways to explore the state of the dopaminergic system is to analyze the binding density to dopamine receptors (DRs).
It is traditionally accepted that DA acts through the six types of DRs, sub-classified as D1-like (D1 and D5) (D1DR) and the D2-like (D2short/long, D3, and D4) (D2DR) receptors [8,9,10]. These classes differ in their signaling pathways, cellular and anatomical distribution, as well as in their affinity for DA, and in their functions [7,11,12]. The impaired activity of DA and its receptors is a pathological factor for many neurological human brain diseases, the most frequently mentioned of which are Parkinson’s disease and schizophrenia [13,14,15,16]. There is growing evidence that an imbalance in neuromodulators, such as DA, can play a role in the development of both epileptic seizures and comorbid conditions. There is a traditional view (quite oversimplifying) that D1DRs have proconvulsant properties whereas D2DRs can mediate an anticonvulsant DA action [17,18].
In the concept of epilepsy, not only seizures themselves are important, but also their cognitive and emotional consequences [19,20,21]. It seems important to study how the state of the dopaminergic brain system changes in a particular cortical region, which is inextricably linked with both the cognitive and emotional components of goal-directed actions, the prefrontal cortex [22].
Despite different locations and complexities, many functions of the prefrontal cortex and its subregions are shown to be well conserved across species. This way, rodent research can provide valuable information about the functioning of these areas [23,24].
There is some research on the prefrontal cortex and epilepsy related to seizures originating from the particular prefrontal regions (cingulate or insular) [25,26], but less information available for other types of epilepsy. Presumably, prefrontal areas might be involved in the pathogenesis of cognitive and emotional disorders, often comorbid with different types of epilepsy [19,20,21].
We studied several related rat strains with different forms of genetic generalized epilepsy, all bred from normal rats of the Wistar strain. First, the WAG/Rij strain is recognized as one of the best validated genetic models of absence epilepsy. Absence seizures manifest as sudden attacks with generalized spike-wave EEG discharges and behavioral arrests [27,28,29]. The second group is, in fact, a sub-strain of WAG/Rij, WAG/Rij-AGS. These rats demonstrate both spontaneous absence non-convulsive seizures and convulsive audiogenic seizures in response to a sound provocation (audiogenic epilepsy) [30,31]. This sub-strain can be used as a model of the mixed forms of epilepsy. The third strain is the Krushinsky-Molodkina (KM) strain, with severe audiogenic convulsions: it serves as a model for human temporal lobe epilepsy [32,33,34]. That is, the group was characterized with a pure convulsive form of epilepsy. Thus, we compared three different models of genetic generalized epilepsy: convulsive, non-convulsive, and mixed type of epilepsy, and referred to the Wistar strain control. Since these epileptic strains are Wistar-derived, the between-strain differences unrelated to epilepsy are supposed to be small.
Previously, we have made comparative studies with the same design for several electrophysiological, behavioral, and neurochemical parameters [31,35,36,37,38,39]. In particular, we demonstrated that D1DR and D2DR binding densities display epilepsy type-specific changes in the brain’s striatal complex, as well as epilepsy type-nonspecific alterations [40].
Importantly, quite recently, we noticed pronounced social contact deficits in rats of the KM strain [41], consistently seen in a battery of social preference/social novelty tests [42]. Therefore, the KM strain was proposed as a model of autism spectrum disorder [41,42]. Autism spectrum disorders often comorbid with genetic epilepsy in clinical practice [43,44,45].
In the present study, we analyzed the local D1DR and D2DR binding densities in the prefrontal areas of rats with different forms of generalized epilepsy, as compared to healthy controls. The type-specific effects of epilepsies, as well as general (type-nonspecific) were estimated. Special attention was paid to the prefrontal regions, putatively engaged in the pathogenesis of the “autistic” phenotype (KM rats contrasted to “non-autistic” rats). There is a strong need to dissect possible neurophysiological mechanisms of autism spectrum disorders in human patients [46,47,48]. Analysis of data, collected in animal models, might shed new light on the neuronal loops involved in the pathophysiology of social deficits.
2. Materials and Methods
2.1. Animals
Adult male rats, aged 7–9 months and weighing 290–410 g, were utilized in the study. The rats were housed 4–6 per cage, maintaining a natural light-dark cycle with unrestricted access to water and food.
The study design mirrored previously published work [37,38,39]. Specifically, four experimental groups were established (Figure 1): healthy Wistar rats obtained from the Stolbovaya laboratory animal nursery (n = 5), WAG/Rij rats (descendants of the colony from Radboud University, Nijmegen, the Netherlands) with “pure” absence epilepsy (n = 5) and the mixed form of epilepsy (n = 5), and KM rats (from the colony bred on the Biological Faculty, Moscow State University, Russia) (n = 5).
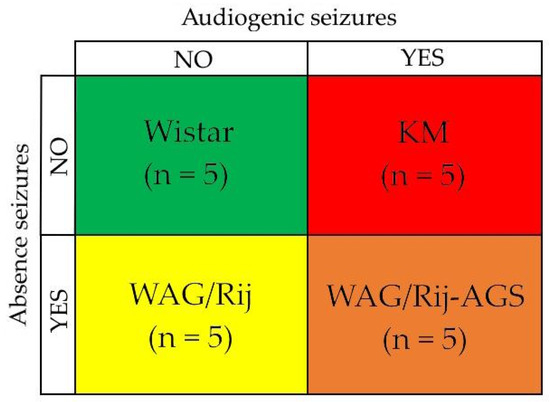
Figure 1.
The experimental design implies the comparison of four groups: Wistar control rats (no seizures), KM rats (audiogenic convulsive seizures only), WAG/Rij rats (absence non-convulsive seizures only). and WAG/Rij-AGS rats with mixed form of epilepsy (presence of both convulsive and non-convulsive seizures). “YES” means presence and “NO” means absence of the corresponding type of seizures. The color scheme used for the rat groups applies not only for Figure 1 but also for Figures 3 and 4 (the Section 3).
All experiments were conducted in accordance with the guidelines outlined in [49] and adhered to the requirements of the Institutional Animal Care Committee.
2.2. The Audiogenic Seizure Susceptibility Test
The audiogenic seizure susceptibility test was performed after three days of habituation to the experimental room, 3 times with a 7-day interval according to [50]. Animals were exposed to broad-spectrum mixed tones (13–85 kHz, 50–60 dB) administered for 90 s. Audiogenic seizures were rated according to Krushinsky’s scale [30,51].
2.3. Decapitation and Brain Dissection
Rats were decapitated under a deep general anesthesia. Their brains were quickly removed and immediately frozen in isopentane and kept on dry ice. Coronal slices (14 µm) were cut by cryotome at −18 °C at the following levels according to [52,53]:
I—AP + 2.39–2.51
II—AP + 0.17–0.19
III—AP − 0.25–0.33
Slices were mounted onto polylysine-coated slides (Menzel-Glaser, Braunschweig, Germany). Alternate sections were allocated to slides for total or nonspecific binding or for morphological control. Sections were dried at room temperature overnight and then stored at −20 °C until autoradiography.
The Nissl method was used to stain the control slices to be used for morphological control.
2.4. Autoradiography
D1DR and D2DR receptor autoradiography was done as described earlier [54], similar to our previous studies [40,55].
Sections for specific binding were incubated in the Tris-buffer containing:
- For D1DR—0.2 nM [3H]SCH 23390 (tritium-labeled non-selective DR antagonist for the D1 and D5 DR subtypes [8,56]; specific activity 66.0 Ci/mmol, Amersham) for 90 min at room temperature.
- For D2DR—0.4 nM [3H]spiperone (tritium-labeled non-selective DR antagonist for the D2 and D3 DR subtypes [8]; specific activity 109.0 Ci/mmol, Amersham) for 60 min at room temperature.
Tris-buffer for non-specific binding contained:
- For D1DR—0.2 nM [3H]SCH 23390 and 10−7 M cis-flupenthixol (non-specific D1/D2-antagonist according to the PDSP Ki Database [57]).
- For D2DR—0.4 nM [3H]spiperone, 10−5 M haloperidol (the inverse D2DR agonist according to the PDSP Ki Database [57]) and 10−5 M ketanserin (the high-affinity non-selective antagonist of 5-HT2 receptors according to the PDSP Ki Database [57], used to block the [3H]spiperone binding to 5-HT2 serotoninergic receptors [58]).
After the incubation, the slides were drained, washed two times for 5 min in the buffer at +4 °C, and briefly dipped two times into distilled water (+4 °C). Sections were dried at room temperature overnight and exposed to a tritium-sensitive film (3H Hyperfilm®, Amersham, UK) at −20 °C together with Amersham 3H Microscale Autoradiography Standards®, within 4 weeks for D1DR and 3 weeks for D2DR. Then, all films were developed, digitized, and analyzed with ImageJ (accessed on 12 June 2019, https://imagej.net/ij/) [59].
2.5. Measurements
The scanned images of autoradiography films were contrasted digitally to the level of clear distinction of prefrontal regions. The brain structures were identified according to [52,53]. Recognizing the difficulty of transitioning from the old nomenclature to the new one, we decided to use both versions in the text, figures, and tables.
Measurements were carried out in the medial and lateral aspects of the prefrontal cortex (Table 1), and the parcellation is shown in Figure 2.
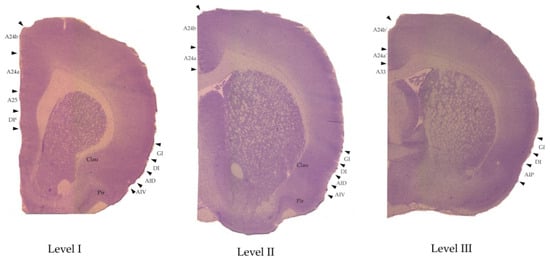
Figure 2.
The regions of interest marked on examples of the Nissle-stained brain slices that were made for the morphological control. The anatomical levels are AP: +2.39–2.51 (level I), +0.17–0.19 (level II), and −0.25–0.29 (level III) according to [52,53]. For abbreviations see Table 1.
We have to mention that even though our understanding of its anatomy and physiology has remarkably evolved over the past decades [60,61,62], the information about this area is still full of mysteries and contradictions. One of the issues is that there is still no single generally accepted agreement on frontal cortical delineation and nomenclature [52,63,64,65,66]. It has been recently proposed that the term “medial prefrontal” should be replaced by the terms “anterior cingulate” and “midcingulate cortex” [53,67], for the sake of translatability. Although there is a large amount of scientific literature using the “old” nomenclature [68], we decided to use the “new” one in our manuscript.
Two hemispheres of each brain section per rat per level were analyzed for local values of total and nonspecific binding. Specific binding values were obtained by subtraction of the nonspecific binding densities from the total binding ones.

Table 1.
List of studied areas of prefrontal cortex and adjacent areas with abbreviations and the comparison of the nomenclature used in the literature [52,63], modified according to [53].
Table 1.
List of studied areas of prefrontal cortex and adjacent areas with abbreviations and the comparison of the nomenclature used in the literature [52,63], modified according to [53].
| 6th Edition, 2007, [63] (The “Old” Nomenclature) | 7th Edition, 2014, [52] (The “New” Nomenclature) |
|---|---|
| Medial Prefrontal Cortex | Anterior Cingulate Cortex (ACC) |
| Infralimbic cortex IL | A25 |
| Prelimbic cortex PL | A24a (level I in our study) |
| Primary cingulate cortex Cing1 | A24b |
| Secondary cingulate cortex Cing2 | A24a (level II in our study) |
| Homologue of area 33 A33 | |
| Midcingulate cortex (MCC) | |
| Primary midcingulate cortex mCing1 | A24b’ |
| Secondary midcingulate cortex mCing2 | A24a’ |
| Lateral prefrontal cortex | Insular cortex |
| Granular insular cortex GI | Granular insular cortex GI |
| Dysgranular insular cortex DI | Dysgranular insular cortex DI |
| Dorsal agranular insular cortex AID | Dorsal agranular insular cortex AID |
| Ventral agranular insular cortex AIV | Ventral agranular insular cortex AIV |
| Posterior agranular insular cortex AIP | Posterior agranular insular cortex AIP |
| Adjacent structures | Adjacent structures |
| Dorsal peduncular cortex DP | Dorsal peduncular cortex DP |
| Claustrum Clau | Claustrum Clau |
| Piriform cortex Pir | Piriform cortex Pir |
The lettering a, b and a’, b’ denotes, correspondingly, the following subregions of anterior cingulate cortex (A24): the prelimbic and secondary cingulate coretx, primary cingulate cortex, secondary midcingulate cortex, and primary midcingulate cortex, according to [52,63].
The obtained values of optical densities were converted into pmol/g of tissue by using the microscale standards (see Section 2.4).
For illustrative purposes, the autoradiograms were processed using the effect of a thermal imager (accessed on 14 June 2019, https://www.imgonline.com.ua/add-effect-thermal-imager.php).
2.6. The Statistical Analysis
The statistical analysis was performed with Statistica 10.0 (TIBCO Software Inc., Palo Alto, CA, USA). Values are shown as means ± SEM.
The analysis of D1DR and D2DR binding densities in a defined cortical region was performed for each anatomical level separately, using ANOVA GLM (General Linear Models), as described earlier [39,40]. Briefly, to account for variations caused by non-homogeneities of the films, the local background levels were taken as continuous GLM predictors, while the “rat group” and “films’ IDs” were taken as categorical predictors; the effects of background and films are not reported below. If the “rat group” factor was significant, the analysis proceeded further. ANOVA GLM for regional data was run with the epilepsy type (audiogenic seizures and/or absence seizures, 2 × 2 design) as the two between-subjects factors (Figure 1). Anatomical levels were analyzed separately; two brain hemispheres were taken as within-subjects factors, so a repeated-measures analysis was used. The analysis provided information about the general effect of audiogenic seizures/absence seizure susceptibilities, as previously carried out [39,40]. The putative effects of audiogenic seizures were checked by comparing the pooled group of KM and WAG/Rij-AGS rats with the pooled group of audiogenic seizure-unsusceptible rats (i.e., WS and WAG/Rij). The effects of absence seizures’ proneness were estimated by comparing the pooled groups of WAG/Rij and WAG/Rij-AGS rats with the pooled groups of WS and KM rats. The significant audiogenic seizures*absence seizures interaction was a reason to run the post hoc analysis (Tukey HSD test) for the rat groups, and consider re-grouping in a further analysis. Namely, if the audiogenic seizures*absence seizures interaction was significant, and the control group (Wistar rats) differed/tended to differ from all the epileptic groups in post hoc tests, we analyzed the general impact of epilepsy. The effect (named below as “factor EPILEPSY”) was assessed by comparing normal Wistar rats with the pooled data of the three groups of epileptic rats (i.e., KM, WAG/Rij, and WAG/Rij-AGS). If the audiogenic seizures*absence seizures interaction was significant, and the “autistic” rats differed/tended to differ from all the “non-autistic” groups in post hoc tests, we considered the analysis of the autism spectrum disorder-like phenotype. Its general effect (named below as “factor AUT”) was assessed by comparing the “non-autistic” group (pooled Wistar, WAG/Rij and WAG/Rij-AGS rats) with the group of socially deficient rats (i.e., KM). For these cases, general GLM ANOVAs were followed by post hoc tests (Unequal N HSD test). The minimal level of significance was set at p = 0.05.
The groups were pooled together to increase the translatability of the research: a comparison of the focus group to the two or three pooled control groups is less likely to bring false-positive results (i.e., between strain differences, not related to the variable of interest), than a comparison with one control group. This design was used in our previous studies [39,40].
3. Results
3.1. The D1DR Binding Density
The general distribution of D1DR within the prefrontal territories studied is in line with the previously published data [33,47] and illustrated in Figure 3. Briefly, the regions studied displayed a moderate binding to D1DR, with the maximal values seen in the claustrum (Figure 3). The rostro-caudal gradients were mild for D1DR binding densities. The rat groups differed in local levels of D1DR binding densities, with most of the variations being explained by the proneness to epilepsy or to the social behavioral phenotype.
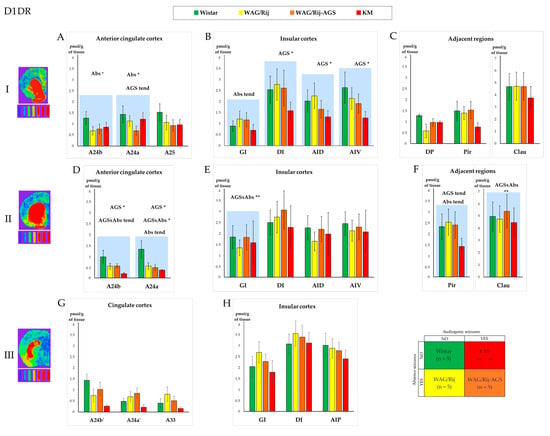
Figure 3.
Comparison of the D1 dopamine receptors’ (D1DR) regional binding densities in the prefrontal cortex and adjacent regions between the four experimental groups (see Section 2, Section 2.1 and Section 2.6; the experimental design is shown in the lower right corner; the color codes for the rat groups are given above the charts). The values are given as mean ± SEM, in pmol/g of tissue (y axis). The lines of the charts correspond to anatomical levels which are AP: +2.39–2.51 (level I—first line of charts top down), +0.17–0.19 (level II—the second line), and −0.25–0.29 (level III—the last line) according to [52,53]. Next to level numbers are examples of brain slices from the corresponding levels, processed with a thermal imager. Graphs (A,D,G) show D1DR density for the anterior cingulate and midcingulate cortices, graphs (B,E,H)—insular cortex and graphs (C,F)—show D1DR density in regions adjacent to the prefrontal cortex. The anatomical abbreviations (x axis) are as follows: GI—the granular insular cortex; DI—the dysgranular insular cortex; AID—the dorsal agranular insular cortex; AIV—the ventral agranular insular cortex; DP—the dorsal peduncular cortex; Pir—the piriform cortex; Clau—Claustrum. Differences are denoted by * for p ≤ 0.05, **—for p ≤ 0.01 and “tend” for tendency (0.05 < p < 0.10). The “AGS” sign marks the effect of the audiogenic seizures’ presence, and the “Abs” sign marks the effect of the absence epilepsy. The charts for the areas with significant differences in D1DR densities are marked by blue shading. The tritium-labeled standards (microscales, Amersham, UK) are shown below the brain images and refer to the following values: 0.043 nCi/mg; 0.099 nCi/mg; 0.179 nCi/mg; 0.333 nCi/mg; 0.598 nCi/mg; 1.374 nCi/mg; 2.01 nCi/mg, from left to right, respectively. For more information, see the Supplementary Table S1A–F.
Absence-epileptic WAG/Rij rats demonstrated a decreased D1DR binding in the A24a region of the prefrontal cortex (Figure 3A and Figure 6A; Table S1A), mostly due to the high values of normal control rats (which were statistically different from the pooled group of epileptic rats; see below Section 3.3). A tendency towards absence seizure-related elevation was observed in the granular insular cortex (Figure 3B).
The convulsive form of epilepsy (audiogenic seizures), was associated with a decrease in D1DR binding in the rostral divisions of the insular cortex in both agranular insular dorsal (AID) and ventral (AIV) areas (Figure 3B, Table S1B). The cingulate regions demonstrated an audiogenic seizure-related decrease, together with a tendency towards an audiogenic seizures*absence seizures interaction (Figure 3D), also because of a significant difference between the normal group and epileptic ones. These effects are discussed below (Section 3.3).
3.2. The D2DR Binding Density
The distribution of local binding densities to D2DR is shown in Figure 4. In general, the cortical pattern of D2DR binding agrees with the other studies [33,47,49]. In brief, the prefrontal cortex, as well as the claustrum, revealed noticeable levels of D2DR binding densities, with a clear and typical laminated pattern (Figure 4).
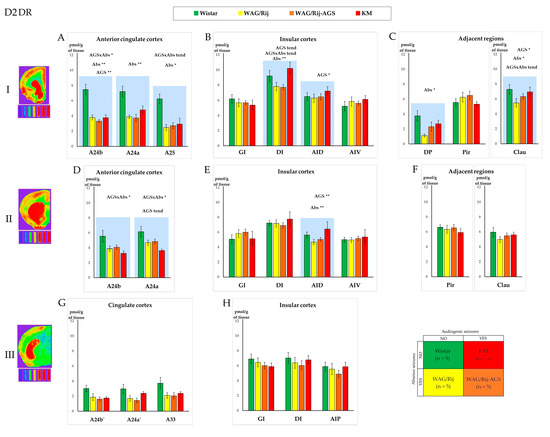
Figure 4.
Comparison of the D2 dopamine receptors’ (D2DR) regional binding densities in the prefrontal cortex and adjacent regions between the four experimental groups (see Section 2, Section 2.1 and Section 2.6; the experimental design is shown in the lower right corner; the color codes for the rat groups are given above the charts). The values are given as mean ± SEM, in pmol/g of tissue (y axis). The lines of the charts correspond to anatomical levels which are AP: +2.39–2.51 (level I—first line of charts top down), +0.17–0.19 (level II—the second line), and −0.25–0.29 (level III—the last line) according to [52,53]. Next to level numbers are examples of brain slices from the corresponding levels after processing with the effect of a thermal imager. Graphs (A,D,G) show D2DR density for the anterior cingulate and midcingulate cortices, graphs (B,E,H) show insular cortex, and graphs (C,F) show D2DR density in some regions adjacent to prefrontal cortex. The anatomical abbreviations (x axis) are as follows: GI—the granular insular cortex; DI—the dysgranular insular cortex; AID—the dorsal agranular insular cortex; AIV—the ventral agranular insular cortex; DP—the dorsal peduncular cortex; Pir—the piriform cortex; Clau—Claustrum. Differences are denoted by * for p ≤ 0.05, **—for p ≤ 0.01 and “tend” for tendency (0.05 < p < 0.10). The “AGS” sign marks the effect of the audiogenic seizures presence, and the “Abs” sign marks the effect of the absence epilepsy. The charts for the areas with significant differences in D2DR densities are marked by blue shading. The tritium-labeled standards (microscales, Amersham, UK) are shown below the brain images and refer to the following values: 0.043 nCi/mg; 0.099 nCi/mg; 0.179 nCi/mg; 0.333 nCi/mg; 0.598 nCi/mg; 1.374 nCi/mg; 2.01 nCi/mg, from left to right, respectively. For more information, see the Supplementary Table S2A–F.
Absence-epileptic WAG/Rij rats demonstrated a decreased D2DR binding in the A24a region of the prefrontal cortex (Figure 4A, Table S2A), dysgranular insular cortex (Figure 4B), agranular insular cortex (Figure 4E), and the dorsal peduncular cortex (Figure 4C). In the case of the cingulate regions, the difference was rather nonspecific to epilepsy type, since the audiogenic seizures*absence seizures interaction effects were prominent (Figure 4). Such cases were further analyzed in post hoc tests (see Section 3.3 and Section 3.4) and ANOVAs with “factor EPILEPSY” or “factor AUT” as categorical predictors. The general effects of epilepsies and the autism spectrum disorder-like phenotype are discussed below (Section 3.3).
3.3. The General Effect of Epilepsies
We noticed some general impact of epilepsy on D1DR and D2DR systems, and a similar pattern was recently reported for H3 histamine autoreceptors [39]. In the anterior cingulate cortex, the three groups of epileptic rats (KM, WAG/Rij, and WAG/Rij-AGS) did not majorly differ from each other, but displayed a concordant decrease in local binding densities (Figure 3A,D). Being pooled to form an “epileptic” group (white bars in Figure 5) and compared to the control mother strain (Wistar rats, green bars in Figure 5), the rats with genetic generalized epilepsy demonstrated a significant decrease in D1DR and D2DR binding densities (Figure 3 and Figure 4 and Tables S1 and S2), as measured in regions A24a, A24b, and A25.
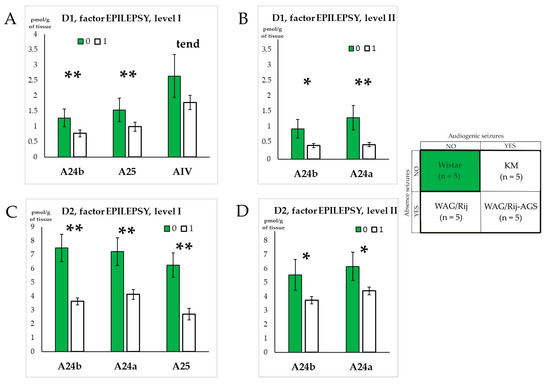
Figure 5.
Effects of genetic generalized epilepsy in D1DR and D2DR binding densities. Graphs (A,B) show structures for which the D1DR density was significantly different for rats with epilepsy on levels I and II, respectively. Graphs (C,D) show structures for which the D2DR density was significantly different for rats with epilepsy on level I and II, respectively. “0” = no epilepsy, “1”—the presence of epilepsy. The anatomical abbreviations (x axis) are as follows: AIV—the ventral agranular insular cortex. Differences are denoted by * for p ≤ 0.05, **—for p ≤ 0.01 and “tend” for tendency (0.05 < p < 0.10).
In all, the effects of generalized epilepsies in the present study were seen as fainted binding (Figure 6), specifically localized in the regions of the anterior cingulate prefrontal cortex, and found both for the D1DR and D2DR systems. To check whether such a concordant decrease might be related to a secondary factor (like the mechanical qualities of brain tissue), we ran a correlation analysis of the whole dataset (Table 2A,B). The results show that the D1DR and D2DR subsets were largely independent, both for the control and epileptic rats’ subsets.
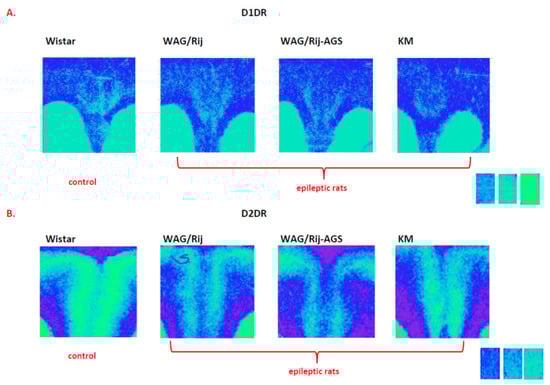
Figure 6.
Examples of D1DR (A) and D2DR (B) binding densities in the anterior cingulate cortex of epileptic individuals (right) and non-epileptic ones (left), taken from the same glass slide. The standards are shown on the right and corresponds to the following values: 0.043 nCi/mg; 0.099 nCi/mg; 0.179 nCi/mg. Note the fainted binding densities in the cingulate regions of the epileptic cohorts. For more information, see Figure 5 and Supplementary Tables S1A,C and S2A,D.
Table 2.
A,B Spearman rank order correlation coefficients for significant (p < 0.05) inter-correlations between the regional D1DR and D2DR binding densities, measured in the cingulate (upper left corners) and insular (lower right corners) prefrontal cortex in the normal (A) and epileptic (B) rat cohorts. Prefrontal regions are given in the dorsoventral anatomical order, and abbreviated as follows: DP—the dorsal peduncular cortex; GI—the granular insular cortex; DI—the dysgranular insular cortex; AID—the dorsal agranular insular cortex; AIV—the ventral agranular insular cortex; Pir—the piriform cortex; Clau—Claustrum.
3.4. Effect of Social Phenotype
A similar analysis (ANOVA GLM followed by post hoc “Uneven N HSD” tests) was made to assess the difference between the three groups of “non-autistic” rats (i.e., Wistar, WAG/Rij, and WAG/Rij-AGS) and the rats with an autism spectrum disorder-like phenotype (i.e., KM rats), if the audiogenic seizures*absence seizures interactions were significant, or tended to be significant in the analysis of audiogenic seizures and absence seizures effects (Section 3.1 and Section 3.2). This was performed if KM rats differed, or tended to differ, from the three other “non-autistic” cohorts. We found that the regions affected by the “factor AUT” were mainly structures of the insular cortex: the dysgranular and dorsal agranular insular cortex, together with the neighboring claustrum and piriform cortex (Figure 7 and Figure 8, Tables S1 and S2). The effects for D1DR were opposite to those seen for D2DR. The pooled group of “non-autistic” rats demonstrated higher binding densities to D1DR in the dysgranular insular cortex and the two adjacent areas (claustrum and piriform cortex) as compared to socially deficient KM rats (Figure 7A,B; Tables S1 and S2). In contrast, the group of “non-autistic” rats was lower in local binding to D2DR, as measured in the dorsal agranular insular cortex and the dysgranular insular cortex (Figure 7C,D; Tables S1 and S2).
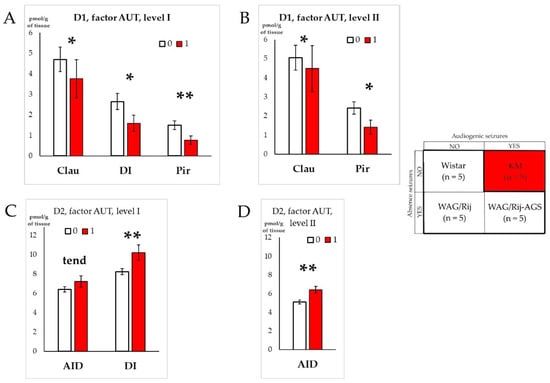
Figure 7.
Impacts of autism spectrum disorder-like phenotype on D1DR and D2DR binding densities. Graphs (A,B) show structures for which the D1DR density significantly differed between rats with autism spectrum disorder-like phenotype (red bars) and “non-autistic” rats (pooled group, white bars), on anatomical level I and II, respectively. Graphs (C,D) show structures for which the D2DR density significantly differed between the rats with autism spectrum disorder-like phenotype (red bars) and “non-autistic” ones (white bars), on anatomical level I and II, respectively. “0” = “non-autistic” social traits, “1”—ASD-like phenotype. The anatomical abbreviations (x axis) are as follows: DI—the dysgranular insular cortex; AID—the dorsal agranular insular cortex; Pir—the piriform cortex; Clau—Claustrum. Differences are denoted by * for p ≤ 0.05, **—for p ≤ 0.01 and “tend” for tendency (0.05 < p < 0.10).
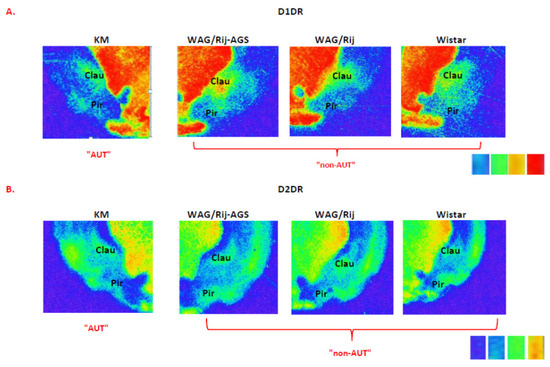
Figure 8.
Examples of D1DR (A) and D2DR (B) binding densities in the insular cortex of an “autistic” individual (left) and “non-autistic” ones (right), taken from the same glass slide. The standards are shown on the right, and correspond to the following values: 0.099 nCi/mg; 0.179 nCi/mg; 0.333 nCi/mg; 0.598 nCi/mg. Note the fainted binding to D1DR in the claustrum and the insular cortex of the “autistic” individual, but increased D2DR binding in the claustrum and the insular cortex of the “autistic” individual, as compared to the “non-autistic” cohorts. For more information, see Figure 7 and Supplementary Tables S1B,D and S2B,D.
3.5. Correlations between Local Binding Densities to D1DR and D2DR within the Prefrontal Regions
The subsets of local values for D1DR and D2DR binding densities were studied using nonparametric analysis (Spearman rank order), to observe the putative functional interrelations of the prefrontal regions, and outline possible artifacts. The Rs values (Spearman coefficients) for normal and epileptic groups are given in Table 2A,B, respectively.
The results demonstrated majorly independent local patterns seen for D1DR and D2DR local bindings (lower left quadrants of Table 2A,B).
The D1DR data were closely interrelated since the majority of regions revealed significant positive correlations (upper left quadrants of Table 2A,B). This means that a local value for D1DR in a region of the prefrontal cortex might serve as a predictor for any other D1DR local binding density; remarkably the cingulate and insular aspects of the prefrontal cortex were well correlated.
The correlation pattern seen for the D2DR subset (lower right quadrants of Table 2A,B) was more complex and demonstrated a lower number of links; it split the cingulate and insular subregions. The D2DR binding density patterns largely correlated within the insular aspects of the prefrontal cortex, but this was less clear for the cingulate ones.
4. Discussion
We found differences in D1-like and D2-like dopamine receptors in areas of the prefrontal cortex between the four groups. To better understand the possible meaning of these differences, one needs a reference to these areas’ functions.
The anterior cingulate cortex participates in the coordination of autonomic activities, internal responses to noxious stimulation, emotional states, and memories [69,70,71]. Area 24b is involved in emotional vocal expression. Pain processing is often referred to the prelimbic regions [67].
The insular cortex is known for interoception, but it is also involved in decision-making under all kinds of risks [24]. It is divided into three areas based on the presence or absence of the granular cortical layer IV: granular, dysgranular, and agranular insular cortex [53,72]. These areas differ in their connectivity because of the cytoarchitectural difference and, therefore, in their functions. Also, the division along the anterior-posterior axis was shown across species. In humans and primates, the central insular sinus separates the anterior part from the posterior, whereas in rodents the consensus boundary for these subdivisions is at the bregma. It seems that the posterior insular cortex receives inputs mainly from the visceral thalamic sensory nuclei and therefore acts more like the primary somatosensory cortex [73]. The anterior insular cortex is more reciprocally connected with limbic structures and particularly the core of the nucleus accumbens. It participates in motivated behavior, unlike the posterior insular cortex [73]. It is hypothesized that the posterior insular cortex participates mainly in the assessment of the body’s physiological condition, whereas the anterior insular cortex is important for the subjective feeling of the body, emotional states, and also for reward-seeking behavior [24,74,75,76,77].
As a modulator, DA cannot be ascribed to any particular prefrontal function, but it plays a critical role in three main areas: movement, cognition (especially memory), and affect. It was postulated that DA facilitates working memory through D1DR with the inverted-U mode of action, and both excessive and insufficient D1DR activation can harm prefrontal cortical functions [78].
Generally, our findings align with the established distribution of dopamine receptors (DR) in the prefrontal cortex. The relatively lower density of DR in the prefrontal cortex, when compared to the basal ganglia, may account for reduced responsiveness to both dopamine agonists and antagonists within this brain region [78]. In this study, the local binding densities of D1 dopamine receptors (D1DR) and D2 dopamine receptors (D2DR) exhibited poor inter-correlation in both normal and epileptic rat groups (Table 2A,B). Previously, significant inter-correlations between D1DR and D2DR receptor densities were observed within the dorsal and ventral striatum territories of normal Wistar rats and WAG/Rij rats [40]. However, this pattern was disrupted in audiogenic seizure-susceptible rats (KM and WAG/Rij-AGS), hinting at the additional regulation of dopaminergic neurotransmission linked to audiogenic seizures experience [40]. A similar anticipated effect for the prefrontal sub-regions, assuming a common source of dopaminergic innervation from the ventral tegmental area [79], did not materialize. Instead, the local densities of D1DR and D2DR binding represented independent datasets. This suggests that regionally available dopamine might not be the primary determinant for setting the levels of D1DR and D2DR binding. Indeed, the functional significance of non-dopaminergic systems in influencing the regional expression of prefrontal dopamine receptors is extensively discussed in the literature.
An intriguing exception is the D2DR binding density in the granular insular cortex of epileptic (but not control) rats, which was positively correlated with the majority of other prefrontal regions (bold numbers in Table 2B). DA neurotransmission in the granular insular cortex is known to reduce various types of pain [80]. It was demonstrated that the pain threshold in WAG/Rij rats was significantly lower than in Wistar rats, in a variety of tests [81]. Unfortunately, there are no data about the pain system in KM rats. The increased coupling between the granular insular cortex and other prefrontal regions might hint that the processing of pain-related stimuli in an epileptic brain would also affect other prefrontal functions. Further studies will help to clarify this question.
4.1. Effects of Specific Epilepsy Types
The prefrontal regions studied are not directly involved in the generation of seizures of absence and/or audiogenic epilepsies. These types of seizures are triggered by a few spikes in the perioral somatosensory cortex or inferior colliculus, respectively, and then quickly generalize over the brain [33,82]. For non-convulsive absence epilepsy, there is a theory that DA-ergic neurons in the substantia nigra pars compacta inhibit the GABAergic projections from basal ganglia to the thalamus and therefore cause disinhibition of thalamic neurons [83].
Recently, we have shown that a particular layer of the motor cortex (L2/3) is affected by audiogenic seizures: the binding density to H3 histamine receptors was decreased in the AGS-susceptible subgroups of the same dataset [39]. Although the lamination is less pronounced for D1DR and D2DR than for H3 ones, it is still possible that in the future, a more detailed analysis will help us to further localize the specific effects reported here.
Usually, research concerning DR density and epilepsy focuses mainly on brain areas directly or indirectly involved in seizure generation. Thus, for convulsive epilepsy, the D2DR decrease and D1DR increase was found in the neocortex and the basal ganglia of human patients with temporal lobe epilepsy [84,85]. The same D2DR alteration was shown for the caudate-putamen of pilocarpine-treated rats [86] and KM rats [87]. The D2DR-related DA-ergic dysregulation was shown in different brain areas of kindled rats [88].
There were many signs of the brain DA-ergic system alteration in WAG/Rij rats [36,89,90,91,92]. The DR density was studied in the neocortex and basal ganglia [40,55].
It is established that the mesoprefrontal dopamine (DA) subsystem has been recognized as a functionally and pharmacologically distinct entity, particularly in rodents [78]. Given that dopaminergic pathways to this region primarily arise from the ventral tegmental area (VTA) rather than the substantia nigra [78,93], it becomes intriguing to explore the dopaminergic system within the VTA as well.
The changes in DR binding densities, reported in our study, might be attributed to the behavioral comorbidities of epilepsies, found in a significant part of patients and affecting their quality of life [43,44,94]. Possibly, the dopaminergic changes found in the cingulate regions (Figure 3A,B and Figure 4A) might be majorly attributed to depressive-like behavioral traits found in WAG/Rij rats [95] and KM rats [96]. The regions have a lowered tissue DA content, which was attributed to a depression-like phenotype [97], and the lowered binding densities to D1DR and D2DR (Figure 6 and Figure 7). Spike-wave discharges of absence epilepsy spread to the cingulate prefrontal regions in WAG/Rij rats [98]. Thus, the insufficient dopaminergic neurotransmission in the cingulate regions might be a substrate of the behavioral depression comorbid epilepsy in WAG/Rij and KM rats [95].
As mentioned above, our results can be related to the changes in the pain system. The pain syndromes are common comorbid conditions in patients both with epilepsy and depression [94,99]. It seems that DR binding densities in the prefrontal cortex areas referable to the pain processing system [80,100], demonstrated changes for different generalized epilepsy types. Non-convulsive epilepsy seems to be more connected with changes in the prelimbic cortex, whereas audiogenic seizures are more related to the alterations in the agranular cortex (Figure 3 and Figure 4). It would be interesting to explore the pain system in AGS-WAG/Rij and KM rats using the same variety of tests as conducted for WAG/Rij rats [81] to elucidate the possible differences in the pain processing and comorbid conditions. The cortical layers of the prefrontal cortex differ in the density of DR bindings (Figure 6 and Figure 8). This is in line with the known laminar DR distribution in the prefrontal cortex [78,101].
4.2. Effects of Generalized Epilepsies
We recently described a prominent decrease in local binding densities to H3 histamine receptors, seen in the same set of experimental animals [39]. Namely, structures of cingulate and insular aspects of the prefrontal cortex demonstrated a widespread and significant fainting in local binding densities to H3 histamine receptors: the primary cingulate and secondary midcingulate areas, the dorsal agranular cortex, and the granular and dysgranular cortexes [39].
Here, we saw a more localized decrease in brain DR binding sites; the effects of “epilepsy” on binding to D1DR and D2DR were predominantly seen in the medial areas (Figure 5). Correlation analysis showed that the local decreases in binding to D1DR were not dependent on those seen for D2DR (see Section 4.3 and Table 1). So, we might hypothesize that the observed 15–50% lowering in anterior cingulate binding to D1DR and D2DR does not stem from a single process. Considering the wider pattern of receptor binding decrease seen for H3 histamine receptors in the same animals [39], it is possible to expect an epilepsy-related multi-staged degeneration of the brain’s aminergic systems. The local cortical histamine and DA are functionally linked, since an H3-reverse agonist significantly increased extracellular DA concentration in the rat prefrontal cortex [102]. Neuroinflammation, involving histaminergic steps, would be a putative candidate for triggering such a multi-step diffuse lowering of the cortical aminergic tone. It is reported that proinflammatory cytokines are involved in the pathogenesis of audiogenic epilepsy in KM rats [103], and absence epilepsy in WAG/Rij rats [104,105,106].
The reduced dopaminergic activity was associated with a tendency to an increase in aggressive behavior in epilepsy patients treated with levetiracetam [107,108]. Therefore, it would be interesting to study aggressive behavior in epileptic rats with different antiepileptic regimes. Cognitive impairment, the most common side effect of antiepileptic drugs, especially with poly-therapy, was associated with lower D2DR activity in the prefrontal cortex in pediatric patients [109]. Also, the low D2DR function in the prefrontal cortex was related to social anxiety or social phobia, whereas the abnormally high D2DR function was related to symptoms of attention deficit hyperactivity disorder [110]. So, the dopaminergic tone in the cingulate prefrontal cortex shows alterations, common for both convulsive and non-convulsive epilepsy types, and might be a substrate for emotional and behavioral dysregulations, as found in people with epilepsy.
4.3. Effects of the Social Phenotype
It has been demonstrated that rats with any form of epilepsy, like humans, show various comorbid conditions [95,111,112,113] which makes the animal models both more valid and valuable and, at the same time, more difficult in terms of interpreting the results.
The comparison of KM rats (with the “autistic” phenotype) versus the pooled cohort of the three groups (i.e., Wistar, WAG/Rij, WAG/Rij-AGS) of “non-autistic” rats, resulted in a specific pattern of D1DR and D2DR bindings (Figure 7 and Figure 8). Namely, the regions of the insular cortex together with the neighboring claustrum were altered in KM rats as compared to the “non-autistic” group (Figure 7, Tables S1B,D, and S2B,D). Interestingly, this putatively autism spectrum disorder-related pattern was specifically localized in the insular aspects of the prefrontal cortex. The insular cortex serves as a convergence point for interoceptive sensory input and emotional processing within limbic circuits [101,114]. In humans, the insular cortex is often referred to as a structure responsible for “embodied emotions” [114]. While drawing conclusive remarks on the dopaminergic effects within the “autistic” phenotype is premature at this stage, further research is needed to elucidate this matter. Given that significant differences in the insular cortex between KM rats and other groups primarily manifest in the levels of rostral to bregma (Tables S1 and S2), we hypothesize that the dopaminergic system of the anterior, but not the posterior, insular cortex undergoes changes associated with the autism spectrum disorder-like behavioral phenotype. This may be linked to the impaired reward-connected behavior observed in KM rats [41,42]. However, the results presented above do not lead to a straightforward conclusion regarding the neurochemical correlates of social deficits, as the KM strain is also characterized by arterial hypertension [115,116], which may be related to dopaminergic dysfunctions in the insular regions. In the literature, the caudal insular region, specifically the posterior agranular insular cortex, is considered responsible for arterial pressure regulation in rats [117], but our study did not reveal altered binding densities to D1 dopamine receptors (D1DR) or D2 dopamine receptors (D2DR) in this region (Figure 3H and Figure 4H). In general, the granular and dysgranular insular cortices are referred to as the primary interoceptive cortex [118], and the agranular regions of the insular cortex are referred to as the association sensory cortex [118,119]. We might hypothesize that the interoception is rather dysfunctional in KM rats. This does not contradict a putative involvement of the insular dopaminergic system in the pathophysiology of social deficits in KM rats, since an interoception is aberrant in patients with autism spectrum disorders [120]. In parallel, it is known that patients with autism spectrum disorders suffer from a significantly higher number of somatic medical issues [121], as compared to the general population. Arterial hypertension might be one of the somatic dysfunctions comorbid with ASD-like phenotypes. A growing incidence of autism spectrum disorders’ diagnosis in clinical practice warrants future experimentations to clarify the neurochemistry of behavioral deficits. KM rats might serve as an experimental animal model for this. Since a lot of data refer to the insular cortex impairments in people with autism spectrum disorders [122], our results support the validity of the KM rat strain as a model for autism spectrum disorders.
A clear limitation of this study is the absence of female rats in this study, and a relatively low number of animals in each particular group. However, the results obtained should be regarded as mapping the cortical regions enrolled in the pathological processes related to epilepsy and its psychiatric comorbidities. Further research is needed to specify the particular roles of each of the receptor systems in these regions.
The ligands used for the autoradiography were unspecific to different DR subtypes within the subfamilies. Therefore, we analyzed the integral binding densities and were unable to distinguish D1DR and D5DR and D2, D3, and D4 receptors, respectively, but there was and still is a lack of specific ligands for each DR subtype [8]. There are also data about the specificity of used ligands. SCH23390 can also bind with the 5-HT2 and 5-HT1C serotonin receptor subtypes [56,57], and spiperone may also bind to sigma and 5-HT2 receptors [57]. Therefore, in spite of the much higher affinity of both SCH23390 and spiperone for DR than for other receptors, we cannot fully exclude the participation of other receptors in our results. Unfortunately, there was no way to avoid that limitation due to the lack of ligands with the specific affinity only for one receptor type [8].
5. Conclusions
The prefrontal cortex of rats, that served as animal models for convulsive and/or nonconvulsive epilepsy, demonstrated epilepsy-related decreases in binding densities to both D1DR and D2DR. The effects were mainly found in the anterior cingulate partition. The decreased D1DR and D2DR densities were independent of (not correlated with) each other.
The particular group of epileptic rats, characterized by autism spectrum disorder-like behavioral traits, displayed changes in D1DR and D2DR localized mainly in the anterior insular cortex and the adjacent regions. The regional binding densities to D1DR were lowered, but those to D2DR were elevated in the anterior dysgranular insular cortex and claustrum in KM rats.
Supplementary Materials
The following supporting information can be downloaded at: https://www.mdpi.com/article/10.3390/receptors3010004/s1, Table S1: D1DR regional binding densities in the rat groups studied (Wistar, WAG/Rij, WAG/Rij-AGS, KM). The data are given as mean and SEM, in pmol/g of wet tissue. The main effects, corresponding significance, and percentage of changes are given in red; Table S2: D1DR regional binding densities in the rat groups studied (Wistar, WAG/Rij, WAG/Rij-AGS, KM). The data are given as mean and SEM, in pmol/g of wet tissue. The main effects, corresponding significance, and percentage of changes are given in red.
Author Contributions
Conceptualization, I.S.M. and G.v.L.; methodology, L.M.B.; data curation, I.S.M.; investigation, L.M.B. and I.S.M.; writing—original draft preparation, L.M.B.; writing—review and editing, I.S.M. and G.v.L.; visualization, I.S.M.; project administration, G.v.L. All authors have read and agreed to the published version of the manuscript.
Funding
The work was funded by RSF, grant No. 23-25-00484.
Institutional Review Board Statement
The animal study protocol was approved by the Institutional Ethics Committee of the IHNA and NPh of RAS (protocol 1 from 25 February 2021).
Informed Consent Statement
Not applicable.
Data Availability Statement
All the data have been included in the main text and Supplementary Materials.
Acknowledgments
We are deeply grateful to Leena Tuomisto from the University of Eastern Finland for the helpful discussions and support in collection of original data (INTAS project 001-690), and E.A Sleeper for her helpful language assistance.
Conflicts of Interest
The authors declare no conflicts of interest.
References
- Arbib, M.A. (Ed.) The Handbook of Brain Theory and Neural Networks, 2nd ed.; MIT Press: Cambridge, MA, USA, 2003; ISBN 978-0-262-01197-6. [Google Scholar]
- Liu, C.; Goel, P.; Kaeser, P.S. Spatial and Temporal Scales of Dopamine Transmission. Nat. Rev. Neurosci. 2021, 22, 345–358. [Google Scholar] [CrossRef]
- Speranza, L.; Di Porzio, U.; Viggiano, D.; De Donato, A.; Volpicelli, F. Dopamine: The Neuromodulator of Long-Term Synaptic Plasticity, Reward and Movement Control. Cells 2021, 10, 735. [Google Scholar] [CrossRef] [PubMed]
- Robbins, T.W. Dopamine and Cognition. Curr. Opin. Neurol. 2003, 16, S1–S2. [Google Scholar] [CrossRef]
- Tsetsenis, T.; Broussard, J.I.; Dani, J.A. Dopaminergic Regulation of Hippocampal Plasticity, Learning, and Memory. Front. Behav. Neurosci. 2023, 16, 1092420. [Google Scholar] [CrossRef] [PubMed]
- Pezze, M.; Feldon, J. Mesolimbic Dopaminergic Pathways in Fear Conditioning. Prog. Neurobiol. 2004, 74, 301–320. [Google Scholar] [CrossRef]
- Ayano, G. Dopamine: Receptors, Functions, Synthesis, Pathways, Locations and Mental Disorders: Review of Literatures. J. Ment. Disord. Treat. 2016, 2, 2. [Google Scholar] [CrossRef]
- Cumming, P. Imaging Dopamine, 1st ed.; Cambridge University Press: Cambridge, UK, 2009; ISBN 978-0-521-79002-4. [Google Scholar]
- Tiberi, M. (Ed.) Dopamine Receptor Technologies; Neuromethods; Humana Press: New York, NY, USA, 2015; ISBN 978-1-4939-2195-9. [Google Scholar]
- Beaulieu, J.-M.; Gainetdinov, R.R. The Physiology, Signaling, and Pharmacology of Dopamine Receptors. Pharmacol. Rev. 2011, 63, 182–217. [Google Scholar] [CrossRef] [PubMed]
- Clark, D.; White, F.J. Review: D1 Dopamine Receptor—The Search for a Function: A Critical Evaluation of the D1/D2 Dopamine Receptor Classification and Its Functional Implications. Synapse 1987, 1, 347–388. [Google Scholar] [CrossRef] [PubMed]
- Martel, J.C.; McArthur, S.G. Dopamine Receptor Subtypes, Physiology and Pharmacology: New Ligands and Concepts in Schizophrenia. Front. Pharmacol. 2020, 11, 1003. [Google Scholar] [CrossRef]
- Cramb, K.M.L.; Beccano-Kelly, D.; Cragg, S.J.; Wade-Martins, R. Impaired Dopamine Release in Parkinson’s Disease. Brain 2023, 146, 3117–3132. [Google Scholar] [CrossRef]
- Menon, V.; Palaniyappan, L.; Supekar, K. Integrative Brain Network and Salience Models of Psychopathology and Cognitive Dysfunction in Schizophrenia. Biol. Psychiatry 2023, 94, 108–120. [Google Scholar] [CrossRef] [PubMed]
- Jayanti, S.; Dalla Verde, C.; Tiribelli, C.; Gazzin, S. Inflammation, Dopaminergic Brain and Bilirubin. Int. J. Mol. Sci. 2023, 24, 11478. [Google Scholar] [CrossRef] [PubMed]
- Xu, H.; Yang, F. The Interplay of Dopamine Metabolism Abnormalities and Mitochondrial Defects in the Pathogenesis of Schizophrenia. Transl. Psychiatry 2022, 12, 464. [Google Scholar] [CrossRef] [PubMed]
- Starr, M.S. The Role of Dopamine in Epilepsy. Synapse 1996, 22, 159–194. [Google Scholar] [CrossRef]
- Bozzi, Y.; Borrelli, E. The Role of Dopamine Signaling in Epileptogenesis. Front. Cell. Neurosci. 2013, 7, 157. [Google Scholar] [CrossRef] [PubMed]
- Helmstaedter, C.; Sadat-Hossieny, Z.; Kanner, A.M.; Meador, K.J. Cognitive Disorders in Epilepsy II: Clinical Targets, Indications and Selection of Test Instruments. Seizure 2020, 83, 223–231. [Google Scholar] [CrossRef]
- Keele, N.B. The Role of Serotonin in Impulsive and Aggressive Behaviors Associated with Epilepsy-like Neuronal Hyperexcitability in the Amygdala. Epilepsy Behav. 2005, 7, 325–335. [Google Scholar] [CrossRef]
- Noeker, M.; Haverkamp-Krois, A.; Haverkamp, F. Development of Mental Health Dysfunction in Childhood Epilepsy. Brain Dev. 2005, 27, 5–16. [Google Scholar] [CrossRef]
- Fuster, J.M. The Prefrontal Cortex, 5th ed.; Academic Press: Cambridge, MA, USA, 2015; ISBN 978-0-12-408060-7. [Google Scholar]
- Preuss, T.M.; Wise, S.P. Evolution of Prefrontal Cortex. Neuropsychopharmacology 2022, 47, 3–19. [Google Scholar] [CrossRef]
- McGregor, M.S.; LaLumiere, R.T. Still a “Hidden Island”? The Rodent Insular Cortex in Drug Seeking, Reward, and Risk. Neurosci. Biobehav. Rev. 2023, 153, 105334. [Google Scholar] [CrossRef]
- Inoyama, K.; Devinsky, O. Cingulate Seizures and Recent Treatment Strategies. In Handbook of Clinical Neurology; Elsevier: Amsterdam, The Netherlands, 2019; Volume 166, pp. 341–353. ISBN 978-0-444-64196-0. [Google Scholar]
- Li, M.; Ma, X.; Mai, C.; Fan, Z.; Wang, Y.; Ren, Y. Knowledge Atlas of Insular Epilepsy: A Bibliometric Analysis. Neuropsychiatr. Dis. Treat. 2022, 18, 2891–2903. [Google Scholar] [CrossRef]
- Coenen, A.M.L.; van Luijtelaar, E.L.J.M. Genetic Animal Models for Absence Epilepsy: A Review of the WAG/Rij Strain of Rats. Behav. Genet. 2003, 33, 635–655. [Google Scholar] [CrossRef]
- van Luijtelaar, G.; Zobeiri, M. Progress and Outlooks in a Genetic Absence Epilepsy Model (WAG/Rij). Curr. Med. Chem. 2014, 21, 704–721. [Google Scholar] [CrossRef]
- van Luijtelaar, G.; van Oijen, G. Establishing Drug Effects on Electrocorticographic Activity in a Genetic Absence Epilepsy Model: Advances and Pitfalls. Front. Pharmacol. 2020, 11, 395. [Google Scholar] [CrossRef]
- Kuznetsova, G.D. Audiogenic seizures in rats of different genetic strains. Zh. Vyssh. Nerv. Deiat. Im. I. P. Pavlova 1998, 48, 143–152. [Google Scholar]
- Midzyanovskaya, I.S.; Kuznetsova, G.D.; Vinogradova, L.V.; Shatskova, A.B.; Coenen, A.M.L.; van Luijtelaar, G. Mixed Forms of Epilepsy in a Subpopulation of WAG/Rij Rats. Epilepsy Behav. 2004, 5, 655–661. [Google Scholar] [CrossRef] [PubMed]
- Poletaeva, I.I.; Surina, N.M.; Kostina, Z.A.; Perepelkina, O.V.; Fedotova, I.B. The Krushinsky-Molodkina Rat Strain: The Study of Audiogenic Epilepsy for 65 Years. Epilepsy Behav. 2017, 71, 130–141. [Google Scholar] [CrossRef] [PubMed]
- Fedotova, I.B.; Surina, N.M.; Nikolaev, G.M.; Revishchin, A.V.; Poletaeva, I.I. Rodent Brain Pathology, Audiogenic Epilepsy. Biomedicines 2021, 9, 1641. [Google Scholar] [CrossRef] [PubMed]
- Garbuz, D.G.; Davletshin, A.A.; Litvinova, S.A.; Fedotova, I.B.; Surina, N.M.; Poletaeva, I.I. Rodent Models of Audiogenic Epilepsy: Genetic Aspects, Advantages, Current Problems and Perspectives. Biomedicines 2022, 10, 2934. [Google Scholar] [CrossRef] [PubMed]
- Midzyanovskaya, I.S.; Shatskova, A.B.; Sarkisova, K.Y.; van Luijtelaar, G.; Tuomisto, L.; Kuznetsova, G.D. Convulsive and Nonconvulsive Epilepsy in Rats: Effects on Behavioral Response to Novelty Stress. Epilepsy Behav. 2005, 6, 543–551. [Google Scholar] [CrossRef]
- Midzyanovskaya, I.S.; Kuznetsova, G.D.; van Luijtelaar, E.L.J.M.; Van Rijn, C.M.; Tuomisto, L.; MacDonald, E. The Brain 5HTergic Response to an Acute Sound Stress in Rats with Generalized (Absence and Audiogenic) Epilepsy. Brain Res. Bull. 2006, 69, 631–638. [Google Scholar] [CrossRef]
- Midzyanovskaya, I.S.; Birioukova, L.M.; Shatskova, A.B.; van Luijtelaar, G.; Tuomisto, L.M. H1 Histamine Receptor Densities Are Increased in Brain Regions of Rats with Genetically Generalized Epilepsies. Epilepsy Res. 2016, 127, 135–140. [Google Scholar] [CrossRef] [PubMed]
- Midzyanovskaya, I.S.; Petrenko, T.E.; Birioukova, L.M.; Tuomisto, L.M. Reduced H3 Histamine Receptor Binding Densities in the Upper Layers of Motor Cortex in Rats Prone to Audiogenic Convulsive Seizures. Epilepsy Res. 2021, 170, 106543. [Google Scholar] [CrossRef]
- Midzyanovskaya, I.S.; Birioukova, L.M.; Storvik, M.; van Luijtelaar, G.; Tuomisto, L.M. The Prefrontal Cortex Shows Widespread Decrease in H3 Histamine Receptor Binding Densities in Rats with Genetic Generalized Epilepsies. Epilepsy Res. 2022, 182, 106921. [Google Scholar] [CrossRef] [PubMed]
- Tsyba, E.T.; Midzyanovskaya, I.S.; Birioukova, L.M.; Tuomisto, L.M.; van Luijtelaar, G.; Abbasova, K.R. Striatal Patchwork of D1-like and D2-like Receptors Binding Densities in Rats with Genetic Audiogenic and Absence Epilepsies. Diagnostics 2023, 13, 587. [Google Scholar] [CrossRef] [PubMed]
- Rebik, A.A.; Riga, V.D.; Smirnov, K.S.; Sysoeva, O.V.; Midzyanovskaya, I.S. Social Behavioral Deficits in Krushinsky-Molodkina Rats, an Animal Model of Audiogenic Epilepsy. J. Pers. Med. 2022, 12, 2062. [Google Scholar] [CrossRef]
- Rebik, A.; Broshevitskaya, N.; Kuzhuget, S.; Aleksandrov, P.; Abbasova, K.; Zaichenko, M.; Midzyanovskaya, I. Audiogenic Seizures and Social Deficits: No Aggravation Found in Krushinsky–Molodkina Rats. Biomedicines 2023, 11, 2566. [Google Scholar] [CrossRef]
- Besag, F. Epilepsy in Patients with Autism: Links, Risks and Treatment Challenges. Neuropsychiatr. Dis. Treat. 2017, 14, 1–10. [Google Scholar] [CrossRef]
- Brooks-Kayal, A. Epilepsy and Autism Spectrum Disorders: Are There Common Developmental Mechanisms? Brain Dev. 2010, 32, 731–738. [Google Scholar] [CrossRef]
- Bozzi, Y.; Provenzano, G.; Casarosa, S. Neurobiological Bases of Autism—Epilepsy Comorbidity: A Focus on Excitation/Inhibition Imbalance. Eur. J. Neurosci. 2018, 47, 534–548. [Google Scholar] [CrossRef]
- Silverman, J.L.; Thurm, A.; Ethridge, S.B.; Soller, M.M.; Petkova, S.P.; Abel, T.; Bauman, M.D.; Brodkin, E.S.; Harony-Nicolas, H.; Wöhr, M.; et al. Reconsidering Animal Models Used to Study Autism Spectrum Disorder: Current State and Optimizing Future. Genes Brain Behav. 2022, 21, e12803. [Google Scholar] [CrossRef]
- Sierra-Arregui, T.; Llorente, J.; Giménez Minguez, P.; Tønnesen, J.; Peñagarikano, O. Neurobiological Mechanisms of Autism Spectrum Disorder and Epilepsy, Insights from Animal Models. Neuroscience 2020, 445, 69–82. [Google Scholar] [CrossRef]
- Haratizadeh, S.; Parvan, M.; Mohammadi, S.; Shabani, M.; Nozari, M. An Overview of Modeling and Behavioral Assessment of Autism in the Rodent. Int. J. Dev. Neurosci. 2021, 81, 221–228. [Google Scholar] [CrossRef]
- Directive 2010/63/EU of the European Parliament and of the Council of 22 September 2010 on the Protection of Animals Used for Scientific Purposes. Text with EEA Relevance. Off. J. Eur. Union 2010, 276, 33–79.
- Morimoto, K.; Fahnestock, M.; Racine, R.J. Kindling and Status Epilepticus Models of Epilepsy: Rewiring the Brain. Prog. Neurobiol. 2004, 73, 1–60. [Google Scholar] [CrossRef]
- Vinogradova, L.V. Audiogenic Kindling and Secondary Subcortico-Cortical Epileptogenesis: Behavioral Correlates and Electrographic Features. Epilepsy Behav. 2017, 71, 142–153. [Google Scholar] [CrossRef]
- Paxinos, G.; Watson, C. Paxino’s and Watson’s The Rat Brain in Stereotaxic Coordinates, 7th ed.; Elsevier/AP, Academic Press is an imprint of Elsevier: Amsterdam, The Netherlands; Boston, MA, USA, 2014; ISBN 978-0-12-391949-6. [Google Scholar]
- Paxinos, G.; Kassem, M.S.; Kirkcaldie, M.; Carrive, P. Chemoarchitectonic Atlas of the Rat Brain, 3rd ed.; Elsevier Science: Amsterdam, The Netherlands, 2021; ISBN 0-12-818959-2. [Google Scholar]
- Blunt, S.B.; Jenner, P.; Marsden, C.D. Autoradiographic Study of Striatal D1 and D2 Dopamine Receptors in 6-OHDA-Lesioned Rats Receiving Foetal Ventral Mesencephalic Grafts and Chronic Treatment WithL-DOPA and Carbidopa. Brain Res. 1992, 582, 299–311. [Google Scholar] [CrossRef] [PubMed]
- Birioukova, L.M.; Midzyanovskaya, I.S.; Lensu, S.; Tuomisto, L.; van Luijtelaar, G. Distribution of D1-like and D2-like Dopamine Receptors in the Brain of Genetic Epileptic WAG/Rij Rats. Epilepsy Res. 2005, 63, 89–96. [Google Scholar] [CrossRef] [PubMed]
- Bourne, J.A. SCH 23390: The First Selective Dopamine D1-Like Receptor Antagonist. CNS Drug Rev. 2006, 7, 399–414. [Google Scholar] [CrossRef] [PubMed]
- Roth, B.L.; Lopez, E.; Patel, S.; Kroeze, W.K. The Multiplicity of Serotonin Receptors: Uselessly Diverse Molecules or an Embarrassment of Riches? Neuroscientist 2000, 6, 252–262. [Google Scholar] [CrossRef]
- Janowsky, A.; Neve, K.A.; Kinzie, J.M.; Taylor, B.; de Paulis, T.; Belknap, J.K. Extrastriatal Dopamine D2 Receptors: Distribution, Pharmacological Characterization and Region-Specific Regulation by Clozapine. J. Pharmacol. Exp. Ther. 1992, 261, 1282–1290. [Google Scholar] [PubMed]
- Schneider, C.A.; Rasband, W.S.; Eliceiri, K.W. NIH Image to ImageJ: 25 Years of Image Analysis. Nat. Methods 2012, 9, 671–675. [Google Scholar] [CrossRef] [PubMed]
- Jobson, D.D.; Hase, Y.; Clarkson, A.N.; Kalaria, R.N. The Role of the Medial Prefrontal Cortex in Cognition, Ageing and Dementia. Brain Commun. 2021, 3, fcab125. [Google Scholar] [CrossRef] [PubMed]
- Chini, M.; Hanganu-Opatz, I.L. Prefrontal Cortex Development in Health and Disease: Lessons from Rodents and Humans. Trends Neurosci. 2021, 44, 227–240. [Google Scholar] [CrossRef] [PubMed]
- Kolk, S.M.; Rakic, P. Development of Prefrontal Cortex. Neuropsychopharmacology 2022, 47, 41–57. [Google Scholar] [CrossRef]
- Paxinos, G.; Watson, C. The Rat Brain in Stereotaxic Coordinates, 6th ed.; Academic Press: Cambridge, MA, USA; Elsevier: Amsterdam, The Netherlands; Heidelberg, Germany, 2007; ISBN 978-0-12-374121-9. [Google Scholar]
- Zilles, K. The Cortex of the Rat; Springer: Berlin/Heidelberg, Germany, 1985; ISBN 978-3-642-70575-5. [Google Scholar]
- Vogt, B.A.; Paxinos, G. Cytoarchitecture of Mouse and Rat Cingulate Cortex with Human Homologies. Brain Struct. Funct. 2014, 219, 185–192. [Google Scholar] [CrossRef]
- Swanson, L.W. Brain Maps 4.0—Structure of the Rat Brain: An Open Access Atlas with Global Nervous System Nomenclature Ontology and Flatmaps. J. Comp. Neurol. 2018, 526, 935–943. [Google Scholar] [CrossRef]
- Vogt, B.A. Cingulate Cortex and Pain Architecture. In The Rat Nervous System; Paxinos, G., Ed.; Elsevier: Amsterdam, The Netherlands; Academic Press: Cambridge, MA, USA, 2015; pp. 575–599. ISBN 978-0-12-374245-2. [Google Scholar]
- Laubach, M.; Amarante, L.M.; Swanson, K.; White, S.R. What, If Anything, Is Rodent Prefrontal Cortex? eNeuro 2018, 5, ENEURO.0315-18.2018. [Google Scholar] [CrossRef]
- Weible, A.P. Remembering to Attend: The Anterior Cingulate Cortex and Remote Memory. Behav. Brain Res. 2013, 245, 63–75. [Google Scholar] [CrossRef] [PubMed]
- Devinsky, O.; Morrell, M.J.; Vogt, B.A. Contributions of Anterior Cingulate Cortex to Behaviour. Brain 1995, 118, 279–306. [Google Scholar] [CrossRef] [PubMed]
- Rolls, E.T. The Cingulate Cortex and Limbic Systems for Emotion, Action, and Memory. Brain Struct. Funct. 2019, 224, 3001–3018. [Google Scholar] [CrossRef]
- Nieuwenhuys, R. The Insular Cortex. In Progress in Brain Research; Elsevier: Amsterdam, The Netherlands, 2012; Volume 195, pp. 123–163. ISBN 978-0-444-53860-4. [Google Scholar]
- Gehrlach, D.A.; Weiand, C.; Gaitanos, T.N.; Cho, E.; Klein, A.S.; Hennrich, A.A.; Conzelmann, K.-K.; Gogolla, N. A Whole-Brain Connectivity Map of Mouse Insular Cortex. eLife 2020, 9, e55585. [Google Scholar] [CrossRef]
- Lamm, C.; Singer, T. The Role of Anterior Insular Cortex in Social Emotions. Brain Struct. Funct. 2010, 214, 579–591. [Google Scholar] [CrossRef]
- Shura, R.D.; Hurley, R.A.; Taber, K.H. Insular Cortex: Structural and Functional Neuroanatomy. J. Neuropsychiatry Clin. Neurosci. 2014, 26, iv-282. [Google Scholar] [CrossRef]
- Frank, S.; Kullmann, S.; Veit, R. Food Related Processes in the Insular Cortex. Front. Hum. Neurosci. 2013, 7, 499. [Google Scholar] [CrossRef] [PubMed]
- Droutman, V.; Read, S.J.; Bechara, A. Revisiting the Role of the Insula in Addiction. Trends Cogn. Sci. 2015, 19, 414–420. [Google Scholar] [CrossRef] [PubMed]
- Fuster, J.M. Chemical Neurotransmission. In The Prefrontal Cortex; Elsevier: Amsterdam, The Netherlands, 2015; pp. 63–131. ISBN 978-0-12-407815-4. [Google Scholar]
- Islam, K.U.S.; Meli, N.; Blaess, S. The Development of the Mesoprefrontal Dopaminergic System in Health and Disease. Front. Neural Circuits 2021, 15, 746582. [Google Scholar] [CrossRef]
- Labrakakis, C. The Role of the Insular Cortex in Pain. Int. J. Mol. Sci. 2023, 24, 5736. [Google Scholar] [CrossRef] [PubMed]
- De Caro, C.; Di Cesare Mannelli, L.; Branca, J.J.V.; Micheli, L.; Citraro, R.; Russo, E.; De Sarro, G.; Ghelardini, C.; Calignano, A.; Russo, R. Pain Modulation in WAG/Rij Epileptic Rats (A Genetic Model of Absence Epilepsy): Effects of Biological and Pharmacological Histone Deacetylase Inhibitors. Front. Pharmacol. 2020, 11, 549191. [Google Scholar] [CrossRef]
- Meeren, H.; van Luijtelaar, G.; Lopes Da Silva, F.; Coenen, A. Evolving Concepts on the Pathophysiology of Absence Seizures: The Cortical Focus Theory. Arch. Neurol. 2005, 62, 371. [Google Scholar] [CrossRef]
- Buzsáki, G.; Smith, A.; Berger, S.; Fisher, L.J.; Gage, F.H.; Aston-Jones, G.; Bloom, F.E. Petit Mal Epilepsy and Parkinsonian Tremor: Hypothesis of a Common Pacemaker. Neuroscience 1990, 36, 1–14. [Google Scholar] [CrossRef] [PubMed]
- Bernedo Paredes, V.E.; Buchholz, H.-G.; Gartenschläger, M.; Breimhorst, M.; Schreckenberger, M.; Werhahn, K.J. Reduced D2/D3 Receptor Binding of Extrastriatal and Striatal Regions in Temporal Lobe Epilepsy. PLoS ONE 2015, 10, e0141098. [Google Scholar] [CrossRef]
- Rocha, L.; Alonso-Vanegas, M.; Villeda-Hernández, J.; Mújica, M.; Cisneros-Franco, J.M.; López-Gómez, M.; Zavala-Tecuapetla, C.; Frías-Soria, C.L.; Segovia-Vila, J.; Borsodi, A. Dopamine Abnormalities in the Neocortex of Patients with Temporal Lobe Epilepsy. Neurobiol. Dis. 2012, 45, 499–507. [Google Scholar] [CrossRef] [PubMed]
- Yakushev, I.Y.; Dupont, E.; Buchholz, H.; Tillmanns, J.; Debus, F.; Cumming, P.; Heimann, A.; Fellgiebel, A.; Luhmann, H.J.; Landvogt, C.; et al. In Vivo Imaging of Dopamine Receptors in a Model of Temporal Lobe Epilepsy. Epilepsia 2010, 51, 415–422. [Google Scholar] [CrossRef] [PubMed]
- Firstova, J.J.; Abaimov, D.A.; Surina, N.M.; Poletaeva, I.I.; Fedotova, I.B.; Kovalev, G.I. Binding of Specific Ligand by D2- and NMDA-Receptors of Striatum Cells in Two Rat Strains Predisposed and Resistant to Audiogenic Seizures. Bull. Exp. Biol. Med. 2012, 154, 196–198. [Google Scholar] [CrossRef] [PubMed]
- Alcantara-Gonzalez, D.; Floran, B.; Escartin, E.; Rocha, L. Changes on D2-like Receptor Induced Gi Protein Activation and Hippocampal Dopamine Release in Kindled Rats. Prog. Neuropsychopharmacol. Biol. Psychiatry 2013, 40, 246–251. [Google Scholar] [CrossRef]
- De Bruin, N.M.W.J.; van Luijtelaar, E.L.J.M.; Cools, A.R.; Ellenbroek, B.A. Dopamine Characteristics in Rat Genotypes with Distinct Susceptibility to Epileptic Activity: Apomorphine-Induced Stereotyped Gnawing and Novelty/Amphetamine-Induced Locomotor Stimulation. Behav. Pharmacol. 2001, 12, 517–525. [Google Scholar] [CrossRef]
- Kuznetsova, G.D.; Petrova, E.V.; Coenen, A.M.L.; van Luijtelaar, E.L.J.M. Generalized Absence Epilepsy and Catalepsy in Rats. Physiol. Behav. 1996, 60, 1165–1169. [Google Scholar] [CrossRef]
- Kalimullina, L.B.; Musina, A.M.; Kuznetsova, G.D. Experimental approaches to investigation into the role of the genotype by the locus TAG 1A of dopamine D2-receptors in epileptogenesis. Ross. Fiziol. Zh. Im. I M Sechenova 2012, 98, 177–185. [Google Scholar]
- Midzyanovskaya, I.S.; Shatskova, A.B.; MacDonald, E.; van Luijtelaar, G.; Tuomisto, L. Brain Aminergic Deficiency in Absence Epileptic Rats: Dependency on Seizure Severity and Their Functional Coupling at Rest. J. Behav. Brain Sci. 2020, 10, 29–45. [Google Scholar] [CrossRef][Green Version]
- Bentivoglio, M.; Morelli, M. Chapter I The Organization and Circuits of Mesencephalic Dopaminergic Neurons and the Distribution of Dopamine Receptors in the Brain. In Handbook of Chemical Neuroanatomy; Elsevier: Amsterdam, The Netherlands, 2005; Volume 21, pp. 1–107. ISBN 978-0-444-51778-4. [Google Scholar]
- Ottman, R.; Lipton, R.B.; Ettinger, A.B.; Cramer, J.A.; Reed, M.L.; Morrison, A.; Wan, G.J. Comorbidities of Epilepsy: Results from the Epilepsy Comorbidities and Health (EPIC) Survey. Epilepsia 2011, 52, 308–315. [Google Scholar] [CrossRef]
- Sarkisova, K.; van Luijtelaar, G. The WAG/Rij Strain: A Genetic Animal Model of Absence Epilepsy with Comorbidity of Depressiony. Prog. Neuropsychopharmacol. Biol. Psychiatry 2011, 35, 854–876. [Google Scholar] [CrossRef] [PubMed]
- Sarkisova, K.Y.; Fedotova, I.B.; Surina, N.M.; Nikolaev, G.M.; Perepelkina, O.V.; Kostina, Z.A.; Poletaeva, I.I. Genetic Background Contributes to the Co-Morbidity of Anxiety and Depression with Audiogenic Seizure Propensity and Responses to Fluoxetine Treatment. Epilepsy Behav. 2017, 68, 95–102. [Google Scholar] [CrossRef]
- Sarkisova, K.Y.; Kulikov, M.A.; Kudrin, V.S.; Narkevich, V.B.; Midzianovskaia, I.S.; Biriukova, L.M.; Folomkina, A.A.; Basian, A.S. Neurochemical mechanisms of depression-like behavior in WAG/Rij rats. Zh. Vyssh. Nerv. Deiat. Im. P. Pavlova 2013, 63, 303–315. [Google Scholar] [CrossRef]
- Lörincz, M.; Oláh, M.; Baracskay, P.; Szilágyi, N.; Juhász, G. Propagation of Spike and Wave Activity to the Medial Prefrontal Cortex and Dorsal Raphe Nucleus of WAG/Rij Rats. Physiol. Behav. 2007, 90, 318–324. [Google Scholar] [CrossRef]
- Bianchin, M.M.; Londero, R.G.; Lima, J.E.; Bigal, M.E. Migraine and Epilepsy: A Focus on Overlapping Clinical, Pathophysiological, Molecular, and Therapeutic Aspects. Curr. Pain Headache Rep. 2010, 14, 276–283. [Google Scholar] [CrossRef] [PubMed]
- Huang, S.; Zhang, Z.; Gambeta, E.; Xu, S.C.; Thomas, C.; Godfrey, N.; Chen, L.; M’Dahoma, S.; Borgland, S.L.; Zamponi, G.W. Dopamine Inputs from the Ventral Tegmental Area into the Medial Prefrontal Cortex Modulate Neuropathic Pain-Associated Behaviors in Mice. Cell Rep. 2020, 31, 107812. [Google Scholar] [CrossRef] [PubMed]
- Santana, N.; Artigas, F. Laminar and Cellular Distribution of Monoamine Receptors in Rat Medial Prefrontal Cortex. Front. Neuroanat. 2017, 11, 87. [Google Scholar] [CrossRef]
- Flik, G.; Folgering, J.H.A.; Cremers, T.I.H.F.; Westerink, B.H.C.; Dremencov, E. Interaction Between Brain Histamine and Serotonin, Norepinephrine, and Dopamine Systems: In Vivo Microdialysis and Electrophysiology Study. J. Mol. Neurosci. 2015, 56, 320–328. [Google Scholar] [CrossRef]
- Surina, N.M.; Fedotova, I.B.; Nikolaev, G.M.; Grechenko, V.V.; Gankovskaya, L.V.; Ogurtsova, A.D.; Poletaeva, I.I. Neuroinflammation in Pathogenesis of Audiogenic Epilepsy: Altered Proinflammatory Cytokine Levels in the Rats of Krushinsky–Molodkina Seizure-Prone Strain. Biochem. Mosc. 2023, 88, 481–490. [Google Scholar] [CrossRef]
- Aygun, H.; Akin, A.T.; Kızılaslan, N.; Sumbul, O.; Karabulut, D. Probiotic Supplementation Alleviates Absence Seizures and Anxiety- and Depression-like Behavior in WAG/Rij Rat by Increasing Neurotrophic Factors and Decreasing Proinflammatory Cytokines. Epilepsy Behav. 2022, 128, 108588. [Google Scholar] [CrossRef]
- Russo, E.; Andreozzi, F.; Iuliano, R.; Dattilo, V.; Procopio, T.; Fiume, G.; Mimmi, S.; Perrotti, N.; Citraro, R.; Sesti, G.; et al. Early Molecular and Behavioral Response to Lipopolysaccharide in the WAG/Rij Rat Model of Absence Epilepsy and Depressive-like Behavior, Involves Interplay between AMPK, AKT/mTOR Pathways and Neuroinflammatory Cytokine Release. Brain. Behav. Immun. 2014, 42, 157–168. [Google Scholar] [CrossRef] [PubMed]
- Leo, A.; Nesci, V.; Tallarico, M.; Amodio, N.; Gallo Cantafio, E.M.; De Sarro, G.; Constanti, A.; Russo, E.; Citraro, R. IL-6 Receptor Blockade by Tocilizumab Has Anti-Absence and Anti-Epileptogenic Effects in the WAG/Rij Rat Model of Absence Epilepsy. Neurotherapeutics 2020, 17, 2004–2014. [Google Scholar] [CrossRef] [PubMed]
- Brodie, M.J.; Besag, F.; Ettinger, A.B.; Mula, M.; Gobbi, G.; Comai, S.; Aldenkamp, A.P.; Steinhoff, B.J. Epilepsy, Antiepileptic Drugs, and Aggression: An Evidence-Based Review. Pharmacol. Rev. 2016, 68, 563–602. [Google Scholar] [CrossRef] [PubMed]
- Elnazer, H.Y.; Agrawal, N. Aggressive Behavior. In Neuropsychiatric Symptoms of Epilepsy; Mula, M., Ed.; Neuropsychiatric Symptoms of Neurological Disease; Springer International Publishing: Cham, Switzerland, 2016; pp. 99–116. ISBN 978-3-319-22158-8. [Google Scholar]
- Zhu, Y.; Feng, J.; Ji, J.; Hou, H.; Chen, L.; Wu, S.; Liu, Q.; Yao, Q.; Du, P.; Zhang, K.; et al. Alteration of Monoamine Receptor Activity and Glucose Metabolism in Pediatric Patients with Anticonvulsant-Induced Cognitive Impairment. J. Nucl. Med. 2017, 58, 1490–1497. [Google Scholar] [CrossRef]
- Kodama, T.; Watanabe, M. Interaction of Dopamine and Glutamate Release in the Primate Prefrontal Cortex in Relation to Working Memory and Reward. In The Prefrontal Cortex as an Executive, Emotional, and Social Brain; Watanabe, M., Ed.; Springer: Tokyo, Japan, 2017; pp. 77–102. ISBN 978-4-431-56506-2. [Google Scholar]
- Kanner, A.M. Management of Psychiatric and Neurological Comorbidities in Epilepsy. Nat. Rev. Neurol. 2016, 12, 106–116. [Google Scholar] [CrossRef]
- Epps, S.A.; Weinshenker, D. Rhythm and Blues: Animal Models of Epilepsy and Depression Comorbidity. Biochem. Pharmacol. 2013, 85, 135–146. [Google Scholar] [CrossRef]
- Mazarati, A.; Sankar, R. Common Mechanisms Underlying Epileptogenesis and the Comorbidities of Epilepsy. Cold Spring Harb. Perspect. Med. 2016, 6, a022798. [Google Scholar] [CrossRef]
- Naqvi, N.H.; Bechara, A. The Hidden Island of Addiction: The Insula. Trends Neurosci. 2009, 32, 56–67. [Google Scholar] [CrossRef]
- Krushinsky, L.V.; Molodkina, L.N.; Fless, D.A.; Dobrokhotova, L.P.; Steshenko, A.P.; Semiokhina, A.F.; Zorina, Z.A.; Romanova, L.G. The Functional State of the Brain during Sonic Stimulation. In Physiological Effects of Noise; Welch, B.L., Welch, A.S., Eds.; Springer: Boston, MA, USA, 1970; pp. 159–183. ISBN 978-1-4684-8809-8. [Google Scholar]
- Fadyukova, O.E.; Storozhevykh, T.P.; Pinelis, V.G.; Koshelev, V.B. Ischemic and Hemorrhagic Disturbances in Cerebral Circulation Alter Contractile Responses of the Rat Middle Cerebral Artery. Brain Res. 2004, 995, 145–149. [Google Scholar] [CrossRef]
- Ruggiero, D.A.; Mraovitch, S.; Granata, A.R.; Anwar, M.; Reis, D.J. A Role of Insular Cortex in Cardiovascular Function. J. Comp. Neurol. 1987, 257, 189–207. [Google Scholar] [CrossRef] [PubMed]
- Allen, G.V.; Saper, C.B.; Hurley, K.M.; Cechetto, D.F. Organization of Visceral and Limbic Connections in the Insular Cortex of the Rat. J. Comp. Neurol. 1991, 311, 1–16. [Google Scholar] [CrossRef] [PubMed]
- Livneh, Y.; Andermann, M.L. Cellular Activity in Insular Cortex across Seconds to Hours: Sensations and Predictions of Bodily States. Neuron 2021, 109, 3576–3593. [Google Scholar] [CrossRef] [PubMed]
- DuBois, D.; Ameis, S.H.; Lai, M.; Casanova, M.F.; Desarkar, P. Interoception in Autism Spectrum Disorder: A Review. Int. J. Dev. Neurosci. 2016, 52, 104–111. [Google Scholar] [CrossRef]
- Muskens, J.B.; Velders, F.P.; Staal, W.G. Medical Comorbidities in Children and Adolescents with Autism Spectrum Disorders and Attention Deficit Hyperactivity Disorders: A Systematic Review. Eur. Child Adolesc. Psychiatry 2017, 26, 1093–1103. [Google Scholar] [CrossRef]
- Caria, A.; De Falco, S. Anterior Insular Cortex Regulation in Autism Spectrum Disorders. Front. Behav. Neurosci. 2015, 9, 38. [Google Scholar] [CrossRef]


Disclaimer/Publisher’s Note: The statements, opinions and data contained in all publications are solely those of the individual author(s) and contributor(s) and not of MDPI and/or the editor(s). MDPI and/or the editor(s) disclaim responsibility for any injury to people or property resulting from any ideas, methods, instructions or products referred to in the content. |
© 2024 by the authors. Licensee MDPI, Basel, Switzerland. This article is an open access article distributed under the terms and conditions of the Creative Commons Attribution (CC BY) license (https://creativecommons.org/licenses/by/4.0/).