Article

The NR4A Orphan Receptor Modulator C-DIM12 Selectively Alters Inflammatory Mediators in Myeloid Cells

1
School of Veterinary Medicine, University College Dublin, D04 V1W8 Dublin, Ireland
2
School of Medicine, University College Dublin, D04 V1W8 Dublin, Ireland
3
Diabetes and Complication Research Centre (DCRC), Conway Institute of Biomolecular and Biomedical Research, University College Dublin, D04 V1W8 Dublin, Ireland
4
St. Vincent’s University Hospital, D04 T6F4 Dublin, Ireland
5
School of Agriculture and Food Science, University College Dublin, D04 V1W8 Dublin, Ireland
6
School of Medicine, University of Limerick, V94 T9PX Limerick, Ireland
7
Conway Institute of Biomolecular and Biomedical Research, University College Dublin, D04 V1W8 Dublin, Ireland
*
Author to whom correspondence should be addressed.
Receptors 2023, 2(4), 264-283; https://doi.org/10.3390/receptors2040018
Submission received: 8 September 2023 / Revised: 13 October 2023 / Accepted: 6 December 2023 / Published: 18 December 2023

Abstract

:
Orphan nuclear receptor subfamily 4A (NR4A) are key regulators of inflammatory responses, largely by their interactions with NF-κB. Over the last decade, several NR4A modulators have been developed, and they are showing potential as therapeutics, although their widespread use in laboratory settings is limited. Here, we have examined, using myeloid cell line THP-1, whether the NR4A modulator 3-[(4-Chlorophenyl)-(1H-indol-3-yl)methyl]-1H-indole (C-DIM12) can alter the inflammatory outcome of six inflammatory ligands: lipopolysaccharide (LPS), tumour necrosis factor alpha (TNFα), interleukin-1 beta (IL-1β), flagellin (FL), lipoteichoic acid (LTA), and zymosan (ZY). We demonstrate that C-DIM12 (10 µM) selectively alters the secretion of inflammatory chemokine MCP-1 following exposure to distinct inflammatory ligands in a concentration-dependent manner. Furthermore, data obtained from THP-1 Lucia cell experiments show that 10 µM C-DIM12, and not 1 µM C-DIM12, can significantly attenuate the increased NF-κB transcriptional activity observed following the exposure to several inflammatory ligands (LPS, FL, TNFα, LTA, and ZY). Lastly, experimental analysis confirms that the cellular action(s) of C-DIM12 is independent of changes in metabolic parameters. Thus, these data contribute to the understanding of how the NR4A modulator C-DIM12 alters inflammatory responses in a myeloid cell following exposure to multiple ligands.

1. Introduction

NR4A1-3 receptors are important regulators of an inflammatory response and their altered expression in numerous local, innate, and adaptive immune cells is the hallmark of several pathologies including rheumatoid arthritis [1,2,3]. The expression of NR4A1-3 can be induced by multiple inflammatory ligands, and in some cases, they have been shown to impact the downstream responses elicited by such ligands. These ligands include but are not limited to Zymosan (ZY) (TLR2 agonist) [4,5,6], lipopolysaccharide (LPS) (TLR4 agonist) [7,8,9], tumour necrosis factor α (TNFα) (TNFR agonist) [8,9,10], interleukin-1β (IL-1β) (IL-1R agonist) [9,11,12], flagellin (FL) (TLR5 agonist) [13], and lipoteichoic acid (LTA) (TLR2 agonist) [9]. While the signalling pathways downstream from these ligands have some differences, there also some commonalities, such as a convergence on NF-κB as a central downstream transcriptional regulator [14,15,16]. It is well established that the NR4As can impact NF-κB activity, more often attenuating its transcriptional capacity [2]. Additionally, other key signalling pathways can also impact the expression profile of the NR4As, such as GPCRs [7,17,18,19], underscoring the importance of the NR4As in both physiological and pathological conditions.
Considering the importance of the NR4As in disease, it is not surprising then that since the mid-2000s the ability to modulate the NR4As has been researched extensively and has now become possible, with the identification of biological modulators (e.g., Cytosporone B (Csn-B)) and the development of synthetic modulators (e.g., 1,1-Bis (3′-indolyl)-1-(p-substituted phenyl) methanes (C-DIMs)) [20,21,22,23,24]. Several studies have shown that these compounds can alter inflammatory processes and ameliorate the disease burden in animal models of disease, with some studies confirming that these affects are mediated through the NR4As [25,26,27,28,29]. Even though many of these modulators are showing promise as potential therapeutics for inflammatory-based diseases, examination of their cellular site(s) of action and therapeutic effects is limited, no doubt in part due to the short time since their discovery. While NR4A modulators, including C-DIM12, display anti-inflammatory properties [25,27,30,31,32], examination of how these modulators alter cell-specific pathways is limited. Thus, the focus of this study was to examine how the NR4A modulator C-DIM12 alters the inflammatory outcome downstream of several inflammatory ligands, in a myeloid cell model.
The important role myeloid cells play in multiple pathologies, including inflammatory-based diseases, is well established [33]. Additionally, NR4As are known to be key players in inflammatory disease and key regulators of myeloid cell function [2,6,7,8]. Chaput et al. reviewed several published articles related to the myeloid cell, the THP-1s, and concluded that the THP-1s are a suitable and reliable model in which to investigate immune modulation in both the stimulated and unstimulated states [34]. Thus, we have utilised the THP-1s for experimental approaches in this study. Using a combination of cytokine/chemokine arrays, the use of THP-1 cells depleted of NR4A2 to aid in target selection, and quantitative ELISAs and qRT-PCR analysis, we show that C-DIM12 (10 µM) selectively attenuates three pro-inflammatory ligands (LPS, FL, and ZY) from a panel of six assessed. Moreover, data demonstrate that C-DIM12 (10 µM) significantly attenuates NF-κB transcriptional activity downstream of five of the inflammatory ligands assessed (LPS, FL, TNFα, LTA, and ZY). Lastly, we confirm that the C-DIM12 effects measured are concentration-dependent as at a concentration of 1.0 µM, C-DIM12 loses its ability to attenuate these specific inflammatory mediators and NF-κB transcriptional activity. In the presence of LPS, redox assays reveal that potential metabolic changes may be mediated by C-DIM12. C-DIM12, in combination with LPS, significantly increases glucose uptake; however, no additional cellular alterations were observed following detailed analysis of several metabolic parameters. Thus, the data collected here reveal novel therapeutic effects of C-DIM12, an NR4A modulator, and further the understanding of how this NR modulator alters inflammatory mediator signalling in myeloid cells.

2. Materials and Methods

2.1. Cell Culture

THP-1 cells (ATCC® TIB-202™, Manassas, VA, USA) were maintained in RPMI-1640-Glutamax™ media (Gibco, Cat 61870-010, Waltham, MA, USA) which was supplemented with 10% (v/v) foetal bovine serum (FBS), 100 U/mL penicillin, and 100 μg/mL streptomycin. The cells were cultured at 21% O2 and 5% CO2 and maintained in a humidified tissue culture incubator at 37 °C, balanced with nitrogen. Scrambled and NR4A2 shRNA-depleted THP-1 cells, as previously published and described [7,8,35], were maintained in the same media as ‘standard’ THP-1 cells, with the addition of puromycin (5 µg/mL). THP-1 Lucia cells were grown in RPMI-1640 growth medium (Gibco, Cat A1049101) with 4.5 g/L glucose, 10 mM HEPES, 1.0 mM sodium pyruvate, 2 mM L-glutamine, Pen-Strep (50 U/mL, 50 mg/L), 100 mg/L Normocin (InvivoGen, Cat ant-zn-1p, San Diego, CA, USA), and 10% heat-inactivated foetal bovine serum. Additionally, a selective antibiotic Zeocin (InvivoGen, Cat ant-zn-1p) was added with each sub-culturing and continuous growth in a working concentration of 1 µM. The reagents used within this article are the following: 3-[(4-Chlorophenyl)-(1H-indol-3-yl)methyl]-1H-indole (C-DIM12) (Sigma, 178946-89-9, St. Louis, MI, USA), Lipopolysaccharide (LPS) (Sigma, 58856-93-2), Flagellin (FL) (Sigma, 1002562785), tumour necrosis factor α (TNFα) (R&D systems, 210-TA-005, Minneapolis, MN, USA), interleukin-1β (IL-1β) (Sigma, I9401), Lipoteichoic acid (LTA) (Sigma, 56411-57-5), Zymosan (ZY) (Sigma, 58856-93-2), Etoposide (Etop) (Tocris, 1226), and Cadmium Chloride (CdCl2) (Sigma, 202908).

2.2. MTT Assay

MTT stock solution (5 mg/mL) was prepared using sterile PBS and stored at −20 °C. Experiments were performed in 96-well plates in duplicate, and after treatment incubation as described in the figure legends, the dye was added to the media in each well in a ratio of media:dye of 3:1 and allowed to incubate with the cells for 2 h. Subsequently, the suspension of THP-1 cells was centrifuged at 1500 rpm for 4 min to remove the media. Following this, 100 µL of DMSO was added to each well and the absorbance was calculated at a wavelength of 570 nm on a spectrophotometer (Molecular Devices, Spectra M2, San Jose, CA, USA).

2.3. Resazurin Assay

Experiments were performed in 96-well plates in duplicate and incubated as described in figure legends. A 20× resazurin stock solution was prepared by weighing out 0.011 g of resazurin powder and adding 1 mL 0.1 N NaOH, stirring for a minute, and then bringing the mixture to just under 50 mL with PBS. The pH was then adjusted to ~7.8, and the final volume was brought to 50 mL with PBS followed by passing through a 0.2 µM filter under laminar flow and subsequently stored at +4 °C protected from the light. The 20× resazurin stock was diluted 1:20 in 1× PBS. Following treatments, the resazurin dye was added directly to the media in each well at the end of the experiment in a ratio of media: resazurin dye of 20:1. The cells were incubated for 2 h. The fluorescence was measured using a fluorometer at an excitation wavelength of 540 nm and an emission of 590 nm.

2.4. RealTime-Glo™ MT Cell Viability Assay

The RealTime assay (Promega, Cat G9711, Madison, WI, USA) was performed in 96-well plates. The two reagents (MT Cell Viability Substrate and NanoLuc® Enzyme—supplied in assay kit, Promega, Madison, WI, USA) were added to the wells at the same time as treatment to a final concentration of 2×. The cells were then incubated for 72 h and at several time points the luminescence values were taken to assess cytotoxicity over time. This assay was performed in parallel with the CellTox Green Cytotoxicity assay. To note, this assay is titled ‘Cell Viability Assay’; however, it measures redox potential and is utilised here as an indirect measurement of cell viability/cytotoxicity [36].

2.5. CellTox™ Green Cytotoxicity Assay

The CellTox assay (Promega, Cat G8741, Madison, WI, USA) was used in parallel with the RealTime-Glo™ MT Cell Viability Assay, with the addition of the CellTox Green dye to a final concentration of 2× in the same wells as the RealTime-GloTM assay as per manufacturer’s instructions. The cells were then incubated for 72 h and at several time points the luminescence values were taken to assess cellular viability over time.

2.6. MultiTox-Fluor Multiplex Cytotoxicity Assay

The MultiTox-Fluor assay (Promega, Cat G9200, Madison, WI, USA) experiments were performed in 96-well plates. The MultiTox-Fluor reagent was prepared at a 2× concentration, so both substrates were transferred into the whole assay buffer. Following treatments as described in the figure legends, the MultiTox-Fluor reagent was added in each well in a 1:1 ratio of MultiTox-Fluor reagent volume to sample volume and incubated for 1 h. The fluorescence signal was then measured by using a Molecular Devices Spectra M2 machine as follows:
  • Viability substrate: excitation ~400 nm; emission ~505 nm.
  • Cytotoxicity substrate: excitation ~485 nm; emission ~520 nm.

2.7. Caspase-Glo3/7 Assay

The Caspase-Glo3/7 assay (Promega, Cat G8091) experiments were performed in 96-well plates in duplicate. Two of the wells were used as blanks which contained only media. THP-1 cells were incubated for 4 h and 24 h. Caspase-Glo 3/7 reagent was made by mixing the Caspase-Glo 3/7 buffer with the Caspase-Glo3/7 substrate as per manufacturer’s instructions. Following treatments, the Caspase-GloR 3/7 reagent was added in each well in a 1:1 ratio of Caspase-Glo3/7 reagent volume to the volume within the 96-well plate. Then, the plate was placed on a plate shaker at 300–500 rpm for 30 s and incubated at room temperature for 1 h. The luminescence values were read on a Molecular Devices Spectra M2 machine and then the blank value was subtracted.

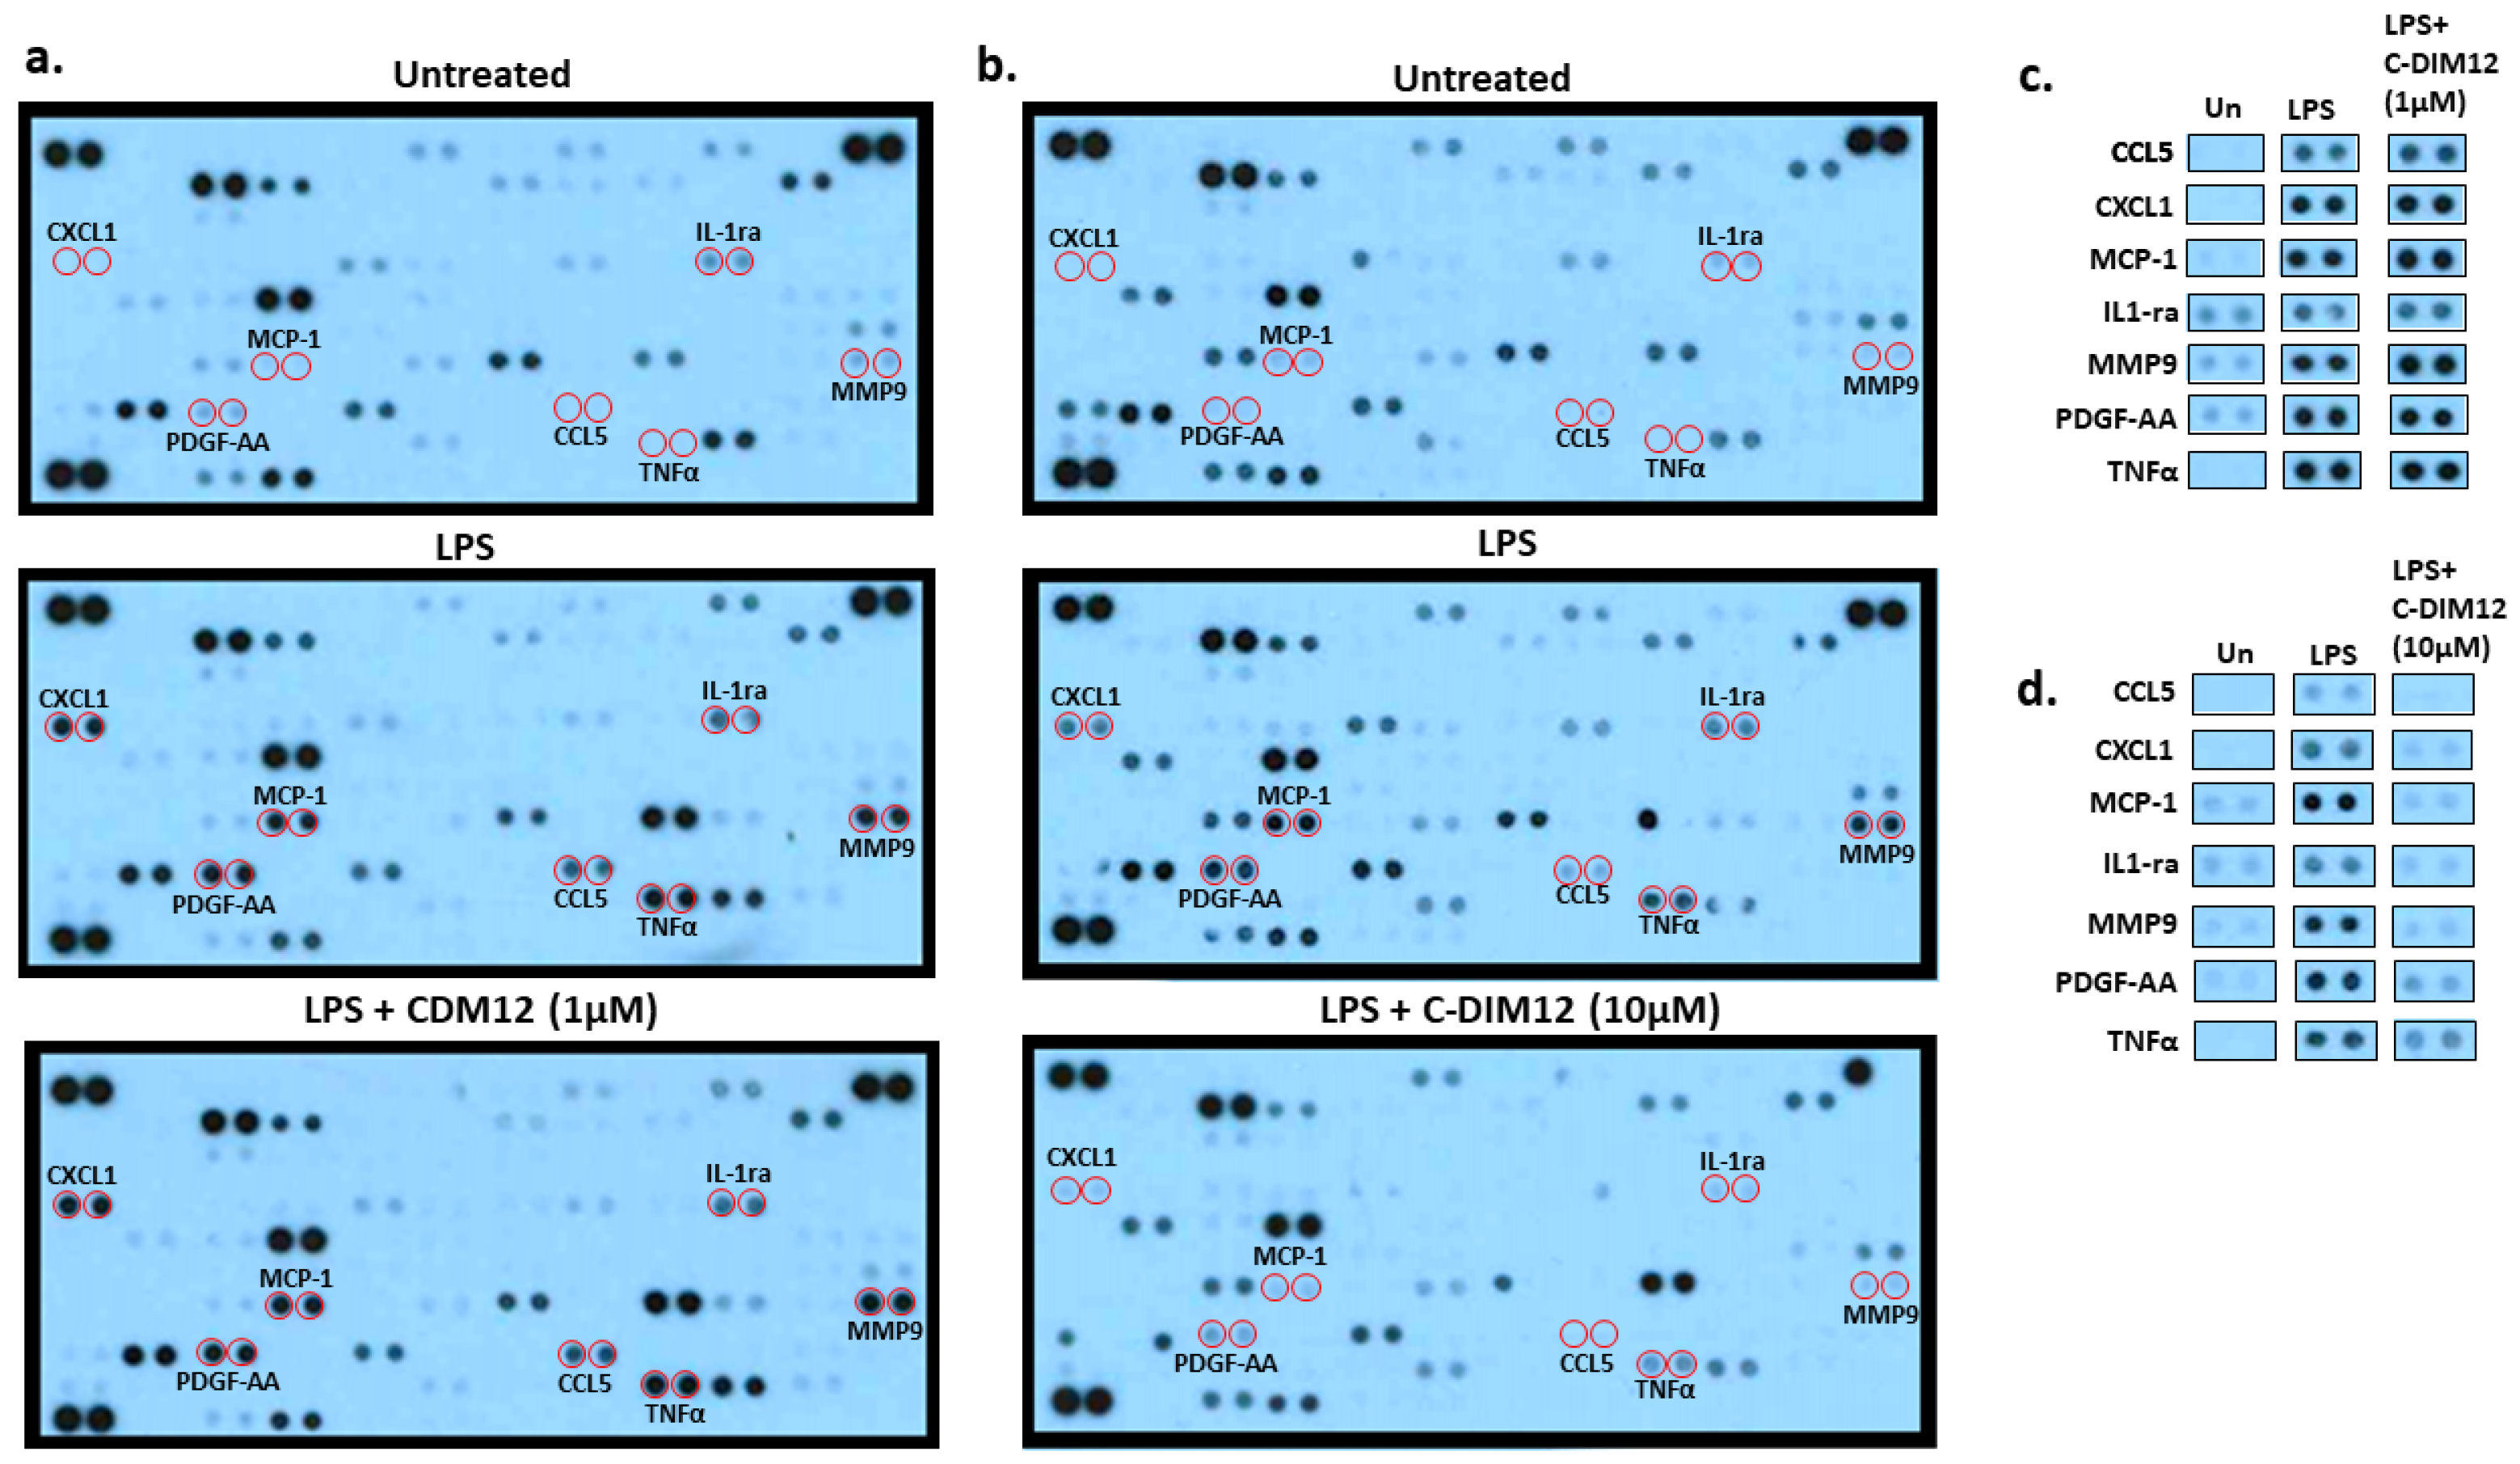
2.8. Proteome Profiler Human XL Cytokine Array Kit

The Proteome Profiler Human XL Cytokine Array Kit (R&D Systems, ARY022B) was used as per manufacturer’s instructions. Briefly, 2 mL of blocking buffer (array buffer 6), provided in the kit, was added into each well of the 4-well multi-dish containing Nitrocellulose membranes. Then, they were incubated for 1 h on a rocking platform. The blocking buffer was aspirated from the wells and the media from the experimental treatments, which were previously stored at −20 °C, were added (for this array, equal volumes of media from 4 individual experiments, per treatment, were pooled). The 4-well multi-dishes were covered with a lid and incubated overnight at +4 °C on a rocking platform. The next day, each membrane was removed and placed in a container containing wash buffer 1× (made up by adding 40 mL of wash buffer concentrate to 960 mL of deionised water). The containers with the membranes were then incubated for 10 min on a rocking platform and the washing step was repeated two times. After washing, 1.5 mL of Diluted Detection Antibody Cocktail was added to each membrane in the 4-well multi-dish (made up of 30 µL of the Detection Antibody Cocktail and 1.5 mL of the 1× array buffer 4/6) and incubated for 1 h on a rocking platform shaker. The membranes were then washed again as previously performed using wash buffer 1×. The wash buffer was then removed from each membrane and 2 mL of 1× Streptavidin-HRP, provided in the kit, was added into each membrane in the 4-well multi-dish. The 4-well multi-dish was covered with a lid and incubated for 30 min on a rocking platform shaker. The membranes were washed again as previously described, followed by wash buffer removal, and 1 mL of Chemi Reagent Mix, provided in the kit, was pipetted evenly onto each membrane. After that, the membranes were incubated for 1 min, followed by being wrapped in cling film and taped down on an X-ray cassette. In a dark room, the membranes were then exposed to X-ray film for 1–10 min and developed.

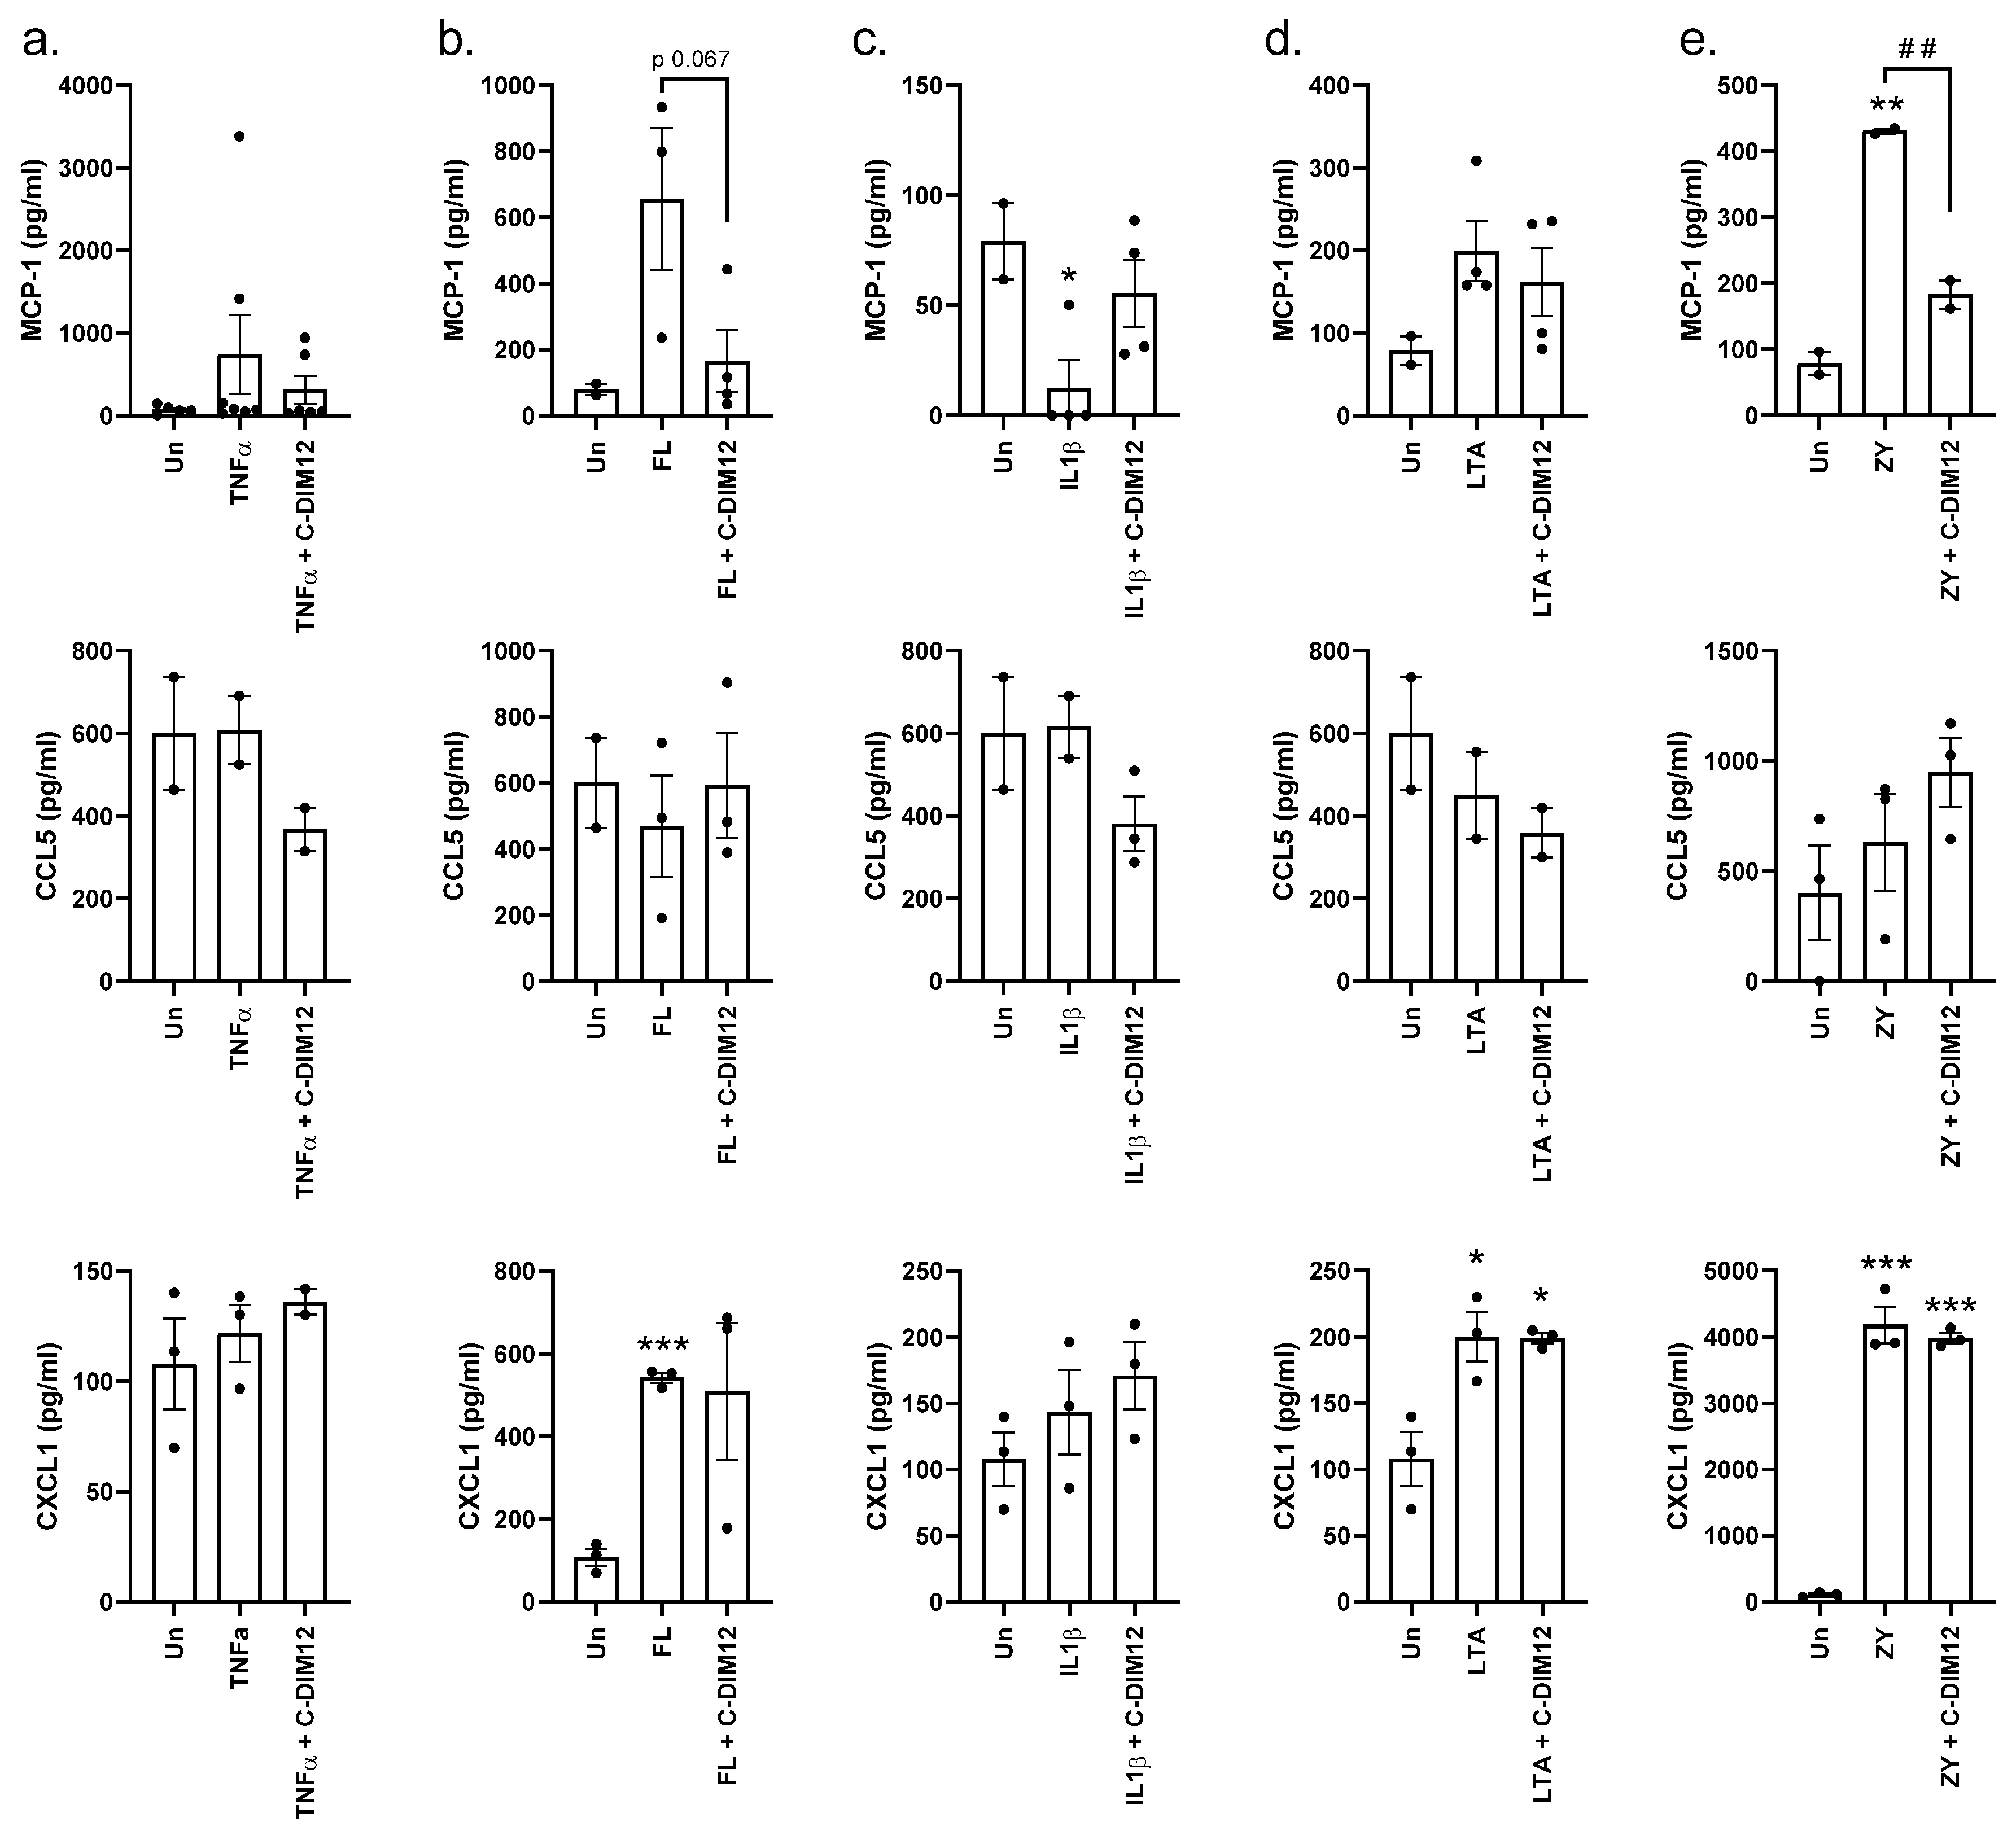
2.9. MCP-1 and CCL5 ELISA

The MCP-1 (Biolegend, Cat 438804, San Diego, CA, USA) and CCL5 (Biolegend, Cat 440804) ELISA were performed as per the manufacturer’s instructions. Briefly, the experiments were run over two days and performed in 96-well plates. On day one, the Nunc™ MaxiSorp™ ELISA Plates (BioLegend, Cat 423501) were coated with 100 µL/well of the respective capture antibodies and were kept rocking overnight at 4 °C. The following day, plates were washed four times with wash buffer (PBS and 0.05% (v/v) Tween 20). The wash buffer was removed, 100 µL of Assay Diluent A was then added to obstruct any undefined binding sites, and the plates were incubated for 1 h at room temperature. Within this incubation period, the media were diluted into several concentrations as follows: 1:5, 1:50, and 1:500 using Assay Diluent A for both ELISAs. This step is essential for optimisation to ensure that the samples would be read within the linear range of the standard curve. Following the blocking step, the plates were washed four times with wash buffer; this was then removed, and 100 µL of samples (containing all dilutions) and standards was added to the wells of a 96-well plate. They were incubated for 2 h at room temperature. Subsequently, the plates were washed four times with wash buffer and 100 µL of secondary antibody was added to each well and incubated for 1 h at room temperature. The plates were washed again four times, the wash buffer was removed, and 100 µL of Avidin-HRP solution was added to the wells and incubated for 30 min. The last wash step was repeated five times with the wash buffer and removal, followed by the addition of TMB substrate to each well, and the plates were incubated at room temperature in the dark for 15 min. An amount of 100 µL of Stop solution (BioLegend, Cat 77316) was then added to the wells and plate absorbance was calculated using a spectrophotometer (ASYS, UVM340, Biochrom, Cambridge, Cambridgeshire, UK) with a measurement filter of 450 nm and a reference filter of 570 nm. A standard curve was composed by plotting the absorbance versus the standard concentration. A second-order polynomial regression curve was used to analyse the curves and calculate unknown values. Samples obtained which correlated to the linear range of the standard curve were used and multiplied according to the dilution factor used which was 1:5 for MCP-1 and neat for CCL5.

2.10. CXCL1/GROα ELISA

This is a sandwich ELISA technique with a pre-coated antibody on a given microplate, which was specific to human CXCL1 (R&D system, Cat DGR00B). The assay was performed as per the manufacturer’s instructions. Briefly, 50 μL of Assay Diluent RD1U was added to each well followed by adding 200 µL of standards and samples which was diluted into several concentrations as follows: 1:5, 1:50, and 1:500 using Assay Diluent. The plate was then covered with the adhesive strip provided and incubated for 2 h at room temperature. After that, the plate was washed five times by adding 400 µL of washing buffer (480 mL of dH2O + 20 mL of wash buffer). Next, the wash buffer was removed, 200 µL human GROα conjugate was added to each well, and the plate was covered with a new adhesive strip and incubated for 2 h at +2–8 °C. The washing step was then repeated, the wash buffer was removed, and 200 μL of the substrate solution was added to each well and left for 15 min at room temperature protected from light. An amount of 50 µL of Stop solution was added to the wells and plate absorbance was taken using a spectrophotometer (ASYS, UVM340) with a measurement filter of 450 nm and a reference filter of 570 nm. A standard curve was composed by plotting the absorbance versus the standard concentration. A second-order polynomial regression curve was used to analyse the curves and calculate unknown values. Neat samples obtained were located within the linear range of the standard curve and were used for analysis.

2.11. QUANTI-Luc™

The media collected from the THP-1 Lucia cells, as described in the figure legends, were utilised for this analysis. Quanti-Luc secreted luciferase detection (InvivoGen, Cat rep-qlc1, San Diego, CA, USA) reagent contains the coelenterazine substrate and stabilizing agents for the luciferase reaction. The signal produced correlates to the amount of luciferase protein expressed, indicating NF-κB promoter activity in the reporter assay. Briefly, the reagent powder contents were transferred into a 50 mL screw cap tube and 25 mL of sterile water was added. The experiment was run in 96-well plates. An amount of 10 µL of media was transferred into a Nunc™ MicroWell™ 96-well plate (white plate) (ThermoFisher SCIENTIFIC, Cat 136101, Waltham, MA, USA) and 50 µL of the reagent was added. Subsequently, luminescence values were obtained by using a plate reader (CLARIOstar, BMG LABTECH, Ortenberg, Germany).

2.12. Gene Expression Analysis

RNA extraction was performed using the GenElute Mammalian Total RNA Miniprep kit (Omega, Biel/Bienne, Switzerland, Cat R6834-02), which was used as per the manufacturer’s instructions. RNase free tips (StarLab, TipOne® filter tips, Hamburg, Germany) were used, and samples were kept on ice to avoid degradation. Following RNA extraction, cDNA first-strand synthesis was then performed. An amount of 0.5 µg of sample RNA was made up to a volume of 11 µL, in a PCR tube, using RNase free water. An amount of 1 µL of random primers (Invitrogen, Cat 58875, Waltham, MA, USA) was added; tubes were vortexed, spun down, and incubated at 65 °C for two minutes on a heating block; and then they were subsequently transferred to ice. An amount of 4 µL of first-strand cDNA synthesis buffer, 2 µL of 0.1 M DTT, and 1 µL of 10 mM dNTP mix (Invitrogen, Cat 100004893) was added to each PCR tube that contained the RNA and random primers. The samples were incubated at 42 °C for two minutes in a heating block and subsequently transferred to ice. An amount of 1 µL of the reverse transcriptase enzyme, M-MLV (Invitrogen, Cat 28023-013), was added to the samples, vortexed briefly, and spun down. The complex was further incubated at 42 °C for 50 min, followed by incubation at 72 °C for 10 min. The cDNA was diluted 1:8 with ddH2O. The following was added to each well in an RT-PCR plate: 3.75 µL of sample cDNA, 0.75 µL of forward primer, 0.75 µL of reverse primer, 7.5 µL of sybr green, and 2.2 µL of ddH2O, totalling 15 µL per well. The plate was then sealed using PCR adhesive covers, spun at 250× g for one minute, and subsequently loaded onto a qRT-PCR machine (7500 Real-Time PCR system, Applied Bioscience, Waltham, MA, USA). The relative abundance of target gene MCP-1 (forward primer: GGTTGTGGAAAAGGTAGTGG, reverse primer: CCCCAAGAAGGAATGGGTCC) was quantified using GAPDH (forward primer: TGGTATCGTGGAAGGACTCA, reverse primer: ATGATGTTCTGGAGAGCCCC) as a reference target using the qBase plus software version 3.4 (Biogazelle, Ghent University, Belgium).

2.13. Glucose Uptake

The Glucose Uptake-Glo assay (Promega, Cat J1341) was performed as per the manufacturer’s instructions in 96-well plates. Following cell treatments as described in the figure legends, the cells were pelleted by centrifugation to remove the media, washed once with 100 µL PBS, and centrifuged again to remove the washing solution. Then, 2DG was prepared to a working concentration of 1 mM by dilution with PBS. An amount of 50 µL of the working concentration of 2DG was added to each cell pellet and then mixed and incubated at room temperature for 10 min. After that, 25 µL of stop buffer was added followed by the addition of 25 µL of neutralisation buffer. Then, 100 µL of 2DG6P solution, prepared 1 h in advance, was added to the cells and incubated for 1 h at room temperature. Luminescence values were then obtained using a spectrophotometer with luminescent reading capabilities (Molecular Devices, Spectra M2).

2.14. Real-Time Cell Metabolic Analysis

THP-1 cells were exposed to treatments as described in the figure legends for 24 h in DMEM. One hour prior to the termination of the experiment, cells were removed from the chambers and washed with phenol-free, bicarbonate-, and serum-free seahorse XF DMEM supplemented with glutamine (2 mM), glucose (10 mM), and pyruvate (1 mM) (Agilent). Cells were re-suspended in seahorse DMEM, counted, and seeded onto Cell-Tak (Corning, Somerville, MA, USA) adhesive-coated seahorse 96-well plates at ~150,000 cells per well, with 6 technical replicates per treatment. Cells were centrifuged on the 96-well plate (500× g) for 5 min to promote adhesion. The plate was then incubated for 90 min at 37 °C degrees in a non-CO2 incubator prior to running the assay. A Seahorse XF Cell Mito Stress Test cartridge that had previously been prepared with water and subsequently assay calibrant was loaded with oligomycin (15 mM), FCCP (10 mM), antimycin A/rotenone (5 mM), and 2-deoxy d-glucose (500 mM) (Sigma Aldrich, St. Louis, MI, USA) in ports A–D, respectively. The assay was then run on a Seahorse XF 96-well Analyser (Agilent, Santa Clara, CA, USA). Basal oxygen consumption was calculated as OCR pre-injection (3rd measurement) minus OCR post-rotenone injection. Maximal respiration was calculated as Maximal OCR post-FCCP injection minus OCR post-rotenone/antimycin A injection (3rd measurement). Basal ECAR was calculated as ECAR pre-injection (3rd measurement). Glycolytic activity was calculated as ECAR pre-injection (3rd injection) minus ECAR post-2-deoxy-glucose (3rd measurement).

2.15. Statistics

GraphPad Prism version 9.5.1 (GraphPad, San Diego, CA, USA) was used to perform all statistical analysis and to make the graphs. For all experiments (Figure 1, Figure 2, Figure 3, Figure 4, Figure 5, Figure 6 and Figure 7 and Supplemental Figure S1), a minimum of three independent biological experiments were performed (with the cytokine/chemokine arrays using the three biological independent experiments pooled for analysis). To note, due to technical/sampling errors, some individual treatments have two biological data points, and these are the untreated sample (Un) in Figure 3b and some treatments in Figure 4. All data are presented as the mean ± the standard error of the mean (±SEM). Statistical analysis, as detailed in each figure legend, was performed using a one-way analysis of variance (ANOVA) with a Dunnett’s post-hoc test, or an ANOVA with a Bonferroni’s post-hoc test or a two-tailed unpaired t-test. Statistical significance was considered and shown as *, # < 0.05, **, ## < 0.01, ***, ### < 0.001, and NS = not significant. Significance indicated by a star (*) was used to compare treatments to untreated controls (Un), and significance indicated by a hash (#) was used along with a bar attachment to show significance between other treatments.

3. Results

Effect of C-DIM12 on Inflammatory Outcome in THP-1 Cells

THP-1 cells were treated with LPS alone, with the addition of 1.0 µM C-DIM12 (Figure 1a,c), or with C-DIM12 at 10 µM (Figure 1b,d), and the secretion of multiple inflammatory mediators was examined using a cytokine/chemokine array (at 24 h). The concentrations of C-DIM12 used were selected from the standard concentrations used in the literature at present [10,26,37,38]. LPS exposure resulted in an increased secretion of several inflammatory mediators compared to the untreated control (Un) (Figure 1). Seven targets, altered by LPS, then appeared to be altered by 10 µM C-DIM12, highlighted by red circles in the larger array blots (Figure 1b). These targets were cropped out of the larger blots and are also displayed in Figure 1d for better visualisation.
Figure 1. 10 µM C-DIM12 can attenuate multiple inflammatory mediators induced by LPS in THP-1 cells. THP-1 cells were treated with Lipopolysaccharide (LPS) (1 μg/mL) with or without C-DIM12 1.0 μM (a) and 10 μM (b) for 24 h (C-DIM12 were pre-treated for 30 min prior to the addition of LPS), alongside untreated control cells. Media were removed from three separate experiments, pooled, and a cytokine/chemokine array was performed for 105 inflammatory targets, alongside internal positive/negative controls. Dot plot images of the array are displayed in part (a,b), with each dot (in duplicate) representing one target of interest. For better visualisation, targets of interest have been highlighted by a red circle on the array, with the target name included, and additionally have been cropped out (part (c)—cropped from part (a), (d)—cropped from part (b)).
Receptors 02 00018 g001
Given that C-DIM12 is predominantly reported as an NR4A2 modulator, we repeated the LPS exposure experiment using THP-1 cells depleted in NR4A2 and control scrambled cells (Figure 2a,b). These previously reported NR4A2-depleted THP-1 cells display an altered transcriptional gene profile at the basal level and become hyperinflammatory following exposure to inflammatory ligands such as LPS [7,8,35]. Thus, to mitigate the potential of saturating the assay with even greater amounts of secreted mediators from the NR4A2-depleted cells following exposure to the ligands, we moved the secretion analysis to an earlier time point of 8 h. Figure 2a,b show that following LPS exposure for 8 h, the protein secretion of several targets identified from Figure 1b,d that are responsive to C-DIM12 are further potentiated when NR4A2 is depleted compared to scrambled control cells. Several targets identified in the array have been previously identified to be NR4A-regulated, and they are highlighted here with the addition of a circle beside each target (NR4A1 = red, NR4A2 = blue, and NR4A3 = green) (Figure 2b) [7,8,39,40,41,42,43,44,45,46,47,48,49,50,51,52,53]. Furthermore, several of these targets have also been previously shown to be altered by C-DIM12 (Figure 2c) [8,26,54]. Additionally, we analysed the promoter sequence by extracting a 2 kb region upstream of the transcriptional start site using the NCBI genome and data selection viewer to examine whether any commonalities appeared for targets of interest which may give insight into why these targets are grouped together as being C-DIM12- and NR4A-altered. The commonalities observed were that all targets contained putative NF-κB binding motifs (NREs), while only IL-1ra, MCP-1, and CCL5 contained putative NR4A binding motifs (NBREs). Taken together, these data suggest a possible role for C-DIM12 beyond NR4A2.
Figure 2. NR4A2 depletion significantly alters inflammatory output in THP-1 cells following LPS exposure. (a) Scrambled control THP-1 (Sc) and NR4A2-depleted THP-1 cells (A2) were treated with Lipopolysaccharide (LPS) (1 μg/mL) alongside untreated Sc control cells for 8 h. Media were removed from three separate experiments, pooled, and a cytokine/chemokine array was performed for 105 inflammatory targets, alongside internal positive/negative controls. Dot plot images of the array are displayed, with each dot (in duplicate) representing one target of interest. For better visualisation, the targets of interest identified in Figure 1 are highlighted here in part (a) with a red circle, with the target name included. (b) For better visualisation, all targets have been cropped out, and targets identified as having previously been shown to be NR4A-regulated are indicated by circles beside each target (red = NR4A1, blue = NR4A2, and green = NR4A3). Part (c) shows targets identified in part (a,b) that have been shown to be altered by C-DIM12 in published studies.
Receptors 02 00018 g002
We next set out to confirm the arrays using quantitative ELISAs, and we focused on three targets of interest: MCP-1, CCL5 (both previously shown to be altered by C-DIM12), and CXCL1 (not shown previously to be altered by C-DIM12) [8,26,54]. We focused on the effects of the NR4A modulator, the C-DIM12-treated THP-1 cells. We did not use 1.0 µM C-DIM12 in these experiments given that it had resulted in no changes to the inflammatory response elicited by LPS (Figure 1a,c). Figure 3a–c show that 10 µM C-DIM12 can significantly reduce LPS-induced MCP-1, partially reduce CCL5, and has no effect on CXCL1 (at 24 h). We next expanded our experiments to determine how C-DIM12 affects MCP-1, CCL5, and CXCL1 protein secretion downstream of five additional inflammatory ligands (TNFα, FL, IL-1β, LTA, and ZY) (Figure 4). No significant changes were observed for CCL5 protein secretion upon exposure to any ligand or C-DIM12. While FL, LTA, and ZY significantly increased CXCL1 protein secretion, the addition of C-DIM12 did not significantly change this increase. Figure 4e shows that ZY resulted in a significant increase in MCP-1 secretion at 24 h, which was significantly attenuated by the addition of C-DIM12. FL resulted in an increase in MCP-1 at 24 h, which was attenuated by the addition of C-DIM12, albeit not significantly (p-value 0.067) (Figure 4b).
Figure 3. C-DIM12 can attenuate specific inflammatory mediators following LPS exposure in THP-1 cells. THP-1 cells were pre-treated with C-DIM12 (10 µM) for 30 min, followed by the addition of Lipopolysaccharide (LPS) (1 µg/mL), cells treated only with LPS (1 µg/mL) alone, treated cells, and untreated control (Un) cells for 24 h. At 24 h, media were collected, and an ELISA was performed for MCP-1, CCL5, and CXCL1 ((a), (b), and (c), respectively). Data are shown as raw pg/mL values and displayed as the average ±SEM, showing all data points. Statistical analysis was performed using a two-tailed unpaired t-test, *, # < 0.05, *** < 0.001. A star (*) denotes significance compared to Un cells, while a hash (#) denotes significance between treatments highlighted using a bar.
Receptors 02 00018 g003
Figure 4. 10 µM C-DIM12 can attenuate specific ligand-induced inflammatory mediators in THP-1 cells. THP-1 cells were pre-treated with C-DIM12 (10 µM) for 30 min, followed by the addition of inflammatory ligands (a) Tumour necrosis factor α (TNFα) (10 ng/mL), (b) flagellin (FL) (100 ng/mL), (c) interleukin-1β (IL-1β) (100 ng/mL), (d) lipoteichoic acid (LTA) (2.5 µg/mL), and (e) zymosan (ZY) (25 µg/mL) for 24 h. Cells treated with inflammatory ligands alone and untreated control (Un) cells were also included alongside each treatment in (ae) for 24 h. At 24 h, media were collected from all treatments and an ELISA was performed for MCP-1 (top row), CCL5 (middle row), and CXCL1 (bottom row) for each ligand (ae). Data are shown as raw pg/mL values and displayed as the average ±SEM, showing all data points. Statistical analysis was performed using a two-tailed unpaired t-test, * < 0.05, **, ## < 0.01, *** < 0.001. A star (*) denotes significance compared to Un cells, while a hash (#) denotes significance between treatments highlighted using a bar.
Receptors 02 00018 g004
Next, we examined how C-DIM12 affected NF-κB transcriptional activity. The rationale for this was that MCP-1 is a prototypical NF-κB target gene in myeloid cells [55,56]. Furthermore, it is well established that NR4As and their modulators can affect NF-κB activity, and this is one of their pivotal mechanisms of action when acting in an anti-inflammatory context [1,2,26,57]. Hence, changes observed in these targets may be reflective of altered NF-κB activity. For these experiments, we used THP-1 Lucia cells as previously published [58]. These cells express a stable NF-ĸB inducible reporter construct, which can be monitored to determine NF-ĸB transcriptional activity following cell treatments. THP-1 lucia cells were treated with all six inflammatory ligands alone or in the presence of C-DIM12 (10 µM) and NF-κB transcriptional activity was assessed at 24 h (Figure 5). Apart from IL-1β, all other ligands resulted in a significant increase in NF-κB transcriptional activity, which was significantly attenuated by the addition of 10 µM C-DIM12 (Figure 5a–f). For these Lucia cell experiments, we also used 1.0 µM C-DIM12 given the sensitivity of the assay. We show that 1.0 µM C-DIM12 did not alter the significant increase in NF-κB transcriptional activity observed with all six ligands following 24 h exposure (Figure 5g–l). We next considered if C-DIM12’s effects on MCP-1 levels were through suppressing NF-ĸB activity. Whether this suppression is through or independent of the NR4As, we would expect a level of change, not only in the protein levels of MCP-1 but also in gene expression changes. Figure 6a,b show that LPS and FL significantly increased the gene expression levels of MCP-1 at 24 h, and this significance was lost in the presence of C-DIM12. Regarding ZY, although MCP-1 gene expression levels were increased due to ZY exposure at 24 h, the addition of C-DIM12 resulted in variable responses with no significant changes (Figure 6c).
Figure 5. 10 µM C-DIM12 can attenuate NF-κB transcriptional activity induced by multiple inflammatory ligands in THP-1 Lucia cells. THP-1 Lucia cells were pre-treated with 10 µM (af) and 1.0 µM (gl) of C-DIM12 for 30 min, followed by the addition of inflammatory ligands, Lipopolysaccharide (LPS) (1 µg/mL), flagellin (FL) (100 ng/mL), tumour necrosis factor α (TNFα) (10 ng/mL), interleukin-1β (IL-1β) (100 ng/mL), lipoteichoic acid (LTA) (2.5 µg/mL), and zymosan (ZY) (25 µg/mL), in addition to cells treated with the inflammatory ligand alone and untreated control (Un) cells for 24 h. At 24 h, media were collected from THP-1 Lucia cells, and NF-κB activity was examined using the Quanti-Luc detection system. Data are shown as raw luminescence values and displayed as the average ±SEM, showing all data points. Statistical analysis was performed using a two-tailed unpaired t-test. *, # < 0.05, **, ## < 0.01, *** < 0.001, and NS = not significant. A star (*) denotes significance compared to Un cells, while a hash (#) denotes significance between treatments highlighted using a bar. NS = not significant.
Receptors 02 00018 g005
Figure 6. 10 µM C-DIM12 attenuates LPS- and FL-induced MCP-1 gene expression in THP-1 cells. THP-1 cells were pre-treated with C-DIM12 (D12) (10 µM) for 30 min, followed by the addition of inflammatory ligands: (a) Lipopolysaccharide (LPS) (1 µg/mL), (b) flagellin (FL) (100 ng/mL), and (c) zymosan (ZY) (25 µg/mL) for 24 h. At 24 h, RNA was extracted, and cDNA synthesis was performed followed by qRT-PCR for target gene MCP-1 and reference target GAPDH. The relative abundance of MCP-1 was calculated, and values are displayed here as fold over untreated (Un) control cells (FOC). Data are displayed as the average ± SEM, showing all data points. Statistical analysis was performed using a one-way analysis of variance (ANOVA) with a Bonferroni’s post-hoc test. * < 0.05 and NS = not significant.
Receptors 02 00018 g006
Although concentrations used within these experiments were based on the current published literature [10,26,37,38], we thought it prudent to perform some cytotoxicity analyses to see if we could account for any reason, other than biological, for C-DIM12 having such diverse effects from 1.0 µM to 10 µM. At 1.0 µM C-DIM12, no changes were observed in any cytotoxicity assay used (Figure S1). While 10 µM C-DIM12 significantly attenuated the redox potential of the cell, which infers cytotoxicity, as measured using the MTT and resazurin assays, and a significant albeit small increase in caspase 3/7 activity was observed at 24 h (Figure S1a,b,f). At 4 h, only 50 µM C-DIM12 resulted in an increase in caspase 3/7 activity (Figure S1e). However, using the RealTime Glo MT assay, a luminescence-based assay reported as a more sensitive redox potential assay than standard colorimetric or fluorescent assays, such as the MTT and resazurin [36], no significant decrease in redox potential was observed with 10 µM C-DIM12 (Figure S1c). Additionally, using the CellTox Green assay, a direct measure of cytotoxicity, no changes were observed following exposure with 10 µM C-DIM12 for 24 h (Figure S1d).
Some disparity was observed with the MTT, resazurin, and RealTime Glo MT assays, and as these assays primarily reflect redox changes within the mitochondria, we thought it prudent to examine an array of metabolic parameters, focusing on LPS as the stimuli. Real-time cell metabolic analysis using a seahorse analyser shows that LPS does not alter basal respiration, max respiration, H+ leak, coupling efficiency, spare respiration capacity, non-mitochondrial consumption, and ATP production. Moreover, the addition of C-DIM12 does not alter any of these parameters (Figure 7a–g). While no difference was observed between LPS- and LPS+ C-DIM12-treated THP-1 cells in relation to their glycolytic capacity (Figure 7h), the glucose uptake capacity of the THP-1 cell increases with LPS exposure and is more significantly increased with the addition of C-DIM12 to LPS compared to untreated control cells (Figure 7i). Dimethyloxalylglycine (DMOG) has been shown to increase glucose uptake [59], and it was used in this study as a positive control to demonstrate glucose uptake.
Figure 7. C-DIM12 does not significantly alter the metabolic profile of THP-1 cells in LPS exposure. Real-time metabolic analysis was performed on THP-1 cells exposed to LPS (1 µg/mL) alone and LPS (1 µg/mL) + C-DIM12 (10 µM) for 24 h prior to a Seahorse XF Mito Stress Test being performed (ah). THP-1 cells were pre-treated with C-DIM12 (10 µM) for 30 min, followed by the addition of LPS (1 µg/mL), and LPS (1 µg/mL) alone, untreated cells (Un), and dimethyloxalylglycine (DMOG) (1.0 µM) were used as the controls for a further 24 h (i). A glucose uptake assay was then performed (i). Data are shown as mph/min (ah) and raw luminescence (i) and displayed as the average ±SEM, showing all data points. Statistical analysis was performed using two-tailed unpaired t-test. * < 0.05, *** < 0.001. A star (*) denotes significance compared to Un cells.
Receptors 02 00018 g007

4. Discussion

Studies have shown that NR4A modulators can reduce inflammatory processes, reducing the disease burden, and are as such excellent therapeutic candidates [25,26,27,28,29,31]. C-DIM12 has been shown to protect against the loss of dopamine neurons in mice treated with 1-methyl-4-phenyl-1,2,3,6-tetrahydropyridine 1 probenecid (MPTPp) [30,54], while other studies to date having focused on in vitro models and show that it can attenuate inflammatory processes [10,26,37,38,60]. With that said, the efficacy of NR4A modulators in distinct settings is limited and was the focus of this study. Herein, we have examined the efficacious profiles of C-DIM12 and how it impacts the downstream responses to a diverse range of inflammatory ligands in a myeloid cell. We focused on a myeloid cell for specific reasons: firstly, these are significant cells involved in mediating the pathogenesis and profile of numerous diseases [33]; secondly, the role of the NR4As as critical regulators of such cells is well established [2,7,8,9]; and lastly, studies have shown that C-DIM12 can alter inflammatory pathways in such a cell lineage [26,60]. Data presented in this study show that C-DIM12 can selectively alter key inflammatory mediator MCP-1 and NF-κB activity downstream of distinct inflammatory ligands LPS, FL, and ZY in a myeloid cell type.
Efficacy studies undertaken began with the use of LPS, an established TLR ligand and regulator of the NR4As in myeloid cell types [7,8,9,26]. In addition, studies have shown in detail how the NR4As function within an LPS-TLR pathway, such as their key role as regulators of NF-κB activity and its target genes [2,50]. Protein array analysis revealed several targets that were increased in THP-1 cells due to LPS, which were then attenuated by the addition of C-DIM12 (10 µM). These targets, CCL5, CXCL1, MCP-1, IL-1ra, MMP9, PDGF-AA, and TNFα, have been previously shown to be induced by LPS [7,8,26,40,43,44,61,62,63]. Of these targets, following LPS exposure, CCL5, CXCL1, and MCP-1 expression was further potentiated in NR4A2-depleted cells (Figure 2a,b). Such data support the C-DIM12 data array and suggest that its attenuation of these targets (CCL5, CXCL1, and MCP-1) may be mediated through NRA42. It is established that all three targets have been previously shown to be modulated by the NR4As [7,8,64,65]. While C-DIM12 has been shown to affect MCP-1 and CCL5 expression in BV-2 microglia cells [26,54] and CCL5 in 1-methyl-4-phenyl-1,2,3,6-tetrahydropyridine 1 + probenecid (MPTPp) challenged mice [50], to the best of our knowledge, it has not been shown to affect CXCL1 expression.
The quantitative ELISA analysis matches our protein array data, confirming that LPS significantly enhances MCP-1 protein secretion, which is significantly attenuated by the addition of C-DIM12 (10 µM). Regarding CCL5, while not significant, data obtained demonstrate that LPS induced levels which are reduced following exposure to C-DIM12. Attenuation of LPS-induced MCP-1 and CCL5 expression by the addition of 10 µM C-DIM12 has been previously reported by Miranda et al. in microglia cells and matches our observations here in THP-1 cells (Figure 3a,b) [26]. Miranda et al. further observed that 1.0 µM C-DIM12 attenuated LPS-induced CCL5 expression, and from our protein array data, we did not observe an attenuation of LPS-induced CCL5 secretion using 1.0 µM C-DIM12 in THP-1 cells (Figure 1a,c). However, data from both Miranda et al. and this study confirm that at the lower concentration of 1 µM, C-DIM12 was unable to attenuate LPS-induced MCP-1 levels (Figure 1a,b) [26]. To note, our CXCL1 quantitative data do not truly reflect our array data. While we did observe a significant increase in CXCL1 secreted levels following LPS exposure, C-DIM12 was not capable of attenuating secreted protein levels. Thus, acknowledging the limitations of the arrays, the quantitative confirmation confirms that C-DIM12 can attenuate LPS-driven MCP-1 expression significantly, and it shows a trend toward attenuating CCL5.
Next, we set out to examine whether C-DIM12 could alter MCP-1 downstream of other inflammatory ligands, being TNFα, FL, IL-1β, LTA, and ZY. The aim here was to establish whether these modulators are specific to altering the LPS pathway in myeloid cells or act more broadly in inflammatory signalling pathways. Data obtained from ZY and FL mirror that of the LPS data. Interestingly, the three ligands are toll-like receptor (TLR) ligands (LPS: TLR4, ZY: TLR2/6, and FL: TLR5), sharing the MyD88 adaptor, and NF-κB is a major downstream regulator [15]. Such a shared response profile may account for the similarity observed here in the targets that are induced but also in how NR4A modulators affect each target. While studies have shown that ZY can induce NR4A2 [6], to the best of our knowledge, this is the first study describing how NR4A modulators alter targets downstream of ZY and FL. Regarding TNFα, IL-1β, and LTA, while some changes were observed due to the ligands themselves, no alteration in the response occurred with the addition of C-DIM12. Intriguingly, LTA is also a TLR2 ligand, like ZY. With that said, the magnitude of induction for LTA was far less than the other TLR ligands, perhaps concentration and time exposure may play a role in such a response, and extended analysis of concentration and time is required to conclusively rule that LTA is a TLR ligand that responds differently to NR4A modulators.
It is known that NF-κB is a major downstream regulator of the ligands used in this study which respond to the NR4A modulators [15,16]. As mentioned, studies have shown that the NR4As impact the NF-κB pathway, and molecular studies reveal that NR4A2 recruits a corepressor called CoREST, which in turn limits NF-κB transcriptional activity by clearing subunit p65 from the promoters of target genes [50]. In addition, C-DIM12 has been shown to inhibit NF-κB transcriptional activity and the expression of its target genes following LPS treatment in microglia cells [26]. Moreover, the target genes identified in this study, MCP-1, CXCL1, and CCL5, have been shown to be regulated by NF-κB [8,66,67,68], and promoter analysis performed by us confirms putative NF-κB binding sites on each target. Using the THP-1 lucia cells shows that C-DIM12 can significantly attenuate NF-κB transcriptional activity driven by ligands LPS, FL, ZY, TNFα, and LTA. While at 1.0 µM, C-DIM12 loses the ability to attenuate NF-κB transcriptional activity. We have also shown that C-DIM12 can reduce the significant increase in MCP-1 gene expression following LPS or FL exposure at 24 h in THP-1 cells. We have previously shown using the NF-ĸB inhibitor BAY11-7082 that MCP-1 gene expression is NF-ĸB-regulated in THP-1 and raw mac 264.7 cells [8]. Taken together, we speculate that C-DIM12 affects NF-ĸB transcriptional activity, thereby reducing gene expression levels of MCP-1 and in turn the levels of secreted protein. Whether this inhibition is through C-DIM12 impacting the NF-ĸB pathway directly or indirectly through the NR4As is not known yet and warrants further analysis in future studies.
We observed some disparity between methods regarding the cells’ reducing capacity at the 10 µM and not 1.0 µM C-DIM12 concentration, inferring that perhaps a metabolic change was occurring due to C-DIM12 at the higher concentration. Alterations in metabolic profiles can impact inflammatory pathways [69,70], and NR4A2 has been shown to play roles in glucose metabolism, including, but not limited to, increasing glucose uptake, glycogen storage, and binding to the GLUT4 promoter [71,72]. As such, we postulated that a metabolic change may be occurring that could account for the mechanism of anti-inflammatory action observed due to C-DIM12. LPS and LPS + C-DIM12 increase the glucose uptake and glycolytic capacity of THP-1 cells compared to untreated control cells, with the LPS + C-DIM12 increase being the only significant increase. LPS increasing the glycolytic capacity in myeloid cells has been shown previously [70]. However, no significant change in glucose uptake or glycolytic capacity was observed in this study between LPS and LPS + C-DIM12. And due to this lack of difference between LPS and LPS + C-DIM12, we do not consider this a significant pathway change that may account for inflammatory changes observed. It is important to note that we have not directly shown that the actions of C-DIM12 identified in this study are through specific NR4A receptors, using KO models or intervention studies. Even though it was not the focus of the study, it is nonetheless an important factor to acknowledge. Future studies should consider the use of such models to further define the mechanism of action of C-DIM12, and whether this is through a specific NR4A family member(s) or some other mechanism of action. Moreover, considering the modest time NR4A modulators have been in use, and the recent study shedding further light on the selective binding interaction with NR4A family members [22], prudence should be applied when identifying such modulators as specific for an NR4A family member. Furthermore, we have recently reported that NR4A2 also plays a role in the unstimulated state in THP-1 monocyte cells [35]. Within this study, we have not used C-DIM12 on the unstimulated monocyte cells, as we have focused on the stimulated state to reflect an inflamed cell found in many pathological diseases. Nonetheless, the effects of C-DIM12 on unstimulated monocyte cells may be worth considering in future studies, not only in terms of toxicity profiling but also in terms of changes in gene expression/cellular phenotype.
In summary, here we have shown that C-DIM12 can specifically alter MCP-1 in response to a broad array of ligands. Furthermore, we show that C-DIM12 possesses the ability to significantly attenuate NF-κB transcriptional activity following activation by multiple ligands. And lastly, while we did observe a subtle, but significant, increase in glucose uptake with the addition of C-DIM12 to LPS, no other changes in metabolic parameters measured reveal any mechanistic insights into C-DIM12’s anti-inflammatory properties observed here. Thus, herein we have expanded the experimental analysis to further our understanding of the efficacious profile and interference effects associated with the NR4A modulator C-DIM12.

Supplementary Materials

The following supporting information can be downloaded at https://www.mdpi.com/article/10.3390/receptors2040018/s1, Figure S1: Cytotoxicity analysis of C-DIM12 in THP-1 cells.

Author Contributions

S.A. performed all experimental work and contributed to experimental design and analysis. M.M. contributed to THP-1 Lucia cell experiments. B.M., M.I. and H.E.G. contributed to cellular work and contributed to experimental design. T.J.H. performed the promoter sequence analysis. E.P.M. contributed to experimental design and the generation of NR4A-depleted THP-1 cells. E.P.C. contributed to experimental design and analysis throughout the study. D.C. contributed to and finalised all experimental approaches and analysis. D.C. and S.A. edited the final manuscript after comments from authors. All authors have read and agreed to the published version of the manuscript.

Funding

This work was funded by the Saudi Arabian Cultural Bureau (SACB) as part of a funded PhD for Sarah Aldhafiri. EP Cummins is funded by a Science Foundation Ireland (SFI) Career Development Award (15/CDA/3490).

Institutional Review Board Statement

Not applicable.

Informed Consent Statement

Not applicable.

Data Availability Statement

There are no large datasets used in this study.

Acknowledgments

We kindly thank Ronald Tjalkens for his time reading an early draft of this article and providing feedback and Catherine Godson for her assistance in carrying out the THP-1 Lucia work.

Conflicts of Interest

All authors declare no conflict of interest.

Abbreviations

α-KGα-ketoglutarate
CCL5Chemokine ligand 5
Csn-BCytosporone B
CXCL1Chemokine (C-X-C motif) ligand 1
C-DIM123-[(4-Chlorophenyl)-(1H-indol-3-yl)methyl]-1H-indole
FLFlagellin
KOKnock out
IL-1βInterleukin-1 beta
IL-1RInterleukin-1 receptor
IL-1raInterleukin-1 receptor alpha
LPSLipopolysaccharide
LTALipoteichoic acid
MCP-1Monocyte chemoattract protein-1
MMP9Matrix metalloproteinase 9
MPP+1-methyl-4-phenylpyridinium
MPTP1-methyl-4-phenyl-1,2,3,6-tetrahydropyridine
MyD88Myeloid differentiation primary response 88
NBRENR4A binding motifs
NF-κBNuclear factor kappa-light-chain-enhancer of activated B cells
NR4AOrphan nuclear receptor subfamily 4A
NRENF-κB binding motifs
PDGF-AAPlatelet-derived growth factor-AA
TLRToll-Like Receptor
TNFαTumour necrosis factor alpha
TNFRTumour necrosis factor receptor
ZYZymosan

References

  1. Kurakula, K.; Koenis, D.S.; van Tiel, C.M.; de Vries, C.J. NR4A nuclear receptors are orphans but not lonesome. Biochim. Biophys. Acta 2014, 1843, 2543–2555. [Google Scholar] [CrossRef] [PubMed]
  2. Murphy, E.P.; Crean, D. Molecular Interactions between NR4A Orphan Nuclear Receptors and NF-κB Are Required for Appropriate Inflammatory Responses and Immune Cell Homeostasis. Biomolecules 2015, 5, 1302–1318. [Google Scholar] [CrossRef] [PubMed]
  3. Zhao, Y.; Bruemmer, D. NR4A Orphan Nuclear Receptors in Cardiovascular Biology. Drug Discov. Today Dis. Mech. 2009, 6, e43–e48. [Google Scholar] [CrossRef]
  4. Ashouri, J.F.; Hsu, L.Y.; Yu, S.; Rychkov, D.; Chen, Y.; Cheng, D.A.; Sirota, M.; Hansen, E.; Lattanza, L.; Zikherman, J.; et al. Reporters of TCR signaling identify arthritogenic T cells in murine and human autoimmune arthritis. Proc. Natl. Acad. Sci. USA 2019, 116, 18517–18527. [Google Scholar] [CrossRef] [PubMed]
  5. Elcombe, S.E.; Naqvi, S.; Van Den Bosch, M.W.; MacKenzie, K.F.; Cianfanelli, F.; Brown, G.D.; Arthur, J.S. Dectin-1 regulates IL-10 production via a MSK1/2 and CREB dependent pathway and promotes the induction of regulatory macrophage markers. PLoS ONE 2013, 8, e60086. [Google Scholar] [CrossRef] [PubMed]
  6. Mahajan, S.; Saini, A.; Chandra, V.; Nanduri, R.; Kalra, R.; Bhagyaraj, E.; Khatri, N.; Gupta, P. Nuclear Receptor Nr4a2 Promotes Alternative Polarization of Macrophages and Confers Protection in Sepsis. J. Biol. Chem. 2015, 290, 18304–18314. [Google Scholar] [CrossRef] [PubMed]
  7. Crean, D.; Cummins, E.P.; Bahar, B.; Mohan, H.; McMorrow, J.P.; Murphy, E.P. Adenosine Modulates NR4A Orphan Nuclear Receptors to Attenuate Hyperinflammatory Responses in Monocytic Cells. J. Immunol. 2015, 195, 1436–1448. [Google Scholar] [CrossRef] [PubMed]
  8. McEvoy, C.; de Gaetano, M.; Giffney, H.E.; Bahar, B.; Cummins, E.P.; Brennan, E.P.; Barry, M.; Belton, O.; Godson, C.G.; Murphy, E.P.; et al. NR4A Receptors Differentially Regulate NF-κB Signaling in Myeloid Cells. Front. Immunol. 2017, 8, 7. [Google Scholar] [CrossRef]
  9. Pei, L.; Castrillo, A.; Chen, M.; Hoffmann, A.; Tontonoz, P. Induction of NR4A orphan nuclear receptor expression in macrophages in response to inflammatory stimuli. J. Biol. Chem. 2005, 280, 29256–29262. [Google Scholar] [CrossRef]
  10. Afzali, M.F.; Popichak, K.A.; Burton, L.H.; Klochak, A.L.; Wilson, W.J.; Safe, S.; Tjalkens, R.B.; Legare, M.E. A novel diindolylmethane analog, 1,1-bis(3′-indolyl)-1-(p-chlorophenyl) methane, inhibits the tumor necrosis factor-induced inflammatory response in primary murine synovial fibroblasts through a Nurr1-dependent mechanism. Mol. Immunol. 2018, 101, 46–54. [Google Scholar] [CrossRef]
  11. McEvoy, A.N.; Murphy, E.A.; Ponnio, T.; Conneely, O.M.; Bresnihan, B.; FitzGerald, O.; Murphy, E.P. Activation of nuclear orphan receptor NURR1 transcription by NF-kappa B and cyclic adenosine 5’-monophosphate response element-binding protein in rheumatoid arthritis synovial tissue. J. Immunol. 2002, 168, 2979–2987. [Google Scholar] [CrossRef] [PubMed]
  12. Xiong, Y.; Ran, J.; Xu, L.; Tong, Z.; Adel Abdo, M.S.; Ma, C.; Xu, K.; He, Y.; Wu, Z.; Chen, Z.; et al. Reactivation of NR4A1 Restrains Chondrocyte Inflammation and Ameliorates Osteoarthritis in Rats. Front. Cell Dev. Biol. 2020, 8, 158. [Google Scholar] [CrossRef] [PubMed]
  13. Lappas, M. Effect of spontaneous term labour on the expression of the NR4A receptors nuclear receptor related 1 protein (Nurr1), neuron-derived clone 77 (Nur77) and neuron-derived orphan receptor 1 (NOR1) in human fetal membranes and myometrium. Reprod. Fertil. Dev. 2016, 28, 893–906. [Google Scholar] [CrossRef] [PubMed]
  14. Hayden, M.S.; Ghosh, S. Regulation of NF-κB by TNF family cytokines. Semin. Immunol. 2014, 26, 253–266. [Google Scholar] [CrossRef] [PubMed]
  15. Kawai, T.; Akira, S. Signaling to NF-kappaB by Toll-like receptors. Trends Mol. Med. 2007, 13, 460–469. [Google Scholar] [CrossRef] [PubMed]
  16. Liu, T.; Zhang, L.; Joo, D.; Sun, S.C. NF-κB signaling in inflammation. Signal Transduct. Target. Ther. 2017, 2, 17023. [Google Scholar] [CrossRef] [PubMed]
  17. Haddad, M. The Impact of CB1 Receptor on Nuclear Receptors in Skeletal Muscle Cells. Pathophysiol. Off. J. Int. Soc. Pathophysiol. 2021, 28, 457–470. [Google Scholar] [CrossRef]
  18. Giffney, H.E.; Cummins, E.P.; Murphy, E.P.; Brayden, D.J.; Crean, D. Protein kinase D, ubiquitin and proteasome pathways are involved in adenosine receptor-stimulated NR4A expression in myeloid cells. Biochem. Biophys. Res. Commun. 2021, 555, 19–25. [Google Scholar] [CrossRef]
  19. Haddad, M. The Impact of Adenosine A2B Receptors Modulation on Nuclear Receptors (NR4A) Gene Expression. Biomed. Pharmacol. J. 2016, 9, 177–185. [Google Scholar] [CrossRef]
  20. Chintharlapalli, S.; Burghardt, R.; Papineni, S.; Ramaiah, S.; Yoon, K.; Safe, S. Activation of Nur77 by selected 1,1-Bis(3′-indolyl)-1-(p-substituted phenyl)methanes induces apoptosis through nuclear pathways. J. Biol. Chem. 2005, 280, 24903–24914. [Google Scholar] [CrossRef]
  21. Dubois, C.; Hengerer, B.; Mattes, H. Identification of a potent agonist of the orphan nuclear receptor Nurr1. ChemMedChem 2006, 1, 955–958. [Google Scholar] [CrossRef] [PubMed]
  22. Munoz-Tello, P.; Lin, H.; Khan, P.; de Vera, I.M.S.; Kamenecka, T.M.; Kojetin, D.J. Assessment of NR4A Ligands That Directly Bind and Modulate the Orphan Nuclear Receptor Nurr1. J. Med. Chem. 2020, 63, 15639–15654. [Google Scholar] [CrossRef] [PubMed]
  23. Safe, S.; Shrestha, R.; Mohankumar, K. Orphan nuclear receptor 4A1 (NR4A1) and novel ligands. Essays Biochem. 2021, 65, 877–886. [Google Scholar] [CrossRef] [PubMed]
  24. Zhan, Y.; Du, X.; Chen, H.; Liu, J.; Zhao, B.; Huang, D.; Li, G.; Xu, Q.; Zhang, M.; Weimer, B.C.; et al. Cytosporone B is an agonist for nuclear orphan receptor Nur77. Nat. Chem. Biol. 2008, 4, 548–556. [Google Scholar] [CrossRef] [PubMed]
  25. De Miranda, B.R.; Miller, J.A.; Hansen, R.J.; Lunghofer, P.J.; Safe, S.; Gustafson, D.L.; Colagiovanni, D.; Tjalkens, R.B. Neuroprotective efficacy and pharmacokinetic behavior of novel anti-inflammatory para-phenyl substituted diindolylmethanes in a mouse model of Parkinson’s disease. J. Pharmacol. Exp. Ther. 2013, 345, 125–138. [Google Scholar] [CrossRef] [PubMed]
  26. De Miranda, B.R.; Popichak, K.A.; Hammond, S.L.; Jorgensen, B.A.; Phillips, A.T.; Safe, S.; Tjalkens, R.B. The Nurr1 Activator 1,1-Bis(3′-Indolyl)-1-(p-Chlorophenyl)Methane Blocks Inflammatory Gene Expression in BV-2 Microglial Cells by Inhibiting Nuclear Factor κB. Mol. Pharmacol. 2015, 87, 1021–1034. [Google Scholar] [CrossRef] [PubMed]
  27. Ding, X.; Le, S.; Wang, K.; Su, Y.; Chen, S.; Wu, C.; Chen, J.; Chen, S.; Zhang, A.; Xia, J. Cytosporone B (Csn-B), an NR4A1 agonist, attenuates acute cardiac allograft rejection by inducing differential apoptosis of CD4+T cells. Int. Immunopharmacol. 2022, 104, 108521. [Google Scholar] [CrossRef]
  28. Inamoto, T.; Papineni, S.; Chintharlapalli, S.; Cho, S.D.; Safe, S.; Kamat, A.M. 1,1-Bis(3′-indolyl)-1-(p-chlorophenyl)methane activates the orphan nuclear receptor Nurr1 and inhibits bladder cancer growth. Mol. Cancer Ther. 2008, 7, 3825–3833. [Google Scholar] [CrossRef]
  29. Pulakazhi Venu, V.K.; Alston, L.; Iftinca, M.; Tsai, Y.C.; Stephens, M.; Warriyar, K.V.V.; Rehal, S.; Hudson, G.; Szczepanski, H.; von der Weid, P.Y.; et al. Nr4A1 modulates inflammation-associated intestinal fibrosis and dampens fibrogenic signaling in myofibroblasts. Am. J. Physiol. Gastrointest. Liver Physiol. 2021, 321, G280–G297. [Google Scholar] [CrossRef]
  30. De Miranda, B.R.; Popichak, K.A.; Hammond, S.L.; Miller, J.A.; Safe, S.; Tjalkens, R.B. Novel para-phenyl substituted diindolylmethanes protect against MPTP neurotoxicity and suppress glial activation in a mouse model of Parkinson’s disease. Toxicol. Sci. Off. J. Soc. Toxicol. 2015, 143, 360–373. [Google Scholar] [CrossRef]
  31. Ismaiel, M.; Murphy, B.; Aldhafiri, S.; Giffney, H.E.; Thornton, K.; Mukhopadhya, A.; Keogh, C.E.; Fattah, S.; Mohan, H.M.; Cummins, E.P.; et al. The NR4A agonist, Cytosporone B, attenuates pro-inflammatory mediators in human colorectal cancer tissue ex vivo. Biochem. Biophys. Res. Commun. 2021, 554, 179–185. [Google Scholar] [CrossRef] [PubMed]
  32. Wu, H.; Li, X.M.; Wang, J.R.; Gan, W.J.; Jiang, F.Q.; Liu, Y.; Zhang, X.D.; He, X.S.; Zhao, Y.Y.; Lu, X.X.; et al. NUR77 exerts a protective effect against inflammatory bowel disease by negatively regulating the TRAF6/TLR-IL-1R signalling axis. J. Pathol. 2016, 238, 457–469. [Google Scholar] [CrossRef] [PubMed]
  33. Wynn, T.A.; Chawla, A.; Pollard, J.W. Macrophage biology in development, homeostasis and disease. Nature 2013, 496, 445–455. [Google Scholar] [CrossRef] [PubMed]
  34. Chanput, W.; Mes, J.J.; Wichers, H.J. THP-1 cell line: An in vitro cell model for immune modulation approach. Int. Immunopharmacol. 2014, 23, 37–45. [Google Scholar] [CrossRef] [PubMed]
  35. Phelan, D.E.; Shigemura, M.; Aldhafiri, S.; Mota, C.; Hall, T.J.; Sznajder, J.I.; Murphy, E.P.; Crean, D.; Cummins, E.P. Transcriptional Profiling of Monocytes Deficient in Nuclear Orphan Receptors NR4A2 and NR4A3 Reveals Distinct Signalling Roles Related to Antigen Presentation and Viral Response. Front. Immunol. 2021, 12, 676644. [Google Scholar] [CrossRef] [PubMed]
  36. Promega. Available online: https://worldwide.promega.com/products/cell-health-assays/cell-viability-and-cytotoxicity-assays/realtime_glo-mt-cell-viability-assay/?catNum=G9711 (accessed on 5 December 2023).
  37. Hammond, S.L.; Safe, S.; Tjalkens, R.B. A novel synthetic activator of Nurr1 induces dopaminergic gene expression and protects against 6-hydroxydopamine neurotoxicity in vitro. Neurosci. Lett. 2015, 607, 83–89. [Google Scholar] [CrossRef] [PubMed]
  38. Li, W.; Liu, X.; Tu, Y.; Ding, D.; Yi, Q.; Sun, X.; Wang, Y.; Wang, K.; Zhu, M.; Mao, J. Dysfunctional Nurr1 promotes high glucose-induced Müller cell activation by up-regulating the NF-κB/NLRP3 inflammasome axis. Neuropeptides 2020, 82, 102057. [Google Scholar] [CrossRef]
  39. Bonta, P.I.; Matlung, H.L.; Vos, M.; Peters, S.L.; Pannekoek, H.; Bakker, E.N.; de Vries, C.J. Nuclear receptor Nur77 inhibits vascular outward remodelling and reduces macrophage accumulation and matrix metalloproteinase levels. Cardiovasc. Res. 2010, 87, 561–568. [Google Scholar] [CrossRef]
  40. Bonta, P.I.; van Tiel, C.M.; Vos, M.; Pols, T.W.; van Thienen, J.V.; Ferreira, V.; Arkenbout, E.K.; Seppen, J.; Spek, C.A.; van der Poll, T.; et al. Nuclear receptors Nur77, Nurr1, and NOR-1 expressed in atherosclerotic lesion macrophages reduce lipid loading and inflammatory responses. Arterioscler. Thromb. Vasc. Biol. 2006, 26, 2288–2294. [Google Scholar] [CrossRef]
  41. De Paoli, F.; Eeckhoute, J.; Copin, C.; Vanhoutte, J.; Duhem, C.; Derudas, B.; Dubois-Chevalier, J.; Colin, S.; Zawadzki, C.; Jude, B.; et al. The neuron-derived orphan receptor 1 (NOR1) is induced upon human alternative macrophage polarization and stimulates the expression of markers of the M2 phenotype. Atherosclerosis 2015, 241, 18–26. [Google Scholar] [CrossRef]
  42. Hamers, A.A.; Argmann, C.; Moerland, P.D.; Koenis, D.S.; Marinković, G.; Sokolović, M.; de Vos, A.F.; de Vries, C.J.; van Tiel, C.M. Nur77-deficiency in bone marrow-derived macrophages modulates inflammatory responses, extracellular matrix homeostasis, phagocytosis and tolerance. BMC Genom. 2016, 17, 162. [Google Scholar] [CrossRef] [PubMed]
  43. Hamers, A.A.; van Dam, L.; Teixeira Duarte, J.M.; Vos, M.; Marinković, G.; van Tiel, C.M.; Meijer, S.L.; van Stalborch, A.M.; Huveneers, S.; Te Velde, A.A.; et al. Deficiency of Nuclear Receptor Nur77 Aggravates Mouse Experimental Colitis by Increased NFκB Activity in Macrophages. PLoS ONE 2015, 10, e0133598. [Google Scholar] [CrossRef] [PubMed]
  44. Hanna, R.N.; Shaked, I.; Hubbeling, H.G.; Punt, J.A.; Wu, R.; Herrley, E.; Zaugg, C.; Pei, H.; Geissmann, F.; Ley, K.; et al. NR4A1 (Nur77) deletion polarizes macrophages toward an inflammatory phenotype and increases atherosclerosis. Circ. Res. 2012, 110, 416–427. [Google Scholar] [CrossRef] [PubMed]
  45. Kurakula, K.; Vos, M.; Logiantara, A.; Roelofs, J.J.; Nieuwenhuis, M.A.; Koppelman, G.H.; Postma, D.S.; van Rijt, L.S.; de Vries, C.J. Nuclear Receptor Nur77 Attenuates Airway Inflammation in Mice by Suppressing NF-κB Activity in Lung Epithelial Cells. J. Immunol. 2015, 195, 1388–1398. [Google Scholar] [CrossRef] [PubMed]
  46. Lappas, M. The NR4A receptors Nurr1 and Nur77 are increased in human placenta from women with gestational diabetes. Placenta 2014, 35, 866–875. [Google Scholar] [CrossRef] [PubMed]
  47. Mix, K.S.; Attur, M.G.; Al-Mussawir, H.; Abramson, S.B.; Brinckerhoff, C.E.; Murphy, E.P. Transcriptional repression of matrix metalloproteinase gene expression by the orphan nuclear receptor NURR1 in cartilage. J. Biol. Chem. 2007, 282, 9492–9504. [Google Scholar] [CrossRef] [PubMed]
  48. Reddy, A.T.; Lakshmi, S.P.; Banno, A.; Jadhav, S.K.; Pulikkal Kadamberi, I.; Kim, S.C.; Reddy, R.C. Cigarette smoke downregulates Nur77 to exacerbate inflammation in chronic obstructive pulmonary disease (COPD). PLoS ONE 2020, 15, e0229256. [Google Scholar] [CrossRef]
  49. Rodríguez-Calvo, R.; Ferrán, B.; Alonso, J.; Martí-Pàmies, I.; Aguiló, S.; Calvayrac, O.; Rodríguez, C.; Martínez-González, J. NR4A receptors up-regulate the antiproteinase alpha-2 macroglobulin (A2M) and modulate MMP-2 and MMP-9 in vascular smooth muscle cells. Thromb. Haemost. 2015, 113, 1323–1334. [Google Scholar] [CrossRef]
  50. Saijo, K.; Winner, B.; Carson, C.T.; Collier, J.G.; Boyer, L.; Rosenfeld, M.G.; Gage, F.H.; Glass, C.K. A Nurr1/CoREST pathway in microglia and astrocytes protects dopaminergic neurons from inflammation-induced death. Cell 2009, 137, 47–59. [Google Scholar] [CrossRef]
  51. Sekiya, T.; Kashiwagi, I.; Inoue, N.; Morita, R.; Hori, S.; Waldmann, H.; Rudensky, A.Y.; Ichinose, H.; Metzger, D.; Chambon, P.; et al. The nuclear orphan receptor Nr4a2 induces Foxp3 and regulates differentiation of CD4+ T cells. Nat. Commun. 2011, 2, 269. [Google Scholar] [CrossRef]
  52. Sekiya, T.; Kashiwagi, I.; Yoshida, R.; Fukaya, T.; Morita, R.; Kimura, A.; Ichinose, H.; Metzger, D.; Chambon, P.; Yoshimura, A. Nr4a receptors are essential for thymic regulatory T cell development and immune homeostasis. Nat. Immunol. 2013, 14, 230–237. [Google Scholar] [CrossRef] [PubMed]
  53. Wang, J.R.; Gan, W.J.; Li, X.M.; Zhao, Y.Y.; Li, Y.; Lu, X.X.; Li, J.M.; Wu, H. Orphan nuclear receptor Nur77 promotes colorectal cancer invasion and metastasis by regulating MMP-9 and E-cadherin. Carcinogenesis 2014, 35, 2474–2484. [Google Scholar] [CrossRef] [PubMed]
  54. Hammond, S.L.; Popichak, K.A.; Li, X.; Hunt, L.G.; Richman, E.H.; Damale, P.U.; Chong, E.K.P.; Backos, D.S.; Safe, S.; Tjalkens, R.B. The Nurr1 Ligand,1,1-bis(3′-Indolyl)-1-(p-Chlorophenyl)Methane, Modulates Glial Reactivity and Is Neuroprotective in MPTP-Induced Parkinsonism. J. Pharmacol. Exp. Ther. 2018, 365, 636–651. [Google Scholar] [CrossRef] [PubMed]
  55. Donadelli, R.; Abbate, M.; Zanchi, C.; Corna, D.; Tomasoni, S.; Benigni, A.; Remuzzi, G.; Zoja, C. Protein traffic activates NF-kB gene signaling and promotes MCP-1-dependent interstitial inflammation. Am. J. Kidney Dis. Off. J. Natl. Kidney Found. 2000, 36, 1226–1241. [Google Scholar] [CrossRef] [PubMed]
  56. Wang, Y.; Rangan, G.K.; Goodwin, B.; Tay, Y.C.; Harris, D.C. Lipopolysaccharide-induced MCP-1 gene expression in rat tubular epithelial cells is nuclear factor-kappaB dependent. Kidney Int. 2000, 57, 2011–2022. [Google Scholar] [CrossRef] [PubMed]
  57. Jiang, Y.; Zeng, Y.; Huang, X.; Qin, Y.; Luo, W.; Xiang, S.; Sooranna, S.R.; Pinhu, L. Nur77 attenuates endothelin-1 expression via downregulation of NF-κB and p38 MAPK in A549 cells and in an ARDS rat model. Am. J. Physiology Lung Cell. Mol. Physiol. 2016, 311, L1023–L1035. [Google Scholar] [CrossRef]
  58. de Gaetano, M.; Tighe, C.; Gahan, K.; Zanetti, A.; Chen, J.; Newson, J.; Cacace, A.; Marai, M.; Gaffney, A.; Brennan, E.; et al. Asymmetric Synthesis and Biological Screening of Quinoxaline-Containing Synthetic Lipoxin A(4) Mimetics (QNX-sLXms). J. Med. Chem. 2021, 64, 9193–9216. [Google Scholar] [CrossRef]
  59. Mees, G.; Dierckx, R.; Vangestel, C.; Laukens, D.; Van Damme, N.; Van de Wiele, C. Pharmacologic activation of tumor hypoxia: A means to increase tumor 2-deoxy-2-[18F]fluoro-D-glucose uptake? Mol. Imaging 2013, 12, 49–58. [Google Scholar]
  60. Han, Q.W.; Shao, Q.H.; Wang, X.T.; Ma, K.L.; Chen, N.H.; Yuan, Y.H. CB2 receptor activation inhibits the phagocytic function of microglia through activating ERK/AKT-Nurr1 signal pathways. Acta Pharmacol. Sin. 2022, 43, 2253–2266. [Google Scholar] [CrossRef]
  61. Cesta, M.F.; Ryman-Rasmussen, J.P.; Wallace, D.G.; Masinde, T.; Hurlburt, G.; Taylor, A.J.; Bonner, J.C. Bacterial lipopolysaccharide enhances PDGF signaling and pulmonary fibrosis in rats exposed to carbon nanotubes. Am. J. Respir. Cell Mol. Biol. 2010, 43, 142–151. [Google Scholar] [CrossRef]
  62. Ho, H.H.; Antoniv, T.T.; Ji, J.D.; Ivashkiv, L.B. Lipopolysaccharide-induced expression of matrix metalloproteinases in human monocytes is suppressed by IFN-gamma via superinduction of ATF-3 and suppression of AP-1. J. Immunol. 2008, 181, 5089–5097. [Google Scholar] [CrossRef] [PubMed]
  63. Madej, M.P.; Töpfer, E.; Boraschi, D.; Italiani, P. Different Regulation of Interleukin-1 Production and Activity in Monocytes and Macrophages: Innate Memory as an Endogenous Mechanism of IL-1 Inhibition. Front. Pharmacol. 2017, 8, 335. [Google Scholar] [CrossRef] [PubMed]
  64. Shaked, I.; Hanna, R.N.; Shaked, H.; Chodaczek, G.; Nowyhed, H.N.; Tweet, G.; Tacke, R.; Basat, A.B.; Mikulski, Z.; Togher, S.; et al. Transcription factor Nr4a1 couples sympathetic and inflammatory cues in CNS-recruited macrophages to limit neuroinflammation. Nat. Immunol. 2015, 16, 1228–1234. [Google Scholar] [CrossRef] [PubMed]
  65. Zhang, Y.J.; Song, J.R.; Zhao, M.J. NR4A1 regulates cerebral ischemia-induced brain injury by regulating neuroinflammation through interaction with NF-κB/p65. Biochem. Biophys. Res. Commun. 2019, 518, 59–65. [Google Scholar] [CrossRef] [PubMed]
  66. Burke, S.J.; Lu, D.; Sparer, T.E.; Masi, T.; Goff, M.R.; Karlstad, M.D.; Collier, J.J. NF-κB and STAT1 control CXCL1 and CXCL2 gene transcription. Am. J. Physiol. Endocrinol. Metab. 2014, 306, E131–E149. [Google Scholar] [CrossRef] [PubMed]
  67. Pocock, J.; Gómez-Guerrero, C.; Harendza, S.; Ayoub, M.; Hernández-Vargas, P.; Zahner, G.; Stahl, R.A.; Thaiss, F. Differential activation of NF-kappa B, AP-1, and C/EBP in endotoxin-tolerant rats: Mechanisms for in vivo regulation of glomerular RANTES/CCL5 expression. J. Immunol. 2003, 170, 6280–6291. [Google Scholar] [CrossRef] [PubMed]
  68. Thompson, W.L.; Van Eldik, L.J. Inflammatory cytokines stimulate the chemokines CCL2/MCP-1 and CCL7/MCP-3 through NFkB and MAPK dependent pathways in rat astrocytes [corrected]. Brain Res. 2009, 1287, 47–57. [Google Scholar] [CrossRef]
  69. O’Neill, L.A.; Hardie, D.G. Metabolism of inflammation limited by AMPK and pseudo-starvation. Nature 2013, 493, 346–355. [Google Scholar] [CrossRef]
  70. Tannahill, G.M.; Curtis, A.M.; Adamik, J.; Palsson-McDermott, E.M.; McGettrick, A.F.; Goel, G.; Frezza, C.; Bernard, N.J.; Kelly, B.; Foley, N.H.; et al. Succinate is an inflammatory signal that induces IL-1β through HIF-1α. Nature 2013, 496, 238–242. [Google Scholar] [CrossRef]
  71. Amoasii, L.; Holland, W.; Sanchez-Ortiz, E.; Baskin, K.K.; Pearson, M.; Burgess, S.C.; Nelson, B.R.; Bassel-Duby, R.; Olson, E.N. A MED13-dependent skeletal muscle gene program controls systemic glucose homeostasis and hepatic metabolism. Genes Dev. 2016, 30, 434–446. [Google Scholar] [CrossRef]
  72. Amoasii, L.; Sanchez-Ortiz, E.; Fujikawa, T.; Elmquist, J.K.; Bassel-Duby, R.; Olson, E.N. NURR1 activation in skeletal muscle controls systemic energy homeostasis. Proc. Natl. Acad. Sci. USA 2019, 116, 11299–11308. [Google Scholar] [CrossRef]
Disclaimer/Publisher’s Note: The statements, opinions and data contained in all publications are solely those of the individual author(s) and contributor(s) and not of MDPI and/or the editor(s). MDPI and/or the editor(s) disclaim responsibility for any injury to people or property resulting from any ideas, methods, instructions or products referred to in the content.

