Abstract
The enforcement of the European Union Deforestation Regulation (EUDR) may reduce the supply of natural rubber to the European Union (EU), potentially leading to price increases due to the inelastic nature of rubber demand. This study assesses the potential financial implications for smallholder producers in Ghana, considering both the opportunities and risks associated with the evolving regulatory environment under EUDR and local market access conditions. A cost–benefit analysis (CBA) was conducted to evaluate the impact of different EUDR-related export decline scenarios on the net present value (NPV) of a standard 4-hectare plantation. The results suggest that even a minor 2.5% decline in global exports to the EU could increase the NPV by 17% for an independent compliant producer. However, a simulated COVID-19-like crisis in the fifth year of production leads to a 20% decline in NPV, reflecting vulnerability to external shocks. Based on these findings, the study identifies two priorities. This first is improving the coordination and harmonization of compliance efforts across the value chain to enable more producers to benefit from potential EUDR-related price increases. The recent creation of the Association of Natural Rubber Actors of Ghana (ANRAG) presents an opportunity to support such collective mechanisms. Second, minimizing losses during demand shocks requires the Tree Crops Development Authority (TCDA) to establish clear rules and transparent reporting for authorizing unprocessed rubber exports when factories reduce purchases due to low international prices—thus preserving market access for vulnerable producers. Together, these approaches would ensure that the potential benefits of the EUDR are realized inclusively, remain stable despite market downturns, and do not undermine value addition in domestic processing factories.
1. Introduction
Approximately 10 million hectares of forest were lost to deforestation each year between 2015 and 2020 [1], with around 10% of this loss attributed to commodity imports to the European Union (EU) [2]. This means that EU consumption has contributed to the deforestation of about 1 million hectares annually, an area comparable to the size of Cyprus. To address this issue, the EU introduced the European Union Deforestation Regulation (EUDR) in 2023.
The regulation requires operators placing commodities on the EU market to ensure that their products are deforestation-free and comply with the laws of the producing country. This involves submitting a due diligence statement to confirm that no deforestation has occurred after 31 December 2020. The regulation is expected to apply from 30 December 2025.
To verify compliance, the EUDR mandates that operators and traders collect and submit precise geolocation data for all plots of land where commodities were produced. For plots exceeding four hectares, this information must be provided using polygons delineating the perimeter of each plot. In addition, operators must gather documentation demonstrating that the commodities were legally produced according to the laws of the country of origin. This includes evidence related to land tenure rights, environmental permits, labor law compliance, and the payment of relevant taxes.
Competent authorities in EU Member States will conduct risk-based compliance checks through satellite monitoring, document audits, and, where necessary, field inspections. The intensity of these checks depends on the risk classification assigned to each country or region: at least 1% of statements from low-risk areas, 3% from standard-risk areas, and 9% from high-risk areas must be verified annually. Operators sourcing from standard- and high-risk areas must also conduct and document risk assessments and, where relevant, apply risk mitigation measures before placing products on the EU market. These additional steps do not apply to low-risk areas. Furthermore, the regulation prohibits mixing compliant and non-compliant commodities during trading and shipping and failure to ensure segregation may result in the entire shipment being considered non-compliant [3,4].
The potential impact of the EUDR on smallholder rubber farmers is debated. Key challenges include the lack of formal land titles needed to demonstrate legal land use, limited technical capacity or financial means to collect geolocation data, and the difficulty of tracing rubber back to individual farms due to mixing by middlemen. These factors increase the risk of non-compliance and the potential loss of market access [5]. Meanwhile, the European Commission presents the regulation as an opportunity for smallholders to access more stable markets and benefit from technical support from buyers who rely on the provision of information to meet EUDR requirements [6]. This perspective may overlook the gaps in transparency and traceability that characterize the natural rubber sector. Unlike other EUDR-relevant commodities such as cocoa and palm oil—where initiatives like the Cocoa & Forests Initiative and the Roundtable on Sustainable Palm Oil (RSPO) have made significant progress in mapping and public disclosure—the rubber industry remains less advanced with regard to full and publicly available traceability and transparency.
In response, the Global Platform for Sustainable Natural Rubber (GPSNR) was established in 2019 and has made important commitments, including the adoption of reporting requirements for industry members and the launch of a digital reporting platform to report data. Yet, these efforts are still in the early stages of implementation, and GPSNR members currently account for only 60% of global traded natural rubber. As highlighted in the 2025 SPOTT assessments by the Zoological Society of London, most companies in the rubber sector still fail to disclose key supply chain information, particularly regarding sourcing areas and traceability measures. For example, only 11.1% of assessed companies report the jurisdictions from which they source rubber from smallholders [7]. This lack of visibility limits efforts to support smallholders in maintaining market access and progressing toward legal and sustainable production aligned with EUDR objectives.
The inclusion of natural rubber in the EUDR is based on its contribution to global deforestation, alongside six other commodities identified by Pendrill et al. (2020) [8]. These are listed in decreasing order of their contribution to deforestation associated with EU imports: oil palm (34.0%), soy (32.8%), timber (8.6%), cocoa (7.5%), coffee (7.0%), cattle (5.0%) and rubber (3.4%). Although natural rubber is the smallest contributor on this list, its global impact has been significant, especially between 2010 and 2020, when rubber plantations worldwide expanded by 3.3 million hectares, bringing the total area to 12.8 million hectares [9]. According to the same authors, at least 1.8 million hectares were converted from forests into rubber plantations during this period. This expansion was fueled by growing demand in China and India, rising crude oil prices that reduced synthetic rubber’s competitiveness, currency fluctuations, and climatic disruptions, all contributing to price increases that encouraged further rubber cultivation [10].
About 75% of natural rubber is used in tire production [11]. While synthetic rubber, derived from crude oil, is also used in tire manufacturing, its distinct properties prevent full substitution, making natural rubber indispensable for high-performance and heavy-duty tires [12]. In 2020, the EU added natural rubber to its list of Critical Raw Materials (CRM), making it the only agricultural commodity listed due to its economic importance and supply risk to the EU [11].
Natural rubber is produced from the Hevea brasiliensis tree, which is native to Brazil. The British Empire introduced the species to Southeast Asia in the 19th century, establishing plantations that competed with Brazilian production. At the same time, rubber was also cultivated in Central Africa, but from different less productive species such as Landolphia owariensis. In both Brazil and Central Africa, rubber trees grew wild in the forest, making harvesting an extremely labor-intensive process. Driven by rising demand in Western countries, fueled by the bicycle boom and later the automobile industry, colonial regimes imposed forced labor systems. At the beginning of the 20th century, rubber plantations in Southeast Asia became more productive due to their intensive monocultural structure. Meanwhile, in Brazil, the emergence of the Microcyclus ulei disease devastated rubber trees, leading to the decline of South American production. This marked the beginning of Southeast Asia’s dominance of global rubber production. Later in 1956, after France lost its Indochinese plantations following its defeat in the Indochina War, it established new rubber plantations in Côte d’Ivoire using the same H. brasiliensis species. Rubber cultivation in Ghana began in 1898, with H. brasiliensis introduced as an ornamental tree in Aburi’s botanical garden, leading to experimental plantations in the 1930s and the establishment of the first private industrial plantation in the 1950s, which eventually became Ghana Rubber Estates Limited (GREL), the sector’s main actor today [13,14,15].
Natural rubber is now a globally traded commodity and is deeply integrated into international markets, with smallholders contributing 80% of the total global production [16]. In 2023, global natural rubber production was estimated to be 15.1 million metric tons, with about 7.8 million metric tons traded internationally [17,18]. Thailand led global exports, accounting for 25%, followed by Indonesia (22.5%) and Côte d’Ivoire (16.6%), the largest exporter in Africa. Other significant exporters include Cambodia (7.5%), Malaysia (7.2%), and Vietnam (4.3%). Ghana ranked 9th globally in 2023, contributing 1.27% of total exports [19].
Rubber cultivation in Ghana has expanded significantly in the past three decades. It operates under a dual structure, combining large-scale plantations and smallholder farms, the latter largely integrated through the Rubber Outgrower Plantation Project (ROPP) since 1995. Under this outgrower scheme, farmers received loans from the Agricultural Development Bank of Ghana (ADB) or the National Investment Bank (NIB) and technical support from GREL in exchange for supplying their production to the company until the loan is fully repaid. The ROPP stopped in 2016, meaning all new producers since then are Self-Financed Outgrowers (SFOs) who establish and manage their plantations without financial assistance, allowing them to sell freely to different buyers. Ghana has approximately 10,000 rubber producers, with outgrowers representing 80% and SFOs 20%. GREL estimates that it provides livelihood to more than 70,000 people working directly or indirectly in this value chain in Ghana.
Since 2023, GREL has been actively implementing EUDR requirements by taking full responsibility for the geolocation process of rubber farms. This initiative, led by the Rubber Technical Assistance and Purchase (RUTAP) program, began with sensitization sessions across key rubber-producing areas. During these sessions, farmers were informed about the importance of forest conservation and the requirements of the EUDR. As part of the process, GREL started mapping out farms and registering producers, explaining that farmers’ role is to be available to identify clear farm boundaries, respect land use rights and tenure systems, and adhere to ethical labor practices, including the prohibition of child and forced labor, while ensuring tax compliance and fair wages. This commitment from GREL aligns with the broader zero-deforestation policies of its main shareholders. GREL is a subsidiary of the Société Internationale de Plantations d’Hévéas (SIPH), which is part of the SIFCA group and counts Michelin among its minority shareholders. All three entities have publicly pledged to zero deforestation. The Government of Ghana holds a 26.75% stake in GREL, while Newgen Ghana Ltd. owns 9%.
While GREL remains the main processor and buyer for smallholders, other factories such as Rubber Plantations Ghana Ltd. (RPGL), Narubiz Ltd., and Yaeric Company Ltd. also operate in the sector but on a smaller scale. Most of Ghana’s rubber production is export-oriented, primarily to Asia (36.2%), the EU (35.3%), and the Americas (27.3%), while 6.6% is exported within Africa [19]. GREL considers increasing its processing capacity beyond the current 90,000 tons per year to absorb all available raw material, but this depends on securing a stable and consistent supply to its factories. Yet this remains a challenge, as Koomson et al. (2022) [20] found that 20% of outgrowers side-sell their cup lumps to exporters instead of supplying GREL, despite contractual agreements. Although this practice was already in place before 2020, it was intensified by the disruption to the value chain caused by the 2020 COVID-19 crisis, when the halt in car manufacturing caused a sharp decline in demand and prices for natural rubber, leading to a reduction in processing activities in Ghana. Widespread logistical bottlenecks due to port closures and mobility restrictions across the supply chain further aggravated the situation. During this period, GREL’s purchasing capacity dropped from 7500 to 500 tons per month for three consecutive months. The company prioritized deliveries from outgrowers with outstanding loans, leaving other producers temporarily with no alternative but to sell to smaller factories that remained operational or to buyers exporting unprocessed natural rubber— an option that enabled these exporters to establish a stronger presence in the market.
The situation further deteriorated in 2023 when Côte d’Ivoire enforced a ban on the export of unprocessed rubber. In response, many traders—often local intermediaries connected to foreign networks, particularly Indian and Chinese—shifted their sourcing to Ghana. With aggressive pricing strategies, they rapidly captured a significant share of the raw rubber market. GREL estimates that in 2024, 40 to 50% of outgrower rubber in Ghana was exported unprocessed—a phenomenon that, according to TCDA, caused a loss of GHS 22.5 million between 2023 and 2024 [21].
Several factors contribute to the persistence of side-selling, including delayed payments from processors, the higher prices offered by side-buyers, and logistical challenges in transporting latex to collection points [20]. The persistence of side-selling disrupts the local rubber industry by limiting raw material supply for domestic processors, increasing the risk of factory underutilization, and weakening loan recovery mechanisms, as many farmers fail to fully repay their debts. As a result, the sector suffers a significant loss in value retention.
To address this challenge, the TCDA implemented a regulated export authorization regime for unprocessed rubber to increase supply to local factories. The long-term objective of this policy is to prevent factory shutdowns, secure jobs, and enable value addition before export. While this framework maintains the possibility of exporting unprocessed rubber under certain conditions, it shifts market dynamics by discouraging exports through intermediaries. It also supports Ghana’s broader import substitution agenda by promoting local transformation. This ambition is particularly relevant as the country seeks to scale up the production of finished goods, such as rubber-based components for the automotive industry, with companies like Toyota and Volkswagen now assembling vehicles locally [22].
Figure 1 presents the main flows of cup lumps from production through processing to export. In 2023, about 80% were sold to local processing factories, where they are cleaned, dried, and compressed into standardized blocks for export as Technically Specified Rubber (TSR), mainly to Asia, Europe, and the Americas, with a smaller share going to Africa. Although the 20% share of side-selling shown is based on data from outgrowers supplying GREL in 2022, the diagram remains broadly reflective of national trade dynamics—though this trend intensified in 2024. The side-selling flow reflects volumes sold outside formal channels, now subject to export authorization by the TCDA. EU-bound exports represent a significant share, making continued access essential for GREL, which introduced a 10% price incentive in July 2024 for EUDR-compliant producers.
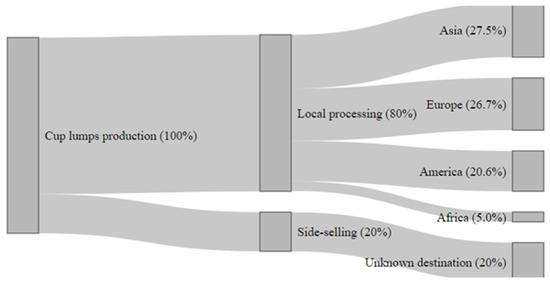
Figure 1.
Cup lumps flows and export destinations in Ghana (2023).
Ghana’s rubber sector is undergoing regulatory shifts, requiring producers to adapt to evolving dynamics and constraints. This study applies an ex-ante cost–benefit analysis (CBA) to assess the financial effects of the EUDR for rubber producers. The subsequent discussion explores how specific mechanisms could facilitate broader access to the potential benefits of compliance. Finally, the analysis considers the impact of a demand shock—during which local processors may temporarily reduce purchases—and examines how a targeted export authorization framework for unprocessed rubber, under the oversight of TCDA, could help mitigate income losses and preserve the financial gains associated with EUDR compliance, while preserving domestic value addition after crisis recovery.
2. Materials and Methods
The study uses a 30-year CBA based on a 4-hectare rubber plantation to assess the financial effects of EUDR compliance under different price scenarios. This section outlines the capital budgeting techniques used for the financial analysis, describes the field study conducted in Ghana, and presents the key assumptions underlying the CBA.
2.1. Capital Budgeting Metrics
2.1.1. Net Present Value (NPV)
The NPV represents the discounted value of the plantation’s net cash flows, considering both inflows and outflows over time. A discount rate of 10% was applied in this analysis to reflect the opportunity cost of capital investment in rubber plantations, a rate slightly higher than the concessional 6.45% offered to outgrowers in the last phase of the outgrower scheme. The formula is as follows:
where:
- : Net cash inflows in year
- : Discount rate
- : Initial investment
2.1.2. Benefit Cost Ratio (BCR)
The BCR was calculated using the following formula:
This ratio measures the present value of returns for each unit of currency invested, providing a relative measure of the plantation’s profitability. A plantation project is considered acceptable if the BCR exceeds 1.
2.1.3. Internal Rate of Return (IRR)
The IRR is the discount rate at which the NPV equals zero. The plantation is considered attractive if the IRR exceeds the discount rate. IRR is only applicable to SFOs, as they bear the initial establishment costs of their plantation.
2.1.4. Payback Period
The payback period represents the time required to recover the total initial investment through the net annual cash inflows generated by the project. It is calculated by successively subtracting the net annual cash inflows from the total investment until the cumulative cash flow equals the initial investment. If recovery occurs partway through a year, the fraction of the year needed is determined by dividing the remaining unrecovered amount by the net cash inflow for that year. This method provides a measure of how quickly the investment is recovered. Like the IRR, the payback period is only relevant to SFOs.
2.2. Field Research
A field study was carried out in Ghana from 4 to 19 July 2024 to gather qualitative data on how different actors in the rubber sector perceive the EUDR and respond to its anticipated implications. Fifteen rubber producers were interviewed face-to-face in the Western Region, the main producing area. Two producers were selected with support from a researcher at the Council for Scientific and Industrial Research (CSIR)—Crop Research Institute due to their large plantations and detailed knowledge of the sector. The remaining 13 were interviewed individually during a village meeting facilitated by GREL. Interviews lasted on average 15 min, ranging from 10 to 40 min, depending on plantation maturity and the depth of responses.
Of the 15 producers, only one was a woman. Three were outgrowers with ongoing loan repayments to GREL, five were SFOs and two held mixed status. Farm sizes ranged from 2 to 30 hectares, with productive areas between 50% and 100% of the total surface. One SFO reported selling to exporters via intermediaries, citing financial pressure from private debt. Three SFOs sold to local aggregators offering immediate payment, while the others—mainly outgrowers—sold directly to GREL. Two producers were not yet EUDR-compliant but planned to meet requirements.
Interview topics covered motivations for entering rubber production—most often linked to securing a better future for their families—as well as financing strategies, such as relying on savings from other activities like coconut farming or charcoal production for some SFOs, and loans obtained through the GREL scheme before 2016 for outgrowers. Discussions also explored farmers’ awareness and understanding of EUDR requirements, including geolocation and the acceptance of a code of conduct. Other topics included expectations regarding EUDR-related price premiums, sales practices, production costs and yields.
Additionally, a focus group discussion was held in Takoradi with three leaders (who are also farmers) of the Association of Self-Financed Rubber Outgrowers (ASFRO), which merged in August 2024 with three other associations to form the Association of Natural Rubber Actors of Ghana (ANRAG). The discussion focused on sector-wide implications of the EUDR, the challenges related to the export of unprocessed rubber and the historical development of the rubber value chain in Ghana.
Complementary interviews were conducted with processing factories and a regulatory agency. One-hour interviews were conducted on-site at Narubiz (Wassa Dompim) and Yaeric (Nsuaem), each complemented by a 30 min guided tour of the facility. At GREL, meetings took place at the Apimanim office (Rubber Outgrower Unit), followed by discussions at the company’s Takoradi headquarters and two online follow-ups. Finally, an online interview was held with the Tree Crop Development Authority (TCDA), conducted from Kwame Nkrumah University of Science and Technology (KNUST) campus in Kumasi.
2.3. Assumptions
2.3.1. Plantation Lifespan
The CBA models the case of a producer who establishes a plantation in 2020, with production beginning in 2026 after a six-year immature phase. The economic lifespan of rubber trees is assumed to be 30 years (ending in 2049).
2.3.2. Producer’s Revenue
TSR is a standardized form of natural rubber processed in factories, classified by grades based on impurity levels and physical properties. TSR 10, being more refined with fewer impurities, is of higher quality compared to TSR 20, which is less refined but remains the most widely traded grade, mainly on the Singapore Exchange (SGX), and serves as the reference price in this analysis. The SGX TSR 20 prices were projected up to 2049 using a Monte Carlo simulation based on historical data from January 2007 to May 2025. This approach was chosen to reflect historical price volatility and trends. This method utilized monthly log returns to model price changes, ensuring that the simulated prices captured the volatility and trends observed historically. For each month between 2026 and 2049, the price was simulated 1000 times. The formula used for the simulation was as follows:
where:
- : Simulated price at time
- : Price for the previous month
- : A random value drawn from a normal distribution with a mean and standard deviation based on observed historical returns
- : The factor representing the monthly percentage change in price, calculated as the exponential of a normally distributed return
To determine the price paid to producers per kilogram in USD, TSR 20 prices traded on the SGX were adjusted using TCDA’s pricing mechanism:
This formula applies a 63% factor [23] as the producer’s share of the international price, and a 58% adjustment to account for the dry rubber content.
Using the resulting producer price, farmers’ annual revenues were estimated by multiplying the projected price per kilogram by an average annual yield of 1500 kg/ha of dry rubber, equivalent to 2727 kg/ha of wet rubber. This conversion is based on a dry rubber content rate of 55%, which reflects the actual current average indicated by GREL. In contrast, the 58% rate used in the price formula is a fixed reference established by regulation within the sector.
2.3.3. Maturity Level and Residual Value
The CBA assumes that all trees within the plantation are of the same maturity level. In practice, farmers often manage plantations with trees at different stages of maturity, some productive and others not yet yielding latex.
The residual value of the rubber plantation was incorporated into the analysis by estimating the potential wood volume remaining at the end of the plantation’s lifespan. According to FAO (2000) [24], the wood volume for mature rubber plantations is approximately 100 m3/ha. A value of USD 20/m3, indicated by GREL, was assumed for the residual wood and included as a cash inflow in 2049.
2.3.4. Producer’s Costs
The analysis distinguishes between establishment costs (initial investment of USD 2500/ha for planting material and labor, as indicated by GREL) and operational costs (tapping, maintenance and transportation). Interviews with GREL and farmers in Ghana’s Western Region (July 2024) indicate that operational costs average between 0.3 and 0.4 USD/kg of raw rubber (4.3–4.7 GHS/kg).
To project operational costs until 2049, a linear annual inflation rate of 8% was applied to values in GHS. This rate corresponds to the midpoint of the Bank of Ghana’s medium-term inflation target (8% ± 2%). These inflated costs were then converted into USD using a fixed exchange rate of 10 GHS/USD, based on 2025 trends [25,26]. Although exchange rates fluctuate over time, setting this parameter at a plausible level provides a stable reference point and prevents bias in long-term projections.
2.3.5. Price Dynamics
The European Union Timber Regulation (EUTR), in force since 2013 and to be replaced by the EUDR in 2026, aimed to prevent illegal logging and led to a reduction in imports from high-risk countries [27]. While direct comparisons between the rubber and timber markets are limited, the EUTR remains the closest precedent, suggesting that the EUDR could similarly reduce EU imports of natural rubber. Zhunusova et al. (2022) [28] suggest that the EUDR could shift trade flows as farmers and processors facing compliance difficulties may shift production to non-EU markets where environmental regulations are less stringent. Such a shift would reduce exports to the EU while increasing supply elsewhere, thus influencing global market dynamics.
Based on supply and demand principles, a reduction in rubber supply to the EU would lead to an increase in prices. The magnitude of this increase is estimated using the long-run elasticity of demand of −0.212, as reported by Ts and Darmawan (2016) [29], indicating inelastic demand. This implies that even small reductions in supply lead to significant price increases as buyers compete for limited quantities. To quantify this impact, the CBA models scenarios where a reduction in rubber supply to the EU affects the price a factory receives for its EU-bound sales. The price adjustment is assumed to occur gradually over six years, reflecting the stabilization period observed under the EUTR. The resulting price increase for producers is calculated based on Ghana’s exports to the EU in 2023, which represented 35.3% of total exports. The additional revenue is redistributed to all EUDR-compliant producers, assuming 100% compliance. Consequently, the CBA excludes the 10% price incentive introduced by GREL prior to the enforcement of the EUDR and only considers market-driven price increases.
2.3.6. Demand Shock
Experience with the COVID-19 crisis highlighted the risks producers and processors face during market disruptions. To assess the potential impact of a future demand shock on producer prices, percentage changes in median price and export quantity were calculated by comparing the pre-COVID-19 levels in 2019 to the lowest point in 2020. Due to the lack of equivalent data for Ghana, Côte d’Ivoire’s data was used as a proxy, revealing a 25% decline in price and a 40% drop in export quantity. Recovery times were estimated based on the period required for prices and exports to rebound to 95% of pre-crisis levels. The findings indicated recovery periods of 19 months for quantity and 20 months for price. To align with the annual framework of the CBA, these periods were rounded to 2 years. The shock is applied in 2030, the fifth year of production, with a sensitivity analysis conducted to explore how outcomes change if the shock occurs in 2040, the 15th year of production.
3. Results
The CBA was conducted using five price increase scenarios. These price increases correspond to projected reductions in natural rubber exports to the EU ranging from −2.5% to −20% (Table 1). Additionally, the analysis assesses the impact of a demand shock similar to COVID-19. The results present NPV and BCR for both producer types, with an IRR and payback period specific to SFOs. Each metric is calculated under varying price scenarios resulting from the assumed decline in global natural rubber exports to the EU market.

Table 1.
Net present value (NPV) in USD.
3.1. Net Present Value
In the baseline scenario, the NPV for a producer is USD 26,298 for an outgrower and USD 24,622 for an SFO. Table 1 shows that a 2.5% decline in natural rubber exports to the EU due to EUDR enforcement would increase the NPV of the 4-hectare plantation by 16% for outgrowers and 17% for SFOs. Table 1 also indicates that while outgrowers maintain a higher NPV across all scenarios, SFOs experience greater cumulative NPV growth. This reflects the fact that SFOs retain all additional income, whereas outgrowers allocate a portion to loan repayments, temporarily reducing their gains.
3.2. Benefit-Cost Ratio
Table 2 presents the BCR values for both producer types under different supply reduction scenarios, along with their respective cumulative growth. In the baseline scenario, for each unit of USD invested in the plantation, the BCR is USD 1.30 for outgrowers and USD 1.38 for SFOs. This difference is due to outgrowers temporarily allocating part of their earnings to loan repayments, reducing their net return relative to the plantation cost.
Table 2.
Benefit–cost ratio (BCR) in USD.
While SFOs maintain a higher BCR in absolute terms, outgrowers see greater cumulative growth across scenarios, reflecting the higher responsiveness of BCR for producers with lower initial financial commitments.
3.3. Internal Rate of Return
In the baseline scenario, the IRR for SFOs is 38.5%, which is higher than the discount rate of 10% used in the CBA, showing that the plantation is highly profitable. From that baseline, the potential IRR increases as supply to the EU declines (Table 3).
Table 3.
Internal rate of return (IRR) of SFOs.
3.4. Payback Period
The payback period for SFOs decreases steadily, with a reduction of 1 month for each level of reduced supply to the EU, reaching 8 years and 2 months in the most favorable scenario (Table 4).
Table 4.
Payback period of SFOs.
3.5. Shock Scenario
While price increases improve financial metrics for compliant producers, they do not eliminate the risk of liquidity shortages if their buyer halts a purchase due to external supply chain shocks, as seen during the COVID-19 crisis in 2020. By replicating this shock at the same price and quantity impact levels in the hypothetical year of 2030 in the CBA, we obtain the following NPV reduction.
Table 5 demonstrates that even EUDR-compliant producers, who benefit from price increases, remain highly vulnerable to a demand shock. In the baseline scenario without any price increase, the shock in 2030 reduces NPV by 27% for outgrowers and 29% for SFOs. Under a 2.5% reduction in EU supply, which results in higher prices, NPV still declines by 19% for outgrowers and 20% for SFOs, cancelling the initial NPV gains obtained through EUDR compliance. Although the impact lessens as price increases become more substantial, the shock continues to cause significant losses across all scenarios.
Table 5.
Effect of demand shock in 2030 on NPV in USD.
Table 6 presents the results of the sensitivity analysis, where the shock is applied in 2040, the 15th year of production. Although the impact is less severe when the shock occurs in 2040 rather than 2030, the results still indicate a significant decline in NPV. This suggests that, regardless of EUDR compliance, producers would face liquidity pressures, limiting their ability to pay wages, retain skilled tappers, and sustain their livelihoods. These findings highlight the need for contingency measures to support continued market access during periods of disruption.
Table 6.
Effect of demand shock in 2040 on NPV in USD.
4. Discussion
4.1. Financial Outcomes Under EUDR Compliance
The study assessed how EUDR-related market dynamics could positively impact the financial situation of smallholder rubber producers in Ghana if global exports to the EU were to decline. The CBA assessed different scenarios, distinguishing between SFO and outgrowers, with the latter benefiting from the contract scheme with GREL. The key findings indicate that outgrowers achieve a higher NPV across all scenarios due to their ability to defer initial investments through loans. The difference stems from the timing of investment costs: SFOs finance plantation establishment upfront, while outgrowers defer these costs through loans, repaying them gradually. These repayments, discounted at 10%, have a lower present value, whereas SFOs’ upfront costs weigh more heavily in the NPV calculation. Consequently, despite loan deductions, outgrowers initially show a higher NPV, as their financial burden is distributed over time. However, as the price increases following EUDR enforcement, SFOs experience greater cumulative NPV growth since they retain all additional revenue. Conversely, the BCR follows the opposite trend: SFOs have a higher absolute BCR, but outgrowers exhibit greater cumulative growth in BCR as prices rise. These trends reflect fundamental differences in financial structures, where SFOs bear higher upfront costs but retain full benefits from price increases, while outgrowers maintain lower financial commitments but allocate a portion of their earnings to loan repayments. Given that all new producers since 2016 are SFOs, their share in Ghana’s rubber production will continue to grow, meaning that an increasing proportion of producers would be able to fully benefit from potential EUDR-related price increases.
4.2. Institutional Conditions for Inclusive EUDR Compliance
Unlocking these benefits for a wider range of producers will require building on existing efforts, as well as promoting greater coordination, transparency and support throughout the value chain. GREL has played a pivotal role in preparing Ghana’s rubber sector for the EUDR. However, as a private company, its operations are naturally guided by internal strategic priorities, which may not always address broader, sector-wide needs. For instance, although GREL collects geolocation data from plantations to fulfil due diligence obligations, this information is not systematically shared with producers, who rarely request it. According to European Commission guidance documents, granting producers access to geolocation data would strengthen their position and promote fairer value chains [6].
In addition, producers who supply multiple factories may undergo repeated geolocation visits, since each company conducts its own data collection independently. This lack of coordination leads to the unnecessary duplication of efforts and increases overall compliance costs at the national level. Improved data-sharing mechanisms could streamline the process, reduce costs and ease the burden on producers. Moreover, concerns were raised regarding the inconsistent application of the Free, Prior and Informed Consent (FPIC) principle. One producer reported that technicians from a factory entered his plantation to carry out georeferencing without prior notice or consent. This resulted in him refusing to grant them access, meaning the plantation was not mapped and could not comply with EUDR requirements. Another example of broader communication issues arose when a producer misinterpreted GREL’s price premium for compliant rubber as an admission that the company had previously underpaid. This highlights the ongoing challenge of conveying the purpose and implications of compliance-related measures and the need for more transparent and inclusive communication with producers.
The Rubber Outgrowers and Agents Association (ROAA) was established in 1995 and has played a key role in facilitating communication and coordination within the rubber sector. As part of the Rubber Outgrowers Plantation Project (ROPP), the association acted as a bridge between producers, GREL and financial institutions, supporting access to credit, inputs and contract negotiation. During the focus group with ASFRO leaders, participants expressed a strong appreciation for ROAA’s past performance. Its operations were primarily financed through a 1.5% deduction from rubber sales to GREL. In 2011, this mechanism generated GHC 355,252 out of ROAA’s total income of GHC 501,781, representing 71% of its annual budget [30]. Over time, allegations of mismanagement began to erode farmers’ trust in ROAA. In response, some producers contested the automatic deductions from their payments. GREL eventually discontinued these deductions, significantly reducing ROAA’s operational capacity.
The resulting collective capacity deficit was discussed during the focus group with ASFRO. Participants noted that the limited mobilization of producers today is partly rooted in past disillusionment with ROAA. They also indicated that some producers are reluctant to join associations due to a perceived risk of arbitrary or excessive taxation. This highlights a discrepancy: while the EUDR requires producers to comply with national legal obligations, including tax payment, some appear to avoid formal structures due to concerns that this might expose them to unpredictable tax liabilities.
ASFRO has also struggled to play a strong coordinating role. The association remains largely inactive due to the absence of a robust funding mechanism. Focus group participants also noted that many rubber plantation owners are absentee landlords who delegate the management of their plantations to local staff while residing in other regions of Ghana or abroad, which limits their participation.
A major structural shift occurred in 2024 with the merger of ASFRO, ROAA, and two other associations—the Association of Eastern Region Rubber Outgrowers (AERRO) and the Rubber Processors Association of Ghana (RUPAG)—into a single umbrella organization: the ANRAG. This newly established entity brings together a broad range of actors across the value chain, including producers, processors, traders, aggregators, nursery operators, and suppliers of inputs and services, laying the groundwork for a more coordinated and representative governance structure.
The following considerations, based on the above analysis, may help guide ANRAG and the TCDA in their efforts to promote inclusive compliance among smallholders. These measures could help to extend the potential benefits of EUDR compliance, as outlined in the CBA, to a wider range of producers.
First, the TCDA could establish a central database for geolocation data in Ghana. Existing data collected across the sector could be integrated into this database, giving producers access to their own information. This would enable them to control how and with whom their data is shared, thereby reinforcing their autonomy and reducing the need for repeated, costly mapping exercises. ANRAG could support the implementation of such a mechanism by promoting stakeholder coordination, facilitating communication with producers and assisting with data collection, storage and access.
Second, ANRAG could ensure that all members adhere to shared rules, including FPIC protocols. Furthermore, ANRAG could develop a harmonized, sector-wide legality framework by leveraging existing initiatives, such as GREL’s internal code of conduct on compliance with national legislation. This would promote a common interpretation of national legal obligations and facilitate alignment with EUDR requirements. As part of this effort, ANRAG could also address producers’ concerns about being exposed to arbitrary taxation by joining an association, which would be an important step towards gaining their trust, encouraging affiliation and ensuring adequate producer representation within the organization.
Third, the association could facilitate the adoption of digital tools tailored to the specific constraints of smaller processing factories. These factories do not benefit from the same resources as GREL, which is integrated into a larger international group with greater capacities and volumes. Nevertheless, supporting these processors is essential to ensure that their suppliers are not excluded from EUDR-compliant supply chains due to limited awareness or capacity. During the July 2024 field visit, it was observed that, despite the proximity of the enforcement deadline, several of these smaller factories were still insufficiently informed and prepared.
Fourth, although SFOs currently represent only 20% of producers, they include all new entrants since the ROPP scheme ended in 2016. Access to financing is essential for establishing productive plantations, adopting good practices and ensuring long-term viability. In July 2024, most SFOs interviewed relied on savings from other value chains or in one case on private creditors who claimed the entire rubber output as repayment. Such arrangements reflect the absence of accessible finance and increase vulnerability. Current loan defaults by outgrowers, driven by side-selling, have likely eroded the trust of financial institutions. However, recent measures, including TCDA’s export restrictions on unprocessed rubber and the establishment of ANRAG, offer a renewed framework to support SFOs. Improved access to finance could enhance producers’ ability to meet factory requirements and increase their integration into traceable, EUDR-compliant supply chains.
Lastly, as the institution responsible for setting the minimum domestic rubber price, the TCDA needs to ensure that any price increases related to the EUDR are passed on effectively to producers. Currently, there is no monitoring mechanism in place to verify the prices actually paid by processing factories. Establishing such a mechanism would enhance transparency and reinforce the link between compliance and producer welfare. Equally important is reducing payment delays throughout the value chain, as timely payments are essential for producers to maintain cash flow and pay tappers. This issue is critical since late payments have been a key reason why some producers sell their unprocessed rubber directly for export. Several interviewed producers also highlighted that the availability and skill level of tappers remains limited. While GREL and other factories are implementing their own training initiatives, ANRAG could play a more cross-cutting role by supporting broader, more coordinated efforts to develop skills across the sector.
4.3. Preserving EUDR Price Gains in Times of Crisis
The CBA showed that a two-year price crisis like that caused by the COVID-19 pandemic in the fifth year of production would offset the expected 17% increase in NPV over the full production cycle for EUDR-compliant producers. A similar shock in the fifteenth year would also result in substantial NPV losses, emphasizing the vulnerability of smallholders to external shocks. To safeguard the potential gains from EUDR compliance, it is essential to make structural efforts to increase resilience to such shocks and maintain the long-term profitability of the sector.
During the COVID-19 crisis, when GREL drastically reduced its purchases, many producers sold unprocessed rubber to export agents. While this helped maintain production temporarily, it created repayment issues for outgrowers with outstanding loans and reinforced the persistence of raw rubber exports. This shift reduced value addition through local processing and weakened domestic market structures. These dynamics intensified when Côte d’Ivoire imposed an export ban on unprocessed rubber in 2023, prompting buyers to shift to Ghana.
The recent introduction of an export authorization regime for unprocessed rubber by the TCDA provides a potential tool to balance local processing priorities with producer resilience. This mechanism could enable the controlled export of rubber during market downturns, helping to maintain producers’ income streams and secure the potential NPV gains generated through EUDR compliance.
If authorized export volumes prove insufficient in future crises, a complementary approach could involve minimum purchase agreements with factories based on pre-defined criteria. To support factories in continuing limited operations, they could be provided with liquidity in the form of public zero-interest loans to purchase and store rubber until prices recover. Such an approach would require advance planning and negotiation among key stakeholders to ensure minimum continued producer activity and mitigate the impact of demand shocks.
Regardless of market conditions, the TCDA’s export authorization regime needs to be transparent to preserve its legitimacy and effectiveness. One way to achieve this would be to regularly disclose authorized export volumes alongside the associated justification.
The previous suggestions are reactive and are designed to mitigate the impact of a crisis once it has occurred. A more proactive approach would be to use traceability systems to allow factories and producers to share information at an early stage. This infrastructure could facilitate the detection and communication of early market signals, allowing producers to adapt their production strategies in anticipation of future demand shifts. For instance, weather-related supply constraints in Southeast Asia could present temporary pricing opportunities for Ghanaian producers. Similarly, an early warning of an anticipated market downturn could enable producers to adjust their tapping volumes in advance or activate the mitigation mechanisms discussed earlier.
The feasibility of such a proactive system depends on broader structural conditions. Digitally enabled anticipation mechanisms could be highly beneficial in the long term, but as Addison et al. (2024) [31] emphasize, they must be framed as a strategic objective and aligned with national efforts to improve digital infrastructure in rural areas. Approximately 44% of smallholder farmers in Ghana currently use digital tools for agricultural purposes, and the overall intensity of use remains low, with an average index score of just 0.389 across the sample—meaning that digital tools are used at less than 40% of their potential. With better alignment—through expanded internet connectivity, increased availability of digital services, and rural digitalization initiatives offering training and extension—farmers would be better equipped to access and benefit from these tools.
4.4. Comparative Examples from Other Rubber-Producing Countries
To situate the Ghanaian case in a broader context, it is instructive to consider how other natural rubber producing countries have approached EUDR compliance. This section begins with the case of Côte d’Ivoire, the world’s third-largest natural-rubber producer. Here the supply chain is dominated by the SIPH—parent company of GREL—which holds approximately 30% of national processing capacity in a market comprising 39 licensed factories (2024). Contrary to the factory-centered approach observed in Ghana, traceability in Côte d’Ivoire is coordinated at sector level by the Association des Professionnels du Caoutchouc Naturel de Côte d’Ivoire (APROMAC). Officially recognized as an interprofessional organization since 2020, APROMAC holds a formal mandate to lead sector-wide initiatives and collaborates closely with public authorities and development partners. It has deployed field technicians to georeference individual plantations and assigns a digital account to each producer, free of charge. This unified database enables growers to deliver to any processor, while platforms at factory level extract verified records to fulfil downstream due diligence requirements. The infrastructure is inclusive of all processing factories, regardless of size. This example highlights the potential role of the ANRAG in Ghana, which could use the EUDR as an opportunity to position itself as the main interface between producers and downstream actors, and as a key facilitator of producers’ inclusion in the value chain.
Thailand, the world’s largest exporter of natural rubber, relies on smallholders for around 90% of its production [32]. The sector is structured around the Rubber Authority of Thailand (RAOT), which has played an active role in preparing for the EUDR. In collaboration with the European Forest Institute (EFI), the RAOT has initiated the mapping of production areas, the registration of producers and the development of a centralized traceability system. Building on its timber legality system, Thailand has adapted existing mechanisms for rubber production and integrated producer data into a national database [5]. According to a brief by the EFI on Thailand’s response to the EUDR, 79% of the production area has been mapped by 2024 [32]. This highlights the feasibility of a coordinated, inclusive approach to traceability.
Indonesia, the second-largest global exporter of natural rubber, has faced structural challenges to EUDR compliance, notably fragmented land tenure and informal trade networks. Politically, the country was among the most vocal in Southeast Asia in calling for a one-year postponement of the EUDR. Nevertheless, recent efforts signal a shift in approach. The government has introduced digital platforms integrating geolocation data and field-based monitoring to support traceability and risk detection [33]. In parallel, Indonesia is working with the EU to align national land-cover classifications with EU definitions.
Taken together, the examples of Côte d’Ivoire, Thailand, and Indonesia illustrate that major rubber-producing countries have each empowered a central authority with the mandate and resources to coordinate EUDR readiness. These countries have led the development of sector-wide initiatives and mobilized partnerships to meet due diligence requirements through their designated institutions. In contrast, institutional capacity in Ghana remains relatively recent: the TCDA was established in 2019, and the ANRAG only emerged in 2024. These newly formed organizations face two main challenges: first, securing sufficient volumes of raw rubber for domestic processing before export, and second, rebuilding trust and cohesion among value chain actors. Addressing both is essential not only to meet EUDR requirements but also to ensure that any resulting benefits are effectively passed on to smallholder producers and that the sector is better prepared for future disruptions.
5. Conclusions
The implementation of the EUDR presents both opportunities and challenges for Ghana’s rubber sector. While it may lead to price increases, smallholder producers continue to face financial uncertainty due to factors beyond their control. Liquidity constraints are a critical concern and warrant attention from TCDA and processors, particularly in the context of regulated exports of unprocessed rubber, as limited access to timely payments was a key driver of side-selling in the first place. ANRAG has a central role to play in coordinating a more inclusive EUDR compliance process, going beyond company-led initiatives and ensuring that smallholders are appropriately mapped and included. Empowering producers with access to their geolocation data is also a key measure to avoid duplicated efforts within the value chain and to give them more autonomy, while preserving diverse market channels with factories.
Additionally, this study highlights that even EUDR-compliant producers remain vulnerable to market shocks, despite the potential for price advantages. The continued sales of unprocessed rubber to export intermediaries as a coping mechanism during crises underscores the need for policies that balance the operational stability of factories with the economic security of producers. While the regulation of unprocessed rubber exports aims to reduce side-selling and favor value addition through local processing, its effectiveness will partly depend on the viability of preserved marketing channels during market downturns. Addressing these structural constraints will be essential to ensure that EUDR implementation does not deepen existing vulnerabilities but instead contributes to the long-term sustainability of the sector.
While this study has policy-relevant implications, it is worth mentioning some limitations to provide direction for future research. The findings of this study are based primarily on qualitative data. Adopting a mixed methods approach that incorporates quantitative data could have strengthened the CBA’s empirical basis. Additionally, this study uses fixed values for the exchange rate and inflation, but future fluctuations could affect the real value of the projected returns.
Further empirical research should monitor actual price trends following EUDR enforcement to validate the projected price increases and assess the sustainability of these higher prices over time. While preliminary information from a factory indicates that buyers are willing to pay a premium for EUDR-compliant rubber, the magnitude and persistence of these premiums remains uncertain. Moreover, assessing the impact of TCDA’s authorization system on the export of unprocessed rubber will demonstrate its ability to regulate the sector, and therefore its capacity to respond to potential future market downturns. Finally, the positive development with ANRAG will require further attention to evaluate its capacity to engage with and effectively represent producers, despite their potential reluctance to join associations. Finally, monitoring how factories respond to the segregation of EUDR-compliant and non-compliant rubber will be crucial—not only to assess whether some processors begin to exclude non-compliant rubber, but also to evaluate whether those that continue purchasing it offer a price high enough to sustain producers’ livelihoods.
Author Contributions
Conceptualization, S.M. and I.F.; methodology, S.M. and I.F.; software, S.M.; formal analysis, S.M.; investigation, S.M., E.N.T. and C.M.O.; resources, I.F.; data curation, S.M.; writing—original draft preparation, S.M.; writing—review and editing, I.F., E.N.T. and C.M.O.; visualization, S.M.; supervision, I.F. and E.N.T.; project administration, S.M. All authors have read and agreed to the published version of the manuscript.
Funding
This research received no external funding.
Institutional Review Board Statement
Not applicable.
Informed Consent Statement
Oral informed consent was obtained from all subjects involved in the study.
Data Availability Statement
Data will be provided upon request.
Acknowledgments
The author acknowledges the support of the following stakeholders during the field research in Ghana: Narubiz Ltd., Yaeric Company Ltd., GREL, TCDA, ASFRO, as well as the rubber farmers who participated in the field discussions.
Conflicts of Interest
The authors declare no conflicts of interest.
Abbreviations
The following abbreviations are used in this manuscript:
| ANRAG | Association of Natural Rubber Actors of Ghana |
| APROMAC | Association des professionnels du caoutchouc naturel de Côte d’Ivoire |
| ASFRO | Association of Self-Financed Rubber Outgrowers |
| BCR | Benefit Cost Ratio |
| CBA | Cost-Benefit Analysis |
| EFI | European Forest Institute |
| EU | European Union |
| EUDR | European Union Deforestation Regulation |
| EUTR | European Union Timber Regulation |
| GPSNR | Global Platform for Sustainable Natural Rubber |
| GREL | Ghana Rubber Estates Limited |
| IRR | Internal Rate of Return |
| NPV | Net Present Value |
| FPIC | Free, Prior and Informed Consent |
| RAOT | Rubber Authority of Thailand |
| ROAA | Rubber Outgrowers and Agents Association |
| ROPP | Rubber Outgrower Plantation Project |
| RUTAP | Rubber Purchase and Technical Assistance |
| SFO | Self-Financed Outgrowers |
| SIPH | Société Internationale de Plantations d’Hévéas |
| SGX | Singapore Exchange |
| TCDA | Tree Crops Development Authority |
| TSR | Technically Specified Rubber |
References
- Food and Agriculture Organization of the United Nations (FAO); United Nations Environment Programme (UNEP). The State of the World’s Forests 2020; Food and Agriculture Organization of the United Nations and United Nations Environment Programme: Rome, Italy, 2020; ISBN 978-92-5-132419-6. [Google Scholar]
- European Parliament. An EU Legal Framework to Halt and Reverse EU-Driven Global Deforestation: European Added Value Assessment; Publications Office of the European Union: Luxembourg, 2020; ISBN 978-92-846-7016-1. [Google Scholar]
- European Commission. List of Countries Which Are Considered to Present Low or High Risk According to the Assessment Based on Article 29 of Regulation (EU) 2023/1115. Available online: http://data.europa.eu/eli/reg/2023/1115/oj (accessed on 15 June 2025).
- European Commission. Regulation (EU) 2023/1115 of the European Parliament and of the Council of 31 May 2023 on the Making Available on the Union Market and the Export from the Union of Certain Commodities and Products Associated with Deforestation and Forest Degradation and Repealing Regulation (EU) No 995/2010. 2023. Available online: https://eur-lex.europa.eu/eli/reg/2023/1115/oj (accessed on 15 June 2025).
- European Forest Institute (EFI); Rubber Authority of Thailand (RAOT). Lessons from the Timber Sector for Natural Rubber in Thailand; EFI: Joensuu, Finland, 2025. [Google Scholar]
- EU Commission. EU Deforestation Regulation: An Opportunity for Smallholders; Publications Office of the European Union: Gare, Luxembourg, 2023. [Google Scholar]
- Zoological Society of London (ZSL). SPOTT Natural Rubber Assessment Summary March 2025; ZSL (Zoological Society of London): London, UK, 2025. [Google Scholar]
- Pendrill, F.; Persson, U.M.; Kastner, T. Deforestation Risk Embodied in Production and Consumption of Agricultural and Forestry Commodities 2005–2017. 2020. Available online: https://zenodo.org/records/4250532 (accessed on 10 January 2025).
- Warren-Thomas, E.; Ahrends, A.; Wang, Y.; Wang, M.M.H.; Jones, J.P.G. Rubber’s Inclusion in Zero-Deforestation Legislation is Necessary but Not Sufficient to Reduce Impacts on Biodiversity. Conserv. Lett. 2023, 16, e12967. [Google Scholar] [CrossRef]
- Su, C.-W.; Liu, L.; Tao, R.; Lobonţ, O.-R. Do Natural Rubber Price Bubbles Occur? Agric. Econ. Zemědělská Ekon. 2019, 65, 67–73. [Google Scholar] [CrossRef]
- European Commission Study on the EU’s List of Critical Raw Materials (2020): Final Report; Publications Office of the European Union: Luxembourg, 2020; ISBN 978-92-76-21049-8.
- Wagner, N. Why the Prices of Natural and Synthetic Rubber Do Not Always Bounce Together. Beyond the Numbers: Prices & Spending. 2020. Available online: https://www.bls.gov/opub/btn/volume-9/why-the-prices-of-natural-and-synthetic-rubber-do-not-always-bounce-together.htm (accessed on 3 March 2025).
- Koffi, C. In Ivory Coast, Global Rubber Glut Erases Profits. Available online: https://phys.org/news/2018-08-ivory-coast-global-rubber-glut.html (accessed on 3 March 2025).
- Loffman, R.A. Rubber Production in Africa. In Oxford Research Encyclopedia of African History; Oxford University Press: Oxford, UK, 2023; pp. 1–17. ISBN 978-0-19-027773-4. [Google Scholar]
- Suryanarayanan, T.S.; Azevedo, J.L. From Forest to Plantation: A Brief History of the Rubber Tree. Indian J. Hist. Sci. 2023, 58, 74–78. [Google Scholar] [CrossRef]
- Laroche, P.C.S.J.; Schulp, C.J.E.; Kastner, T.; Verburg, P.H. Assessing the Contribution of Mobility in the European Union to Rubber Expansion. Ambio 2022, 51, 770–783. [Google Scholar] [CrossRef] [PubMed]
- Food and Agriculture Organization of the United Nations (FAO) FAOSTAT: Natural Rubber Export Data 2023. Available online: https://www.fao.org/faostat/en/#data (accessed on 3 March 2025).
- Association of Natural Rubber Producing Countries (ANRPC). ANRPC Releases Monthly NR Statistical Report, December 2023. 2024. Available online: https://www.anrpc.org/newsla/anrpc-releases-monthly-nr-statistical-report%2C-december-2023 (accessed on 9 April 2025).
- United Nations. UN Comtrade Natural Rubber Export Data, Ghana 2023. Available online: https://comtrade.un.org/ (accessed on 3 March 2025).
- Koomson, J.E.; Donkor, E.; Owusu, V. Contract Farming Scheme for Rubber Production in Western Region of Ghana: Why Do Farmers Side Sell? For. Trees Livelihoods 2022, 31, 139–152. [Google Scholar] [CrossRef]
- Tree Crops Development Authority (TCDA). TCDA Convenes High-Level Stakeholders Forum to Raise Awareness on Directive for Unprocessed Rubber Export. Available online: https://tcda.gov.gh/news/127-tcda-convenes-high-level-stakeholders-forum-to-raise-awareness-on-directive-for-unprocessed-rubber-export (accessed on 25 June 2025).
- GIRSAL. Reviving the Natural Rubber Sector for Economic Growth: GIRSAL’s Contribution to the Sector. Available online: https://www.girsal.com/2024/04/17/reviving-the-natural-rubber-sector-for-economic-growth-girsals-contribution-to-the-sector/ (accessed on 15 June 2025).
- Paglietti, L.; Roble, S. Outgrower Schemes: Advantages of Different Business Models for Sustainable Crop Intensification—Ghana Case Studies; FAO Investment Centre—Learning from Investment Practices; Food and Agriculture Organization of the United Nations (FAO): Rome, Italy, 2012; p. 5. [Google Scholar]
- FAO. Rubberwood: A Source of Sustainable Timber; Food and Agriculture Organization of the United Nations (FAO): Rome, Italy, 2000. [Google Scholar]
- Bank of Ghana. Monetary Policy Report-January 2024; Bank of Ghana: Accra, Ghana, 2024.
- International Monetary Fund (IMF). Ghana: Technical Assistance Report on Developing the Forecasting and Policy Analysis System (FPAS) at the Bank of Ghana; Institute for Capacity Development (ICD): Washington, DC, USA, 2024. [Google Scholar]
- Rougieux, P.; Jonsson, R. Impacts of the FLEGT Action Plan and the EU Timber Regulation on EU Trade in Timber Product. Sustainability 2021, 13, 6030. [Google Scholar] [CrossRef]
- Zhunusova, E.; Ahimbisibwe, V.; Sen, L.T.H.; Sadeghi, A.; Toledo-Aceves, T.; Kabwe, G.; Günter, S. Potential Impacts of the Proposed EU Regulation on Deforestation-Free Supply Chains on Smallholders, Indigenous Peoples, and Local Communities in Producer Countries Outside the EU. For. Policy Econ. 2022, 143, 102817. [Google Scholar] [CrossRef]
- Ts, B.D.; Darmawan, D.A. Total Elasticity of Demand For Indonesian Natural Rubber: The use of Extended Armington Model. J. Agro Ekon. 2016, 10, 31. [Google Scholar] [CrossRef]
- Asibey-Bonsu, P. Farmer’s Organizations in West and Central Africa: High Expectations, Hard Realities. Ghana Country Report; Fondation pour l’agriculture et la ruralité dans le monde (FARM): Paris, France, 2012; p. 49. [Google Scholar]
- Addison, M.; Bonuedi, I.; Arhin, A.A.; Wadei, B.; Owusu-Addo, E.; Fredua Antoh, E.; Mensah-Odum, N. Exploring the Impact of Agricultural Digitalization on Smallholder Farmers’ Livelihoods in Ghana. Heliyon 2024, 10, e27541. [Google Scholar] [CrossRef] [PubMed]
- European Forest Institute (EFI); Rubber Authority of Thailand (RAOT). Thailand’s Natural Rubber Producers Are Preparing for New Market Requirements; EFI: Joensuu, Finland, 2024. [Google Scholar]
- Jong, H.N. Indonesia Strengthens Forest Monitoring with New Tool to Meet EU Deforestation Law. Available online: https://news.mongabay.com/2025/04/indonesia-strengthens-forest-monitoring-with-new-tool-to-meet-eu-deforestation-law/ (accessed on 15 June 2025).
Disclaimer/Publisher’s Note: The statements, opinions and data contained in all publications are solely those of the individual author(s) and contributor(s) and not of MDPI and/or the editor(s). MDPI and/or the editor(s) disclaim responsibility for any injury to people or property resulting from any ideas, methods, instructions or products referred to in the content. |
© 2025 by the authors. Licensee MDPI, Basel, Switzerland. This article is an open access article distributed under the terms and conditions of the Creative Commons Attribution (CC BY) license (https://creativecommons.org/licenses/by/4.0/).