1. Introduction
The newly discovered coronavirus disease in China in 2019, so-called COVID-19, caused a global pandemic in 2020 and beyond. The impact was not only on people’s health, but also on various economies and well-being. Governments implemented varying levels of restrictive measures to prevent COVID-19 from entering their countries and to contain the virus in the quarantined area once it was in the country. Policies varied across countries, with some countries taking strong restrictive measures, some countries taking moderate restrictive measures, and some countries taking few restrictive measures [
1,
2]. Among the countries, Japan took moderately restrictive measures against COVID-19.
To restrict the behavior of the public, the Japanese government declared a state of emergency (SOE) three times in the four years until the Japanese government placed COVID-19 on the list of designated infectious diseases and lifted it (7 April–25 May 2020 (2 months); 8 January–21 March 2021 (3 months); and 25 April–30 September 2021 (5 months)). However, the legal framework did not make this declaration legally binding. As a result, the government issued voluntary requests for people to refrain from going out, rather than imposing legally binding restrictions on their behavior [
3]. Surprisingly, many people in Japan voluntarily refrained from going out, and the amount of time they spent at home was comparable to that in countries that implemented strict lockdown measures [
4]. The reduction in going out also affected the broader Japanese economy, including energy, the natural environment, foreign exchange markets, trade, lifestyle, and tourism [
3,
5,
6,
7,
8,
9,
10,
11]. In particular, the restaurant industry was severely impacted, as consumer behavior shifted away from dining out toward purchasing food from supermarkets and eating at home [
12].
In Japan, the seafood industry was one of the industries most affected by COVID-19. Japan’s consumption of seafood products remained the highest in the world, but as lifestyles changed, seafood consumption declined. Since seafood is cumbersome to prepare and dispose of it, people recently cook and eat seafood at home less and eat it in restaurants more [
13].
Among seafood products, luxury seafood is generally difficult to cook, and households prefer cheap, easy-to-cook seafood or sashimi. Aruga et al. (2023) and Aruga (2022) found a negative influence on both inexpensive and high-end seafood, and the negative impact was severer in the high-end seafood [
14,
15]. The premium seafood market heavily depends on the restaurant sector, which will likely suffer adverse effects. COVID-19 also affected people’s diet in other countries. While the scope of studies examining the specific impact of COVID-19 on seafood consumption remains narrow, several reports suggest an increase in seafood consumption across many countries with traditionally high fish intake, especially in European countries [
16,
17,
18]. Also, a review study found that crises such as natural disasters, financial shocks, and pandemics have impacts on dietary patterns and increase food insecurity in high-income countries [
19].
Aruga and Wakamatsu (2024) directly surveyed consumption patterns of seafood products before and after the pandemic [
20]. They found that the demand for luxury seafood declined due to changes in consumers’ financial situations. However, Aruga (2022) also found an increase in the supply of Bluefin tuna, a well-known high-end seafood, at a wholesale market during SOE [
15]. These two findings appear contradictory, as they suggest luxury seafood consumption increased while consumers simultaneously reduced their consumption of luxury seafood.
The discrepancy may be attributed to a decline in overall demand for luxury seafood, as consumers opted to consume high-end seafood at home rather than dine out. This presents an apparent contradiction, as the volume of luxury seafood handled by restaurants is significantly greater than that consumed in households. Examining trends in wholesale and retail trade can help clarify this point. With the closure of restaurants and bars, we hypothesize that the luxury seafood consumption shifted from the restaurant sector to household consumption. This hypothesis should be tested using point-of-sale data from both the retail and restaurant sectors across time, applying methods such as time-series analysis, share analysis, difference-in-differences, or demand system analysis. However, it is difficult to obtain time-series data on seafood sales separately for the retail and restaurant sectors.
The objective of this study is to conduct a web-based survey of seafood buyers at retail outlets, restaurants, and wholesale businesses to assess the extent to which their transactions of 16 luxury seafood species and 8 inexpensive species increased or decreased during the State of Emergency (SOE) periods and the post–COVID–19 era. The survey results will first be analyzed visually and comparatively. Then, econometric methods will be applied to examine the statistical correlation between transaction frequency and whether luxury or inexpensive seafood is handled.
2. Materials and Methods
2.1. Data
The survey was conducted from 18–19 October 2023, using the online survey company iBRIDGE Corp. (Minato, Tokyo, Japan). Among the 13 million people who use iBRIDGE Corp., 100 individuals were selected based on the following criteria: residents of Japan; workers in the retail, restaurants/bars, and wholesale industries; aged between 18 and 79; and those with experience purchasing seafood products for their companies or restaurants during and/or after the COVID-19 pandemic. As a result, responses were collected from 100 retail workers, 103 restaurant/bar workers, and 97 wholesale workers. Participants were asked how the frequencies of seafood purchases for their shops or restaurants changed during the state of emergency (SOE) and after the pandemic. Although it would have been ideal to compare data from before and during COVID-19 to assess its effects, we were concerned that memories formed prior to major events might not be accurately recalled after the COVID-19 pandemic. Particularly, social distancing measures implemented during the pandemic have also been reported to contribute to declines in memory capacity and perception [
21,
22,
23]. Therefore, to reduce the risk of collecting inaccurate data, we avoided asking about pre-COVID experiences and instead focused on the most recent post-COVID period, during which memories are likely to be more vivid on the condition that consumers’ diet returned to the pre-COVID diet in the post-COVID period. Therefore, data from 2023—some time after COVID-19 was downgraded as a lower level of designated infectious disease—were used for comparison, assuming that the situation had returned to its original state.
2.2. Method
Applying a random utility model, we analyze which factors correlate to the frequency with which industry officials deal with seafood products [
24]. While a binary model is a major estimation, an ordered logit model serves as a natural extension [
25]. In particular, a related study adopted an ordered logit model to evaluate consumer preferences for seafood in Japan [
20]. Following Aruga and Wakamatsu (2024), we construct the ordered logit model [
20].
Although the random utility model was originally designed to analyze consumer preferences, it can be directly applied to a company’s purchasing behavior. We extend the concept of utility maximization to the profit maximization problem faced by seafood buyers. Seafood buyers make optimal choices to maximize their firm’s profit, following the same fundamental framework as the utility maximization problem for consumers.
The random utility model translates the utility/profit function of individual
i choosing alternative
j (i.e., increase, decrease or keep the frequency of seafood purchase) in a linear regression framework, where the individual’s choice is ranked as
Yi = (1,…,
J). Using this effect code variable, the multinomial logit model can be expressed as follows:
where Y denotes a vector of respective officials’ choices, X represents a matrix of explanatory factors, and epsilon represents an error term. The details of the explanatory variables are presented in
Table 1. Officials in the three sectors faced three options during the State of Emergency (SOE): (1) decrease the frequency of seafood procurement, (2) increase the frequency of procurement, or (3) maintain their existing procurement policy. We created an effect-coded variable by subtracting the frequency of procurement during the SOE from that of the post-COVID period: −1 if the difference was negative, 0 if there was no change, and 1 if the difference was positive. Using this variable across the three sectors, we conducted multinomial logistic regression analyses. The multinomial logit model allows us to examine the likelihood of two behavioral shifts—either increasing or decreasing procurement—relative to maintaining an unchanged policy. Although the dependent variable is ordinal, we adopted a multinomial logit model because an increase and a decrease in seafood procurement represent fundamentally different phenomena, particularly under the unique conditions of the COVID-19 pandemic. Ordered logit models, by construction, assume a unidimensional ordering of categories and impose a common set of coefficients across thresholds. This can obscure meaningful differences in the underlying mechanisms. For example, if a particular explanatory variable is negatively associated with an increase in procurement but positively associated with a decrease, the ordered logit model may mask this bidirectional relationship due to its structural assumptions. Therefore, it is analytically more appropriate to adopt a multinomial logit framework, which allows the factors associated with increased procurement to be modeled separately from those driving decreased procurement.
In selecting explanatory variables, we referred to factors previously reported to influence procurement behavior. These include the role of decision makers within firms, changes in customer behavior, the duration of customer visits to retailers or restaurants, the receipt of government subsidies, procurement channel choices, and a dummy variable for the six metropolitan areas where the SOE was first implemented [
26,
27,
28]. Based on this evidence, we selected the explanatory variables accordingly.
3. Results
3.1. Comparison of Characteristics of Seafood Purchasers Across Three Business Sectors
Based on the survey results, we compare the characteristics of seafood purchasers across retailers, restaurants, and wholesalers. The geographic distribution of respondents shows that the majority were from densely populated areas—those most affected by COVID-19 (
Appendix A Table A1). The distribution is not derived from the national statistics; thus, we drew samples from a population of each industry (
Appendix A Table A2). Although a sample size of 100 can be sufficient to represent the population, provided that it is properly drawn, such a sample may still introduce random bias into the results. However, given that the highly standardized distribution systems across Japan and the majority of respondents are from the populated areas, it is reasonable to consider the sample as broadly representative of retail, restaurant, and wholesale sectors in Japan. The descriptive statistics of the respondents are shown in
Table 2. Retail workers were slightly younger, but the average age across all groups was around 45 years. The proportion of female respondents was low, ranging from only 20 to 30% overall. The marriage rate was high, with more than half of the married respondents having children. Income levels tended to be highest among retailers, followed by restaurant workers and wholesalers. However, the average household income in Japan in 2023 is 524.2 million yen, meaning that the household income of all groups in this study was higher than the national average [
27].
In the retail and wholesale sectors, 80% of respondents were employees, while about 20% were managers. However, in the restaurant industry and other businesses, one-third of the respondents were managers. Additionally, approximately half of the respondents across all industries reported applying for subsidies related to COVID-19 economic losses.
3.2. Graphical Analyses
Figure 1 shows the change in the trading volume of luxury seafood. Luxury seafood is defined as a species with an average price of 800 yen or more per 100 g at the Toyosu wholesale market in 2023. The 16 most traded species—bluefin tuna, kuruma shrimp, sea urchin, snow crab, broadbanded thornyhead, rosy seabass, longtooth grouper, eel, tiger puffer, spotted halibut, white horsehead, sevenband grouper, ruby snapper, redspotted grouper, barfin flounder, and Keiji salmon—are listed.
Most of these species experienced a decline in trading volume during the state of emergencies (SOEs). However, among retailers, the trading volume of bluefin tuna, sea urchin, rosy seabass, eel, and spotted halibut increased. Similarly, wholesalers saw an increase in the volume of rosy seabass, longtooth grouper, red spotted grouper, and spotted halibut. In contrast, the restaurant market experienced a significant decline in trading volume for all species except barfin flounder, which saw an increase.
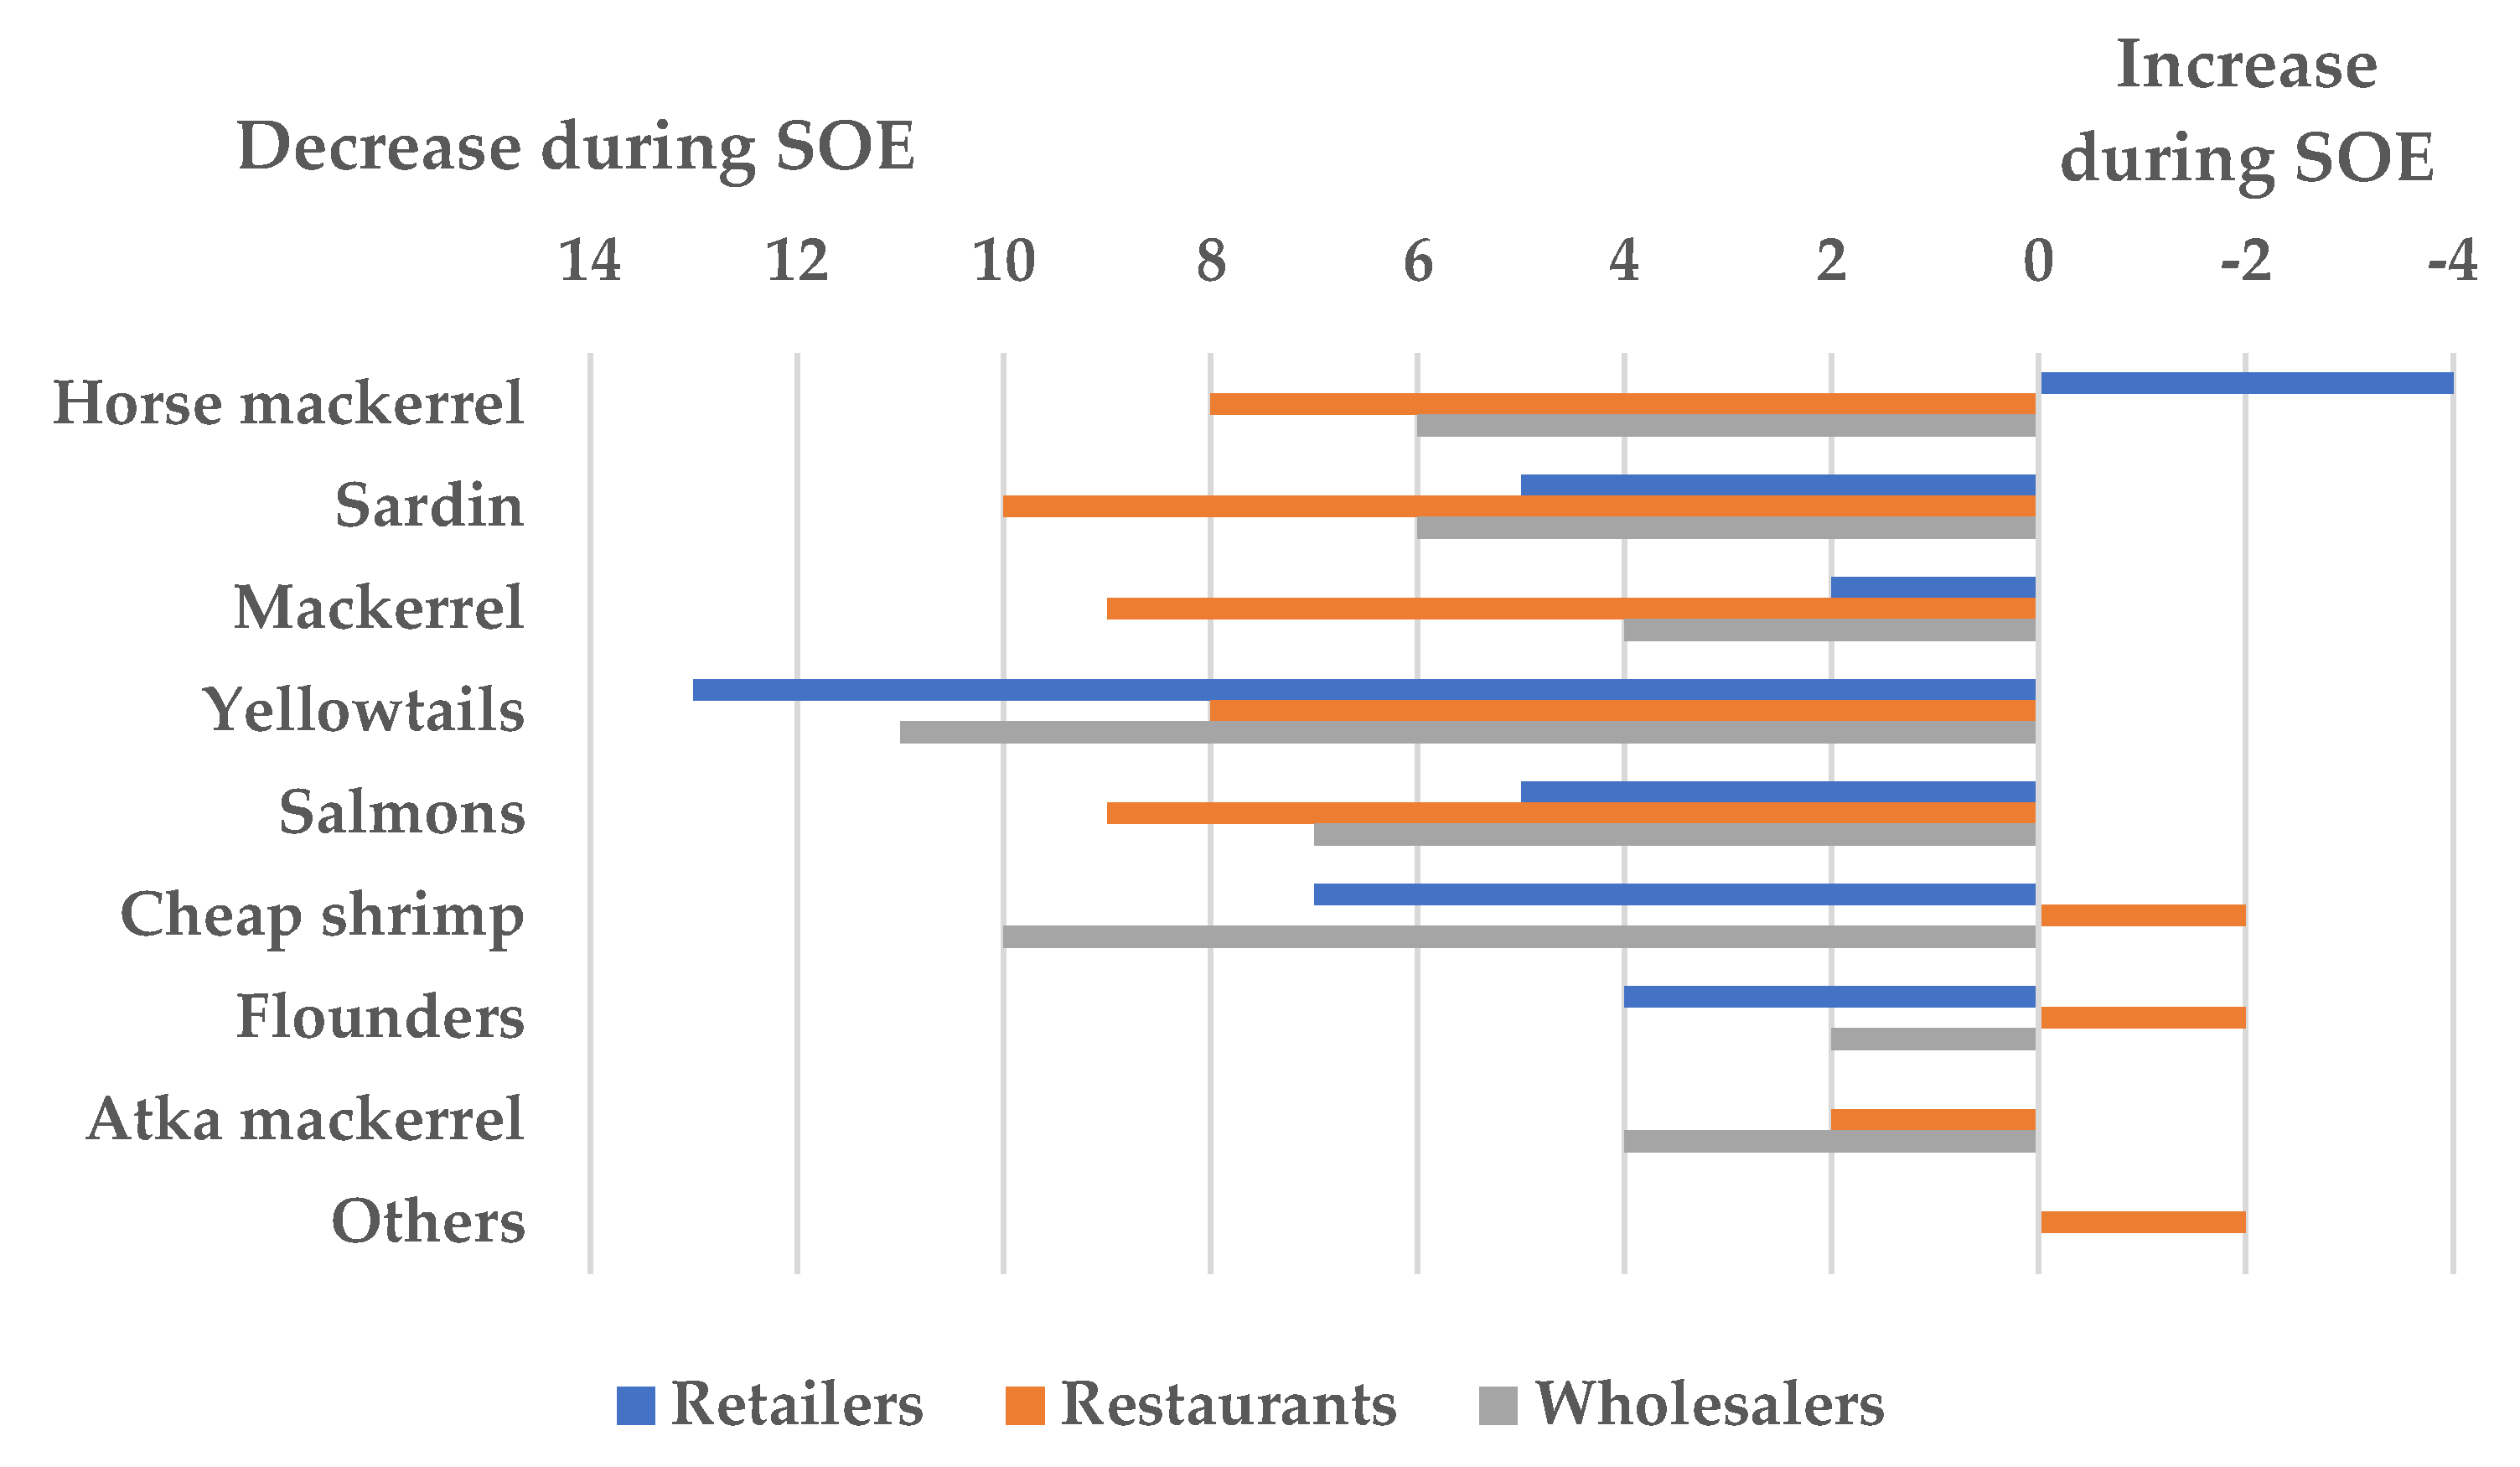
Inexpensive fish were defined as species with an average unit price of 400 yen or less per 100 g. Eight main species were selected among the most traded seafood: horse mackerel, sardine, mackerel, yellowtail, salmon, inexpensive shrimp, flounder, and Atka mackerel.
Figure 2 shows that in the retail sector, only horse mackerel saw an increase during the SOEs, while trade in all other species declined. Conversely, in the restaurant sector, trade in inexpensive shrimp, flounder, and Atka mackerel increased. In contrast, wholesalers experienced a decrease in trade across all species.
Figure 3 and
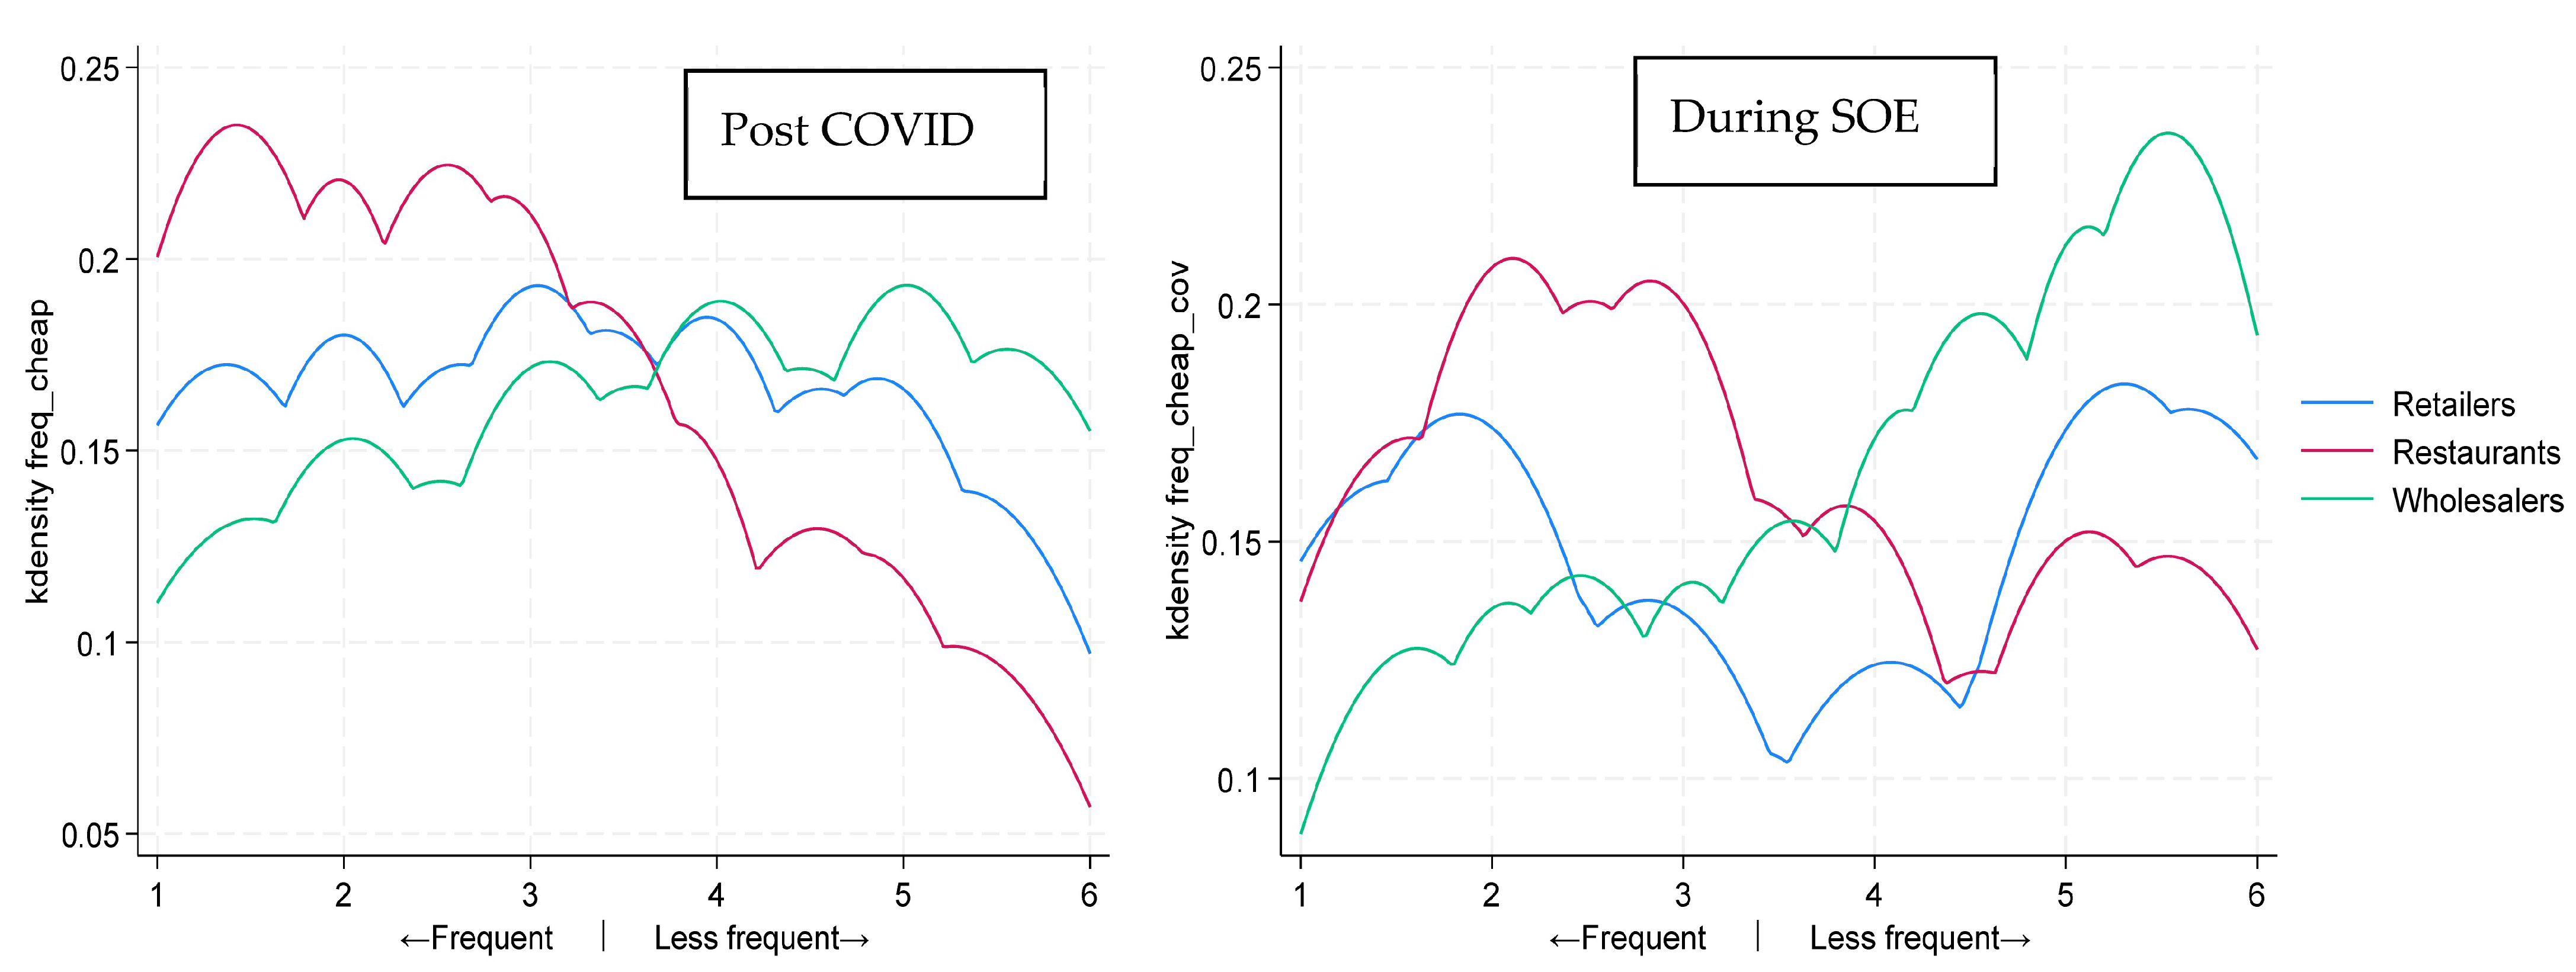
Figure 4 show the kernel density distribution of the purchase frequency of luxury and inexpensive seafood products across business categories, comparing the post-COVID period with the SOE period. A value of less than 3 indicates more frequent purchases, while a value of greater than 3 indicates less frequent purchases. Specifically: 1: purchases seafood more than five times per week, 2: purchases seafood three to four times per week, 3: purchases seafood two to three times per week, 4: purchases seafood once per week, 5: purchases seafood several times per month, and 6: purchases seafood less than once per month.
For luxury seafood (
Figure 3), trade patterns in the retail and wholesale sectors show little difference between the post-COVID period and the SOE period. However, in restaurants, there is a clear decline in high-frequency purchases during the SOE and an increase in low-frequency purchases. Additionally, in the retail sector, there is a notable increase in the number of retailers purchasing two to four times per week during the SOE, compared to the post-COVID period. For inexpensive seafood (
Figure 4), all business sectors are affected. However, retailers traded one to four times per week less frequently than before. Restaurants and wholesalers significantly reduced their frequency, including transactions of five or more times per week. Conversely, low-frequency transactions (a few times a month or less) increased.
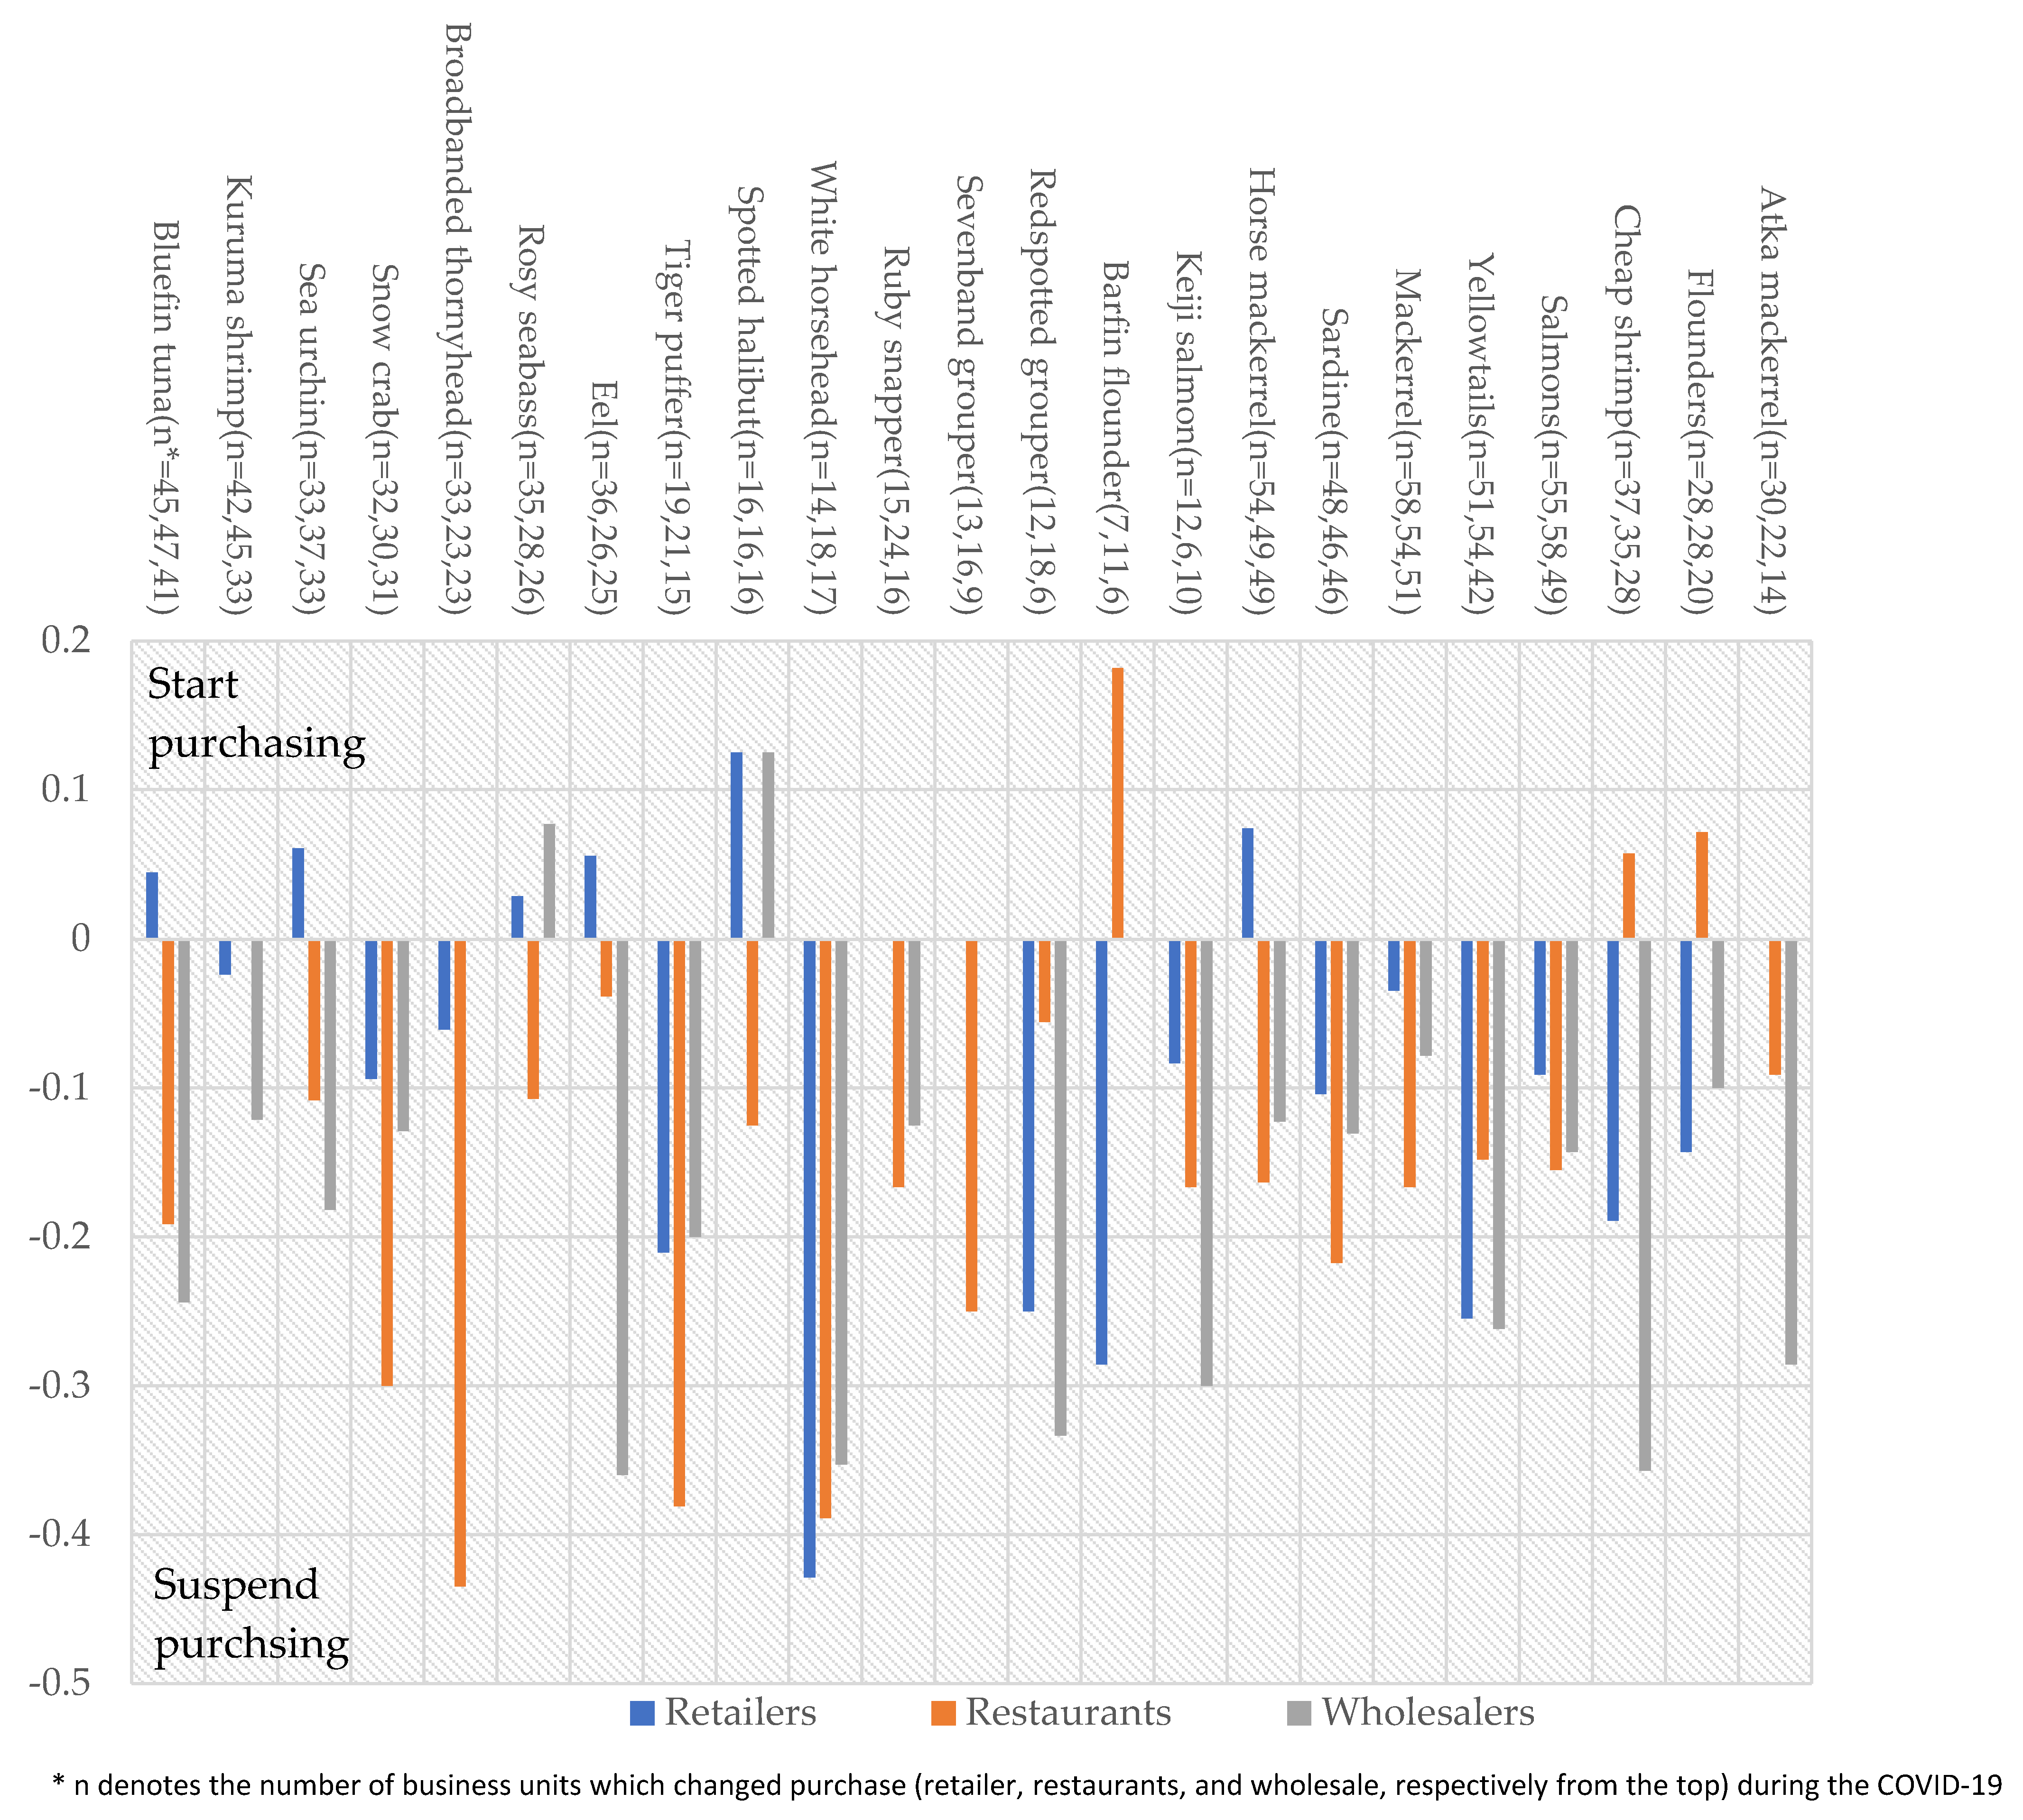
Figure 5 illustrates the differences in seafood species traded during the SOE and the post-COVID period. Positive values on the vertical axis indicate species that were only traded during the SOE, while negative numbers represent species that were no longer traded after the SOE.
Most business units across industries stopped trading the majority of seafood during the SOE. However, some retailers began trading bluefin and other luxury seafood products during this period. Together with the previous findings, these results indicate that while restaurants reduced luxury seafood, some retailers increased their trade in certain high-end species to some extent.
3.3. Regression Analysis
Table 3 shows the marginal effects of the results of the multinomial logit models. The results of the regressions are shown in
Appendix A Table A3. For clarity, the results are expressed separately for retailers, restaurants, and wholesalers, sorted by luxury and inexpensive seafood.
3.3.1. Retail Stores
Luxury Seafood: Compared to retailers that did not change the frequency of seafood procurement, those that experienced a decline in customer numbers were significantly more likely to either increase or decrease their procurement frequency of luxury seafood. The estimated marginal effects were +1.295 for increasing and +1.801 for decreasing procurement. Although these values exceed the conventional bounds of probability change, they are interpreted as indicating strong and divergent behavioral responses among retailers facing demand contraction. In contrast, businesses where customer stay time decreased were significantly less likely to change their procurement—either upward or downward—compared to those that did not change their behavior, indicating a relatively higher tendency to maintain existing procurement practices. The marginal effects were –1.282 for increase and –1.752 for decrease, indicating a pronounced resistance to change among this group. These high-magnitude effects should be interpreted with caution, as they may reflect overestimation due to sparse observations in this category.
Inexpensive Seafood: Retailers where the respondent held an employer position and experienced a decline in customer numbers were significantly more likely to reduce their frequency of inexpensive seafood procurement. The marginal effect for this group was +0.176, suggesting a modest but meaningful shift toward conservative purchasing behavior under managerial discretion and falling foot traffic.
3.3.2. Restaurants
Luxury Seafood: Restaurants that experienced a decline in customer numbers were significantly more likely to decrease their procurement of luxury seafood, with a marginal effect of +0.164. Additionally, restaurants that procured luxury seafood through middlemen exhibited a particularly strong likelihood of decreasing procurement, with a marginal effect of +0.678, and those located in metropolitan areas also showed a tendency toward reduced procurement (–0.198). These results suggest that both supply chain structure and geographical location played roles in the contraction of luxury seafood purchases during the pandemic.
Inexpensive Seafood: Restaurants that applied for the COVID-19 subsidy were more likely to increase their inexpensive seafood procurement, with a marginal effect of +0.181. This may indicate a partial recovery or substitution toward lower-cost products under financial support. Meanwhile, metropolitan restaurants were less likely to increase procurement (–0.200), which may reflect persistent demand suppression in urban centers.
3.3.3. Wholesale
Luxury Seafood: Wholesalers where the respondent held an employer position were significantly more likely to reduce their frequency, with a marginal effect of +0.195, indicating a moderate but significant response to managerial risk perceptions. Notably, wholesalers using middlemen showed extreme marginal effects of +1.618 for unchanged procurement and –2.313 for increased procurement, reflecting substantial shifts in procurement patterns that may arise from distribution channel restructuring. These effects should be interpreted with caution due to potential sample concentration.
Furthermore, wholesalers experiencing a decline in customer orders were more likely to increase luxury seafood procurement (+0.212), possibly in anticipation of post-pandemic market recovery.
Inexpensive Seafood: There are no significant marginal effects observed across wholesalers which changed or maintained their procurement policy of inexpensive seafood. This suggests relative stability in the procurement of non-luxury items within this sector.
4. Discussion
The results of the multinomial logistic regression provide evidence supporting our hypothesis regarding sectoral shifts in luxury seafood procurement during the COVID-19 pandemic. Specifically, restaurants were significantly more likely to decrease the frequency of luxury seafood procurement, while retailers were significantly more likely to increase it, compared to businesses that did not change their procurement behavior. While these findings are based on statistical associations and do not imply causality, they are consistent with the hypothesized transition in procurement behavior. Based on these results, we interpret the situation of luxury seafood distribution across sectors during and after COVID-19 as follows. Following the pandemic, the number of luxury seafood transactions declined in sectors with traditionally high frequency, such as restaurants and food service providers, suggesting weakened demand. In contrast, transactions in the retail sector increased, indicating a shift in consumption patterns toward household-based purchases. During the State of Emergency (SOE), restaurant-affiliated luxury seafood procurement showed a significant tendency toward reduction, likely reflecting a sharp drop in demand due to restrictions on dining out. Simultaneously, transactions through brokers decreased, whereas those through retailers increased, implying structural adjustments in distribution channels.
These findings suggest that luxury seafood distribution may have shifted from restaurants to retailers under COVID-19. However, this conclusion is based on statistical correlations and does not establish a direct cause-and-effect relationship.
According to our survey results, approximately half of the firms—particularly more than half of the restaurants—applied for the “sustainability subsidy”, a government grant designed to compensate for losses during the COVID-19 pandemic. In the regression analysis, the dummy variable for subsidy application (“sub”) was not statistically significant, suggesting that although most firms faced severe managerial difficulties during the pandemic, there was no substantial behavioral difference between firms that applied for subsidies and those that did not. Instead, both groups sought to adapt to the pandemic by adjusting their transaction volumes in response to demand. Among approximately half of the firms that experienced a management crisis, many attempted to cope by applying for subsidies.
Several estimated marginal effects, particularly for stay_dec, customer_dec, and by_middleman, exceeded ±1.0. These extreme values may result from sparse observations in relevant subgroups or from nonlinearities inherent in the multinomial logit model. Robustness checks excluding these variables showed consistent results in terms of both coefficient estimates and statistical significance (See
Appendix A Table A4). While they are mathematically valid, we advise interpreting these estimates as indicative of strong tendencies rather than as precise measures of probability change.
5. Conclusions
A previous study found that consumers ate luxury seafood less frequently during the pandemic [
20]. Several studies have also shown that when human mobility is restricted during a pandemic, seafood consumption shifts from restaurant-prepared meals to home consumption [
12,
29,
30]. This finding aligns with that of the previous study [
14], who reported a sharp decline in the price of luxury seafood due to increased time spent at home.
In our study, while restaurants reduced their purchases of luxury seafood, several retailers were either unaffected or even increased their purchases. Taken together, these findings suggest that the restaurant industry, which traditionally handled most luxury seafood, experienced a shift in the distribution of such products toward retailers.
However, as consumers stopped dining out, the overall handling and prices of luxury seafood declined. Consumers generally shifted their food sourcing from restaurants to retailers, leading to an increase in total seafood consumption at home. At the same time, the overall consumption of luxury seafood—including both restaurant and home consumption—decreased. One of the key findings of this study is that the disparity in demand for high-end seafood lay between out-of-home consumption and household consumption. When restaurant dining was restricted during the pandemic, this gap could not be fully absorbed by household demand. A major contributing factor appears to be the generally low level of seafood consumption in households. Therefore, from a long-term perspective, it may be fundamentally necessary to implement educational policies to promote fish consumption and foster household demand. In the short term, it is essential to establish a distribution network that supplies high-end seafood in more convenient forms—such as ready-to-eat sashimi—that require minimal preparation and are better suited for household consumption.
Since seafood consumers in Japan are generally reluctant to prepare luxury seafood themselves [
13], retail consumption of luxury seafood did not grow enough to offset the decline in restaurant sales. Most of the seafood species that saw increased sales were those used in sushi and sashimi or other types that require minimal preparation [
14].
As a practical recommendation for the industry, it is essential to offer high-end seafood in forms that can either be easily prepared in general households or require the least preparation. This would help eliminate the barrier posed by the difficulty of preparation, which currently discourages household consumption. To achieve this, key challenges include providing consumer-friendly recipes alongside products and establishing supply chains that enable the processing and distribution of high-end seafood. However, it has also been reported that complex and highly integrated supply chains tend to be more vulnerable to external shocks such as pandemics, whereas simpler supply chains exhibit greater resilience. Therefore, a flexible and streamlined distribution system that can adaptively handle the flow of seafood is considered more desirable [
31].
After the pandemic, if substitution from production through distribution to final consumption becomes easier, macroeconomic factors—such as the current inflation-driven price increases—may reduce domestic consumption in Japan and instead lead to the development of alternative distribution routes abroad. Alternatively, rather than Japanese consumers, overseas tourists, who have become relatively wealthier due to the depreciation of the yen, may become the primary consumers of high-end fish within Japan. It is also likely that distribution systems will evolve to better accommodate such shifts.
In addition, promotional activities through digital platforms, especially social media, emerged during the COVID-19 pandemic. One notable example is the “Kawauso Market” in Kochi Prefecture. Amidst a collapse in demand during the pandemic, local fish farmers contacted the platform, reporting a surplus of farmed amberjack (kanpachi) and asking for support. In response, Kawauso Market launched a campaign titled “#NameThese200ThousandNamelessKanpachi,” on social networking services, which went viral and generated a surge in orders (Kawauso Market HP, URL:
https://kochi-kawauso.com/about?srsltid=AfmBOoq6tmjFSGTuLdSe8ztOJcmZiXrNfPdir1I7y7c54tGa-JnMJKxs, accessed on 14 May 2025). This case shows the possibility that social media directly connects producers and consumers, enabling direct delivery. While skipping several distribution channels incurs higher costs of processing and shipping, it revealed the potential to resolve supply-demand mismatches that previously went unaddressed.
Not limited to the pandemic, such mismatches caused by other external shocks may increasingly be bridged by emerging technologies and digital platforms like social media, which are likely to play an even more important role in the future. In addition, to cope with sudden disruptions in supply and distribution caused by these external shocks, it is essential to secure alternative sales channels beyond conventional ones and to establish a flexible supply chain capable of adapting distribution systems and sales channels in response to shifts in demand and supply during emergencies.
One limitation of this study is the potential sampling bias resulting from the use of a consumer-based survey to screen seafood procurement personnel from the three sectors. Additionally, since detailed information about the companies—such as their organizational size and structure—was not collected, there is a possibility that the representativeness of the sample is somewhat skewed.
Author Contributions
Conceptualization, H.W. and K.A.; methodology, H.W.; software, H.W.; validation, H.W.; formal analysis, H.W.; investigation, H.W. and K.A.; resources, H.W.; data curation, H.W.; writing—original draft preparation, H.W.; writing—review and editing, H.W. and K.A.; visualization, H.W.; supervision, H.W.; project administration, H.W. and K.A.; funding acquisition, H.W. and K.A. All authors have read and agreed to the published version of the manuscript.
Funding
This work was supported by Japan Society for the Promotion of Science [grant number JP 21H04738].
Institutional Review Board Statement
Not applicable.
Informed Consent Statement
Not applicable.
Data Availability Statement
The data that support the findings of this study are available on request from the corresponding author.
Acknowledgments
We are also grateful to Nobuyki Yagi for their support in facilitating this research.
Conflicts of Interest
We declare no conflicts of interest.
Appendix A
Table A1.
Respondents’ resident prefectures across industries.
Table A1.
Respondents’ resident prefectures across industries.
| Retailers | | | Restaurants | | | Wholesalers | | |
|---|
| Prefecture | Freq. | % | Prefecture | Freq. | % | Prefecture | Freq. | % |
|---|
| Osaka | 16 | 16 | Tokyo | 22 | 21 | Tokyo | 16 | 16 |
| Tokyo | 16 | 16 | Osaka | 8 | 8 | Osaka | 11 | 11 |
| Hokkaido | 8 | 8 | Aichi | 7 | 7 | Hyogo | 9 | 9 |
| Saitama | 8 | 8 | Kyoto | 6 | 6 | Chiba | 7 | 7 |
| Kanagawa | 7 | 7 | Hyogo | 5 | 5 | Fukuoka | 6 | 6 |
| Chiba | 6 | 6 | Hokkaido | 5 | 5 | Hokkaido | 5 | 5 |
| Aichi | 6 | 6 | Fukuoka | 5 | 5 | Saitama | 4 | 4 |
| Tokushima | 5 | 5 | Chiba | 4 | 4 | Aichi | 4 | 4 |
| Hyogo | 4 | 4 | Gifu | 4 | 4 | Shiga | 4 | 4 |
| Kyoto | 2 | 2 | Niigata | 4 | 4 | Kanagawa | 4 | 4 |
| Iwate | 2 | 2 | Kanagawa | 4 | 4 | Kyoto | 3 | 3 |
| Fukuoka | 2 | 2 | Shizuoka | 3 | 3 | Nara | 3 | 3 |
| Gunma | 2 | 2 | Saitama | 2 | 2 | Nagano | 3 | 3 |
| Mie | 1 | 1 | Nara | 2 | 2 | Hiroshima | 2 | 2 |
| Saga | 1 | 1 | Miyagi | 2 | 2 | Kumamoto | 2 | 2 |
| Oita | 1 | 1 | Yamaguchi | 2 | 2 | Gunma | 2 | 2 |
| Toyama | 1 | 1 | Okayama | 2 | 2 | Aomori | 2 | 2 |
| Yamagata | 1 | 1 | Okinawa | 2 | 2 | Shizuoka | 2 | 2 |
| Yamanashi | 1 | 1 | Akita | 2 | 2 | Mie | 1 | 1 |
| Hiroshima | 1 | 1 | Nagano | 2 | 2 | Miyagi | 1 | 1 |
| Niigata | 1 | 1 | Tottori | 2 | 2 | Yamaguchi | 1 | 1 |
| Okinawa | 1 | 1 | Wakayama | 1 | 1 | Yamagata | 1 | 1 |
| Shiga | 1 | 1 | Yamagata | 1 | 1 | Tokushima | 1 | 1 |
| Ishikawa | 1 | 1 | Shimane | 1 | 1 | Ehime | 1 | 1 |
| Fukushima | 1 | 1 | Hiroshima | 1 | 1 | Fukushima | 1 | 1 |
| Nagano | 1 | 1 | Tokushima | 1 | 1 | Akita | 1 | 1 |
| Aomori | 1 | 1 | Ishikawa | 1 | 1 | | | |
| Kagawa | 1 | 1 | Fukushima | 1 | 1 | | | |
| Tottori | 1 | 1 | Kagoshima | 1 | 1 | | | |
| Total | 100 | 100 | Total | 103 | 100 | Total | 97 | 100 |
Table A2.
National Statistics of industries across prefectures.
Table A2.
National Statistics of industries across prefectures.
| Restaurants | Freq. | % | Retailers | Freq. | % | Wholesalers | Freq. | % |
|---|
| Tokyo | 5679 | 17% | Tokyo | 1682 | 13% | Tokyo | 382 | 38% |
| Osaka | 3193 | 9% | Kanagawa | 918 | 7% | Hokkaido | 68 | 7% |
| Kanagawa | 2198 | 6% | Osaka | 883 | 7% | Kanagawa | 48 | 5% |
| Aichi | 1956 | 6% | Fukuoka | 693 | 5% | Osaka | 48 | 5% |
| Hokkaido | 1695 | 5% | Aichi | 676 | 5% | Miyagi | 47 | 5% |
| Fukuoka | 1688 | 5% | Hokkaido | 626 | 5% | Fukuoka | 40 | 4% |
| Hyogo | 1158 | 3% | Saitama | 505 | 4% | Shizuoka | 36 | 4% |
| Shizuoka | 1094 | 3% | Hyogo | 450 | 3% | Chiba | 29 | 3% |
| Saitama | 947 | 3% | Chiba | 439 | 3% | Aichi | 26 | 3% |
| Kyoto | 942 | 3% | Shizuoka | 405 | 3% | Kagoshima | 22 | 2% |
| Hiroshima | 857 | 3% | Hiroshima | 305 | 2% | Hyogo | 19 | 2% |
| Chiba | 839 | 2% | Kyoto | 299 | 2% | Yamaguchi | 18 | 2% |
| Miyagi | 679 | 2% | Miyagi | 298 | 2% | Ehime | 17 | 2% |
| Okinawa | 566 | 2% | Kumamoto | 252 | 2% | Aomori | 15 | 2% |
| Nagano | 544 | 2% | Niigata | 244 | 2% | Ishikawa | 15 | 2% |
| Kumamoto | 513 | 2% | Nagano | 242 | 2% | Mie | 15 | 2% |
| Kagoshima | 498 | 1% | Ibaraki | 231 | 2% | Nagasaki | 14 | 1% |
| Ibaraki | 447 | 1% | Kagoshima | 195 | 2% | Hiroshima | 13 | 1% |
| Nagasaki | 424 | 1% | Gunma | 190 | 1% | Kochi | 13 | 1% |
| Niigata | 420 | 1% | Fukushima | 183 | 1% | Kumamoto | 12 | 1% |
| Fukushima | 419 | 1% | Nagasaki | 177 | 1% | Fukushima | 8 | 1% |
| Gifu | 418 | 1% | Okayama | 174 | 1% | Kyoto | 8 | 1% |
| Aomori | 415 | 1% | Okinawa | 172 | 1% | Miyazaki | 7 | 1% |
| Okayama | 400 | 1% | Aomori | 170 | 1% | Saitama | 6 | 1% |
| Gunma | 375 | 1% | Gifu | 158 | 1% | Wakayama | 6 | 1% |
| Ehime | 362 | 1% | Tochigi | 157 | 1% | Iwate | 5 | 1% |
| Tochigi | 346 | 1% | Mie | 157 | 1% | Niigata | 5 | 1% |
| Mie | 329 | 1% | Ehime | 157 | 1% | Toyama | 5 | 1% |
| Ishikawa | 319 | 1% | Yamaguchi | 153 | 1% | Nagano | 5 | 1% |
| Miyazaki | 317 | 1% | Oita | 143 | 1% | Kagawa | 5 | 1% |
| Iwate | 309 | 1% | Iwate | 141 | 1% | Okinawa | 5 | 1% |
| Yamaguchi | 307 | 1% | Yamagata | 124 | 1% | Akita | 4 | 0% |
| Wakayama | 306 | 1% | Wakayama | 124 | 1% | Ibaraki | 4 | 0% |
| Kagawa | 296 | 1% | Miyazaki | 122 | 1% | Okayama | 4 | 0% |
| Yamagata | 264 | 1% | Ishikawa | 117 | 1% | Tochigi | 3 | 0% |
| Oita | 251 | 1% | Nara | 104 | 1% | Yamanashi | 3 | 0% |
| Shiga | 240 | 1% | Akita | 103 | 1% | Shiga | 3 | 0% |
| Yamanashi | 238 | 1% | Yamanashi | 100 | 1% | Tokushima | 3 | 0% |
| Nara | 238 | 1% | Shiga | 99 | 1% | Saga | 3 | 0% |
| Fukui | 229 | 1% | Toyama | 82 | 1% | Tottori | 2 | 0% |
| Toyama | 227 | 1% | Kagawa | 81 | 1% | Oita | 2 | 0% |
| Akita | 226 | 1% | Tokushima | 76 | 1% | Yamagata | 1 | 0% |
| Tokushima | 216 | 1% | Shimane | 71 | 1% | Gunma | 1 | 0% |
| Kochi | 210 | 1% | Saga | 70 | 1% | Fukui | 1 | 0% |
| Saga | 176 | 1% | Kochi | 68 | 1% | Gifu | 1 | 0% |
| Shimane | 166 | 0% | Fukui | 54 | 0% | Nara | 1 | 0% |
| Tottori | 133 | 0% | Tottori | 46 | 0% | Shimane | 1 | 0% |
| Total | 34,069 | 100% | Total | 12,916 | 100% | Total | 999 | 100% |
Table A3.
Results of Multinomial Logit Regressions.
Table A3.
Results of Multinomial Logit Regressions.
| | Retailers | Restaurants | Wholesalers |
|---|
| | Luxury | Inexpensive | Luxury | Inexpensive | Luxury | Inexpensive |
|---|
| VARIABLES | Decrease | Increase | Decrease | Increase | Decrease | Increase | Decrease | Increase | Decrease | Increase | Decrease | Increase |
|---|
| employer | 0.171 | −1.748 | 0.904 * | −0.229 | 0.61 | −0.0563 | −1.820 * | −0.053 | 0.35 | 0.0104 | 0.89 | −0.66 |
| | (0.84) | (1.26) | (0.55) | (0.77) | (0.79) | (0.76) | (0.98) | (0.89) | (0.76) | (0.72) | (0.68) | (0.90) |
| stay_dec | −19.33 *** | −15.48 *** | 0.901 | 1.083 | −0.865 | 0.86 | 1.905 | 0.974 | | | | |
| | (1.96) | (0.88) | (0.80) | (1.19) | (0.96) | (0.95) | (1.23) | (1.04) | | | | |
| customer_dec | 19.82 *** | 15.71 *** | 1.656 ** | 1.154 | 1.294 * | 0.0499 | −0.97 | −0.885 | | | | |
| | (2.08) | (1.56) | (0.75) | (0.87) | (0.70) | (0.87) | (1.12) | (1.04) | | | | |
| order_dec | −0.892 | 0.748 | −0.543 | 0.321 | −0.789 | 1.183 | 1.692 * | 1.191 | −0.541 | 1.464 * | 0.64 | −0.135 |
| | (1.34) | (1.24) | (0.85) | (1.23) | (1.12) | (1.06) | (0.92) | (0.90) | (1.07) | (0.88) | (0.76) | (0.94) |
| sub | 0.312 | 0.741 | 0.383 | −0.252 | −0.692 | −0.484 | 0.695 | 1.348 ** | −0.54 | −0.534 | 0.78 | 0.474 |
| | (0.76) | (0.81) | (0.54) | (0.70) | (0.61) | (0.64) | (0.73) | (0.64) | (0.60) | (0.62) | (0.55) | (0.57) |
| by_wholesale | 0.753 | 0.207 | −0.31 | −0.411 | −0.767 | 0.172 | −0.675 | −0.345 | −0.682 | 0.101 | −0.269 | −0.391 |
| | (0.70) | (0.97) | (0.59) | (0.68) | (0.76) | (0.73) | (0.79) | (0.69) | (0.75) | (0.70) | (0.60) | (0.72) |
| by_middleman | 1.017 | −1.247 | 0.537 | 0.265 | 2.334 *** | −16.47 *** | 0.425 | 0.537 | 2.249 *** | −16.64 *** | 0.0183 | 0.107 |
| | (0.78) | (1.07) | (0.55) | (0.68) | (0.77) | (0.70) | (0.68) | (0.96) | (0.75) | (0.67) | (0.60) | (0.63) |
| by_retailers | 0.546 | 0.259 | −0.477 | −1.687 ** | −0.392 | 1.34 | −0.978 | −0.34 | −0.259 | 1.295 | −0.714 | 0.398 |
| | (0.84) | (1.06) | (0.63) | (0.69) | (0.75) | (0.82) | (0.88) | (0.78) | (0.75) | (0.81) | (0.67) | (0.70) |
| by_online | −2.889 | −0.448 | 0.34 | 0.571 | 0.197 | −1.216 | −3.936 * | −0.0511 | −0.0217 | −0.9 | −0.526 | 0.548 |
| | (3.01) | (1.06) | (0.77) | (0.84) | (1.01) | (1.10) | (2.23) | (0.97) | (0.95) | (1.03) | (0.85) | (0.84) |
| by_producers | −1.237 | 0.00693 | 0.176 | 0.883 | −1.167 | 0.107 | −0.106 | −1.632 | −1.042 | 0.136 | −0.494 | 0.258 |
| | (2.01) | (1.51) | (0.85) | (1.08) | (1.12) | (1.03) | (1.03) | (1.11) | (1.08) | (1.00) | (0.90) | (0.78) |
| metro | −0.879 | −0.94 | 0.724 | −0.414 | 1.708 ** | 0.179 | −1.076 | −1.625 *** | 1.603 ** | 0.249 | −0.38 | 0.507 |
| | (0.67) | (0.64) | (0.58) | (0.66) | (0.82) | (0.60) | (0.71) | (0.63) | (0.79) | (0.59) | (0.61) | (0.63) |
| high_sum | 0.286 | −0.381 | −0.18 | −0.255 | 0.0272 | −0.0781 | 0.107 | 0.0784 | 0.0379 | −0.0605 | 0.113 | 0.105 |
| | (0.22) | (0.32) | (0.16) | (0.17) | (0.17) | (0.18) | (0.15) | (0.17) | (0.16) | (0.16) | (0.16) | (0.14) |
| cheap_sum | −0.396 ** | 0.00249 | −0.00436 | 0.0315 | −0.0578 | −0.183 | 0.108 | −0.239 | −0.0726 | −0.182 | 0.17 | 0.0105 |
| | (0.16) | (0.22) | (0.21) | (0.21) | (0.23) | (0.13) | (0.17) | (0.20) | (0.22) | (0.12) | (0.15) | (0.15) |
| Observations | 100 | 100 | 103 | 103 | 97 | 97 | 100 | 100 | 97 | 97 | 97 | 97 |
| Pseudo R-square | 0.261 | 0.261 | 0.147 | 0.147 | 0.238 | 0.238 | 0.186 | 0.186 | 0.221 | 0.221 | 0.09 | 0.09 |
| log-likelihood | −69.32 | −69.32 | −88.67 | −88.67 | −74.17 | −74.17 | −88.61 | −88.61 | −75.8 | −75.8 | −93.34 | −93.34 |
Table A4.
Robustness Check Results: Results with and without outlying variables.
Table A4.
Robustness Check Results: Results with and without outlying variables.
| | Retailers (Luxuary) | Restaurants (Luxuary) |
|---|
| | Original | Robustness Check | Original | Robustness Check |
|---|
| VARIABLES | Decrease | Increase | Decrease | Increase | Decrease | Increase | Decrease | Increase |
|---|
| employer | 0.171 | −1.748 | −0.362 | −1.803 | 0.904 * | −0.229 | 0.944 * | −0.244 |
| | (0.84) | (1.26) | (0.75) | (1.23) | (0.55) | (0.77) | (0.54) | (0.79) |
| stay_dec | −19.33 *** | −15.48 *** | | | 0.901 | 1.083 | 0.834 | 1.058 |
| | (1.96) | (0.88) | | | (0.80) | (1.19) | (0.80) | (1.19) |
| customer_dec | 19.82 *** | 15.71 *** | | | 1.656 ** | 1.154 | 1.540 ** | 1.075 |
| | (2.08) | (1.56) | | | (0.75) | (0.87) | (0.73) | (0.85) |
| order_dec | −0.892 | 0.748 | 0.015 | 0.741 | −0.543 | 0.321 | −0.465 | 0.352 |
| | (1.34) | (1.24) | (0.99) | (1.03) | (0.85) | (1.23) | (0.84) | (1.23) |
| sub | 0.312 | 0.741 | 0.006 | 0.508 | 0.383 | −0.252 | 0.396 | −0.244 |
| | (0.76) | (0.81) | (0.67) | (0.65) | (0.54) | (0.70) | (0.53) | (0.69) |
| by_wholesale | 0.753 | 0.207 | 0.868 | 0.275 | −0.31 | −0.411 | −0.294 | −0.412 |
| | (0.70) | (0.97) | (0.71) | (0.90) | (0.59) | (0.68) | (0.59) | (0.68) |
| by_middleman | 1.017 | −1.247 | 0.475 | −1.176 | 0.537 | 0.265 | | |
| | (0.78) | (1.07) | (0.71) | (1.06) | (0.55) | (0.68) | | |
| by_retailers | 0.546 | 0.259 | 0.319 | 0.149 | −0.477 | −1.687 ** | −0.639 | −1.755 ** |
| | (0.84) | (1.06) | (0.77) | (1.03) | (0.63) | (0.69) | (0.60) | (0.68) |
| by_online | −2.889 | −0.448 | −2.498 | −0.233 | 0.34 | 0.571 | 0.38 | 0.562 |
| | (3.01) | (1.06) | (2.36) | (0.98) | (0.77) | (0.84) | (0.76) | (0.87) |
| by_producers | −1.237 | 0.007 | −1.442 | −0.022 | 0.176 | 0.883 | 0.291 | 0.991 |
| | (2.01) | (1.51) | (2.00) | (1.49) | (0.85) | (1.08) | (0.90) | (1.10) |
| high_sum | 0.286 | −0.381 | 0.274 | −0.365 | −0.18 | −0.255 | −0.17 | −0.248 |
| | (0.22) | (0.32) | (0.20) | (0.31) | (0.16) | (0.17) | (0.16) | (0.17) |
| cheap_sum | −0.396 ** | 0.002 | −0.381 *** | 0.005 | −0.004 | 0.032 | 0.009 | 0.035 |
| | (0.16) | (0.22) | (0.14) | (0.21) | (0.21) | (0.21) | (0.21) | (0.19) |
| metro | −0.879 | −0.94 | −0.478 | −1.032 * | 0.724 | −0.414 | 0.691 | −0.457 |
| | (0.67) | (0.64) | (0.61) | (0.62) | (0.58) | (0.66) | (0.57) | (0.63) |
| Constant | −1.187 | 0.040 | −0.787 | 0.098 | −1.343 * | 0.098 | −1.087 | 0.241 |
| | (0.93) | (1.10) | (0.83) | (1.03) | (0.74) | (0.79) | (0.70) | (0.65) |
| Observations | 100 | 100 | 100 | 100 | 103 | 103 | 103 | 103 |
| Pseudo R-square | 0.261 | 0.261 | 0.157 | 0.157 | 0.147 | 0.147 | 0.143 | 0.143 |
| log-likelihood | −69.32 | −69.32 | −79.1 | −79.1 | −88.67 | −88.67 | −89.15 | −89.15 |
References
- Hale, T.; Angrist, N.; Goldszmidt, R.; Kira, B.; Petherick, A.; Phillips, T.; Webster, S.; Cameron-Blake, E.; Hallas, L.; Majumdar, S.; et al. A global panel database of pandemic policies (Oxford COVID-19 Government Response Tracker). Nat. Hum. Behav. 2021, 5, 529–538. [Google Scholar] [CrossRef] [PubMed]
- Weible, C.M.; Nohrstedt, D.; Cairney, P.; Carter, D.P.; Crow, D.A.; Durnová, A.P.; Heikkila, T.; Ingold, K.; McConnell, A.; Stone, D. COVID-19 and the policy sciences: Initial reactions and perspectives. Policy Sci. 2020, 53, 225–241. [Google Scholar] [CrossRef] [PubMed]
- Watanabe, T.; Yabu, T. Japan’s voluntary lockdown. PLoS ONE 2021, 16, e0252468. [Google Scholar] [CrossRef] [PubMed]
- Hannah Ritchie, E.M.; Rodés-Guirao, L.; Appel, C.; Giattino, C.; Ortiz-Ospina, E.; Hasell, J.; Macdonald, B.; Beltekian, D.; Roser, M. Coronavirus Pandemic (COVID-19). Our World in Data. 2020. Available online: https://ourworldindata.org/covid-google-mobility-trends (accessed on 22 March 2022).
- Aruga, K. Changes in human mobility under the COVID-19 pandemic and the Tokyo fuel market. J. Risk Financ. Manag. 2021, 14, 163. [Google Scholar] [CrossRef]
- Baldwin, R.; Tomiura, E. Thinking ahead about the trade impact of COVID-19. In Economics in the Time of COVID-19; Baldwin, R., Weder di Mauro, B., Eds.; CEPR Press: London, UK, 2020; pp. 59–71. [Google Scholar]
- Burlea-Schiopoiu, A.; Ogarca, R.F.; Barbu, C.M.; Craciun, L.; Baloi, I.C.; Mihai, L.S. The impact of COVID-19 pandemic on food waste behavior of young people. J. Clean. Prod. 2021, 294, 126333. [Google Scholar] [CrossRef]
- Inoue, H.; Todo, Y. The propagation of economic impacts through supply chains: The case of a mega-city lockdown to prevent the spread of COVID-19. PLoS ONE 2020, 15, e0239251. [Google Scholar] [CrossRef]
- Narayan, P.K.; Devpura, N.; Wang, H. Japanese currency and stock market—What happened during the COVID-19 pandemic? Econ. Anal. Policy 2020, 68, 191–198. [Google Scholar] [CrossRef]
- Kitamura, Y.; Karkour, S.; Ichisugi, Y.; Itsubo, N. Evaluation of the economic, environmental, and social impacts of the COVID-19 pandemic on the Japanese tourism industry. Sustainability 2020, 12, 10302. [Google Scholar] [CrossRef]
- Yunus, A.P.; Masago, Y.; Hijioka, Y. COVID-19 and surface water quality: Improved lake water quality during the lockdown. Sci. Total Environ. 2020, 731, 139012. [Google Scholar] [CrossRef]
- Ito, N.; Maruyama, Y.; Wakamatsu, H. Consumer food demand in Japan before and after the beginning of COVID-19, AIDS analysis using home scan data. Front. Sustain. Cities 2022, 4, 920722. [Google Scholar] [CrossRef]
- Ministry of Internal Affairs and Communications. Survey of Household Economy; Ministry of Internal Affairs and Communications: Tokyo, Japan, 2020.
- Aruga, K.; Islam, M.M.; Jannat, A. The impacts of COVID-19 on seafood prices in Japan: A comparison between cheap and luxury products. PLoS ONE 2023, 18, e0291395. [Google Scholar] [CrossRef] [PubMed]
- Aruga, K. Effects of the COVID-19 pandemic on the Tokyo wholesale tuna market. J. Int. Food Agribus. Mark. 2022, 36, 447–463. [Google Scholar] [CrossRef]
- de la Iglesia, R.; García-González, Á.; Achón, M.; Varela-Moreiras, G.; Alonso Aperte, E. Fish, Seafood, and Fish Products Purchasing Habits in the Spanish Population during COVID-19 Lockdown. Int. J. Environ. Res. Public Health 2022, 19, 11624. [Google Scholar] [CrossRef]
- Pfeifer, D.; Rešetar, J.; Gajdoš Kljusurić, J.; Panjkota Krbavčić, I.; Vranešić Bender, D.; Rodríguez-Pérez, C.; Ruíz-López, M.D.; Šatalić, Z. Cooking at Home and Adherence to the Mediterranean Diet During the COVID-19 Confinement: The Experience From the Croatian COVIDiet Study. Front. Nutr. 2021, 8, 617721. [Google Scholar] [CrossRef]
- Silva, M.N.; Gregório, M.J.; Santos, R.; Marques, A.; Rodrigues, B.; Godinho, C.; Silva, C.S.; Mendes, R.; Graça, P.; Arriaga, M.; et al. Towards an In-Depth Understanding of Physical Activity and Eating Behaviours during COVID-19 Social Confinement: A Combined Approach from a Portuguese National Survey. Nutrients 2021, 13, 2685. [Google Scholar] [CrossRef]
- Hunter, L.; Gerritsen, S.; Egli, V. Changes in Eating Behaviours Due to Crises, Disasters and Pandemics: A Scoping Review. Nutr. Amp; Food Sci. 2022, 53, 358–390. [Google Scholar] [CrossRef]
- Aruga, K.; Wakamatsu, H. Investigating the consumption patterns of Japanese seafood during the COVID-19 pandemic. Commodities 2024, 3, 182–196. [Google Scholar] [CrossRef]
- Cohn-Schwartz, E.; Finlay, J.M.; Kobayashi, L.C. Perceptions of societal ageism and declines in subjective memory during the COVID-19 pandemic: Longitudinal evidence from US adults aged ≥55 years. J. Social. Issues 2022, 78, 924–938. [Google Scholar] [CrossRef]
- Feter, N.; Caputo, E.L.; Smith, E.C.; Doring, I.R.; Cassuriaga, J.; Leite, J.S.; Reichert, F.F.; da Silva, M.C.; Coombes, J.S.; Rombaldi, A.J. Association between physical activity and subjective memory decline triggered by the COVID-19 pandemic: Findings from the PAMPA cohort. Prev. Med. 2021, 145, 106415. [Google Scholar] [CrossRef]
- Takechi, H.; Tsuzuki, A.; Matsumoto, K.; Matsunaga, S.; Nishiyama, H.; Ogawa, M.; Kanada, Y. Relationship between subjective memory complaints and social and leisure activities in community-dwelling older people: Toyoake Integrated Care Study. Geriatr. Gerontol. Int. 2020, 20, 867–872. [Google Scholar] [CrossRef]
- McFadden, D. Conditional Logit Analysis of Qualitative Choice Behavior. In Frontiers in Econometrics; Zarembka, P., Ed.; Academic Press: New York, NY, USA, 1973; pp. 105–142. [Google Scholar]
- Hess, S.; Daly, A. Handbook of Choice Modelling, 2nd ed.; Edward Elgar Publishing: Cheltenham, UK, 2024. [Google Scholar]
- Ministry of Health, Labour and Welfare. Summary of the National Survey of Living Standard; Ministry of Health, Labour and Welfare: Tokyo, Japan, 2023.
- Yang, S.; Qian, W. Effect of Government Subsidies on Supply Chain Decision-Making and Coordination in the Context of COVID-19. RAIRO-Oper. Res. 2021, 55, 1885–1907. [Google Scholar] [CrossRef]
- Yilmazkuday, H. Stay-at-Home Works to Fight against COVID-19, International Evidence from Google Mobility Data. J. Hum. Behav. Soc. Environ. 2021, 31, 210–220. [Google Scholar] [CrossRef]
- Nyiawung, R.A.; Ehrlick, T.; Bennett, N.J.; Brunet, N.D.; Matos, F.; Pita, C.; Stoll, J.S.; Loring, P.A. Fisheries and the COVID-19 Pandemic: A Global Scoping Review of the Early Pressures, Impacts, and Responses in Least Developed, Emerging, and Developed Countries. Reg. Stud. Mar. Sci. 2024, 74, 103501. [Google Scholar] [CrossRef]
- Shoji, M.; Cato, S.; Iida, T.; Ishida, K.; Ito, A.; McElwain, K.M. Variations in early-stage responses to pandemics: Survey evidence from the COVID-19 pandemic in Japan. Econ. Dis. Clim. Chang. 2022, 6, 235–258. [Google Scholar] [CrossRef]
- Hobbs Jill, E. Food Supply Chain Resilience and the COVID-19 Pandemic: What Have We Learned? Can. J. Agric. Econ./Rev. Can. D’agroeconomie 2021, 69, 189–196. [Google Scholar] [CrossRef]
- Ministry of Internal Affairs and Communications. Economic Census for Business Frame: Number of Establishments and Employees by Industry (Detailed Classification), Type of Management Organization (4 Categories), and Gender, Nationwide and by Prefecture; Ministry of Internal Affairs and Communications: Tokyo, Japan, 2019.
| Disclaimer/Publisher’s Note: The statements, opinions and data contained in all publications are solely those of the individual author(s) and contributor(s) and not of MDPI and/or the editor(s). MDPI and/or the editor(s) disclaim responsibility for any injury to people or property resulting from any ideas, methods, instructions or products referred to in the content. |
© 2025 by the authors. Licensee MDPI, Basel, Switzerland. This article is an open access article distributed under the terms and conditions of the Creative Commons Attribution (CC BY) license (https://creativecommons.org/licenses/by/4.0/).


