Commodity Spillovers and Risk Hedging: The Evolving Role of Gold and Oil in the Indian Stock Market
Abstract
1. Introduction
2. Literature Review
3. Methodology
4. Analysis
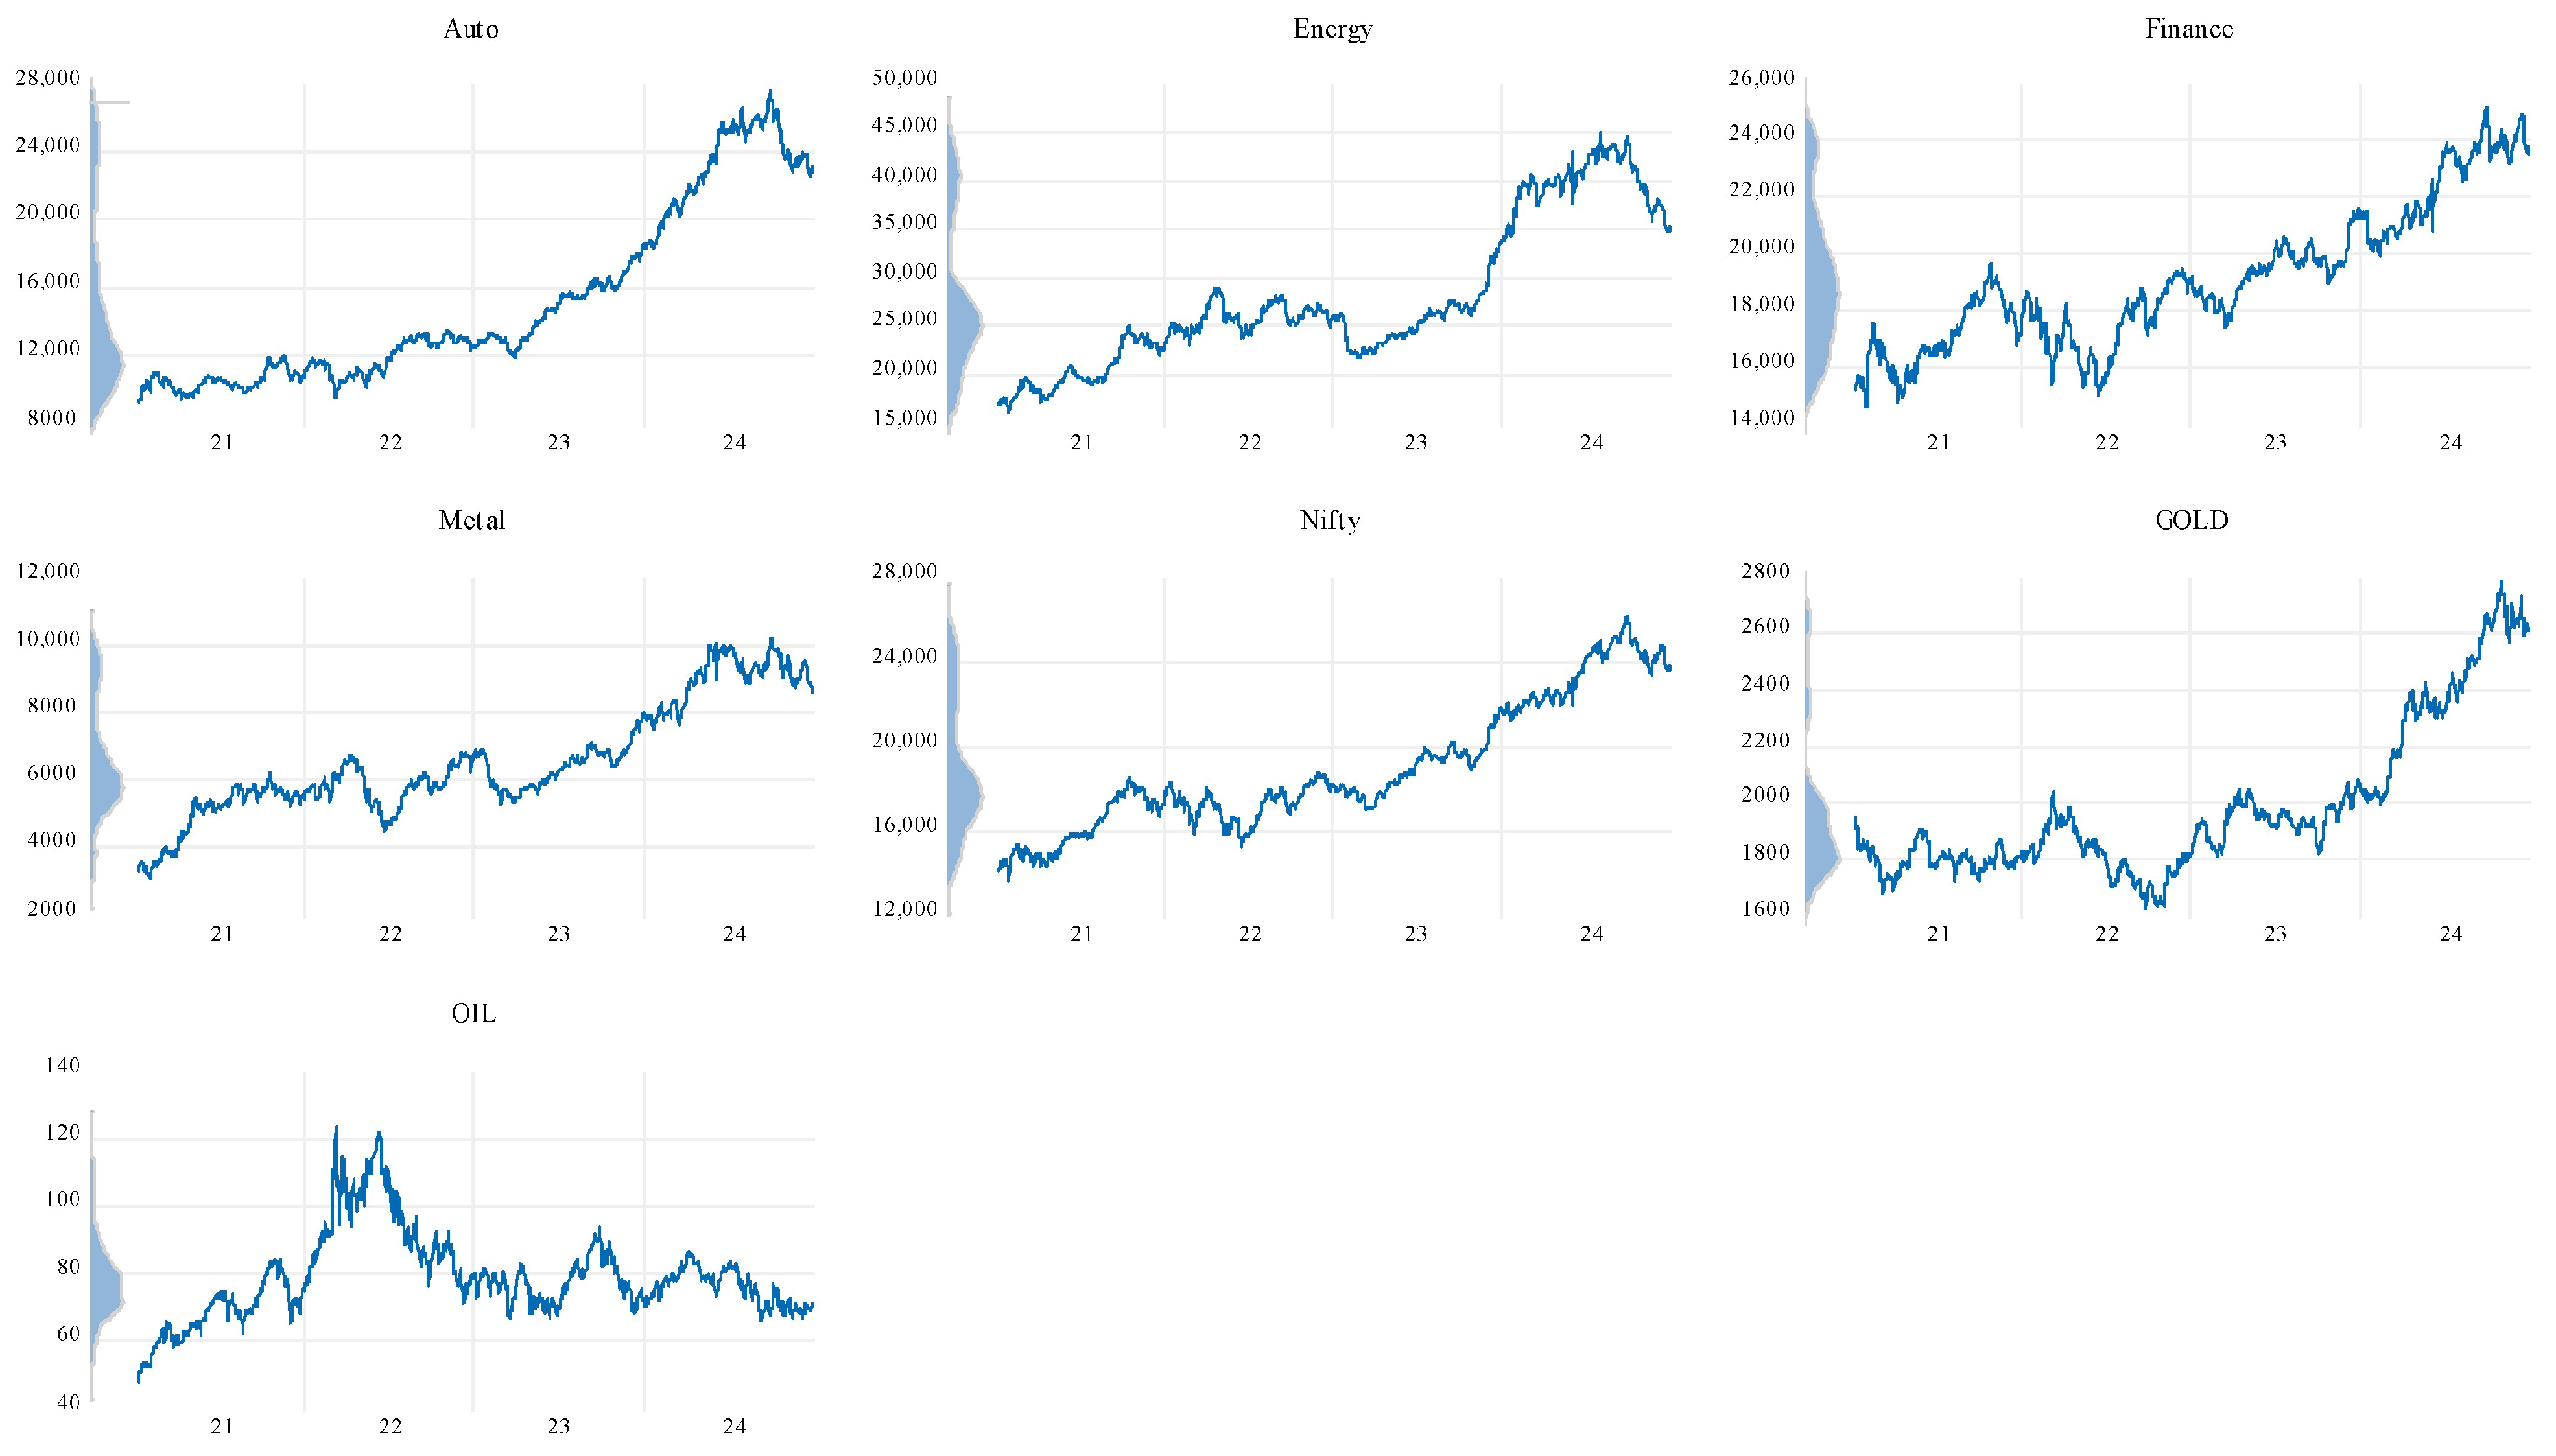
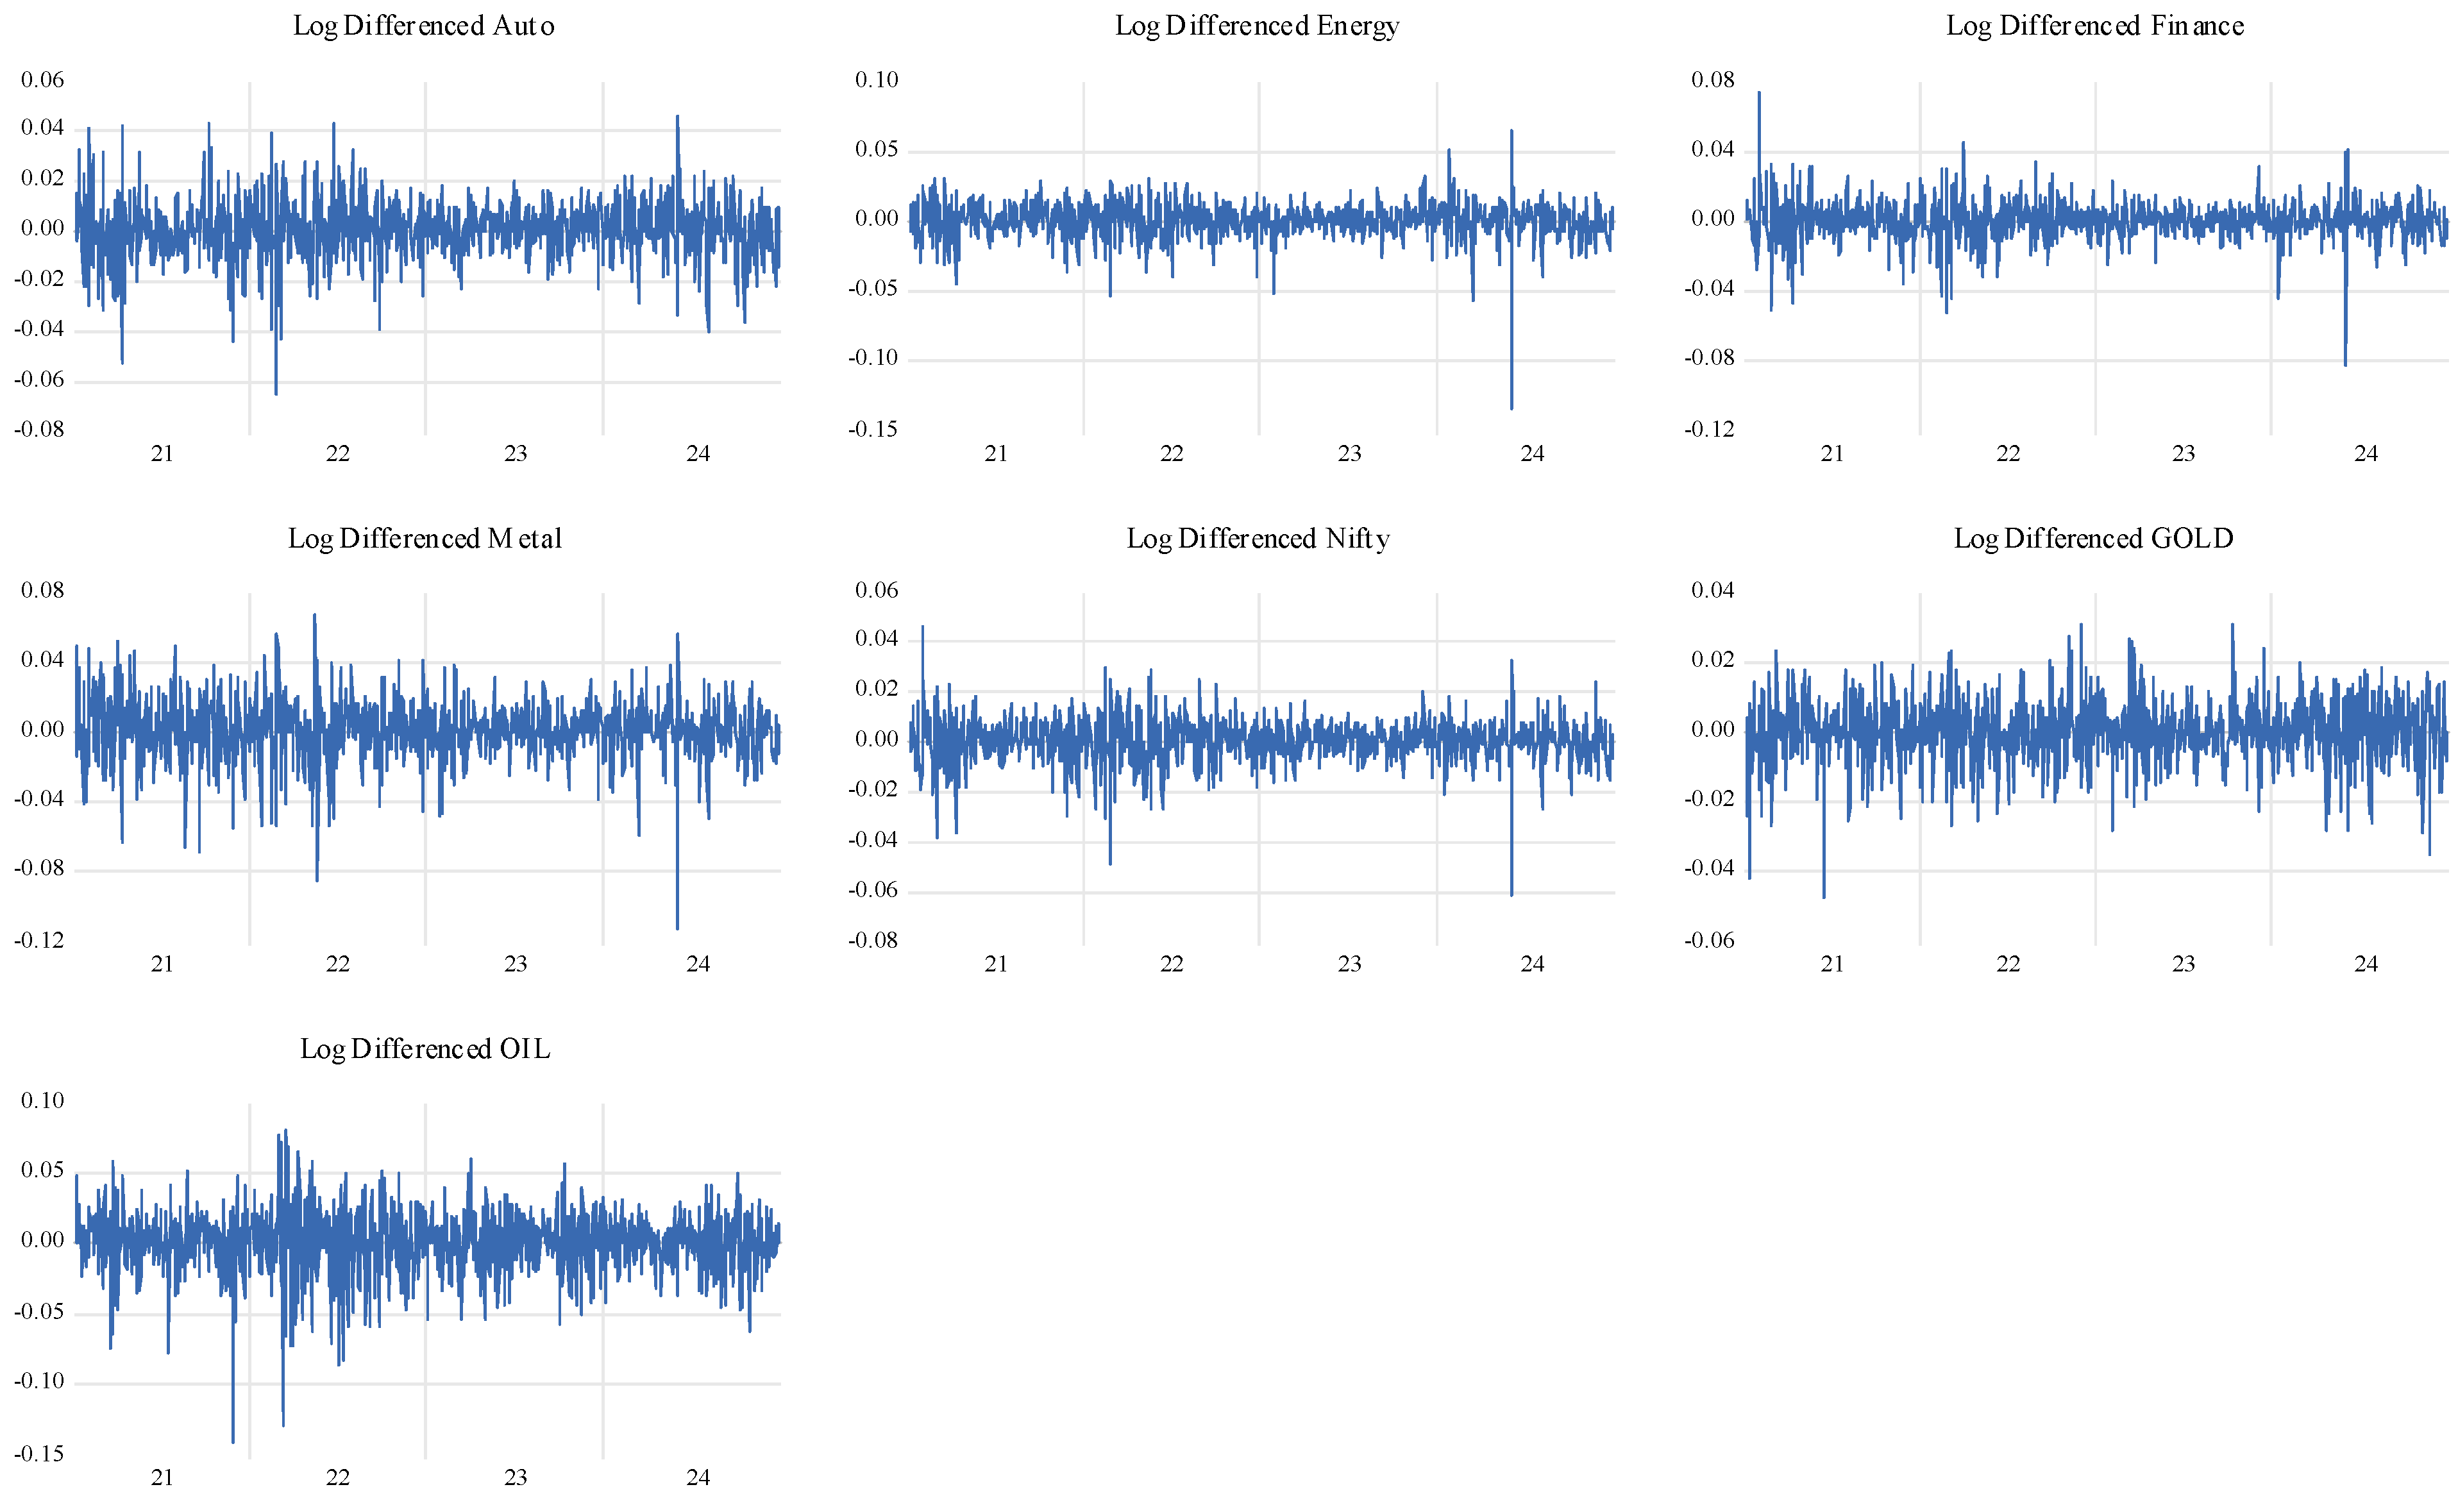
4.1. Descriptive Statistics
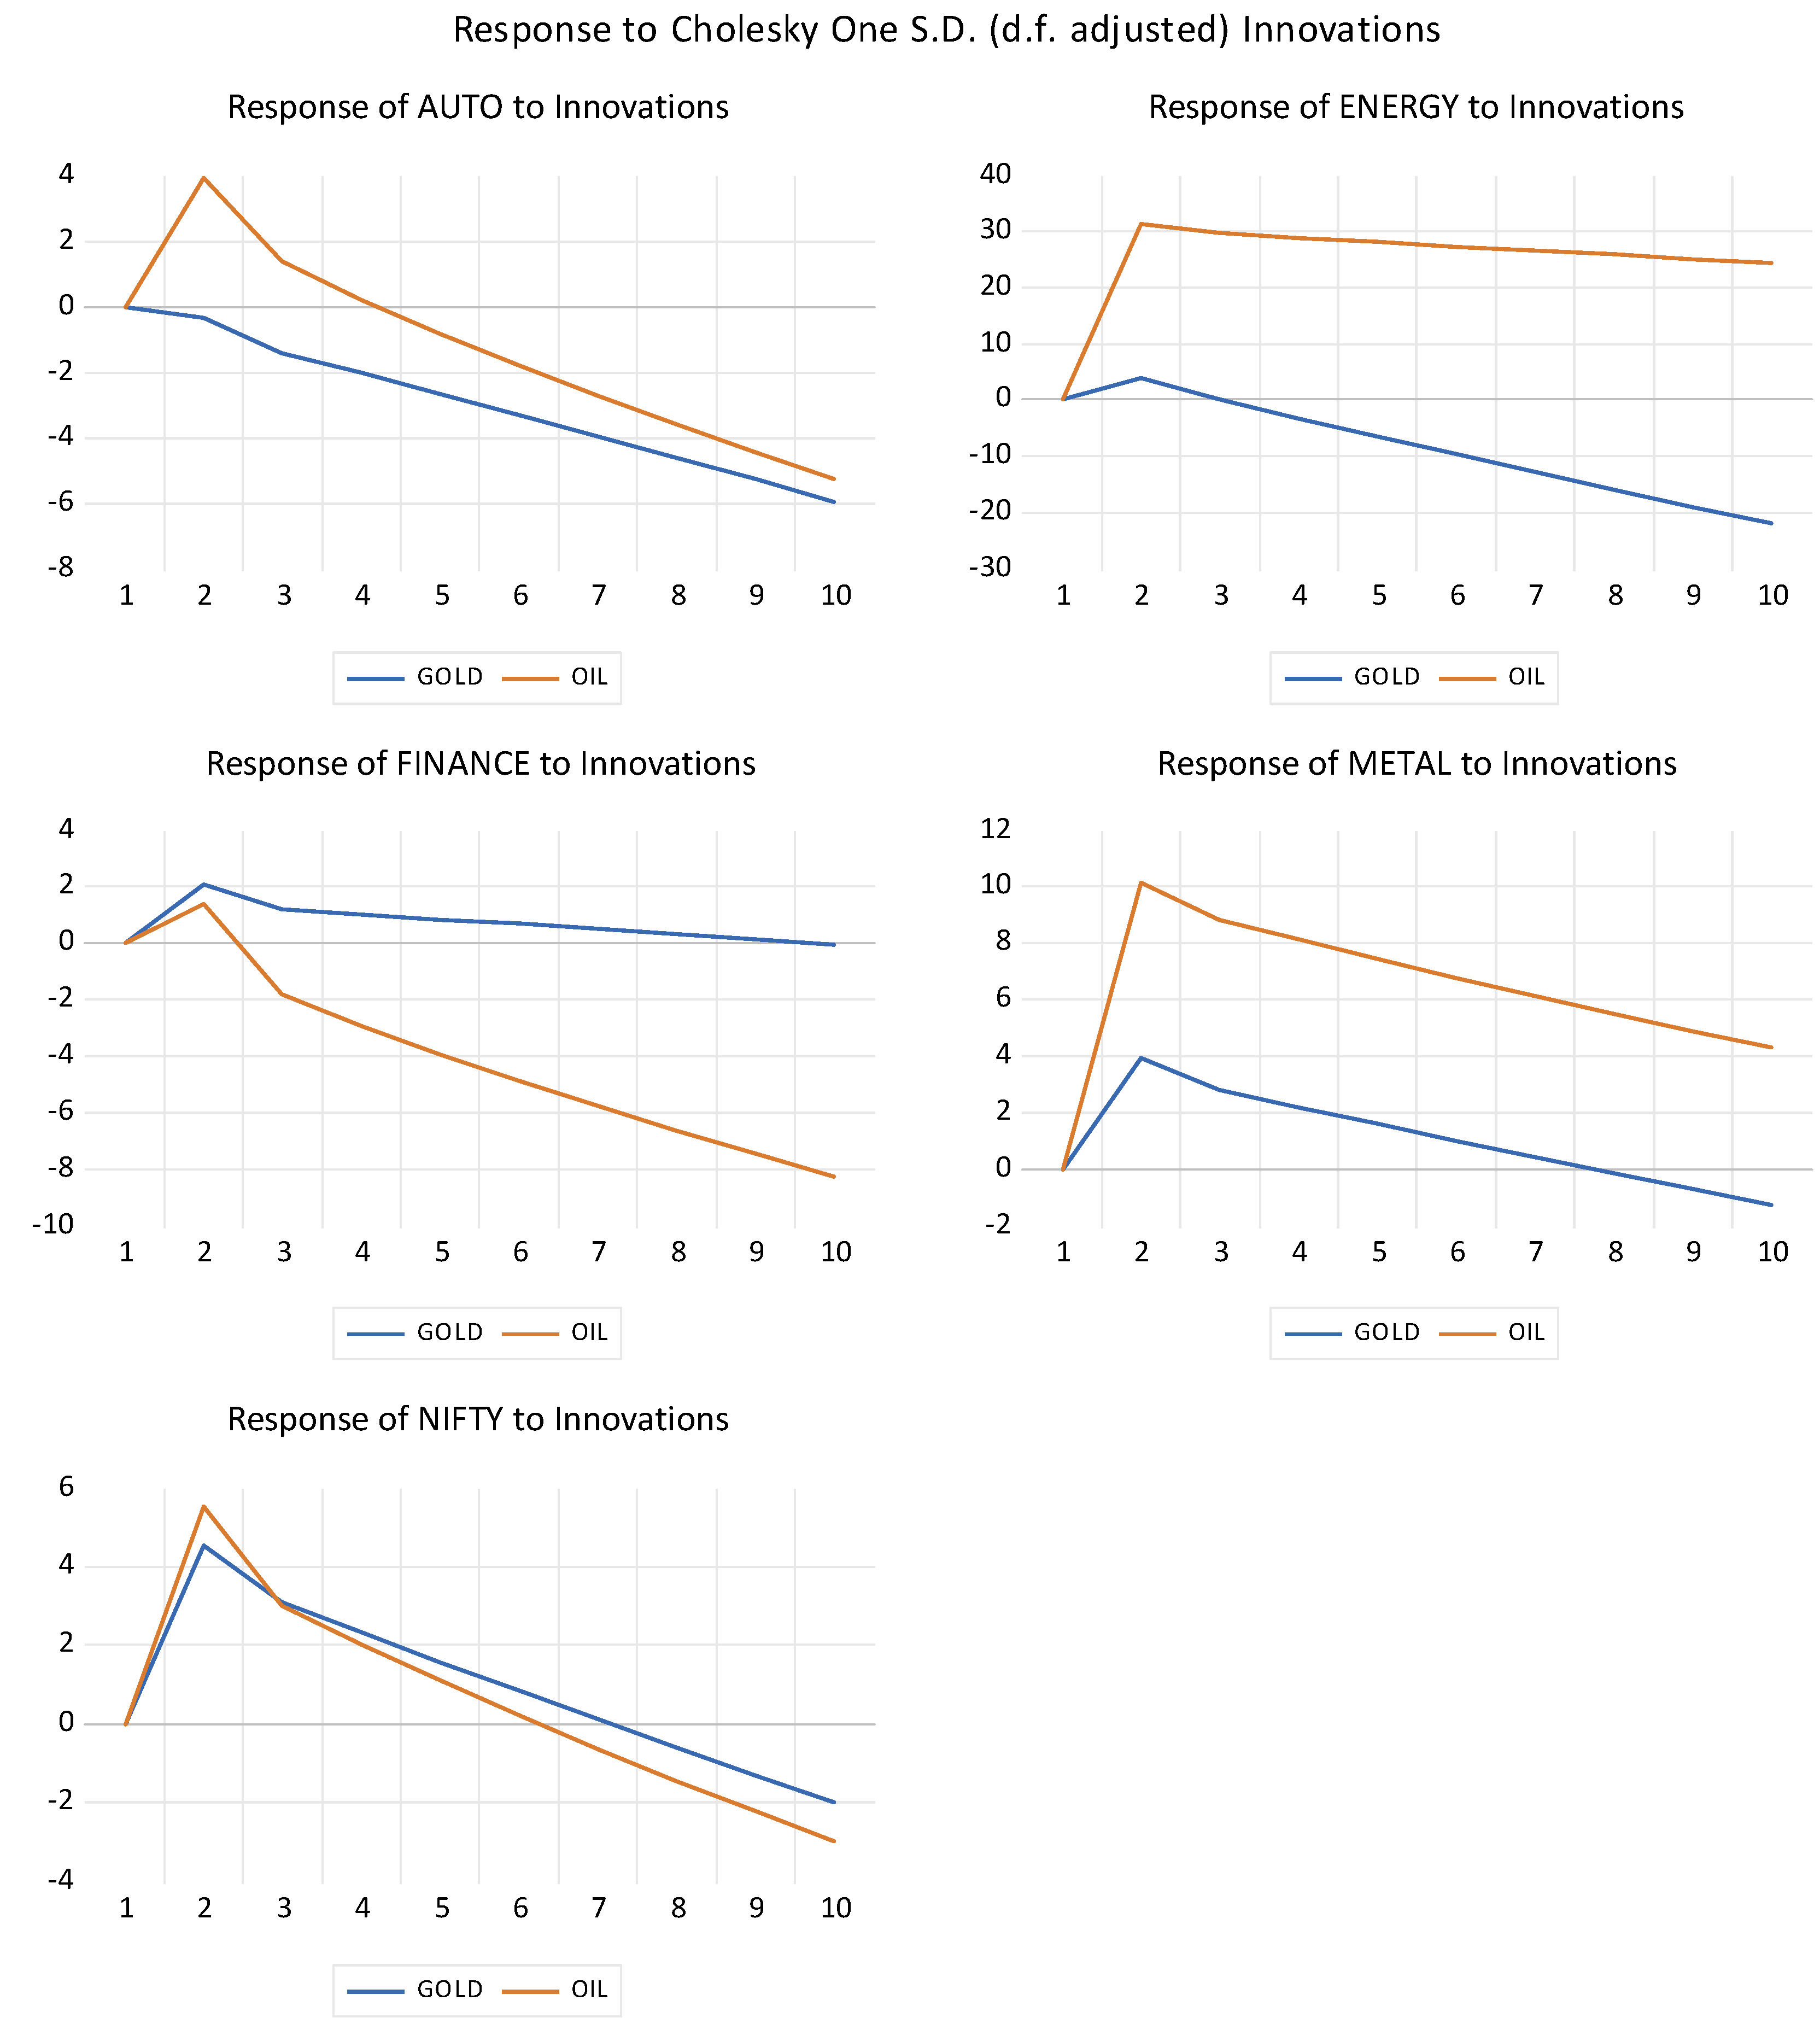
4.2. The VAR Model
4.3. The Diebold–Yilmaz Spillover Index
4.4. ADCC-GARCH Model
4.5. Dynamic Hedge Ratio and Hedging Effectiveness
5. Conclusions
6. Limitations and Scope
Author Contributions
Funding
Institutional Review Board Statement
Informed Consent Statement
Data Availability Statement
Conflicts of Interest
References
- Hamilton, J.D.; Wu, J.C. Effects of Index-Fund Investing on Commodity Futures Prices. Int. Econ. Rev. 2015, 56, 187–205. [Google Scholar] [CrossRef]
- Just, M.; Luczak, A. Assessment of Conditional Dependence Structures in Commodity Futures Markets Using Copula-GARCH Models and Fuzzy Clustering Methods. Sustainability 2020, 12, 2571. [Google Scholar] [CrossRef]
- Tang, K.; Xiong, W. Index Investment and the Financialization of Commodities. Financ. Anal. J. 2012, 68, 54–74. [Google Scholar] [CrossRef]
- Irwin, S.H.; Sanders, D.R. Index Funds, Financialization, and Commodity Futures Markets. Appl. Econ. Perspect. Policy 2011, 33, 1–31. [Google Scholar] [CrossRef]
- Irwin, S.H.; Sanders, D.R. Financialization and Structural Change in Commodity Futures Markets. J. Agric. Appl. Econ. 2012, 44, 371–396. [Google Scholar] [CrossRef]
- Ederer, S.; Heumesser, C.; Staritz, C. Financialization and Commodity Prices—An Empirical Analysis for Coffee, Cotton, Wheat and Oil. Int. Rev. Appl. Econ. 2016, 30, 462–487. [Google Scholar] [CrossRef]
- Chordia, T.; Subrahmanyam, A.; Anshuman, V.R. Trading Activity and Expected Stock Returns. J. Financ. Econ. 2001, 59, 3–32. [Google Scholar] [CrossRef]
- Datar, V.T.; Naik, N.Y.; Radcliffe, R. Liquidity and Stock Returns: An Alternative Test. J. Financ. Mark. 1998, 1, 203–219. [Google Scholar] [CrossRef]
- Liu, G.; Guo, X. Forecasting Stock Market Volatility Using Commodity Futures Volatility Information. Resour. Policy 2022, 75, 102481. [Google Scholar] [CrossRef]
- Rzayev, K.; Ibikunle, G. A State-Space Modeling of the Information Content of Trading Volume. J. Financ. Mark. 2019, 46, 100507. [Google Scholar] [CrossRef]
- Diebold, F.X.; Yilmaz, K. Measuring Financial Asset Return and Volatility Spillovers, with Application to Global Equity Markets. Econ. J. 2009, 119, 158–171. [Google Scholar] [CrossRef]
- Diebold, F.X.; Yilmaz, K. On the Past, Present, and Future of the Diebold–Yilmaz Approach to Dynamic Network Connectedness. J. Econom. 2023, 234, 115–120. [Google Scholar] [CrossRef]
- Basher, S.A.; Sadorsky, P. Hedging Emerging Market Stock Prices with Oil, Gold, VIX, and Bonds: A Comparison between DCC, ADCC and GO-GARCH. Energy Econ. 2016, 54, 235–247. [Google Scholar] [CrossRef]
- Yadav, N.; Singh, A.B.; Tandon, P. Volatility Spillover Effects between Indian Stock Market and Global Stock Markets: A DCC-GARCH Model. FIIB Bus. Rev. 2023. [Google Scholar] [CrossRef]
- Maharana, N.; Panigrahi, A.K.; Chaudhury, S.K.; Uprety, M.; Barik, P.; Kulkarni, P. Economic Resilience in Post-Pandemic India: Analysing Stock Volatility and Global Links Using VAR-DCC-GARCH and Wavelet Approach. J. Risk Financ. Manag. 2025, 18, 18. [Google Scholar]
- Singhal, S.; Ghosh, S. Returns and Volatility Linkages between International Crude Oil Price, Metal and Other Stock Indices in India: Evidence from VAR-DCC-GARCH Models. Resour. Policy 2016, 50, 276–288. [Google Scholar] [CrossRef]
- Ozkan, O.; Abosedra, S.; Sharif, A.; Alola, A.A. Dynamic Volatility among Fossil Energy, Clean Energy and Major Assets: Evidence from the Novel DCC-GARCH. Econ. Chang. Restruct. 2024, 57, 98. [Google Scholar] [CrossRef]
- Armah, M.; Amewu, G.; Bossman, A. Time-Frequency Analysis of Financial Stress and Global Commodities Prices: Insights from Wavelet-Based Approaches. Cogent Econ. Financ. 2022, 10, 2114161. [Google Scholar] [CrossRef]
- Torrence, C.; Compo, G.P. A Practical Guide to Wavelet Analysis. Bull. Am. Meteorol. Soc. 1998, 79, 61–78. [Google Scholar] [CrossRef]
- Grinsted, A.; Moore, J.C.; Jevrejeva, S. Application of the Cross Wavelet Transform and Wavelet Coherence to Geophysical Time Series. Nonlinear Process. Geophys. 2004, 11, 561–566. [Google Scholar] [CrossRef]
- Wang, J. Application of Wavelet Transform Image Processing Technology in Financial Stock Analysis. J. Intell. Fuzzy Syst. 2021, 40, 2017–2027. [Google Scholar] [CrossRef]
- Khalfaoui, R.; Boutahar, M.; Boubaker, H. Analyzing Volatility Spillovers and Hedging between Oil and Stock Markets: Evidence from Wavelet Analysis. Energy Econ. 2015, 49, 540–549. [Google Scholar] [CrossRef]
- Ersin, Ö.Ö.; Bildirici, M. Financial Volatility Modeling with the GARCH-MIDAS-LSTM Approach: The Effects of Economic Expectations, Geopolitical Risks and Industrial Production during COVID-19. Mathematics 2023, 11, 1785. [Google Scholar] [CrossRef]
- Aliyev, F.; Ajayi, R.; Gasim, N. Modelling Asymmetric Market Volatility with Univariate GARCH Models: Evidence from Nasdaq-100. J. Econ. Asymmetries 2020, 22, e00167. [Google Scholar] [CrossRef]
- Shahzad, S.J.H.; Naeem, M.A.; Peng, Z.; Bouri, E. Asymmetric Volatility Spillover among Chinese Sectors during COVID-19. Int. Rev. Financ. Anal. 2021, 75, 101754. [Google Scholar] [CrossRef]
- Chkili, W. Dynamic Correlations and Hedging Effectiveness between Gold and Stock Markets: Evidence for BRICS Countries. Res. Int. Bus. Financ. 2016, 38, 22–34. [Google Scholar] [CrossRef]
- Chkili, W.; Aloui, C.; Nguyen, D.K. Instabilities in the Relationships and Hedging Strategies between Crude Oil and US Stock Markets: Do Long Memory and Asymmetry Matter? J. Int. Financ. Mark. Inst. Money 2014, 33, 354–366. [Google Scholar] [CrossRef]
- Sadorsky, P. Modeling Volatility and Conditional Correlations between Socially Responsible Investments, Gold and Oil. Econ. Model. 2014, 38, 609–618. [Google Scholar] [CrossRef]
- Arouri, M.E.H.; Jouini, J.; Nguyen, D.K. On the Impacts of Oil Price Fluctuations on European Equity Markets: Volatility Spillover and Hedging Effectiveness. Energy Econ. 2012, 34, 611–617. [Google Scholar] [CrossRef]
- Coudert, V.; Raymond-Feingold, H. Gold and Financial Assets: Are There Any Safe Havens in Bear Markets? Econ. Bull. 2011, 31, 1613–1622. [Google Scholar]
- Baur, D.G.; Lucey, B.M. Is Gold a Hedge or a Safe Haven? An Analysis of Stocks, Bonds and Gold. Financ. Rev. 2010, 45, 217–229. [Google Scholar] [CrossRef]
- Abdelhedi, M.; Boujelbène-Abbes, M. Transmission of Shocks between Chinese Financial Market and Oil Market. Int. J. Emerg. Mark. 2020, 15, 262–286. [Google Scholar] [CrossRef]
- Vardar, G.; Coşkun, Y.; Yelkenci, T. Shock Transmission and Volatility Spillover in Stock and Commodity Markets: Evidence from Advanced and Emerging Markets. Eurasian Econ. Rev. 2018, 8, 231–288. [Google Scholar] [CrossRef]
- Creti, A.; Joëts, M.; Mignon, V. On the Links between Stock and Commodity Markets’ Volatility. Energy Econ. 2013, 37, 16–28. [Google Scholar] [CrossRef]
- Marfatia, H.A.; Ji, Q.; Luo, J. Forecasting the Volatility of Agricultural Commodity Futures: The Role of Co-Volatility and Oil Volatility. J. Forecast. 2022, 41, 383–404. [Google Scholar] [CrossRef]
- Quintino, D.; Ogino, C.; Haq, I.U.; Ferreira, P.; Oliveira, M. An Analysis of Dynamic Correlations among Oil, Natural Gas and Ethanol Markets: New Evidence from the Pre- and Post-COVID-19 Crisis. Energies 2023, 16, 2349. [Google Scholar] [CrossRef]
- Fang, Y.; Shao, Z. The Russia-Ukraine Conflict and Volatility Risk of Commodity Markets. Financ. Res. Lett. 2022, 50, 103264. [Google Scholar] [CrossRef]
- Bouri, E.; Lucey, B.; Saeed, T.; Vo, X.V. The Realized Volatility of Commodity Futures: Interconnectedness and Determinants. Int. Rev. Econ. Financ. 2021, 73, 139–151. [Google Scholar] [CrossRef]
- Ding, S.; Cui, T.; Zheng, D.; Du, M. The Effects of Commodity Financialization on Commodity Market Volatility. Resour. Policy 2021, 73, 102220. [Google Scholar] [CrossRef]
- Salisu, A.A.; Vo, X.V.; Lawal, A. Hedging Oil Price Risk with Gold during COVID-19 Pandemic. Resour. Policy 2021, 70, 101897. [Google Scholar] [CrossRef]
- Akhtaruzzaman, M.; Boubaker, S.; Lucey, B.M.; Sensoy, A. Is Gold a Hedge or a Safe-Haven Asset in the COVID–19 Crisis? Econ. Model. 2021, 102, 105588. [Google Scholar] [CrossRef]
- Tarchella, S.; Khalfaoui, R.; Hammoudeh, S. The Safe Haven, Hedging, and Diversification Properties of Oil, Gold, and Cryptocurrency for the G7 Equity Markets: Evidence from the Pre- and Post-COVID-19 Periods. Res. Int. Bus. Financ. 2024, 67, 102125. [Google Scholar] [CrossRef]
- Ntare, H.B.; Mwamba, J.W.M.; Adekambi, F. Dynamic Correlation and Hedging Ability of Precious Metals in Pre- and Post-COVID Periods. Cogent Econ. Financ. 2024, 12, 2382375. [Google Scholar] [CrossRef]
- Arfaoui, N.; Yousaf, I.; Jareño, F. Return and Volatility Connectedness between Gold and Energy Markets: Evidence from the Pre- and Post-COVID Vaccination Phases. Econ. Anal. Policy 2023, 77, 617–634. [Google Scholar] [CrossRef]
- Penone, C.; Giampietri, E.; Trestini, S. Hedging Effectiveness of Commodity Futures Contracts to Minimize Price Risk: Empirical Evidence from the Italian Field Crop Sector. Risks 2021, 9, 213. [Google Scholar] [CrossRef]
- Huang, H.; Xiong, T. A Good Hedge or Safe Haven? The Hedging Ability of China’s Commodity Futures Market under Extreme Market Conditions. J. Futures Mark. 2023, 43, 968–1035. [Google Scholar] [CrossRef]
- Ciner, C.; Gurdgiev, C.; Lucey, B.M. Hedges and Safe Havens: An Examination of Stocks, Bonds, Gold, Oil and Exchange Rates. Int. Rev. Financ. Anal. 2013, 29, 202–211. [Google Scholar] [CrossRef]
- Maharana, N.; Panigrahi, A.K.; Chaudhury, S.K. Volatility Persistence and Spillover Effects of Indian Market in the Global Economy: A Pre- and Post-Pandemic Analysis Using VAR-BEKK-GARCH Model. J. Risk Financ. Manag. 2024, 17, 294. [Google Scholar] [CrossRef]
- Bouri, E.; Jain, A.; Biswal, P.C.; Roubaud, D. Cointegration and Nonlinear Causality amongst Gold, Oil, and the Indian Stock Market: Evidence from Implied Volatility Indices. Resour. Policy 2017, 52, 201–206. [Google Scholar] [CrossRef]
- Jose, A.; Jose, N. Exploring the Effectiveness of Hedging in the Indian Commodity Market: A Comparative Analysis of Constant and Dynamic Hedge Ratios Across Agricultural and Non-Agricultural Commodities. Int. J. Multidiscip. Res. 2024, 6, 1–15. [Google Scholar] [CrossRef]
- Gupta, S.; Choudhary, H.; Agarwal, D.R. Hedging Efficiency of Indian Commodity Futures. Paradigm 2017, 21, 1–20. [Google Scholar] [CrossRef]
- Israel, T.O.M.; Kingdom, N.; Yvonne, D.A.; Ike, W.A. Application of Bayesian Vector Autoregressive Models in the Analysis of Quasi Money and Money Supply: A Case Study of Nigeria. Asian J. Probab. Stat. 2023, 25, 108–117. [Google Scholar] [CrossRef]
- Ribeiro Ramos, F.F. Forecasts of Market Shares from VAR and BVAR Models: A Comparison of Their Accuracy. Int. J. Forecast. 2003, 19, 95–110. [Google Scholar] [CrossRef]
- Black, F. The Pricing of Commodity Contracts. J. Financ. Econ. 1976, 3, 167–179. [Google Scholar] [CrossRef]
- Engle, R.F.; Ng, V.K. Measuring and Testing the Impact of News on Volatility. J. Financ. 1993, 48, 1749–1778. [Google Scholar] [CrossRef]
- Baur, D.G.; McDermott, T.K. Is Gold a Safe Haven? International Evidence. J. Bank. Financ. 2010, 34, 1886–1898. [Google Scholar]
- Pandey, V. Does Commodity Exposure Benefit Traditional Portfolios? Evidence from India. Invest. Manag. Financ. Innov. 2023, 20, 36–49. [Google Scholar] [CrossRef]
- Filis, G.; Degiannakis, S.; Floros, C. Dynamic Correlation between Stock Market and Oil Prices: The Case of Oil-Importing and Oil-Exporting Countries. Int. Rev. Financ. Anal. 2011, 20, 152–164. [Google Scholar] [CrossRef]


| Auto | Energy | Finance | Metal | Nifty | Gold | Oil | |
|---|---|---|---|---|---|---|---|
| Mean | 13.090 | 17.579 | 8.039 | 5.204 | 9.292 | 0.638 | 0.023 |
| Median | 6.600 | 17.325 | 2.625 | 6.000 | 5.275 | 0.550 | 0.090 |
| Maximum | 1090.450 | 2726.400 | 1109.150 | 516.450 | 735.850 | 58.100 | 8.010 |
| Minimum | −1007.950 | −5357.800 | −1776.900 | −1068.400 | −1379.400 | −93.100 | −15.000 |
| Std. Dev. | 182.715 | 387.833 | 207.506 | 111.602 | 164.767 | 18.338 | 1.969 |
| Skewness | −0.392 | −2.614 | −0.646 | −1.133 | −0.710 | −0.602 | −0.814 |
| Kurtosis | 7.391 | 41.939 | 10.570 | 12.652 | 9.603 | 5.315 | 8.942 |
| Jarque–Bera | 858.918 * | 66,629.855 * | 2546.040 * | 4243.143 * | 1968.809 * | 293.884 * | 1638.216 * |
| ADF (Level) | −1.903 | −1.330 | −3.128 | −2.474 | −2.298 | −1.370 | −2.359 |
| ADF(1-Diff.) | −7.416 * | −35.511 * | −11.029 * | −33.503 * | −32.672 * | −8.743 * | −10.380 * |
| KPSS (Level) | 0.822 * | 0.493 * | 0.514 * | 0.486 * | 0.654 * | 0.780 * | 0.505 * |
| KPSS (1-Diff.) | 0.108 | 0.128 | 0.024 | 0.065 | 0.052 | 0.027 | 0.060 |
| ARCH-LM (Leg-5) | 8.450 * | 3.784 * | 2.221 ** | 3.762 * | 2.661 ** | 2.676 ** | 23.037 * |
| Auto | Energy | Finance | Metal | Nifty | Oil | Gold | ||
|---|---|---|---|---|---|---|---|---|
| Auto (−1) | Coeff. | 1.0445 | 0.0670 | 0.0437 | 0.0131 | 0.0366 | 0.0000 | 0.0013 |
| S.E. | 0.0306 | 0.0638 | 0.0342 | 0.0183 | 0.0272 | 0.0003 | 0.0031 | |
| t | 34.1649 * | 1.0504 | 1.2760 | 0.7155 | 1.3483 | 0.0352 | 0.4212 | |
| Auto (−2) | Coeff. | −0.0419 | −0.0499 | −0.0261 | −0.0075 | −0.0228 | −0.0001 | −0.0008 |
| S.E. | 0.0304 | 0.0635 | 0.0341 | 0.0183 | 0.0270 | 0.0003 | 0.0031 | |
| t | −1.3751 | −0.7851 | −0.7661 | −0.4119 | −0.8435 | −0.4415 | −0.2476 | |
| Energy (−1) | Coeff. | −0.0486 | 0.8658 | −0.0632 | −0.0326 | −0.0581 | −0.0002 | −0.0004 |
| S.E. | 0.0152 | 0.0320 | 0.0171 | 0.0091 | 0.0135 | 0.0002 | 0.0015 | |
| t | −3.2049 * | 27.0930 * | −3.7031 * | −3.5632 * | −4.2924 * | −0.9456 | −0.2366 | |
| Energy (−2) | Coeff. | 0.0478 | 0.1113 | 0.0490 | 0.0313 | 0.0494 | 0.0002 | −0.0001 |
| S.E. | 0.0149 | 0.0314 | 0.0168 | 0.0090 | 0.0133 | 0.0002 | 0.0015 | |
| t | 3.2030 * | 3.5426 * | 2.9201 * | 3.4852 * | 3.7148 * | 1.2066 | −0.0405 | |
| Finance (−1) | Coeff. | −0.0017 | −0.0327 | 0.9727 | 0.0033 | −0.0028 | 0.0000 | −0.0019 |
| S.E. | 0.0309 | 0.0649 | 0.0350 | 0.0186 | 0.0276 | 0.0003 | 0.0031 | |
| t | −0.0540 | −0.5043 | 27.8257 * | 0.1754 | −0.1015 | −0.0971 | −0.6217 | |
| Finance (−2) | Coeff. | −0.0302 | −0.0521 | −0.0469 | −0.0117 | −0.0352 | −0.0002 | −0.0010 |
| S.E. | 0.0289 | 0.0605 | 0.0326 | 0.0174 | 0.0258 | 0.0003 | 0.0029 | |
| t | −1.0468 | −0.8605 | −1.4355 | −0.6723 | −1.3640 | −0.6358 | −0.3595 | |
| Metal (−1) | Coeff. | −0.0454 | 0.1619 | −0.0862 | 0.9906 | −0.0380 | 0.0004 | 0.0035 |
| S.E. | 0.0513 | 0.1076 | 0.0577 | 0.0310 | 0.0458 | 0.0006 | 0.0052 | |
| t | −0.8848 | 1.5045 | −1.4926 | 31.9130 * | −0.8300 | 0.6465 | 0.6741 | |
| Metal (−2) | Coeff. | 0.0388 | −0.1724 | 0.0928 | −0.0084 | 0.0453 | −0.0004 | −0.0022 |
| S.E. | 0.0506 | 0.1061 | 0.0569 | 0.0306 | 0.0451 | 0.0005 | 0.0051 | |
| t | 0.7674 | −1.6247 | 1.6305 | −0.2739 | 1.0038 | −0.7200 | −0.4371 | |
| Nifty (−1) | Coeff. | 0.0477 | 0.0963 | 0.0821 | 0.0058 | 1.0460 | 0.0001 | 0.0006 |
| S.E. | 0.0431 | 0.0903 | 0.0485 | 0.0259 | 0.0386 | 0.0005 | 0.0043 | |
| t | 1.1083 | 1.0669 | 1.6940 *** | 0.2248 | 27.0910 * | 0.2704 | 0.1429 | |
| Nifty (−2) | Coeff. | −0.0184 | 0.0160 | −0.0218 | 0.0057 | −0.0197 | 0.0002 | 0.0029 |
| S.E. | 0.0402 | 0.0842 | 0.0452 | 0.0242 | 0.0361 | 0.0004 | 0.0041 | |
| t | −0.4587 | 0.1896 | −0.4823 | 0.2364 | −0.5451 | 0.4273 | 0.7158 | |
| Oil (−1) | Coeff. | 1.9792 | 15.9709 | 0.7069 | 5.1705 | 2.7990 | 0.9967 | 0.1123 |
| S.E. | 2.3953 | 5.0213 | 2.6947 | 1.4426 | 2.1363 | 0.0261 | 0.2419 | |
| t | 0.8263 | 3.1806 * | 0.2623 | 3.5841 * | 1.3102 | 38.2211 * | 0.4644 | |
| Oil (−2) | Coeff. | −2.4826 | −15.7458 | −1.1922 | −5.3217 | −3.1600 | −0.0229 | −0.1893 |
| S.E. | 2.3731 | 4.9747 | 2.6697 | 1.4292 | 2.1164 | 0.0258 | 0.2397 | |
| t | −1.0461 | −3.1652 * | −0.4466 | −3.7235 * | −1.4931 | −0.8867 | −0.7900 | |
| Gold (−1) | Coeff. | −0.0194 | 0.2198 | 0.1155 | 0.2147 | 0.2542 | −0.0011 | 0.9430 |
| S.E. | 0.2570 | 0.5387 | 0.2891 | 0.1548 | 0.2292 | 0.0028 | 0.0260 | |
| t | −0.0757 | 0.4079 | 0.3996 | 1.3874 | 1.1092 | −0.4116 | 36.2211 * | |
| Gold (−2) | Coeff. | −0.0275 | −0.4329 | −0.1400 | −0.2518 | −0.3064 | 0.0011 | 0.0397 |
| S.E. | 0.2548 | 0.5341 | 0.2866 | 0.1534 | 0.2272 | 0.0028 | 0.0258 | |
| t | −0.1078 | −0.8105 | −0.4885 | −1.6407 *** | −1.3483 | 0.4053 | 1.5376 | |
| C | Coeff. | 227.4086 | 363.8958 | 458.5957 | 99.3629 | 352.0916 | 1.8006 | 26.8175 |
| S.E. | 127.8102 | 267.9272 | 143.7889 | 76.9754 | 113.9854 | 1.3869 | 12.9067 | |
| t | 1.7793 | 1.3582 | 3.1894 * | 1.2908 | 3.0889 * | 1.2982 | 2.0778 ** |
| Indices | Parameters | Estimate | Std. Error | t-Value | Sig. |
|---|---|---|---|---|---|
| Auto | μ | 0.0010 | 0.0004 | 2.3907 | 0.017 |
| AR1 | 0.3146 | 0.3548 | 0.8867 | 0.375 | |
| MA1 | −0.2511 | 0.3460 | −0.7255 | 0.468 | |
| ω | 0.0000 | 0.0000 | 0.1175 | 0.906 | |
| α1 | 0.0657 | 0.1979 | 0.3319 | 0.740 | |
| β1 | 0.9187 | 0.2338 | 3.9301 | 0.000 | |
| Energy | μ | 0.0010 | 0.0005 | 2.0334 | 0.042 |
| AR1 | 0.9042 | 0.0952 | 9.4941 | 0.000 | |
| MA1 | −0.8738 | 0.1105 | −7.9074 | 0.000 | |
| ω | 0.0000 | 0.0000 | 2.6261 | 0.009 | |
| α1 | 0.2222 | 0.0666 | 3.3359 | 0.001 | |
| β1 | 0.4771 | 0.1469 | 3.2486 | 0.001 | |
| Finance | μ | 0.0006 | 0.0003 | 1.7607 | 0.078 |
| AR1 | −0.1356 | 0.1542 | −0.8792 | 0.379 | |
| MA1 | 0.1978 | 0.1445 | 1.3691 | 0.171 | |
| ω | 0.0000 | 0.0000 | 2.5524 | 0.011 | |
| α1 | 0.1088 | 0.0202 | 5.3851 | 0.000 | |
| β1 | 0.8488 | 0.0314 | 27.0056 | 0.000 | |
| Metal | μ | 0.0011 | 0.0005 | 2.3131 | 0.021 |
| AR1 | −0.8764 | 0.1186 | −7.3875 | 0.000 | |
| MA1 | 0.8557 | 0.1289 | 6.6402 | 0.000 | |
| ω | 0.0000 | 0.0000 | 1.2522 | 0.211 | |
| α1 | 0.1569 | 0.0874 | 1.7958 | 0.073 | |
| β1 | 0.6969 | 0.1848 | 3.7720 | 0.000 | |
| Nifty | μ | 0.0008 | 0.0003 | 3.1082 | 0.002 |
| AR1 | −0.1435 | 0.2159 | −0.6650 | 0.506 | |
| MA1 | 0.1962 | 0.2086 | 0.9407 | 0.347 | |
| ω | 0.0000 | 0.0000 | 1.1233 | 0.261 | |
| α1 | 0.1345 | 0.0317 | 4.2364 | 0.000 | |
| β1 | 0.8207 | 0.0422 | 19.4436 | 0.000 | |
| Gold | μ | 0.0002 | 0.0003 | 0.8673 | 0.386 |
| AR1 | 0.1738 | 0.1713 | 1.0149 | 0.310 | |
| MA1 | −0.2229 | 0.1686 | −1.3223 | 0.186 | |
| ω | 0.0000 | 0.0000 | 2.6143 | 0.009 | |
| α1 | 0.0020 | 0.0002 | 12.3944 | 0.000 | |
| β1 | 0.9957 | 0.0002 | 5546.0452 | 0.000 | |
| Oil | μ | 0.0009 | 0.0006 | 1.3661 | 0.172 |
| AR1 | −0.3345 | 0.2131 | −1.5700 | 0.116 | |
| MA1 | 0.3705 | 0.2073 | 1.7868 | 0.074 | |
| ω | 0.0000 | 0.0000 | 2.8025 | 0.005 | |
| α1 | 0.0947 | 0.0199 | 4.7605 | 0.000 | |
| β1 | 0.8701 | 0.0211 | 41.2270 | 0.000 | |
| Joint | DCC-α1 | 0.0195 | 0.0040 | 4.8484 | 0.000 |
| Joint | DCC-β1 | 0.8876 | 0.0232 | 38.2811 | 0.000 |
| Pair | Average Hedge Ratio | Hedging Effectiveness |
|---|---|---|
| Oil–Nifty | 0.0319 | 0.79% |
| Oil–Metal | 0.0970 | 2.63% |
| Oil–Finance | 0.0338 | −0.49% |
| Oil–Energy | 0.0332 | 1.06% |
| Oil–Auto | 0.0465 | 0.20% |
| Gold–Nifty | 0.0571 | 7.65% |
| Gold–Metal | 0.2316 | 17.59% |
| Gold–Finance | 0.0724 | 11.96% |
| Gold–Energy | 0.0790 | 5.52% |
| Gold–Auto | 0.0497 | 3.34% |
| Nifty–Metal | 1.3356 | 87.12% |
| Nifty–Finance | 1.1176 | 71.67% |
| Nifty–Energy | 1.0377 | 75.36% |
| Nifty–Auto | 0.9574 | 67.90% |
| Metal–Finance | 0.3422 | 76.54% |
| Metal–Energy | 0.4722 | 62.40% |
| Metal–Auto | 0.3699 | 44.29% |
| Finance–Energy | 0.6288 | 40.37% |
| Finance–Auto | 0.6004 | 37.80% |
| Energy–Auto | 0.5763 | 66.16% |
Disclaimer/Publisher’s Note: The statements, opinions and data contained in all publications are solely those of the individual author(s) and contributor(s) and not of MDPI and/or the editor(s). MDPI and/or the editor(s) disclaim responsibility for any injury to people or property resulting from any ideas, methods, instructions or products referred to in the content. |
© 2025 by the authors. Licensee MDPI, Basel, Switzerland. This article is an open access article distributed under the terms and conditions of the Creative Commons Attribution (CC BY) license (https://creativecommons.org/licenses/by/4.0/).
Share and Cite
Maharana, N.; Panigrahi, A.K.; Chaudhury, S.K. Commodity Spillovers and Risk Hedging: The Evolving Role of Gold and Oil in the Indian Stock Market. Commodities 2025, 4, 5. https://doi.org/10.3390/commodities4020005
Maharana N, Panigrahi AK, Chaudhury SK. Commodity Spillovers and Risk Hedging: The Evolving Role of Gold and Oil in the Indian Stock Market. Commodities. 2025; 4(2):5. https://doi.org/10.3390/commodities4020005
Chicago/Turabian StyleMaharana, Narayana, Ashok Kumar Panigrahi, and Suman Kalyan Chaudhury. 2025. "Commodity Spillovers and Risk Hedging: The Evolving Role of Gold and Oil in the Indian Stock Market" Commodities 4, no. 2: 5. https://doi.org/10.3390/commodities4020005
APA StyleMaharana, N., Panigrahi, A. K., & Chaudhury, S. K. (2025). Commodity Spillovers and Risk Hedging: The Evolving Role of Gold and Oil in the Indian Stock Market. Commodities, 4(2), 5. https://doi.org/10.3390/commodities4020005


