
Tail Risk in Weather Derivatives


Abstract
1. Introduction
2. Background: Chicago Mercantile Exchange (CME) Temperature Derivatives and Baseline Modeling
2.1. Structure of CME Heating Degree Day (HDD)/ Cooling Degree Day (CDD) Index Futures
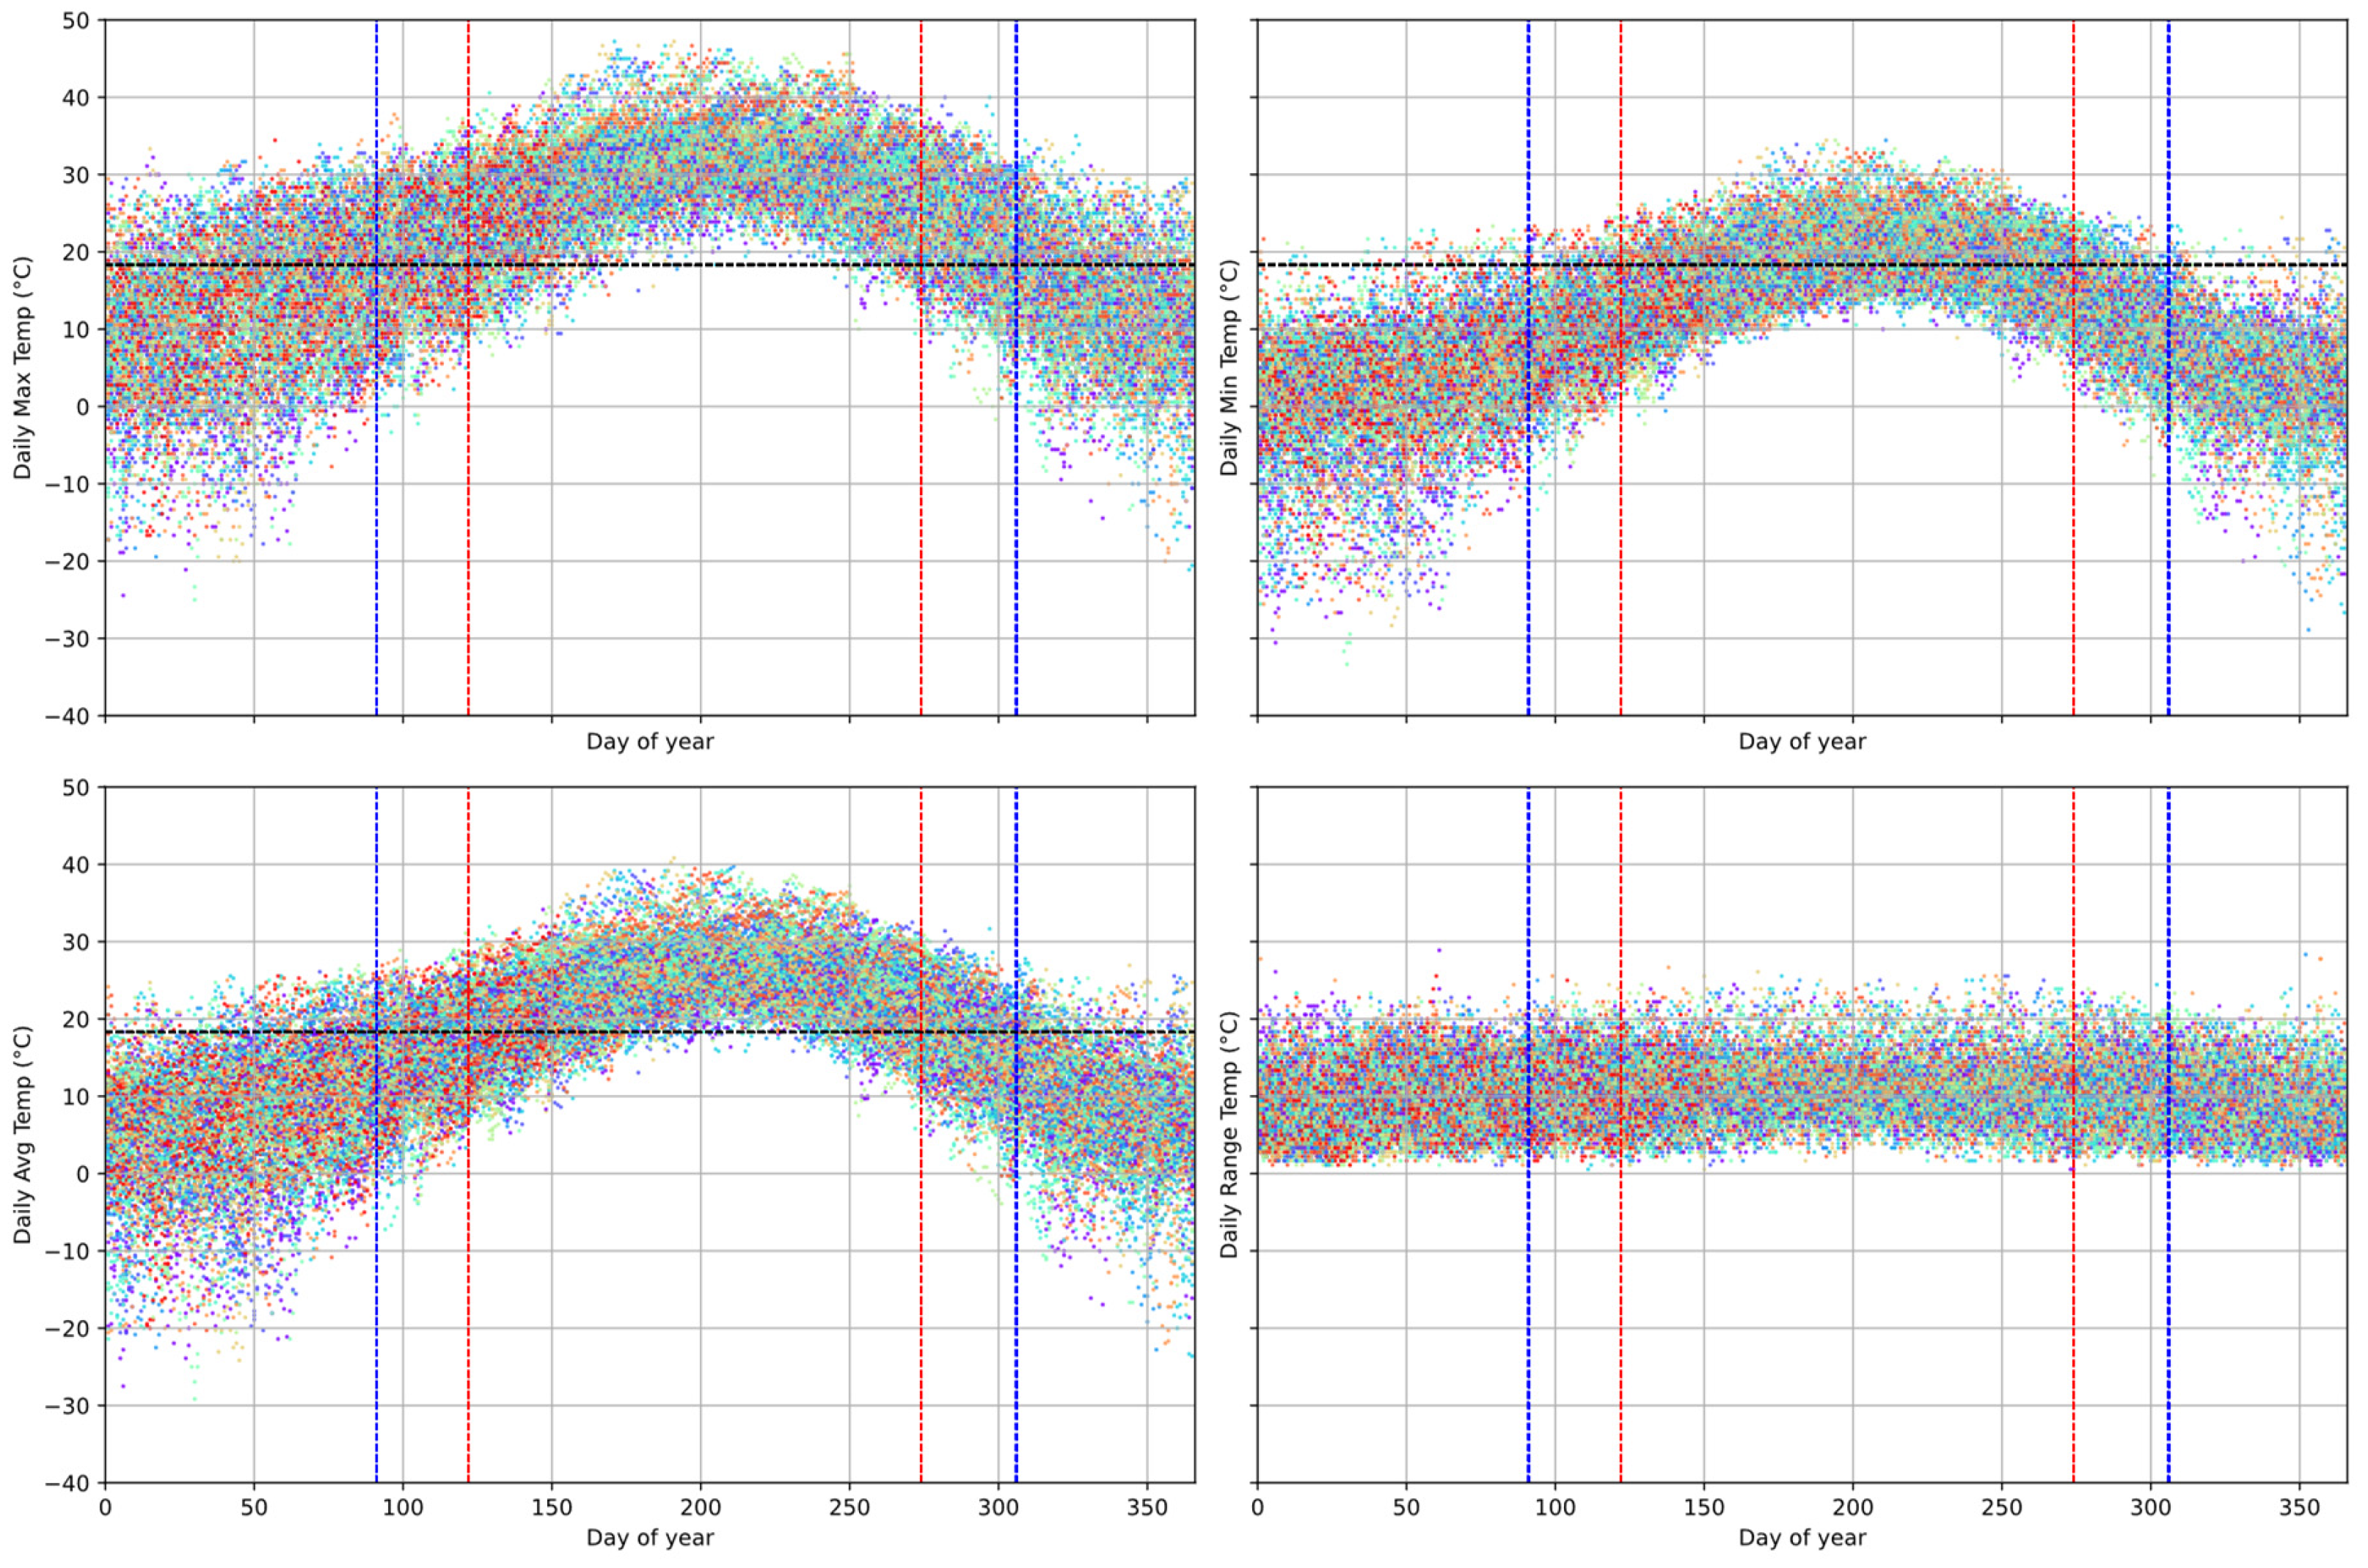
2.2. Temperature Data and Stylized Facts
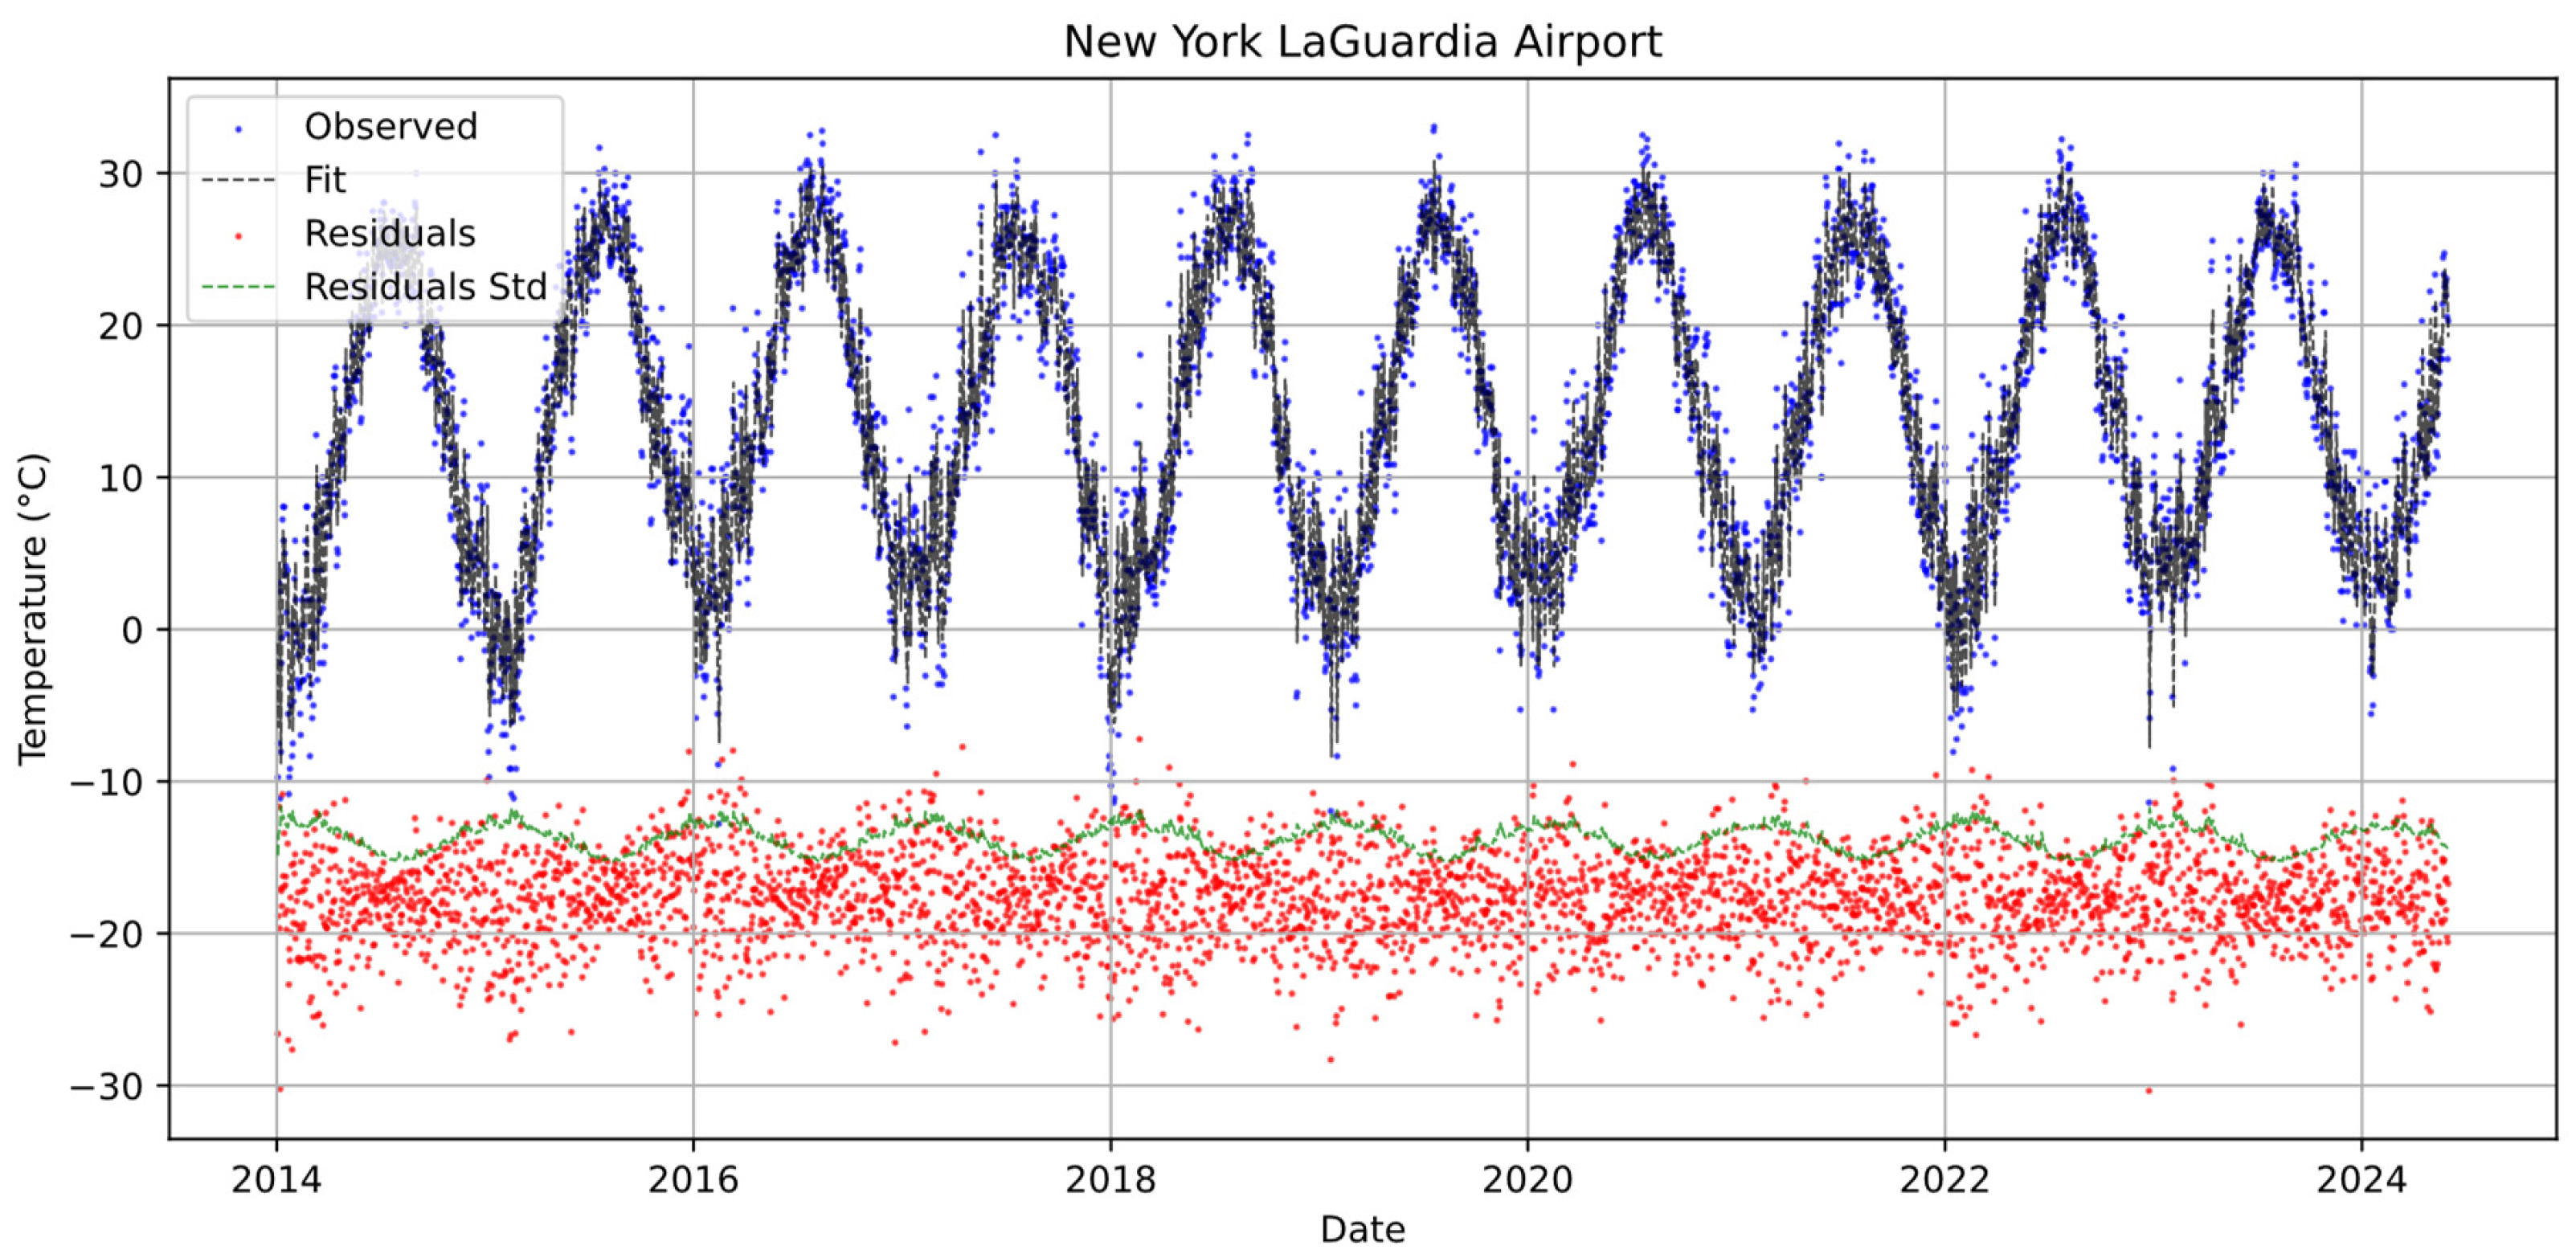
2.3. Baseline Temperature Modeling
2.3.1. Conditional Mean
2.3.2. Seasonal GARCH Conditional Variance
2.4. Extracting HDD/CDD Residuals
3. Univariate Tail Behavior in HDD/CDD Instruments
3.1. Estimating the Extreme Value Index
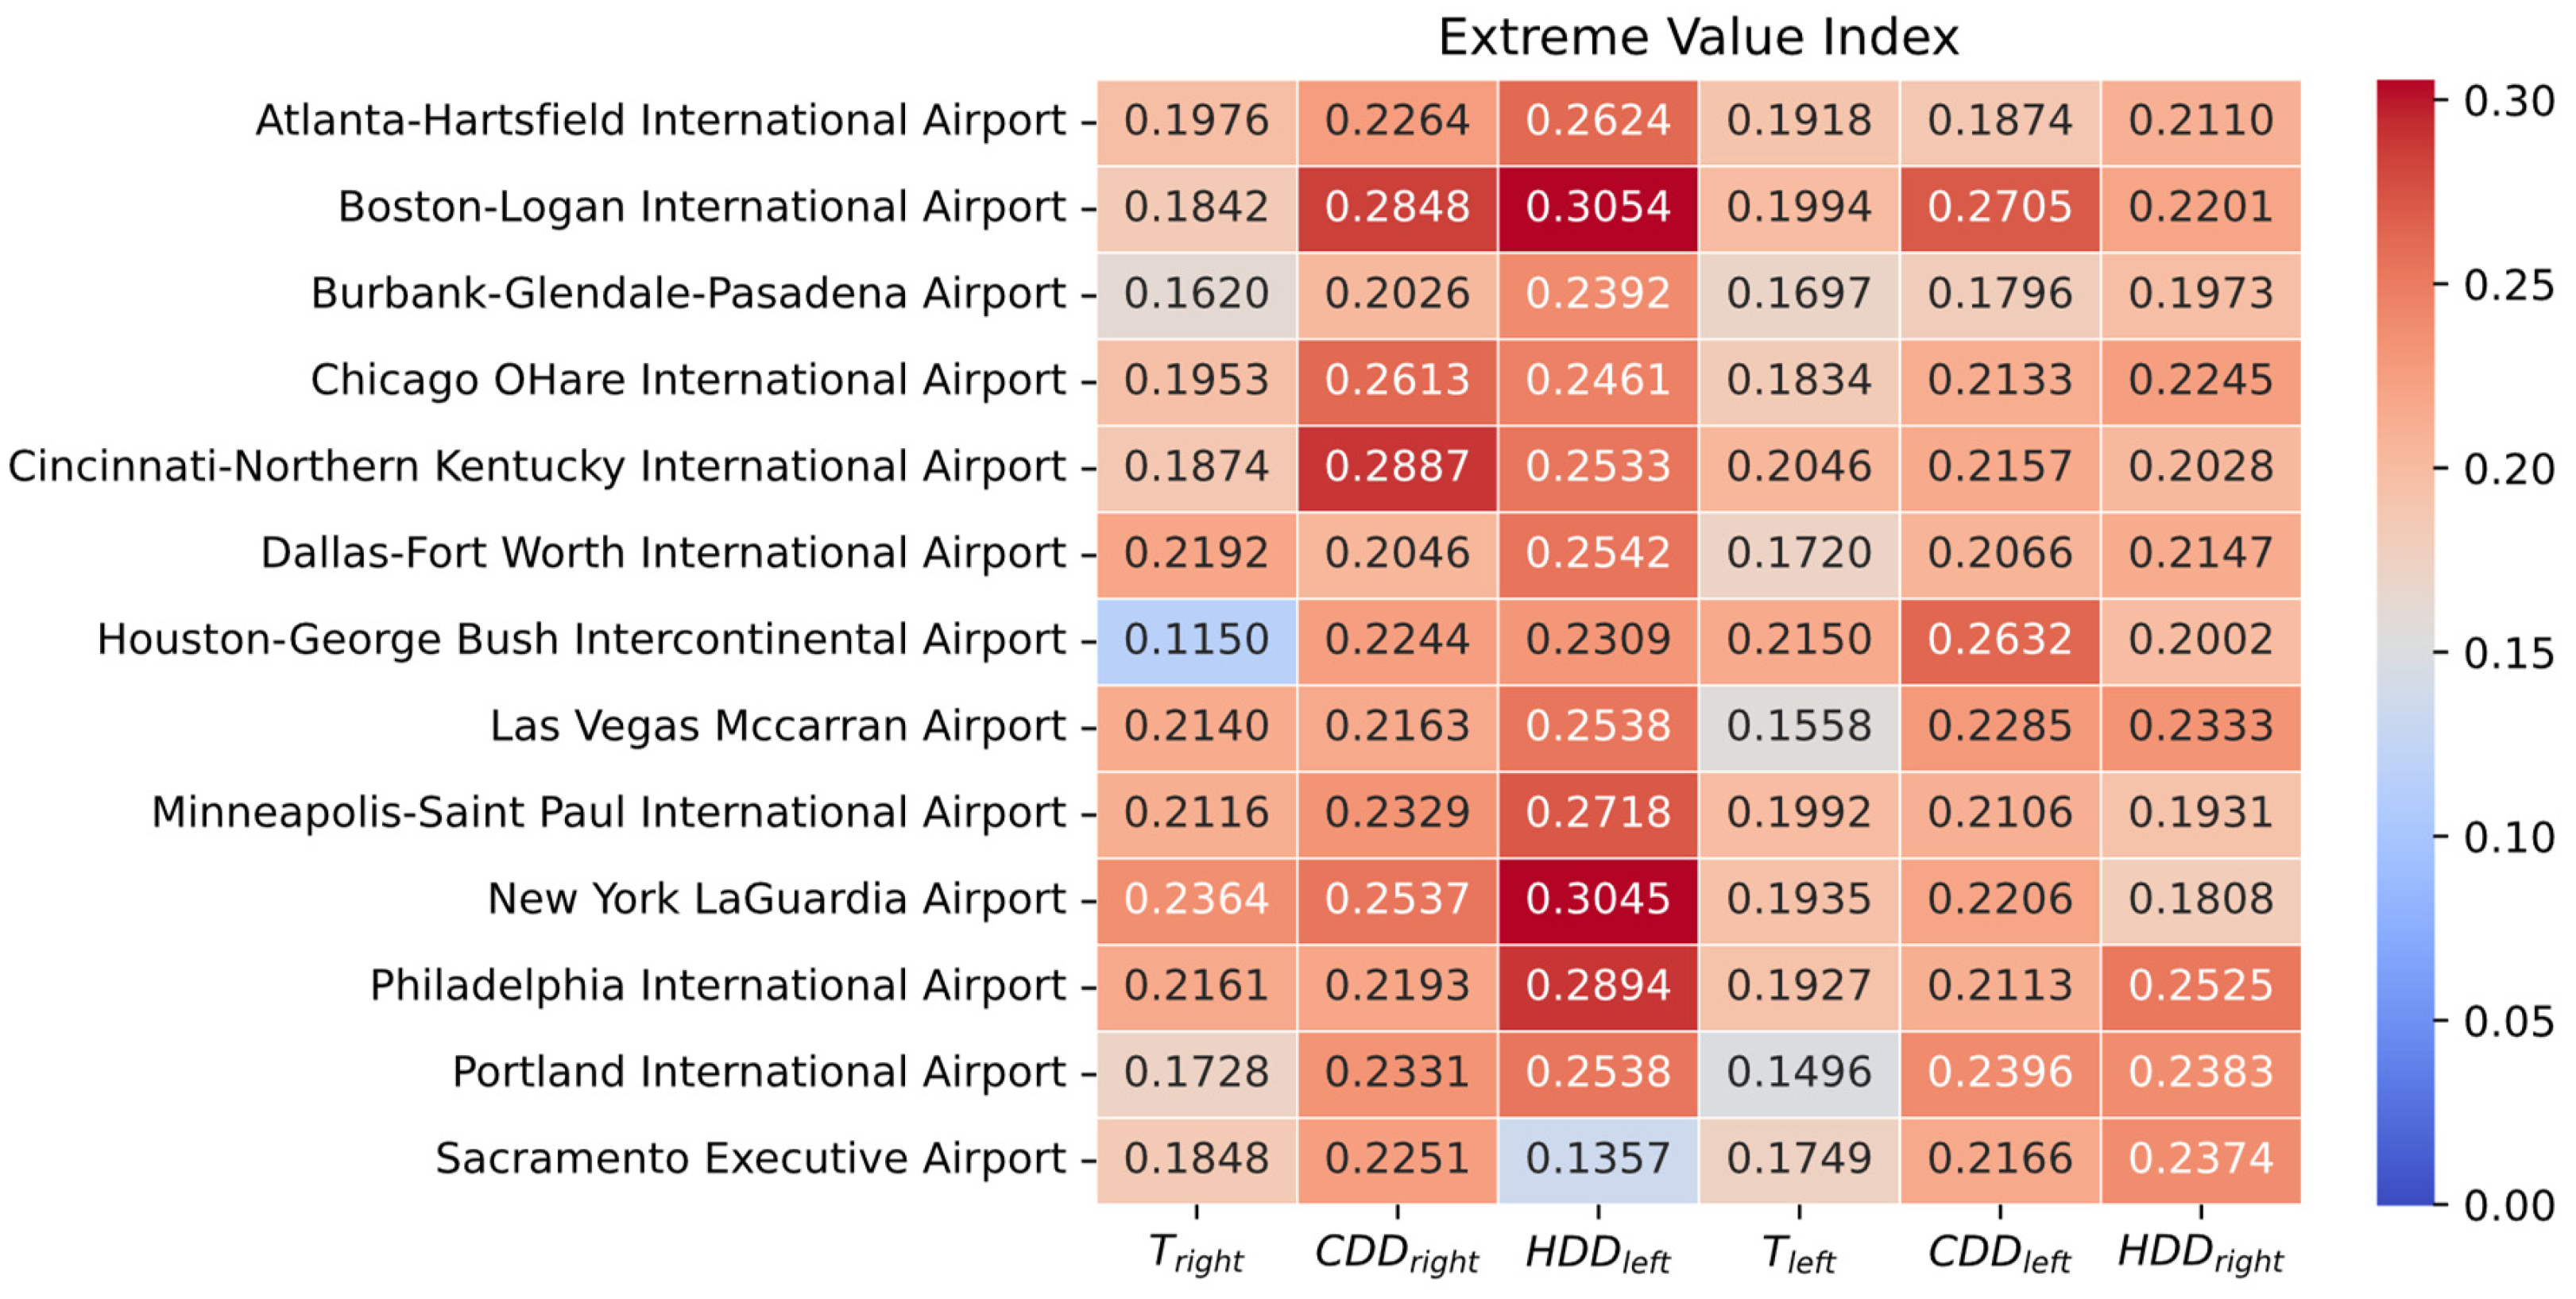
3.2. Aggregate EVI Summary
- 1.
- Degree-Day Amplification of Tail Risk. Both HDD and CDD residuals exhibit heavier tails () than temperature residuals (). This amplification arises because degree days apply a nonlinear transformation and truncate negative values at zero, concentrating more probability mass into extreme payout-relevant outcomes.
- 2.
- Asymmetry of Left vs. Right Tails.
- For HDD, (warm-winter shocks) exceeds (cold-winter shocks). Warm winters, which drastically reduce HDD payouts, are more heavy-tailed than cold shocks.
- For CDD, (hot-summer shocks) exceeds (cool-summer shocks), indicating that extreme heat events are marginally more heavy-tailed than extreme cooling events in summer.
- 3.
- Spatial Variation in Tail Thickness.
- Northern cities (Minneapolis, Chicago, New York, Boston, Philadelphia, Cincinnati) exhibit the highest , indicating that unexpectedly warm winters in colder climates produce the most extreme heavy-tailed outcomes.
- Southern/Western cities (Houston, Atlanta, Las Vegas, Sacramento, Portland, Burbank) exhibit lower , meaning warm-winter shocks in milder climates are less heavy-tailed than those in the North.
3.3. Practical Implications
4. Cross-Location Extremes: Multivariate Tail Dependence in HDD/CDD Residuals
4.1. Tail Dependence Coefficient: Definition and Intuition
4.2. Nonparametric Estimation of TDC
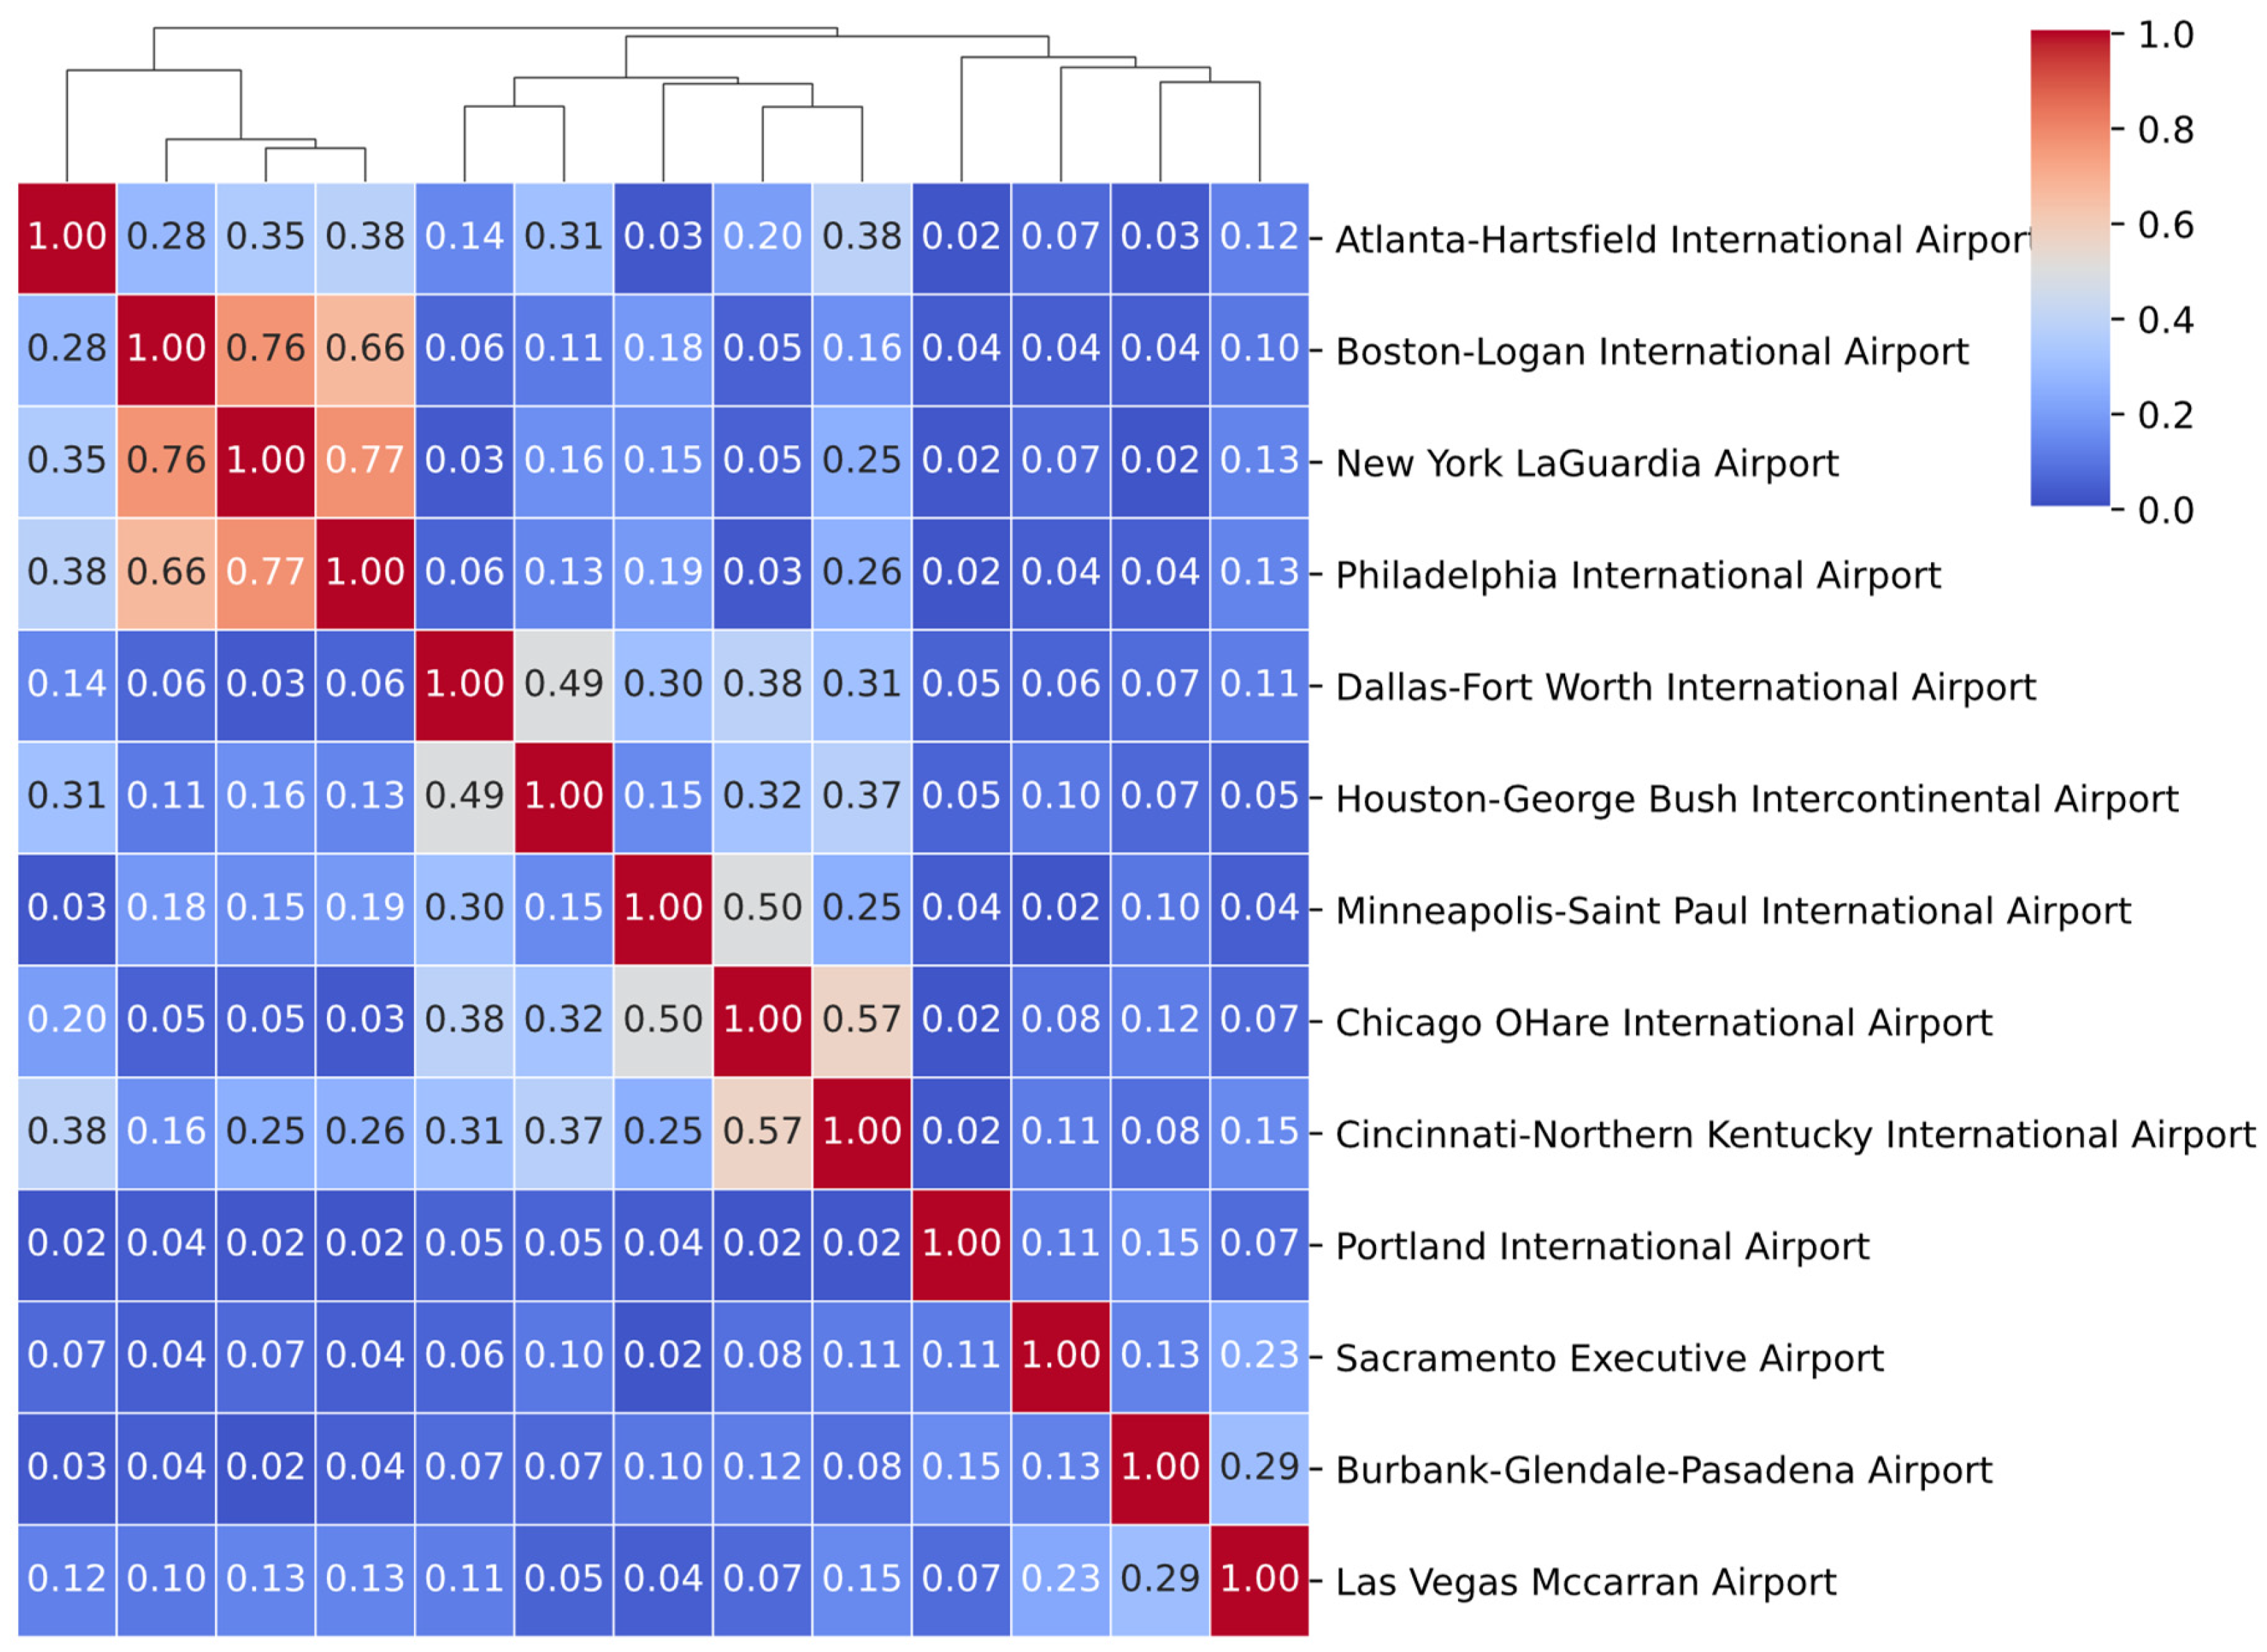
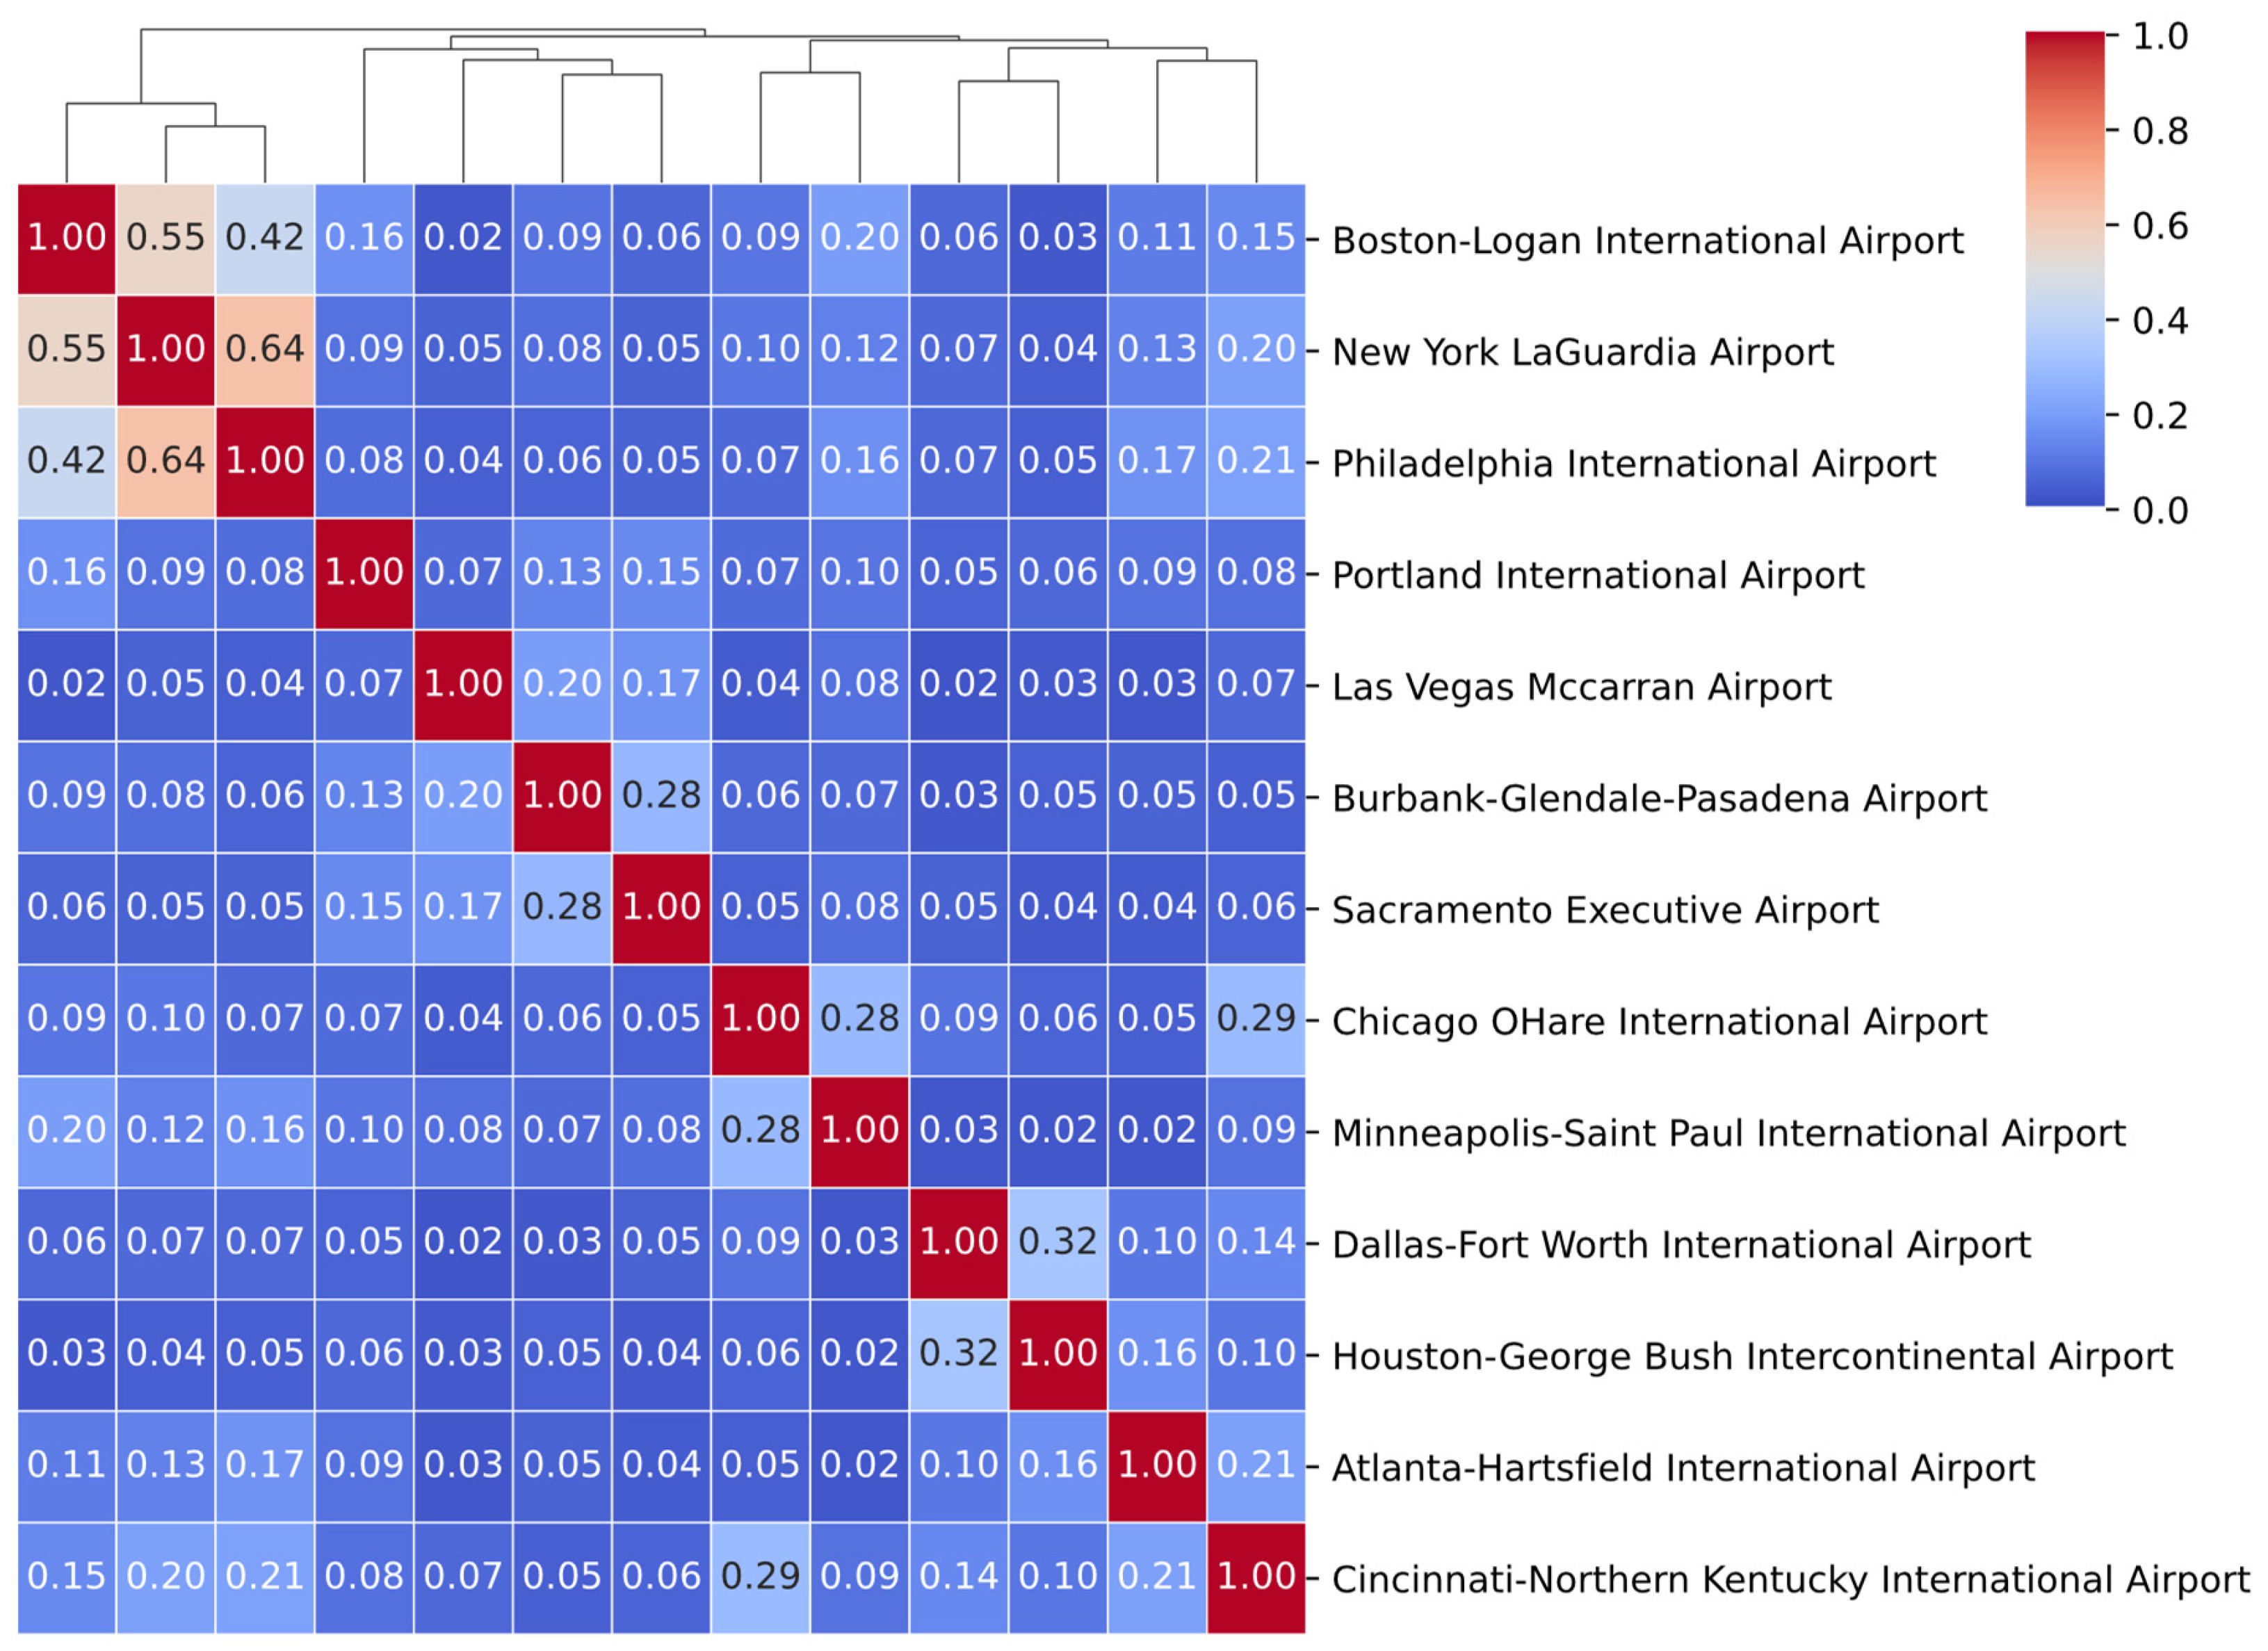
4.2.1. HDD Residuals (Figure 4)
4.2.2. CDD Residuals (Figure 5)
4.3. Practical Implications
5. Portfolio Risk Modeling with Copulas: Comparison and Backtesting
5.1. Candidate Copula Dependence Models
5.1.1. Gaussian Copula
5.1.2. Student’s t Copula
5.1.3. Vine Copula
- 1.
- is a spanning tree,
- 2.
- For , is a spanning tree with vertices , , ,
- 3.
- (Proximity condition) Each undirected edge connects vertices where , with ⊕ denoting the symmetric difference.
- 1.
- The conditioning set of e is with ,
- 2.
- The conditioned set of e is with . The elements of this bivariate set are denoted where ,
- 3.
- The bivariate copula attached to e is ,
- 4.
- The corresponding conditional distribution functions (h-functions) are and .
5.2. Copula Model Evaluation via Portfolio Backtesting
5.2.1. Portfolio Setup and Cross-Validation Framework
- Long HDD Portfolio: A long position in each city’s HDD index future.
- Long CDD Portfolio: A long position in each city’s CDD index future.
- 1.
- Fit Marginals (Training Set). For each city, fit the empirical CDF of the standardized residuals from our baseline model (Section 2.3).
- 2.
- Transform to Uniforms. Map each city’s training residuals to pseudo-observations .
- 3.
- Fit Copula (Training Set). Estimate the copula on the multivariate uniform data:
- For Gaussian and Student’s t, estimate the correlation matrix (and degrees of freedom).
- 4.
- Simulate Portfolio Losses (Validation Set). For each day t in the validation fold:
- (a)
- Draw large number of samples from the fitted copula.
- (b)
- Invert the empirical CDFs to obtain simulated standardized residuals for each city i.
- (c)
- Compute each city’s simulated HDD (or CDD) index values by adding the simulated standardized residuals to the baseline prediction from Section 2.3, then form the equally weighted portfolio value based on simulated index for day t.
- (d)
- Estimate VaRα=0.05 and ESα=0.05 of the portfolio.
5.2.2. Joint VaR-ES Backtest
5.3. Practical Implications
6. Conclusions
Author Contributions
Funding
Institutional Review Board Statement
Informed Consent Statement
Data Availability Statement
Conflicts of Interest
References
- Kikstra, J.S.; Nicholls, Z.R.; Smith, C.J.; Lewis, J.; Lamboll, R.D.; Byers, E.; Sandstad, M.; Meinshausen, M.; Gidden, M.J.; Rogelj, J.; et al. The IPCC Sixth Assessment Report WGIII climate assessment of mitigation pathways: From emissions to global temperatures. Geosci. Model Dev. 2022, 15, 9075–9109. [Google Scholar] [CrossRef]
- Hermann, M.; Wernli, H.; Röthlisberger, M. Drastic increase in the magnitude of very rare summer-mean vapor pressure deficit extremes. Nat. Commun. 2024, 15, 7022. [Google Scholar] [CrossRef] [PubMed]
- Sutton-Vermeulen, D. Managing climate risk with CME Group weather futures and options. CME Group 2021, 20, 2021. [Google Scholar]
- Bemš, J.; Aydin, C. Introduction to weather derivatives. WIREs Energy Environ. 2022, 11, e426. [Google Scholar] [CrossRef]
- Prentzas, A.; Bournaris, T.; Nastis, S.; Moulogianni, C.; Vlontzos, G. Enhancing Sustainability through Weather Derivative Option Contracts: A Risk Management Tool in Greek Agriculture. Sustainability 2024, 16, 7372. [Google Scholar] [CrossRef]
- Neal, T.; Newell, B.R.; Pitman, A. Reconsidering the macroeconomic damage of severe warming. Environ. Res. Lett. 2025, 20, 044029. [Google Scholar] [CrossRef]
- Stulec, I.; Petljak, K.; Bakovic, T. Effectiveness of weather derivatives as a hedge against the weather risk in agriculture. Agric. Econ./Zemědělská Ekon. 2016, 62, 356–362. [Google Scholar] [CrossRef]
- Bressan, G.M.; Romagnoli, S. Climate risks and weather derivatives: A copula-based pricing model. J. Financ. Stab. 2021, 54, 100877. [Google Scholar] [CrossRef]
- The Straits Times. Use of Weather Derivatives Surges as Extreme Climate Events Rock the Globe. 2023. Available online: https://www.straitstimes.com/world/europe/use-of-weather-derivatives-surges-as-extreme-climate-events-rock-the-globe (accessed on 14 May 2025).
- Benth, F.E.; Härdle, W.K.; Cabrera, B.L. Pricing of Asian temperature risk. In Statistical Tools for Finance and Insurance; Cizek, P., Härdle, W.K., Weron, R., Eds.; Springer: Berlin/Heidelberg, Germany, 2011; pp. 163–199. [Google Scholar] [CrossRef]
- Alaton, P.; Boualem, D.; Stillberger, D. On modelling and pricing weather derivatives. Appl. Math. Financ. 2002, 9, 1–20. [Google Scholar] [CrossRef]
- Alfonsi, A.; Vadillo, N. A stochastic volatility model for the valuation of temperature derivatives. IMA J. Manag. Math. 2024, 35, 737–785. [Google Scholar] [CrossRef]
- Blanco, S.S. Local sensitivity analysis of heating degree day and cooling degree day temperature derivative prices. Quant. Financ. 2025, 25, 653–670. [Google Scholar] [CrossRef]
- Benth, F.E.; Šaltytė Benth, J.; Koekebakker, S. Putting a Price on Temperature. Scand. J. Stat. 2007, 34, 746–767. [Google Scholar] [CrossRef]
- Benth, F.E.; Benth, J.š. The volatility of temperature and pricing of weather derivatives. Quant. Financ. 2007, 7, 553–561. [Google Scholar] [CrossRef]
- Benth, F.E.; Šaltytė Benth, J. Weather Derivatives and Stochastic Modelling of Temperature. Int. J. Stoch. Anal. 2011, 2011, 576791. [Google Scholar] [CrossRef]
- Benth, F.E.; Lempa, J. Hedging temperature risk with CDD and HDD temperature futures. Appl. Stoch. Model. Bus. Ind. 2024, 40, 1484–1497. [Google Scholar] [CrossRef]
- Campbell, S.D.; Diebold, F.X. Weather Forecasting for Weather Derivatives. J. Am. Stat. Assoc. 2005, 100, 6–16. [Google Scholar] [CrossRef]
- Šaltytė Benth, J.; Benth, F.E. A critical view on temperature modelling for application in weather derivatives markets. Energy Econ. 2012, 34, 592–602. [Google Scholar] [CrossRef]
- Embrechts, P.; Klüppelberg, C.; Mikosch, T. Modelling Extremal Events; Springer: Berlin/Heidelberg, Germany, 1997. [Google Scholar] [CrossRef]
- Erhardt, R.J.; Smith, R.L. Weather Derivative Risk Measures for Extreme Events. N. Am. Actuar. J. 2014, 18, 379–393. [Google Scholar] [CrossRef]
- de Haan, L.; Tank, A.K.; Neves, C. On tail trend detection: Modeling relative risk. Extremes 2015, 18, 141–178. [Google Scholar] [CrossRef]
- Carney, M.; Holland, M.; Nicol, M.; Tran, P. Runs of extremes of observables on dynamical systems and applications. Phys. D Nonlinear Phenom. 2024, 460, 134093. [Google Scholar] [CrossRef]
- Koh, J.; Steinfeld, D.; Martius, O. Using spatial extreme-value theory with machine learning to model and understand spatially compounding extremes. arXiv 2024, arXiv:2401.12195. [Google Scholar] [CrossRef]
- Chicago Mercantile Exchange. CME Degree Days Index Futures Rulebook. 2024. Available online: https://www.cmegroup.com/rulebook/CME/ (accessed on 5 April 2025).
- CME Group. CME Group Weather Suite Expanded. 2023. Available online: https://www.cmegroup.com/articles/2023/cme-group-weather-suite-expanded.html (accessed on 14 May 2025).
- Alexandridis K., A.; Zapranis, A.D. Weather Derivatives: Modeling and Pricing Weather-Related Risk; Springer: New York, NY, USA, 2013. [Google Scholar] [CrossRef]
- Engle, R.F. Autoregressive Conditional Heteroscedasticity with Estimates of the Variance of United Kingdom Inflation. Econometrica 1982, 50, 987–1007. [Google Scholar] [CrossRef]
- Engle, R.F.; Bollerslev, T. Modelling the persistence of conditional variances. Econom. Rev. 1986, 5, 1–50. [Google Scholar] [CrossRef]
- Esunge, J.; Njong, J.J. Weather derivatives and the market price of risk. J. Stoch. Anal. 2020, 1, 7. [Google Scholar] [CrossRef]
- Kelly, B.; Jiang, H. Tail Risk and Asset Prices. Rev. Financ. Stud. 2014, 27, 2841–2871. [Google Scholar] [CrossRef]
- McNeil, A.J.; Frey, R.; Embrechts, P. Quantitative Risk Management: Concepts, Techniques and Tools—Revised Edition; Princeton University Press: Princeton, NJ, USA, 2015. [Google Scholar]
- Chen, K.; Cheng, T. Measuring tail risks. J. Financ. Data Sci. 2022, 8, 296–308. [Google Scholar] [CrossRef]
- Schultze, J.; Steinebach, J. On least squares estimates of an exponential tail coefficient. Stat. Risk Model. 1996, 14, 353–372. [Google Scholar] [CrossRef]
- Fedotenkov, I. A Review of More than One Hundred Pareto-Tail Index Estimators. Statistica 2020, 80, 245–299. [Google Scholar] [CrossRef]
- Ferreira, M. Nonparametric Estimation of the Tail-Dependence Coefficient. REVSTAT-Stat. J. 2013, 11, 1–16. [Google Scholar] [CrossRef]
- Sohkanen, P. Estimation of the Tail Dependence Coefficient. Master’s Thesis, University of Helsinki, Helsinki, Finland, 2021. [Google Scholar]
- Lei, Z.; Li, P.; Wang, Y. The effect of compound heat-drought risk on municipal corporate bonds pricing: Evidence from China. N. Am. J. Econ. Financ. 2025, 79, 102462. [Google Scholar] [CrossRef]
- Sklar, M. Fonctions de répartition à n dimensions et leurs marges. In Annales de l’ISUP; Publications de l’Institut Statistique de l’Université de Paris: Paris, France, 1959; Volume 8, pp. 229–231. [Google Scholar]
- Jia, S.; Chen, X.; Han, L.; Jin, J. Global climate change and commodity markets: A hedging perspective. J. Futur. Mark. 2023, 43, 1393–1422. [Google Scholar] [CrossRef]
- Li, D.X. On Default Correlation: A Copula Function Approach. J. Fixed Income 2000, 9, 43–54. [Google Scholar] [CrossRef]
- Czado, C. Analyzing Dependent Data with Vine Copulas: A Practical Guide with R; Lecture Notes in Statistics Series; Springer International Publishing: Cham, Switzeralnd, 2019; Volume 222. [Google Scholar] [CrossRef]
- Aas, K.; Czado, C.; Frigessi, A.; Bakken, H. Pair-copula constructions of multiple dependence. Insur. Math. Econ. 2009, 44, 182–198. [Google Scholar] [CrossRef]
- Wattanawongwan, S.; Mues, C.; Okhrati, R.; Choudhry, T.; So, M.C. Modelling credit card exposure at default using vine copula quantile regression. Eur. J. Oper. Res. 2023, 311, 387–399. [Google Scholar] [CrossRef]
- Bedford, T.; Cooke, R.M. Vines–A new graphical model for dependent random variables. Ann. Stat. 2002, 30, 1031–1068. [Google Scholar] [CrossRef]
- Sommer, E.; Bax, K.; Czado, C. Vine Copula based Portfolio Level Conditional Risk Measure Forecasting. Econom. Stat. 2023. [CrossRef]
- Cheng, T.; Chen, K. A general framework for portfolio construction based on generative models of asset returns. J. Financ. Data Sci. 2023, 9, 100113. [Google Scholar] [CrossRef]
- Cheng, T. torchvinecopulib: Yet Another Vine Copula Package, Using PyTorch. 2024. Available online: https://zenodo.org/records/13901533 (accessed on 10 June 2025).
- Joe, H. Dependence Modeling with Copulas; Chapman and Hall/CRC: New York, NY, USA, 2014. [Google Scholar] [CrossRef]
- Czado, C.; Nagler, T. Vine Copula Based Modeling. Annu. Rev. Stat. Its Appl. 2022, 9, 453–477. [Google Scholar] [CrossRef]
- Dissmann, J.; Brechmann, E.C.; Czado, C.; Kurowicka, D. Selecting and estimating regular vine copulae and application to financial returns. Comput. Stat. Data Anal. 2013, 59, 52–69. [Google Scholar] [CrossRef]
- Nagler, T.; Schellhase, C.; Czado, C. Nonparametric estimation of simplified vine copula models: Comparison of methods. Depend. Model. 2017, 5, 99–120. [Google Scholar] [CrossRef]
- Nagler, T. Simplified vine copula models: State of science and affairs. Risk Sciences 2025, 1, 100022. [Google Scholar] [CrossRef]
- Deng, K.; Qiu, J. Backtesting expected shortfall and beyond. Quant. Financ. 2021, 21, 1109–1125. [Google Scholar] [CrossRef]

| Station | RMSE | AIC | LB (10) | LB (30) | LB2 (10) | LB2 (30) | ARCH LM (10) | |
|---|---|---|---|---|---|---|---|---|
| Atlanta-Hartsfield International Airport | 2.45 | 0.90 | 21,852.87 | 10.22 (0.42) | 30.94 (0.42) | 11.56 (0.32) | 25.90 (0.68) | 14.23 (0.16) |
| Boston-Logan International Airport | 3.14 | 0.89 | 24,503.59 | 4.25 (0.94) | 13.58 (1.00) | 8.05 (0.62) | 26.94 (0.63) | 5.84 (0.83) |
| Burbank-Glendale-Pasadena Airport | 1.73 | 0.89 | 20,098.87 | 8.56 (0.57) | 25.23 (0.71) | 10.47 (0.40) | 23.75 (0.78) | 14.74 (0.14) |
| Chicago O’Hare International Airport | 3.25 | 0.91 | 24,554.50 | 2.24 (0.99) | 10.83 (1.00) | 6.12 (0.80) | 33.91 (0.28) | 8.03 (0.63) |
| Cincinnati-Northern Kentucky International Airport | 3.19 | 0.90 | 24,011.25 | 4.81 (0.90) | 13.28 (1.00) | 4.63 (0.91) | 21.99 (0.85) | 4.76 (0.91) |
| Dallas-Fort Worth International Airport | 2.96 | 0.89 | 23,344.29 | 13.01 (0.22) | 38.21 (0.14) | 5.37 (0.87) | 18.62 (0.95) | 7.07 (0.72) |
| Houston-George Bush Intercontinental Airport | 2.65 | 0.87 | 22,238.61 | 18.25 (0.05) | 42.70 (0.06) | 1.32 (0.999) | 23.59 (0.79) | 2.26 (0.99) |
| Las Vegas McCarran Airport | 1.96 | 0.96 | 21,066.23 | 3.02 (0.98) | 14.48 (0.99) | 16.75 (0.08) | 43.13 (0.06) | 23.20 (0.01) |
| Minneapolis-Saint Paul International Airport | 3.29 | 0.93 | 24,656.86 | 2.72 (0.99) | 10.43 (1.00) | 7.71 (0.66) | 17.25 (0.97) | 11.75 (0.30) |
| New York LaGuardia Airport | 2.91 | 0.91 | 23,781.21 | 5.08 (0.89) | 18.37 (0.95) | 6.48 (0.77) | 22.42 (0.84) | 5.82 (0.83) |
| Philadelphia International Airport | 2.94 | 0.91 | 23,749.65 | 7.48 (0.68) | 13.43 (1.00) | 5.22 (0.88) | 12.41 (1.00) | 6.61 (0.76) |
| Portland International Airport | 1.99 | 0.92 | 21,219.48 | 3.38 (0.97) | 22.21 (0.85) | 9.65 (0.47) | 27.80 (0.58) | 13.12 (0.22) |
| Sacramento Executive Airport | 1.78 | 0.92 | 20,351.53 | 3.58 (0.96) | 18.67 (0.95) | 2.74 (0.99) | 21.16 (0.88) | 3.93 (0.95) |
| Model | HDD Score | CDD Score |
|---|---|---|
| Gaussian | ||
| Student-t | ||
| Vine |
Disclaimer/Publisher’s Note: The statements, opinions and data contained in all publications are solely those of the individual author(s) and contributor(s) and not of MDPI and/or the editor(s). MDPI and/or the editor(s) disclaim responsibility for any injury to people or property resulting from any ideas, methods, instructions or products referred to in the content. |
© 2025 by the authors. Licensee MDPI, Basel, Switzerland. This article is an open access article distributed under the terms and conditions of the Creative Commons Attribution (CC BY) license (https://creativecommons.org/licenses/by/4.0/).
Share and Cite
Cheng, T.; Poreddy, S.R.; Chen, K. Tail Risk in Weather Derivatives. Commodities 2025, 4, 11. https://doi.org/10.3390/commodities4020011
Cheng T, Poreddy SR, Chen K. Tail Risk in Weather Derivatives. Commodities. 2025; 4(2):11. https://doi.org/10.3390/commodities4020011
Chicago/Turabian StyleCheng, Tuoyuan, Saikiran Reddy Poreddy, and Kan Chen. 2025. "Tail Risk in Weather Derivatives" Commodities 4, no. 2: 11. https://doi.org/10.3390/commodities4020011
APA StyleCheng, T., Poreddy, S. R., & Chen, K. (2025). Tail Risk in Weather Derivatives. Commodities, 4(2), 11. https://doi.org/10.3390/commodities4020011