Analyzing Risk Premiums in the Brazilian Power Market: A Quantitative Study
Abstract
1. Introduction
- What factors contribute to the occurrence of risk premiums in the Brazilian power market?
- How have these risk premiums evolved over time?
- What are the implications of these risk premiums for market participants and policymakers?
2. Literature Review
3. The Brazilian Power Market
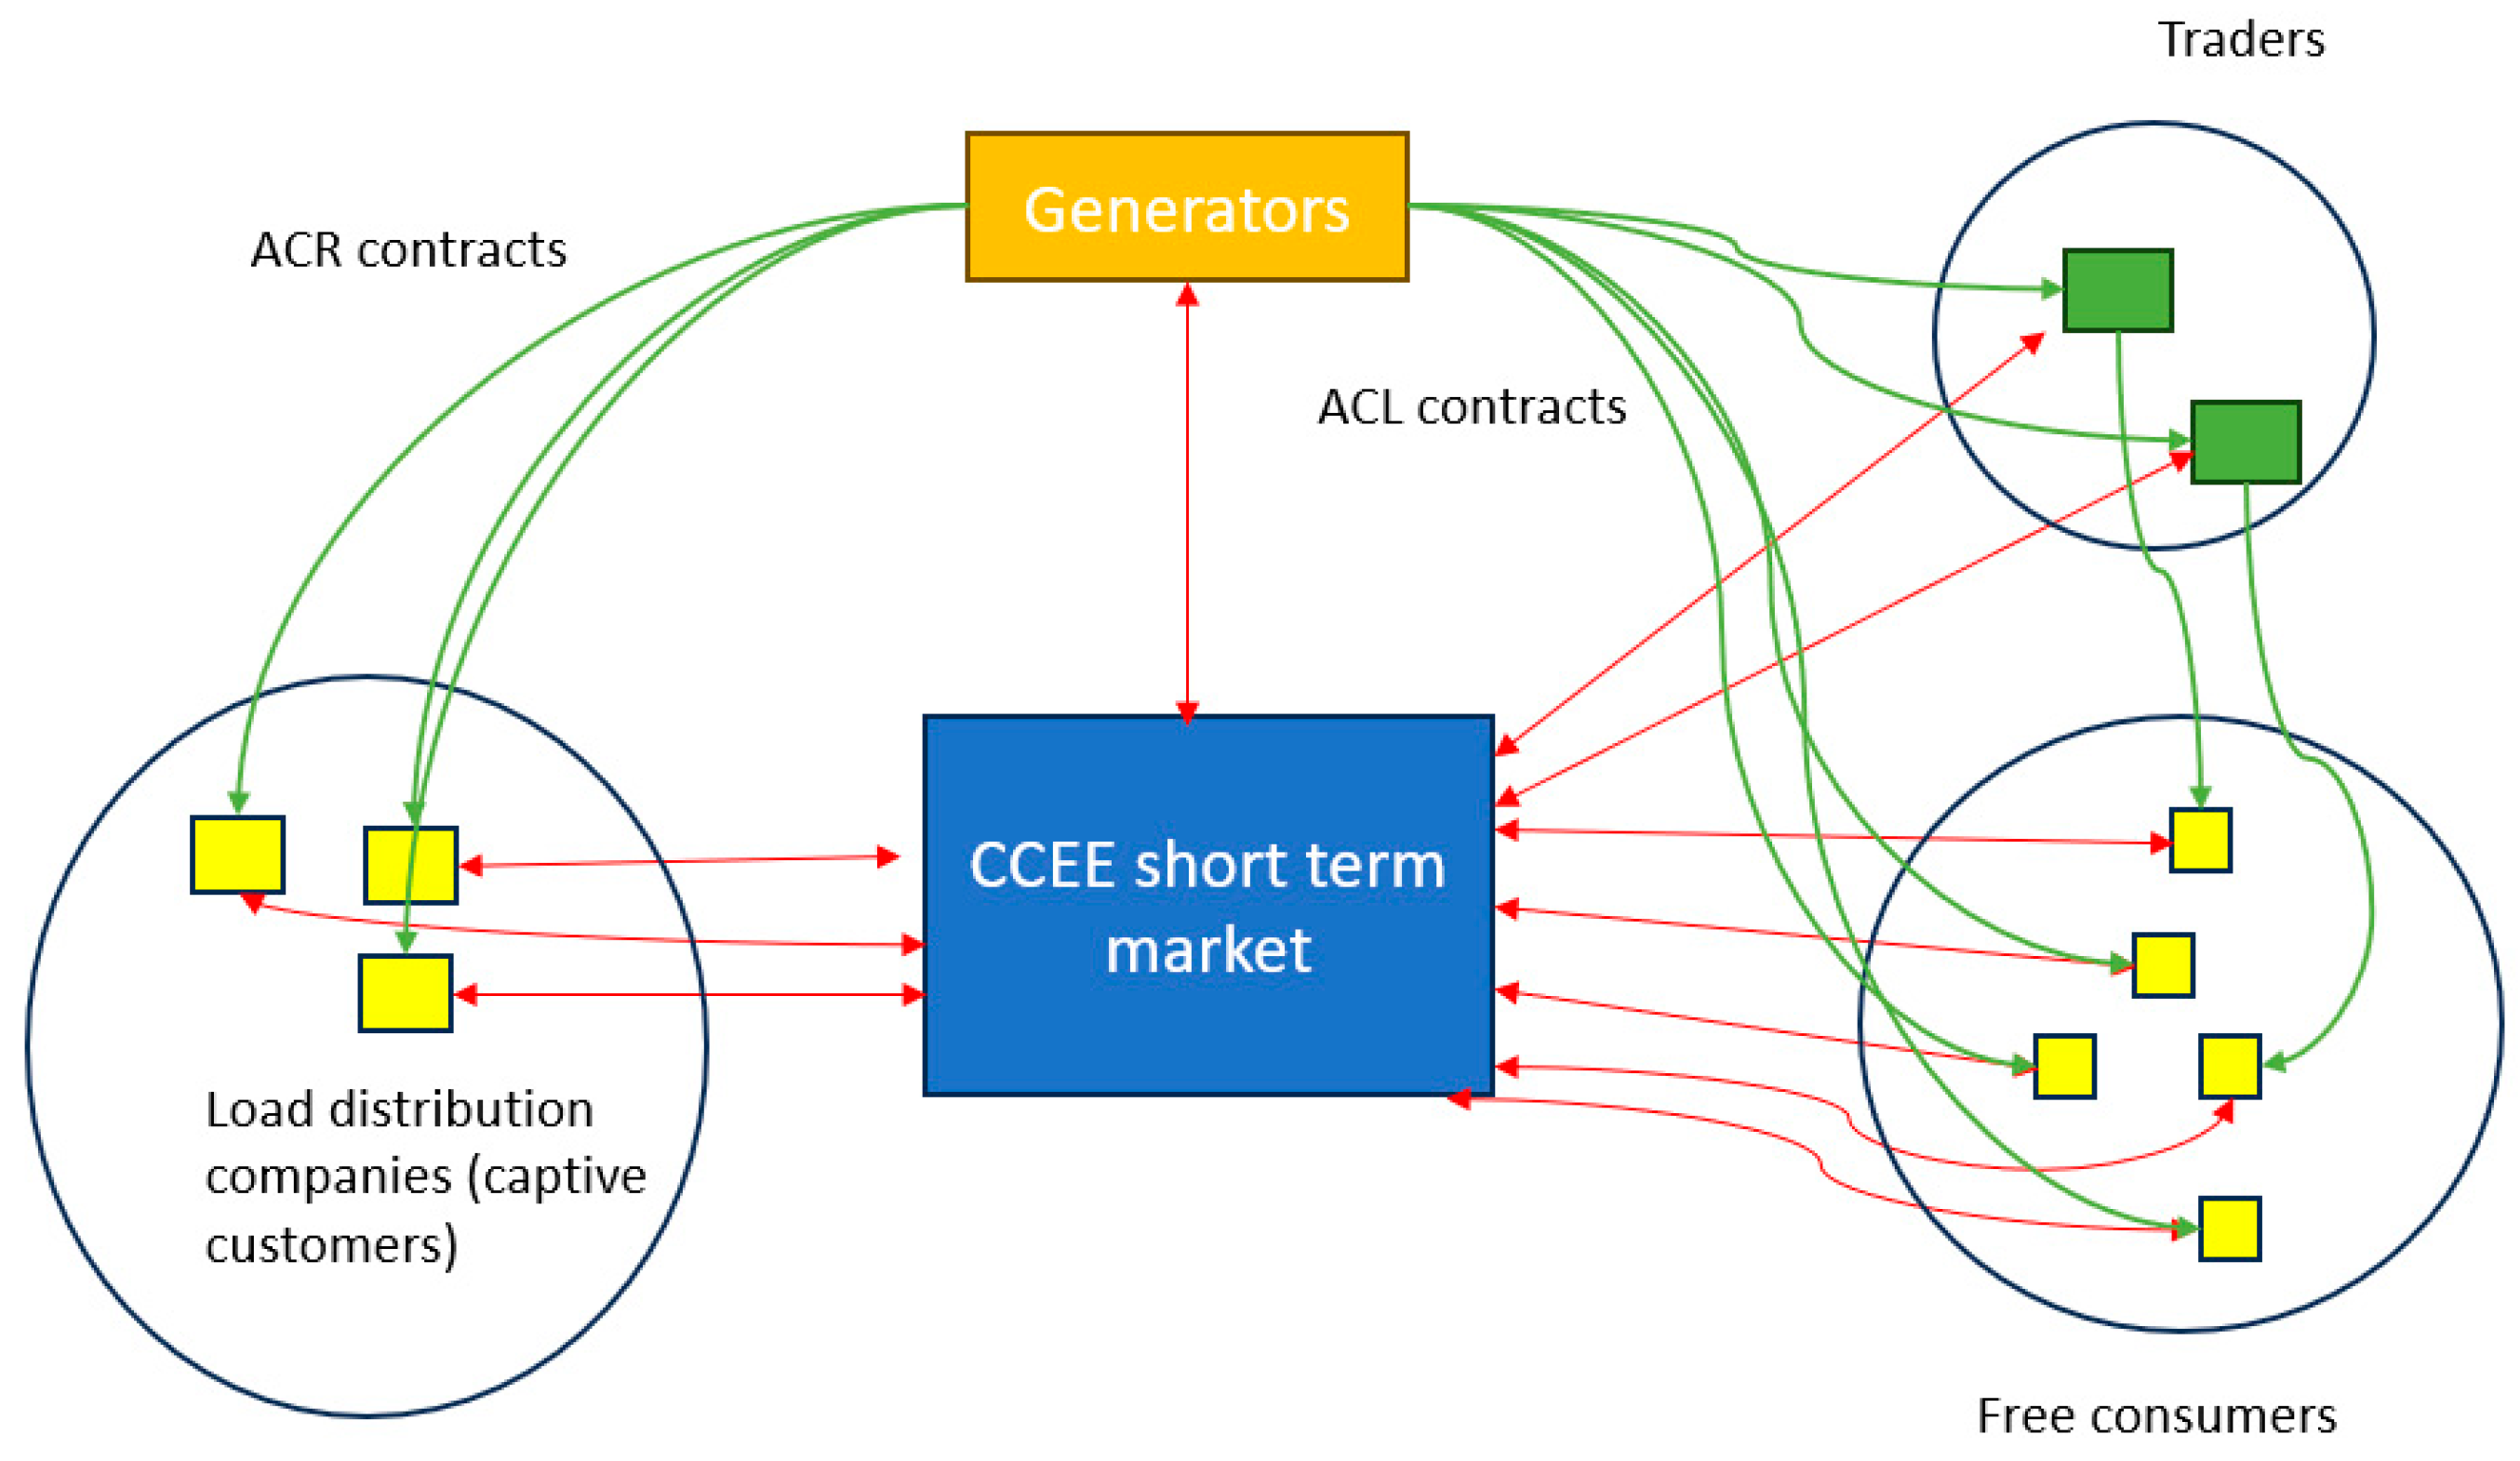
- The regulated market, known as ACR, involves captive consumers purchasing electricity directly from distribution companies.
- The free market, known as ACL, operates as a wholesale environment where consumers can buy energy directly from generators or traders.
- Free consumers, with a minimum demand of 0.5 MW, can purchase electricity directly from generators and traders.
- Special consumers, with a minimum demand between 0.5 MW and 1 MW, are allowed to participate in the ACL exclusively if they purchase electricity from renewable energy sources, as part of efforts to promote renewables.
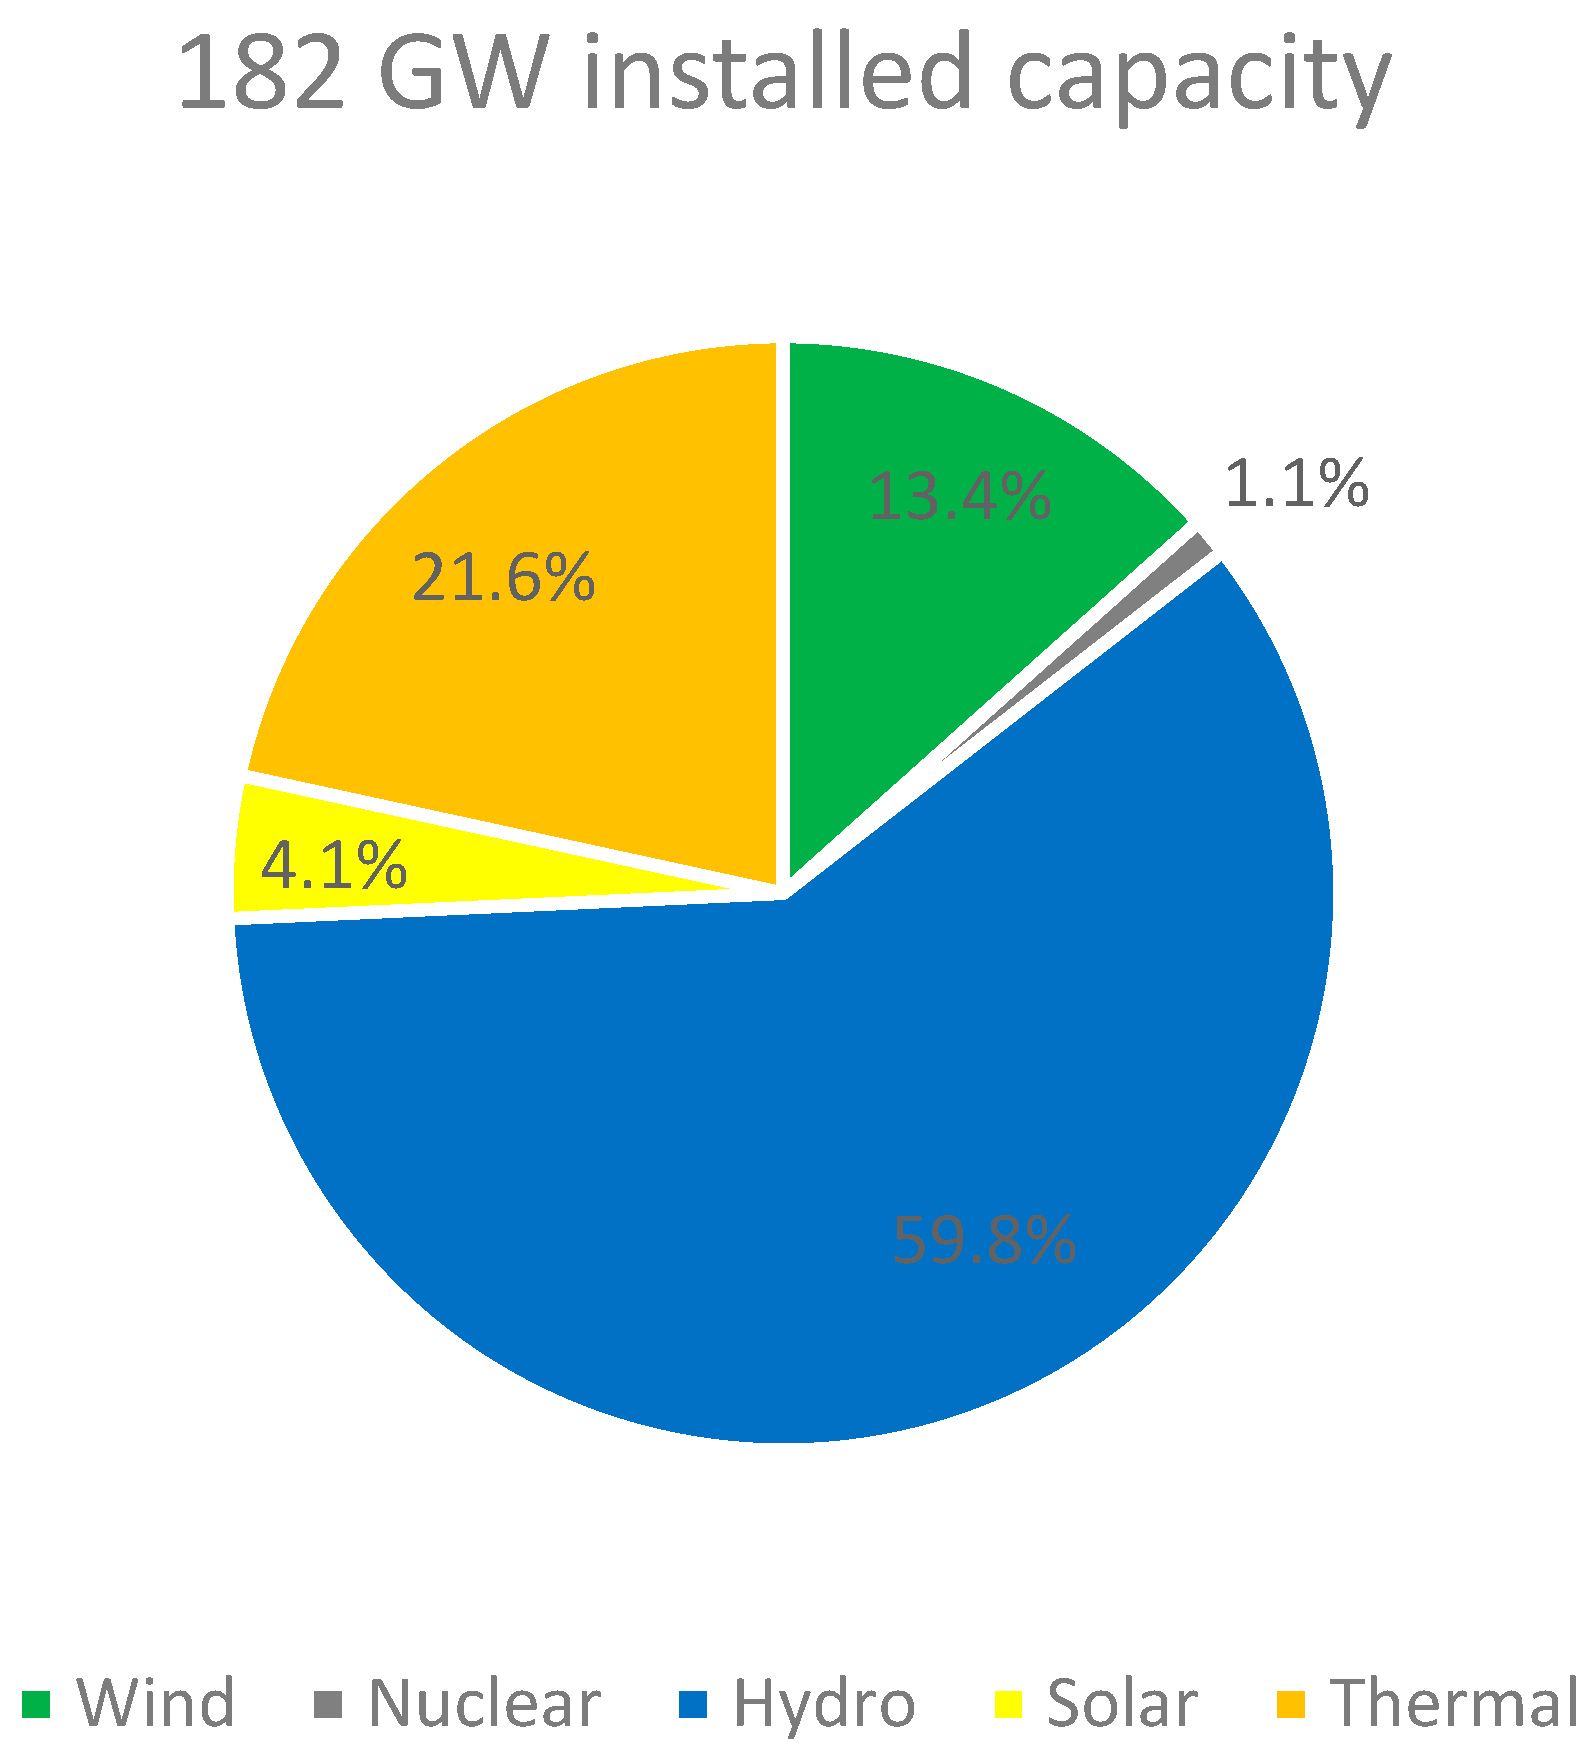
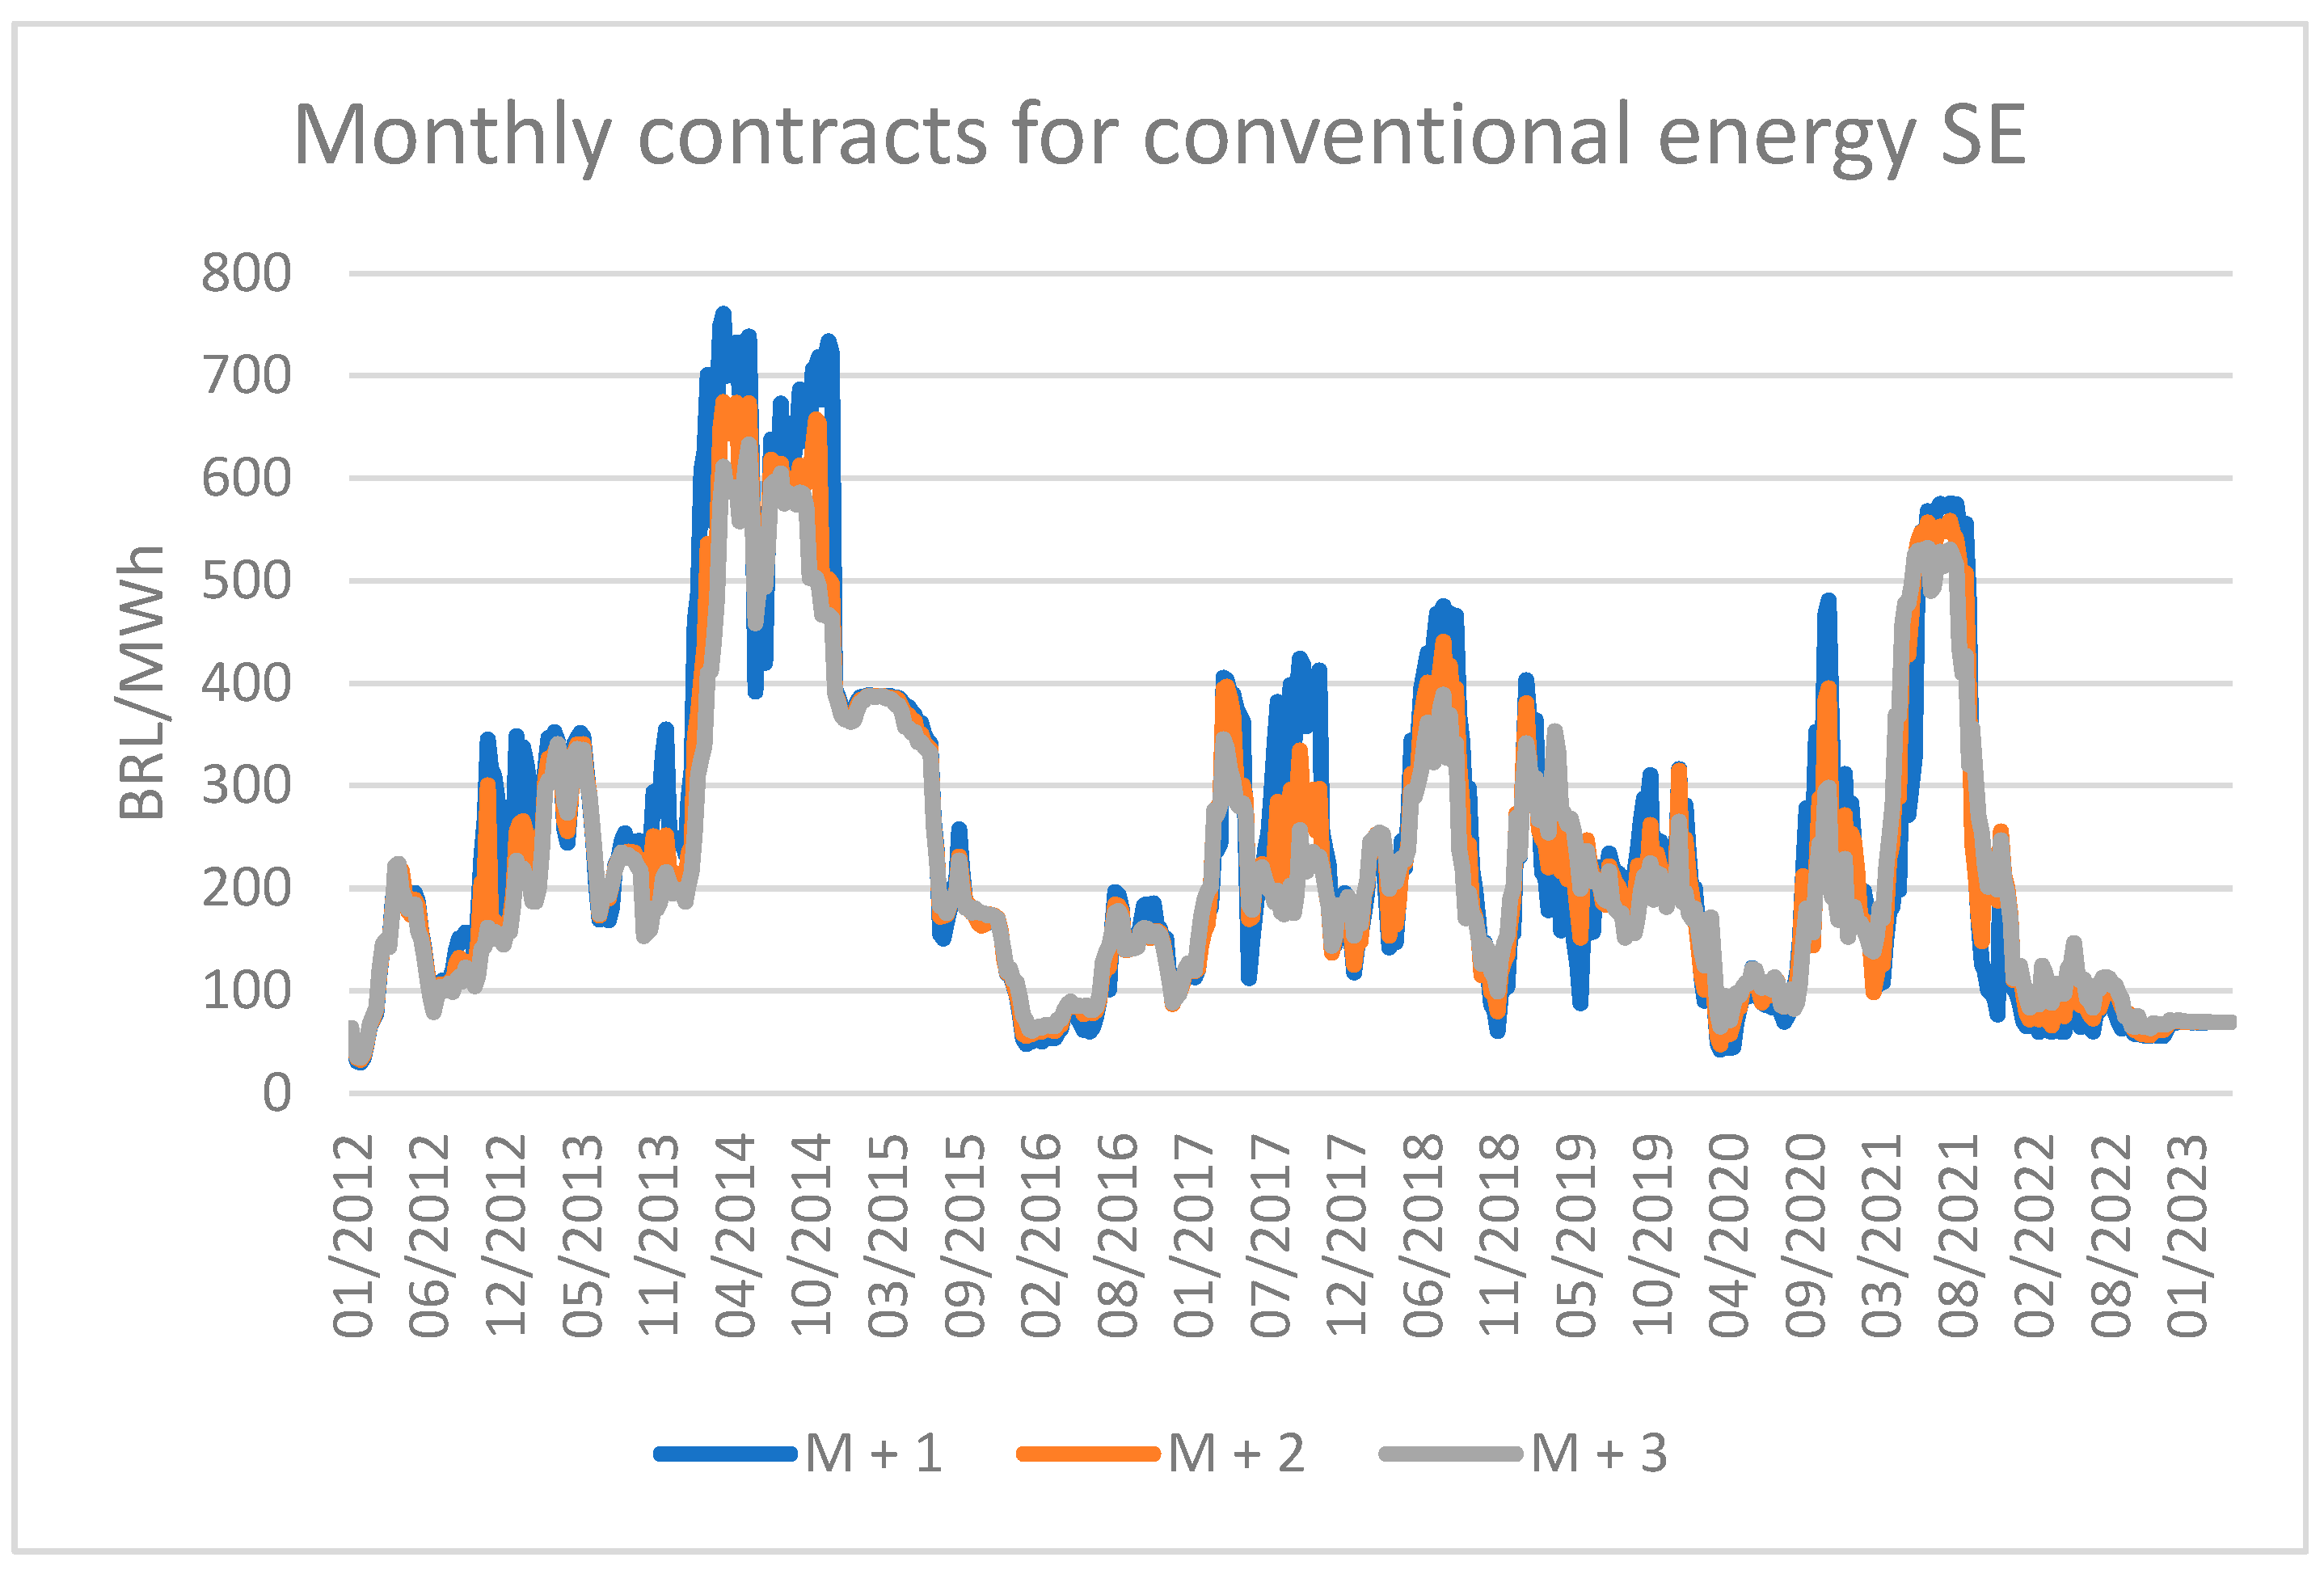
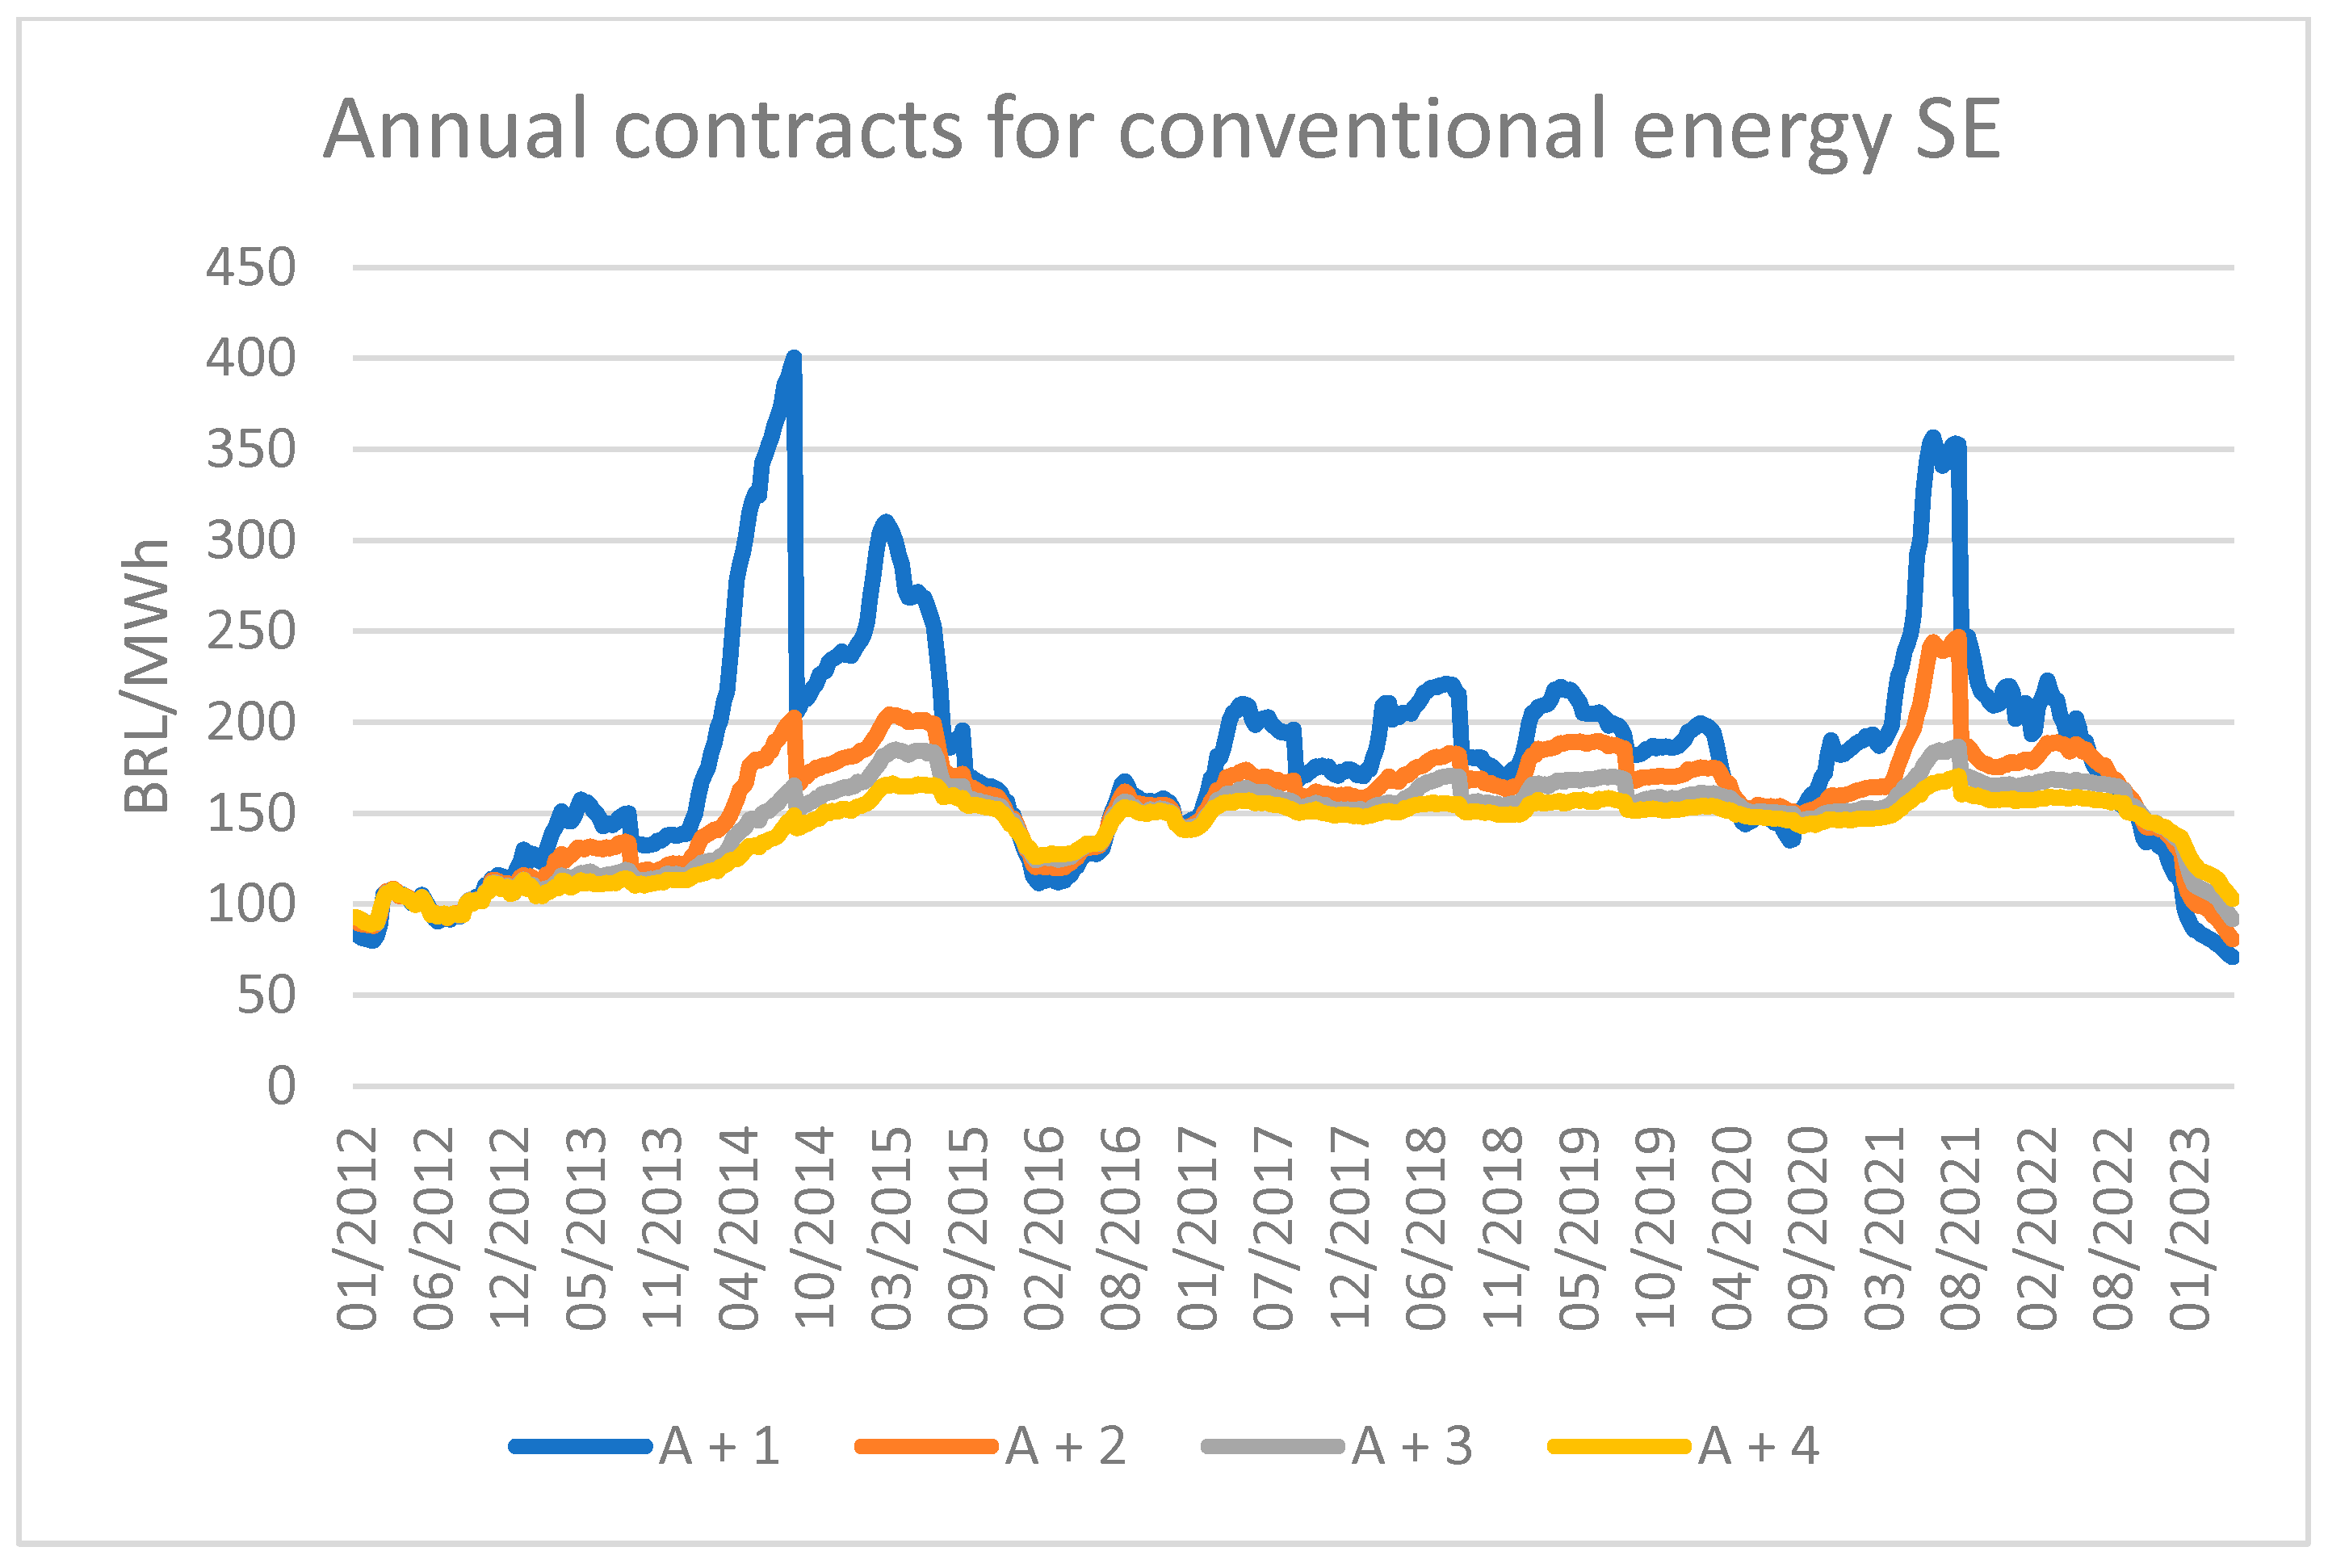
- Conventional power, derived from large hydro and thermal technologies.
- Incentivized power, generated from renewable sources, injecting up to 50 MW of power into the grid. Generators and consumers purchasing power from small renewables may benefit from a transportation tariff discount, up to 100% in some cases, but generally 50%. Incentivized energy has a lower liquidity, and it is commonly traded as a SWAP for conventional energy.
4. Market Data
5. Results
- Average forward prices: The rationale behind using average forward prices is rooted in the Efficient Market Hypothesis (EMH), which posits that all available information is already incorporated into asset prices. Averaging these prices over a period provides a stable and reliable estimate of market expectations, especially useful in volatile markets. This approach is particularly beneficial for capturing long-term market trends and is often used in risk management and investment decisions.
- Last observed forward prices: On the other hand, the use of the last observed forward prices aligns with the semi-strong form of market efficiency, which suggests that asset prices adjust quickly to new public information. This method is valuable for capturing short-term market sentiments and is crucial for real-time risk assessment and trading strategies.
5.1. Methodology
5.1.1. Objective
5.1.2. Data Collection
5.1.3. Calculation of Average Forward Prices
5.1.4. Calculation of Average Spot Prices
5.1.5. Risk Premium Calculation
5.1.6. Using Last Observed Forward Price
5.2. Average Forward Prices and Risk Premiums
5.3. Last Observed Forward Prices and Risk Premiums
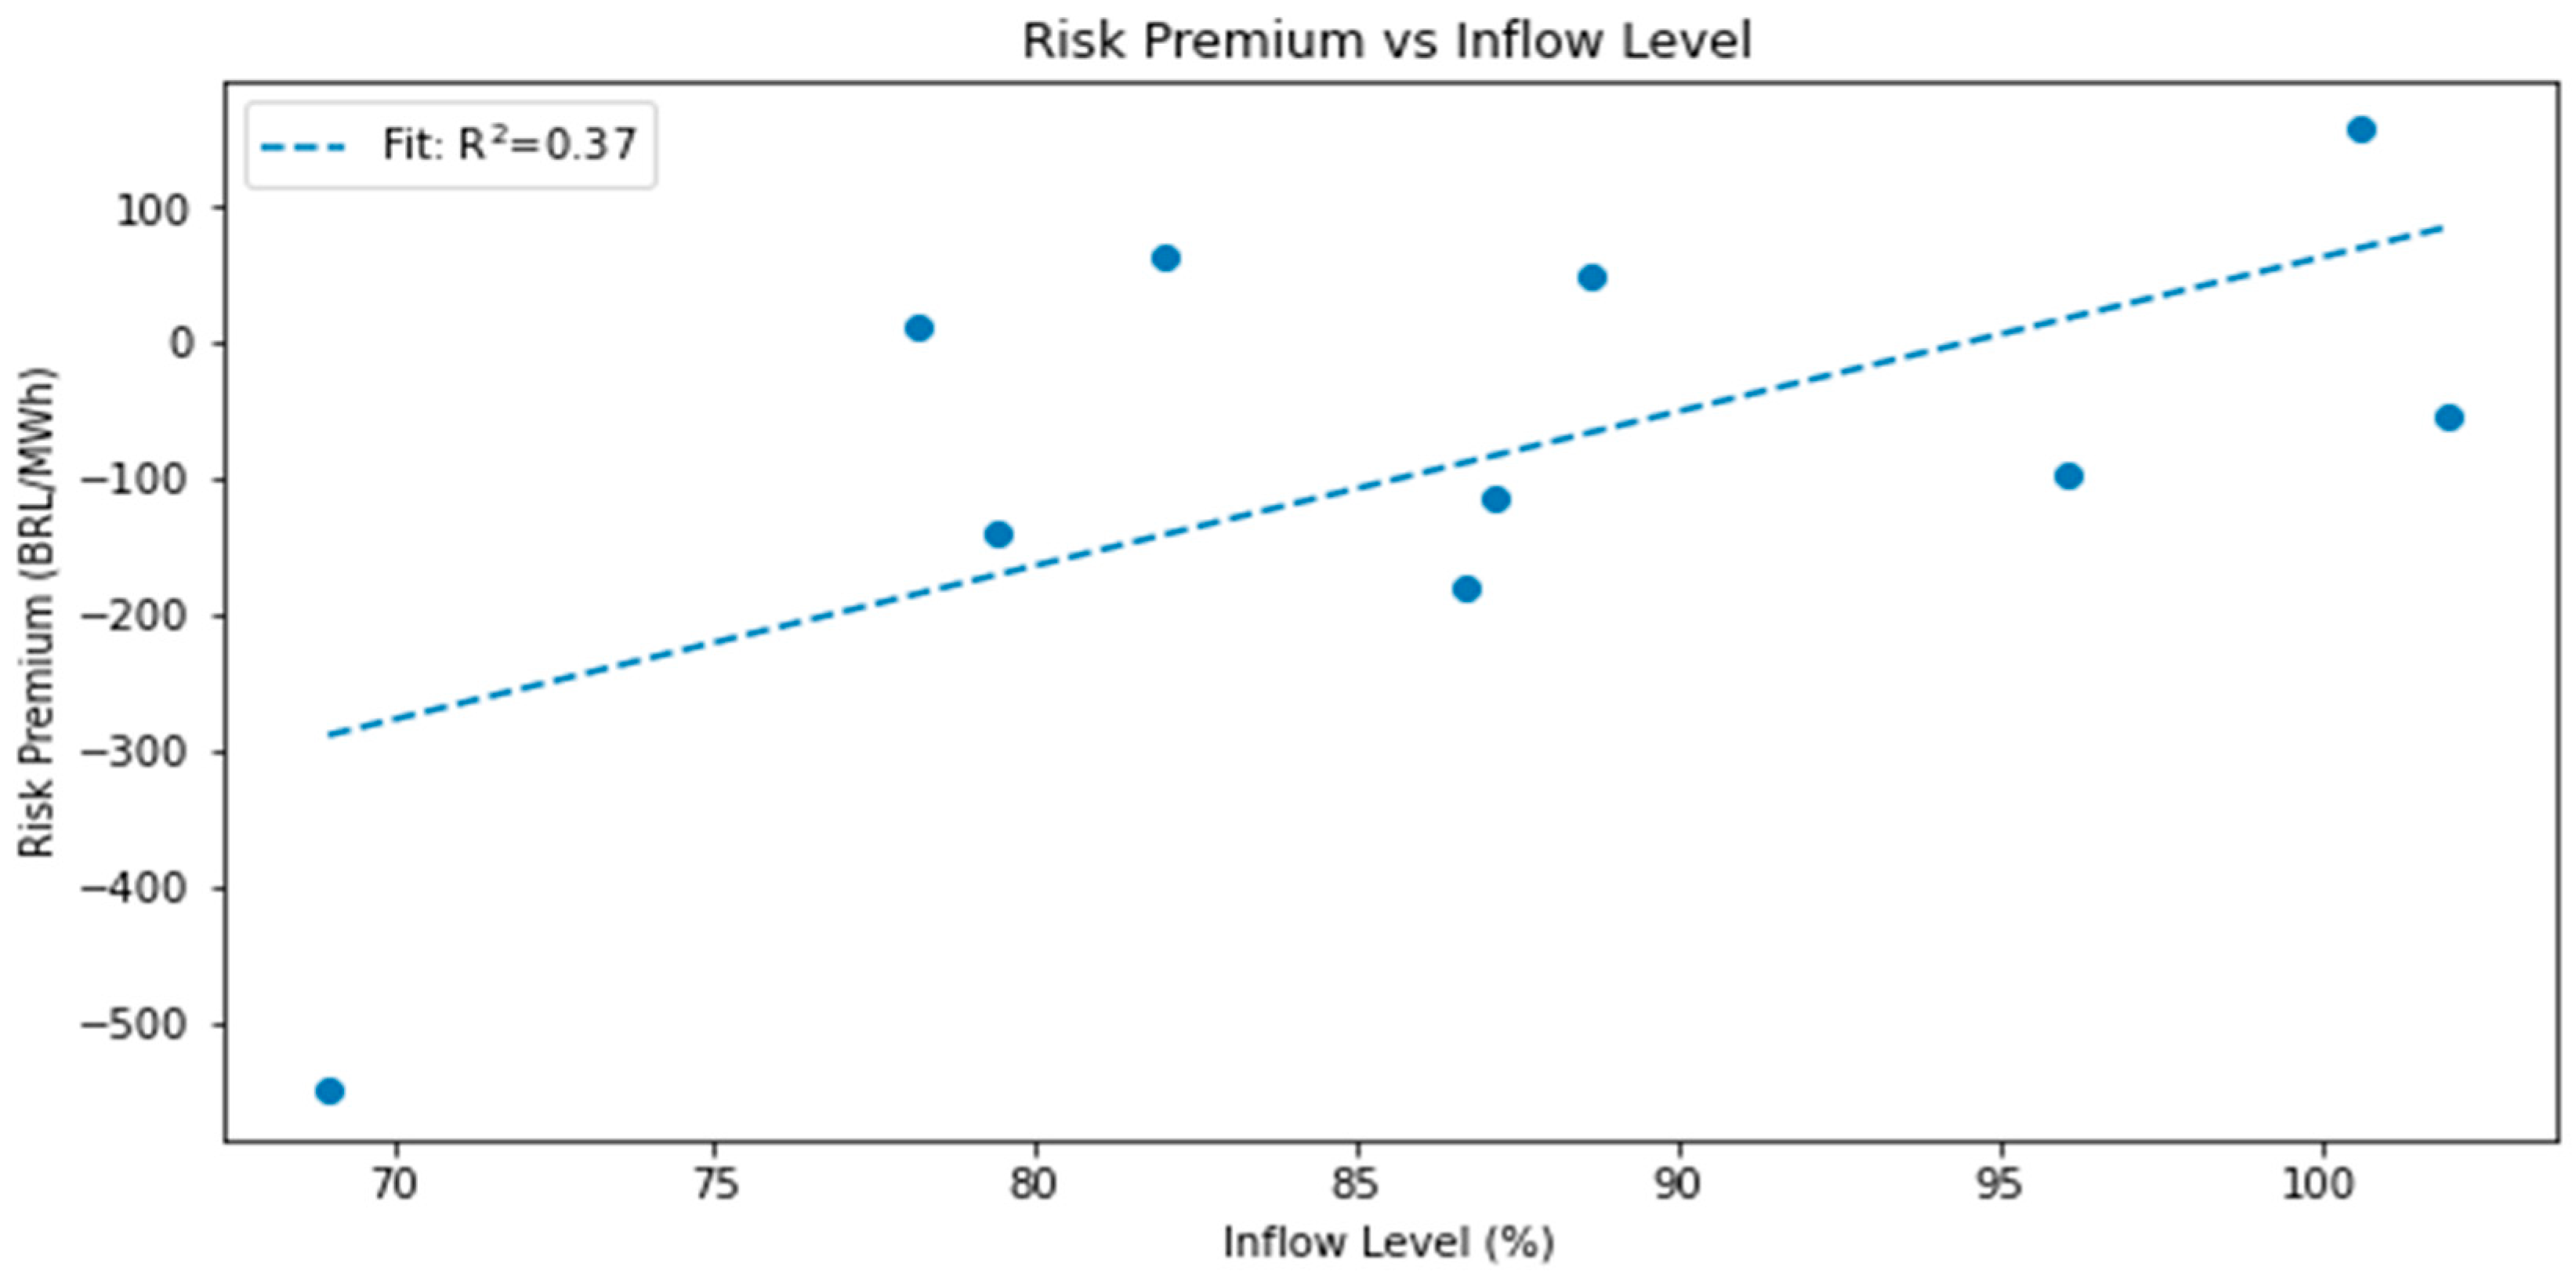
5.4. Assessment of Forward Prices and Risk Premiums
6. Discussion
6.1. Factors Contributing to Risk Premiums
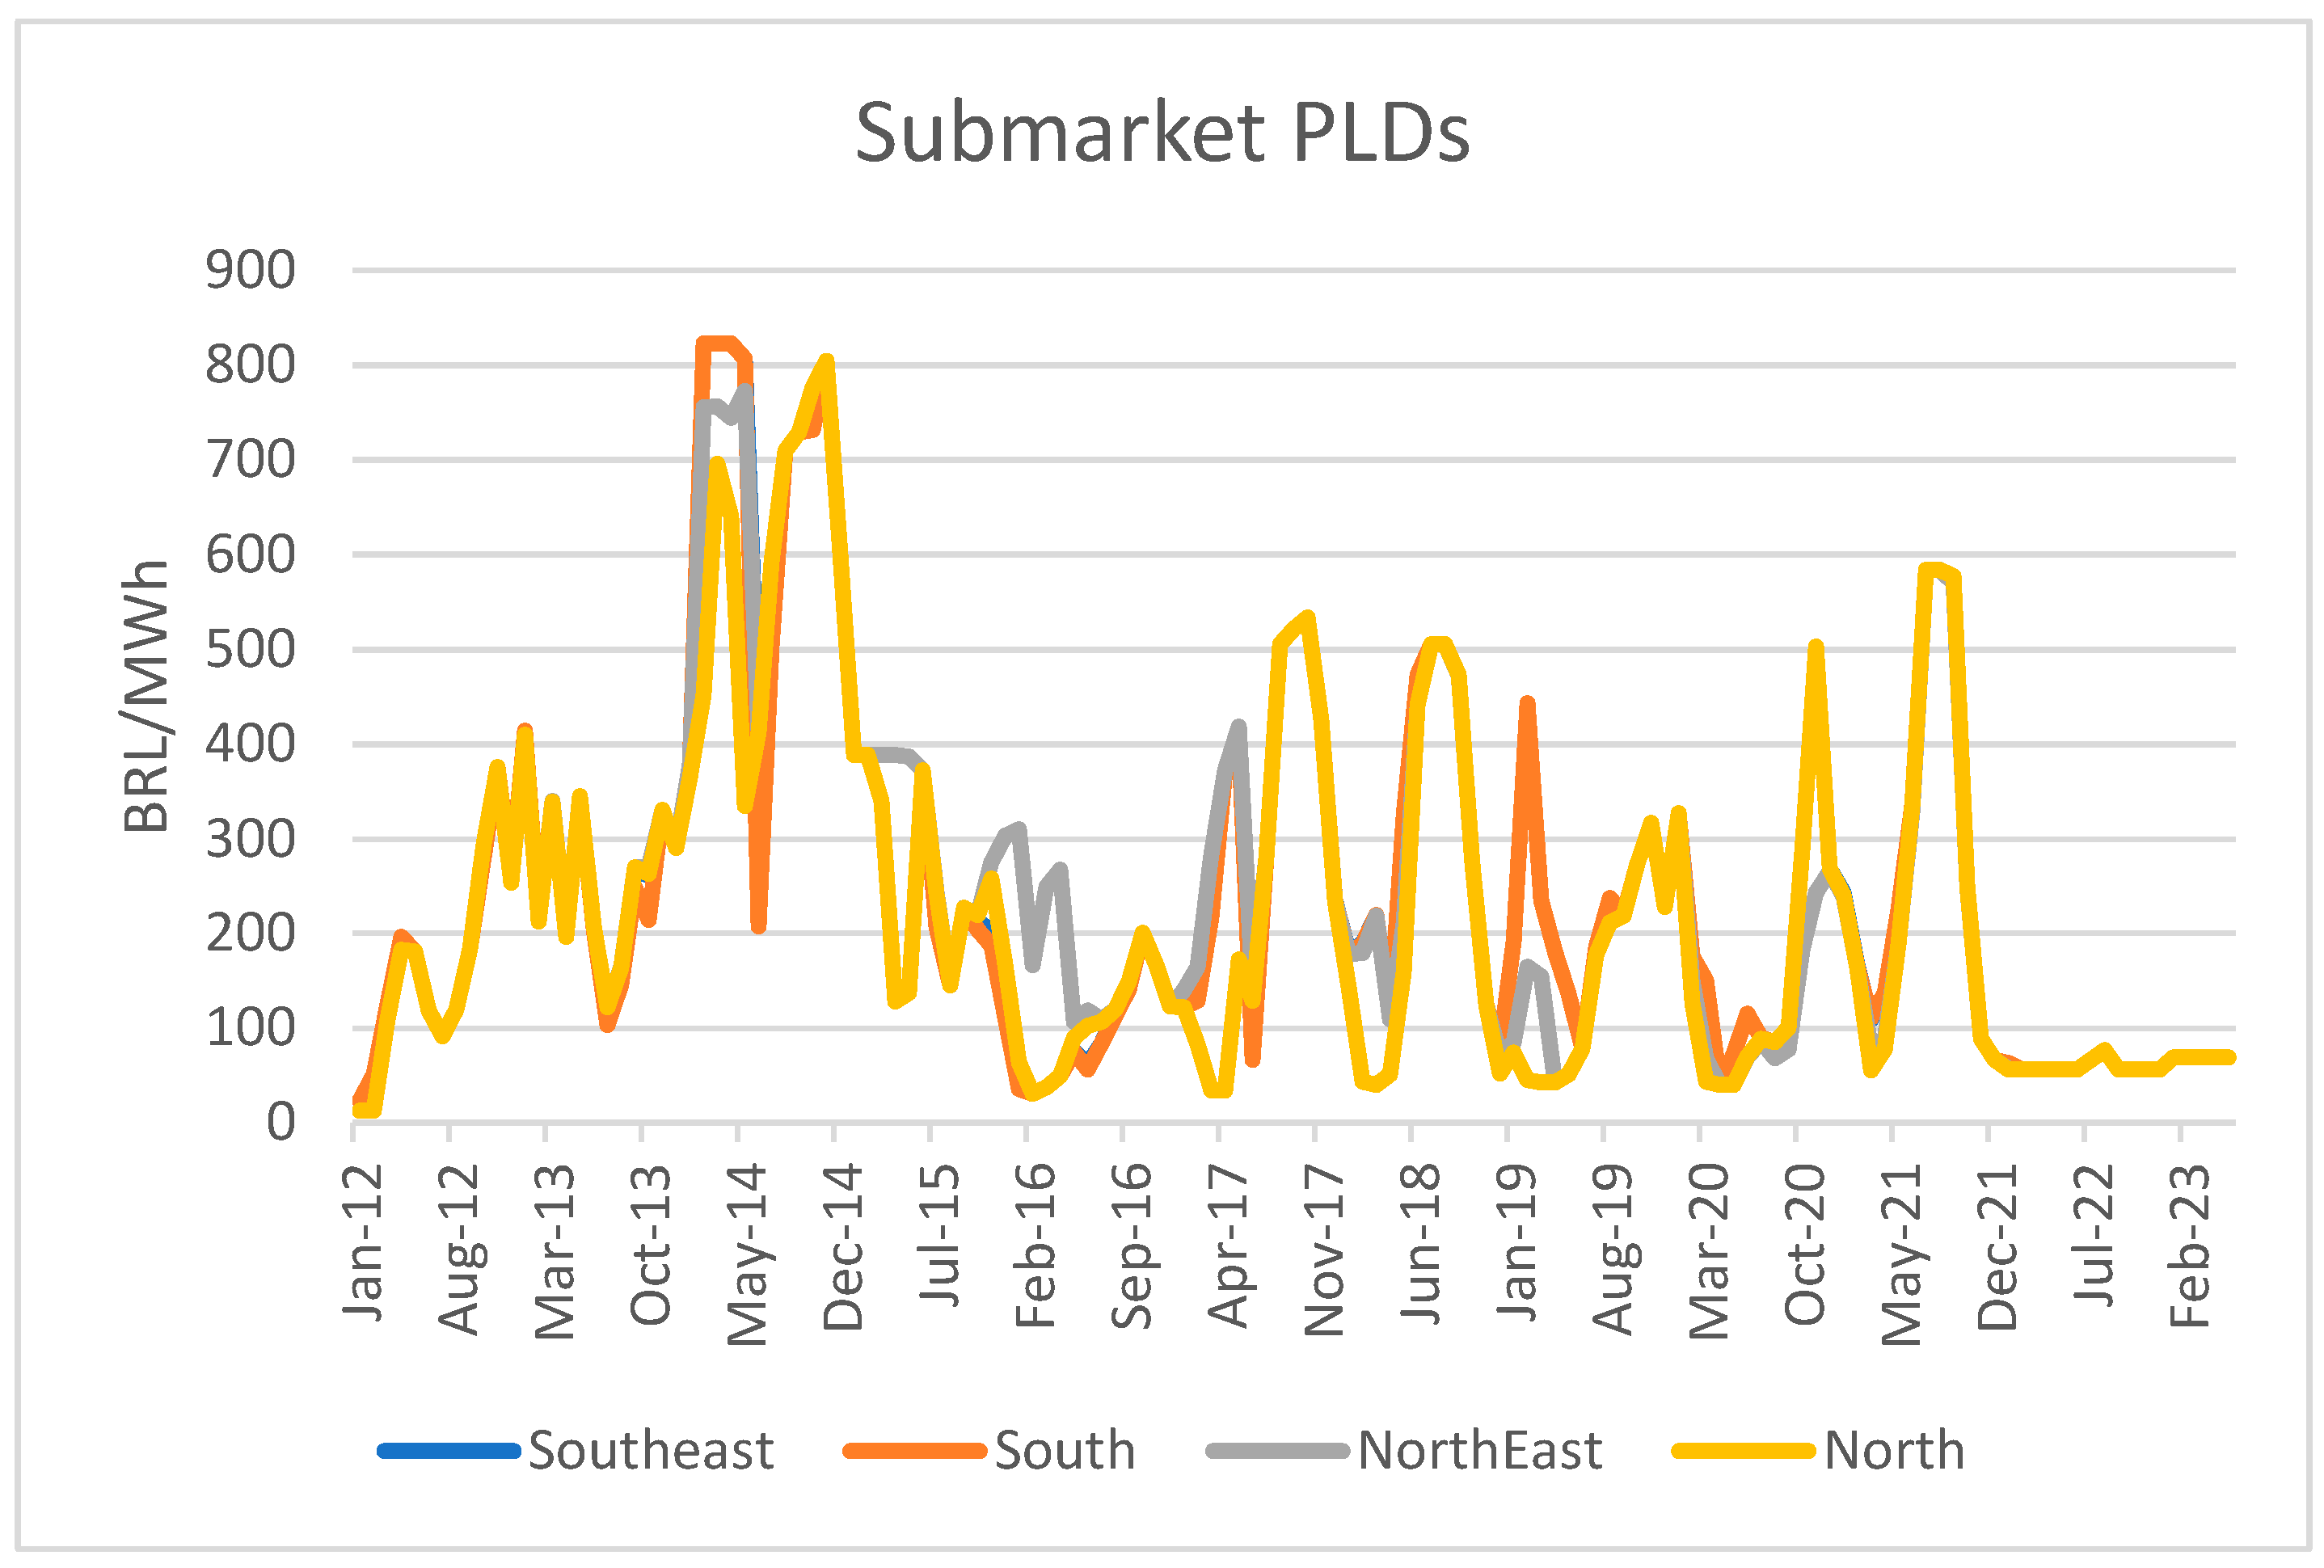
6.2. Evolution of Risk Premiums over Time
6.3. Implications for Market Participants and Policymakers
7. Conclusions
Funding
Institutional Review Board Statement
Data Availability Statement
Conflicts of Interest
Abbreviations
| A | Year |
| ACR | ‘Ambiente de Contratação Regulada’, which translates to the Regulated Contracting Environment |
| ACL | ‘Ambiente de Contratação Livre’, which translates to Free Contracting Environment |
| CCEE | ‘Câmara de Comercialização de Energia Elétrica’, or the Electric Energy Trading Chamber |
| GW | Gigawatt |
| M | month |
| MWh | Megawatthour |
| N | North |
| NE | Northeast |
| ONS | ‘Operador Nacional do Sistema Elétrico’, or the National Electric System Operator |
| PLD | ‘Preço de Liquidação das Diferenças’, or the Settlement Price for Differences |
| PPA | Power Purchase Agreement |
| S | South |
| SE | Southeast |
Appendix A


References
- Huisman, R.; Mahieu, R. Regime jumps in electricity prices. Energy Econ. 2003, 25, 425–434. [Google Scholar] [CrossRef]
- Benth, F.E.; Koekebakker, S. Stochastic Modeling of Electricity and Related Markets; World Scientific: Singapore, 2008. [Google Scholar]
- Botterud, A.; Kristiansen, T.; Ilic, M.D. The relationship between spot and futures prices in the Nord Pool electricity market. Energy Econ. 2010, 32, 967–978. [Google Scholar] [CrossRef]
- Weron, R. Electricity price forecasting: A review of the state-of-the-art with a look into the future. Int. J. Forecast. 2014, 30, 1030–1081. [Google Scholar] [CrossRef]
- Benth, F.E.; Ortiz-Latorre, S. A pricing measure to explain the risk premium in power markets. arXiv 2013, arXiv:1308.3378. [Google Scholar] [CrossRef]
- Janczura, J. Pricing electricity derivatives within a Markov regime-switching model. arXiv 2012, arXiv:1203.5442. [Google Scholar]
- Benth, F.E.; Klüppelberg, C.; Müller, G.; Vos, L. Futures pricing in electricity markets based on stable CARMA spot models. arXiv 2012, arXiv:1201.1151. [Google Scholar] [CrossRef]
- Jacobs, K.; Li, Y.; Pirrong, C. Supply, Demand, and Risk Premiums in Electricity Markets. J. Bank. Financ. 2022, 135, 106390. [Google Scholar] [CrossRef]
- Wei, W.; Lunde, A. Identifying Risk Factors and Their Premia: A Study on Electricity Prices. J. Financ. Econom. 2022, nbac019. [Google Scholar] [CrossRef]
- Gontijo, T.S.; Costa, M.A.; Barbosa de Santis, R. Electricity price forecasting on electricity spot market: A case study based on the Brazilian Difference Settlement Price. In Proceedings of the International Conference on Renewable Energy (ICREN 2020), Rome, Italy, 25–27 November 2021; Volume 239. [Google Scholar]
- Santos, M.R.; Braz, D.D.C.; Carvalho, A.C.P.L.F.; Tinós, R.; Paula, M.B.S.; Doretto, G.; Guarnier, E.; Silva Filho, D.S.; Suiama, D.Y.; Ferreira, L.E.; et al. Machine Learning Approach for Trend Prediction to Improve Returns on Brazilian Energy Market. In Proceedings of the IEEE Latin American Conference on Computational Intelligence (LA-CCI), Montevideo, Uruguay, 23–25 November 2022. [Google Scholar]
- Luz, C.P.d.M.S.; Gomes, L.L.; Brandão, L.E.T. Analysis of the Dynamics of the Brazilian Forward Market of Electricity. Rev. Bus. Manag. 2012, 14, 314–334. [Google Scholar] [CrossRef][Green Version]
- Belançon, M.P. Brazil electricity needs in 2030: Trends and challenges. arXiv 2020, arXiv:2009.11281. [Google Scholar] [CrossRef]
- Mork, E. The dynamics of risk premiums in Nord Pool’s futures market. Energy Stud. Rev. 2006, 14, 170–185. [Google Scholar] [CrossRef]
- Lucia, J.J.; Torró, H. On the risk premium in Nordic electricity futures prices. Int. Rev. Econ. Financ. 2011, 20, 750–763. [Google Scholar] [CrossRef]
- Haugom, E.; Hoff, G.A.; Mortensen, M.; Molnar, P.; Westgaard, S. The forward premium in Nord Pool power market. Emerg. Mark. Financ. Trade 2018, 54, 1793–1807. [Google Scholar] [CrossRef]
- Fleten, S.E.; Hagen, L.A.; Nygard, M.T.; Smith-Sivertsen, R.; Sollie, J.M. The overnight risk premium in electricity forward contracts. Energy Econ. 2015, 49, 293–300. [Google Scholar] [CrossRef]
- Smith-Meyer, E.; Gjolberg, O. The Nordic futures market for power: Finally mature and efficient? J. Energy Mark. 2016, 9, 1–15. [Google Scholar] [CrossRef]
- ONS. Available online: https://www.ons.org.br/ (accessed on 4 July 2023).
- Agora Energiwende. Report on the Brazilian Power System. Available online: https://www.agora-energiewende.de/fileadmin/Projekte/2019/Brazil_Country_Profile/155_CountryProf_Brazil_EN_WEB.pdf (accessed on 1 September 2019).
- Dcide. Available online: https://www.dcide.com.br/ (accessed on 4 July 2023).
- CCEE. Available online: https://www.ccee.org.br/web/guest/precos/painel-precos (accessed on 4 July 2023).
- Viehmann, J. Risk premiums in the German day-ahead Electricity Market. Energy Policy 2011, 39, 386–394. [Google Scholar] [CrossRef]
- Bunn, D.W.; Chen, D. The forward premium in electricity futures. J. Empir. Financ. 2013, 23, 173–186. [Google Scholar] [CrossRef]
- Magalhães, B.G.; Bento, P.M.R.; Pombo, J.A.N.; Calado Mariano, S.J.P.S. Spot price forecasting for best trading strategy decision support in the Iberian electricity market. Expert Syst. Appl. 2023, 224, 120059. [Google Scholar] [CrossRef]
- Bonaldo, C.; Caporin, M.; Fontini, F. The relationship between day-ahead and future prices in electricity markets: An empirical analysis on Italy, France, Germany, and Switzerland. Energy Econ. 2022, 110, 105977. [Google Scholar] [CrossRef]

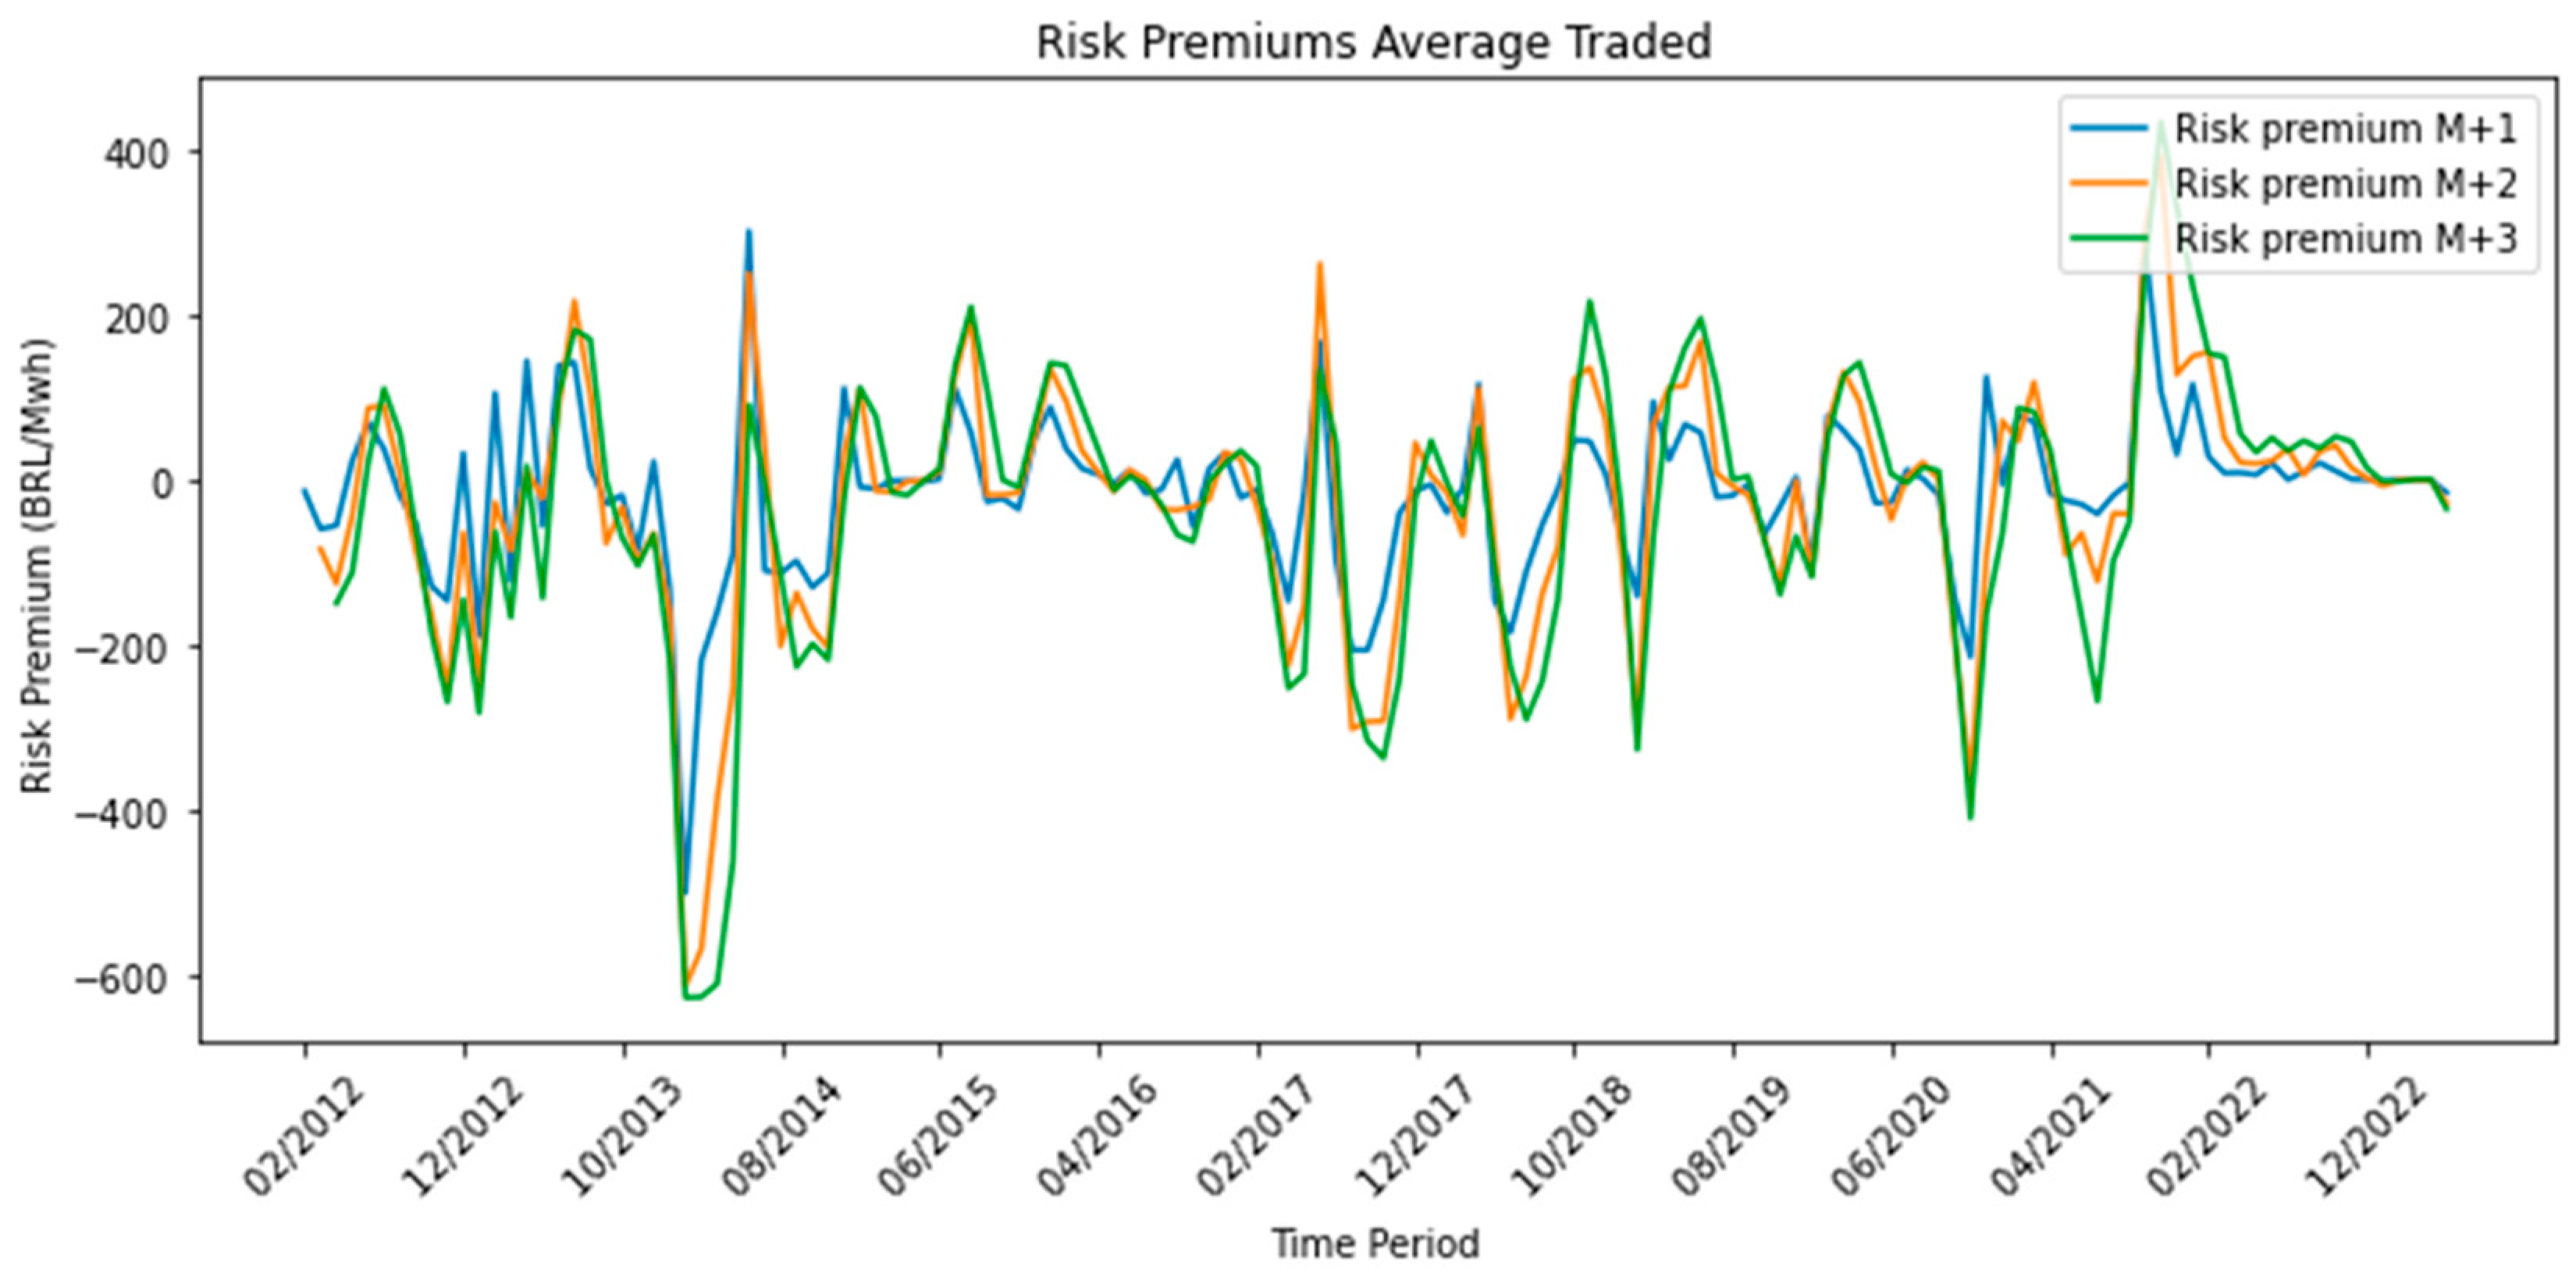
| Delivery Period | Forward Price M + 1 | PLD | Price Difference (Forward − PLD M + 1) | Forward Price M + 2 | PLD | Price Difference (Forward − PLD M + 2) | Forward Price M + 3 | PLD | Price Difference (Forward − PLD M + 3) |
|---|---|---|---|---|---|---|---|---|---|
| 2012 | 151.64 | 179.68 | −28.05 | 129.79 | 192.9 | −62.80 | 119.13 | 200.10 | −80.97 |
| 2013 | 268.42 | 262.54 | 5.88 | 242.76 | 262.54 | −19.78 | 227.69 | 262.54 | −34.85 |
| 2014 | 586.44 | 690.00 | −103.56 | 492.54 | 690.00 | −197.46 | 421.67 | 690.00 | −268.33 |
| 2015 | 297.52 | 288.11 | 9.4 | 322.71 | 288.11 | 34.60 | 345.32 | 288.11 | 57.2 |
| 2016 | 105.29 | 93.91 | 11.38 | 108.44 | 93.91 | 14.52 | 113.68 | 93.91 | 19.76 |
| 2017 | 256.89 | 323.04 | −66.15 | 222.26 | 323.04 | −100.78 | 195.22 | 323.04 | −127.81 |
| 2018 | 259.64 | 287.83 | −28.19 | 249.76 | 287.83 | −38.07 | 244.88 | 287.83 | −42.95 |
| 2019 | 218.43 | 227.10 | −8.67 | 215.17 | 227.10 | −11.93 | 216.14 | 227.10 | −10.96 |
| 2020 | 159.01 | 177.00 | −17.99 | 137.66 | 177.00 | −39.33 | 140.52 | 177.00 | −36.47 |
| 2021 | 315.65 | 279.61 | 36.05 | 339.98 | 279.61 | 60.37 | 323.00 | 279.61 | 43.39 |
| 2022 | 78.57 | 58.99 | 19.59 | 105.55 | 58.99 | 46.56 | 135.15 | 58.99 | 76.16 |
| 2023 | 68.72 | 69.04 | −0.32 | 67.51 | 69.04 | −1.53 | 68.78 | 69.04 | −0.26 |
| mean | 230.52 | 244.74 | −14.22 | 219.51 | 245.81 | −26.30 | 212.60 | 246.44 | −33.84 |
| min | 37.27 | 30.42 | −498.68 | 41.88 | 30.42 | −611.19 | 43.89 | 30.42 | −625.08 |
| max | 717.88 | 822.83 | 301.18 | 662.41 | 822.83 | 390.40 | 596.40 | 822.83 | 432.95 |
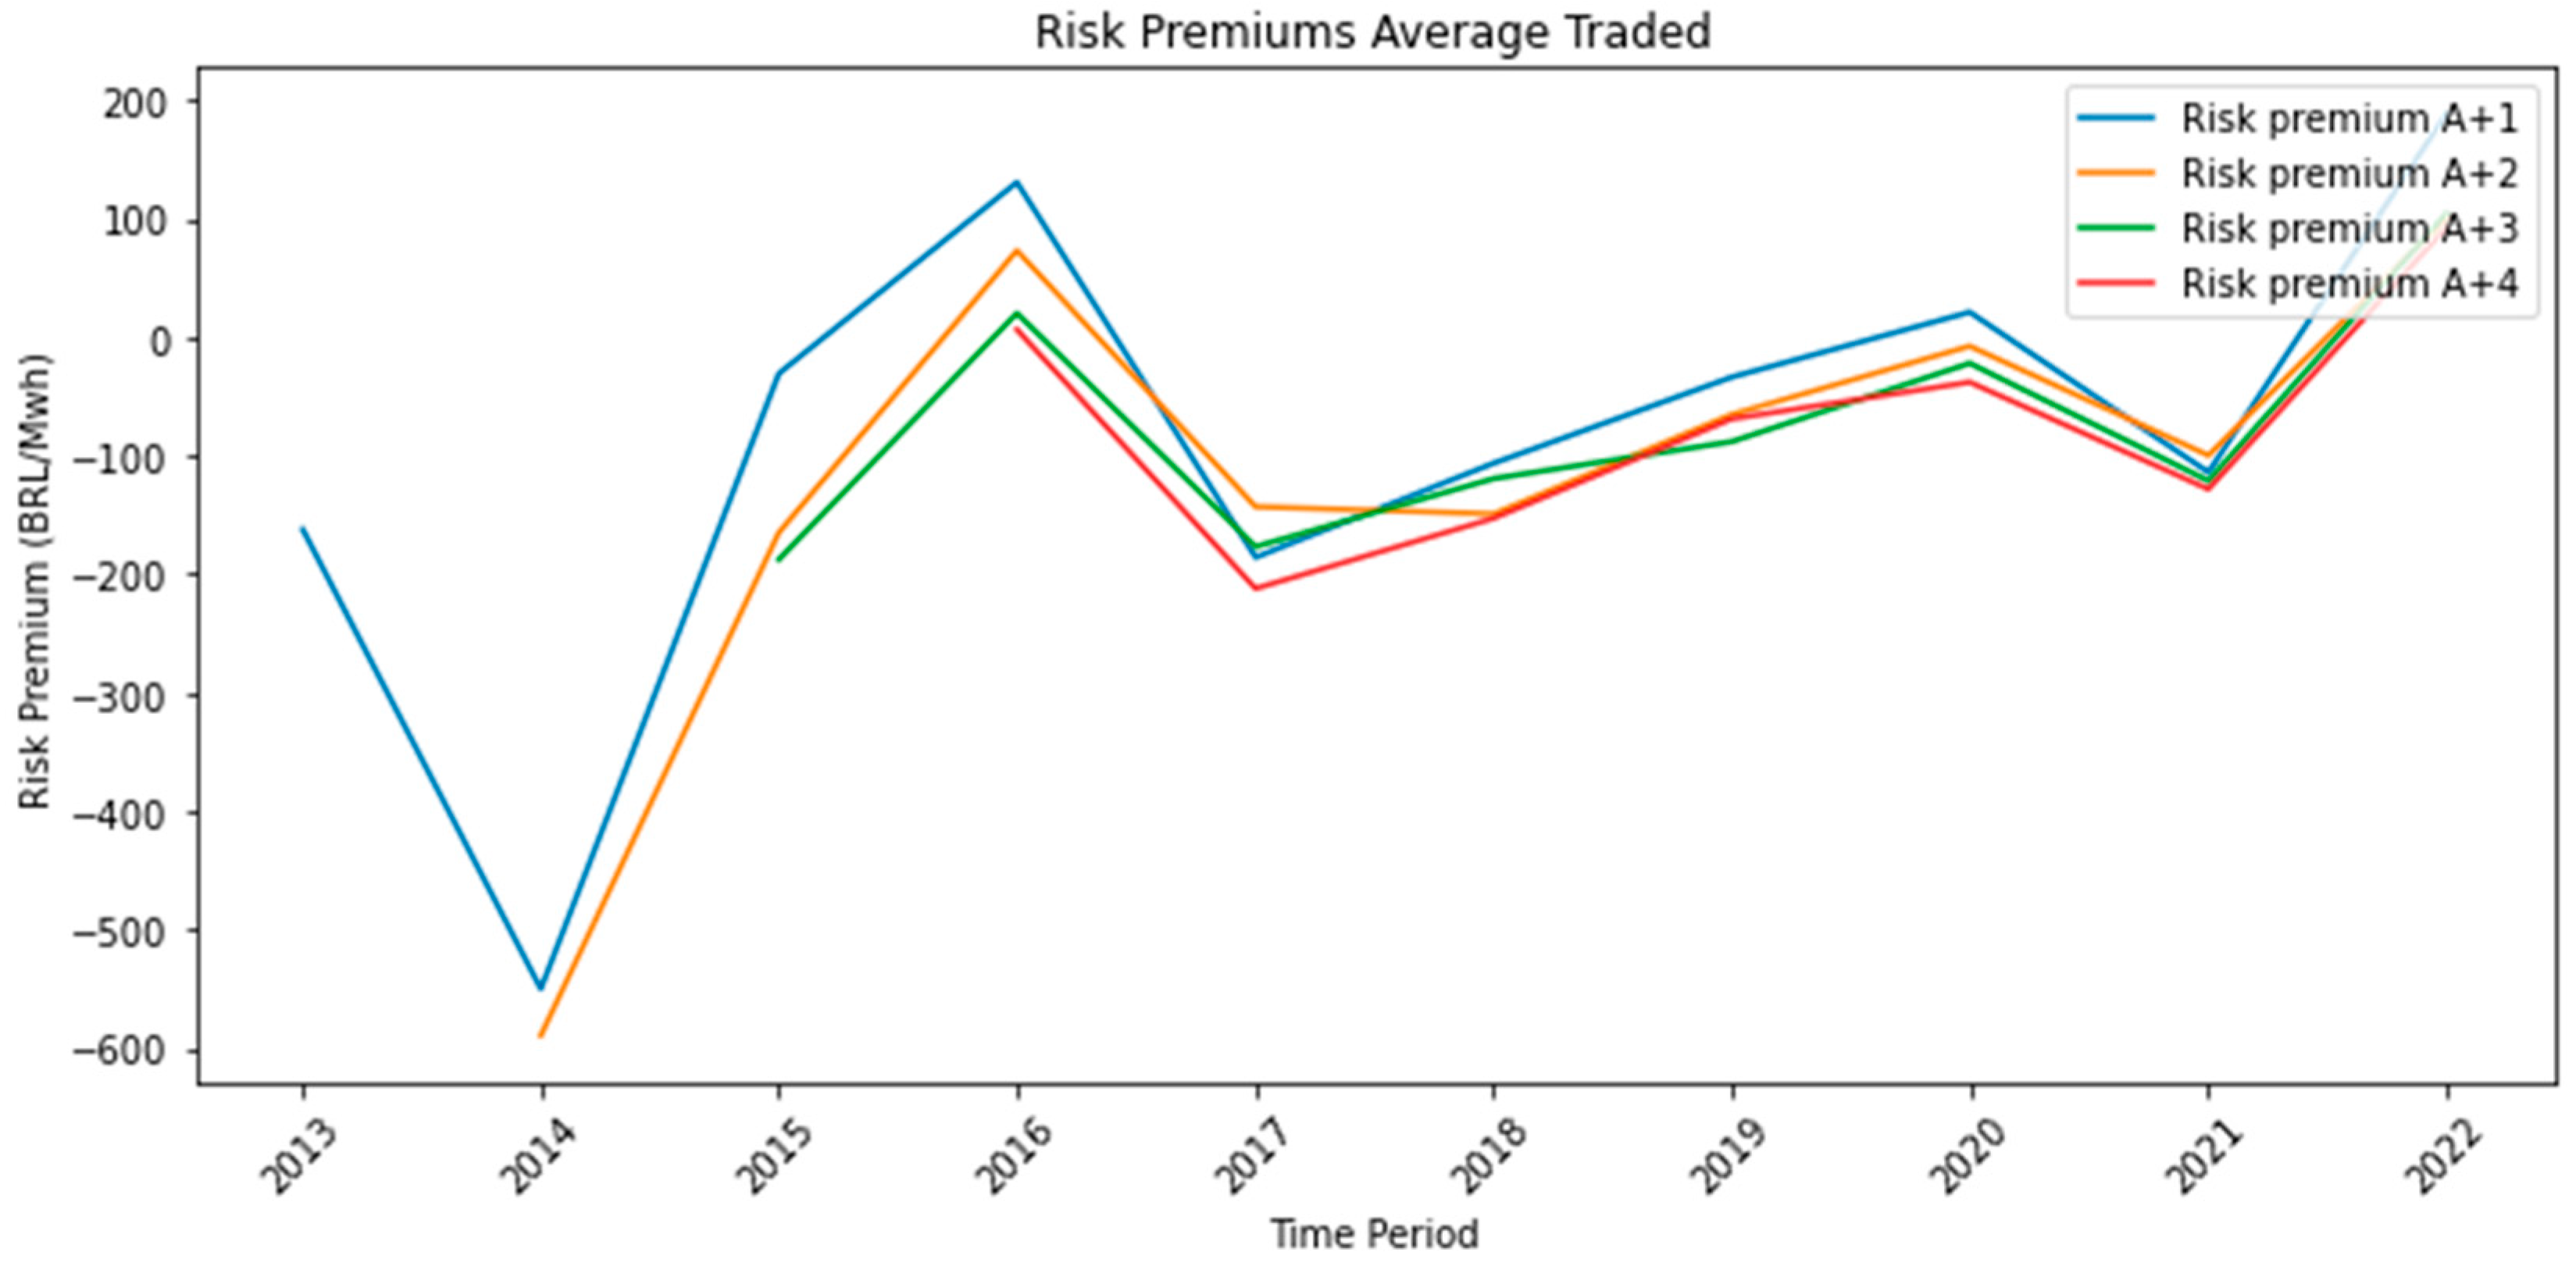
| Delivery Period | Forward Price A + 1 (BRL/MWh) | PLD (BRL/MWh) | Price Difference (Forward − PLD A + 1) (BRL/MWh) | Forward Price A + 2 (BRL/MWh) | PLD (BRL/MWh) | Price Difference (Forward − PLD A + 2) (BRL/MWh) | Forward Price A + 3 (BRL/MWh) | PLD (BRL/MWh) | Price Difference (Forward − PLD A + 3) (BRL/MWh) | Forward Price A + 4 (BRL/MWh) | PLD (BRL/MWh) | Price Difference (Forward − PLD A + 4) (BRL/MWh) |
|---|---|---|---|---|---|---|---|---|---|---|---|---|
| 2013 | 100.39 | 262.54 | −162.15 | |||||||||
| 2014 | 140.08 | 690.00 | −549.92 | 100.77 | 690.00 | −589.23 | ||||||
| 2015 | 257.52 | 288.11 | −30.59 | 123.35 | 288.11 | −164.77 | 100.56 | 288.11 | −187.55 | |||
| 2016 | 224.69 | 93.91 | 130.77 | 167.21 | 93.91 | 73.30 | 114.27 | 93.91 | 20.36 | 100.41 | 93.91 | 6.50 |
| 2017 | 137.26 | 323.04 | −185.77 | 179.98 | 323.04 | −143.06 | 146.32 | 323.04 | −176.72 | 110.99 | 323.04 | −212.04 |
| 2018 | 181.53 | 287.83 | −106.30 | 138.81 | 287.83 | −149.02 | 168.54 | 287.83 | −119.29 | 135.02 | 287.83 | −152.81 |
| 2019 | 193.47 | 227.10 | −33.63 | 161.97 | 227.10 | −65.13 | 139.01 | 227.10 | −88.09 | 158.18 | 227.10 | −68.92 |
| 2020 | 198.18 | 177.00 | 21.19 | 169.50 | 177.00 | −7.50 | 155.05 | 177.00 | −21.95 | 139.08 | 177.00 | −37.92 |
| 2021 | 165.68 | 279.61 | −113.93 | 179.94 | 279.61 | −99.67 | 158.51 | 279.61 | −121.10 | 151.44 | 279.61 | −128.16 |
| 2022 | 247.66 | 58.99 | 188.68 | 159.68 | 58.99 | 100.69 | 163.68 | 58.99 | 104.70 | 151.48 | 58.99 | 92.50 |
| mean | 184.65 | 268.81 | −84.17 | 153.47 | 269.51 | −116.04 | 143.24 | 216.95 | −73.70 | 135.23 | 206.78 | −71.55 |
| min | 100.39 | 58.99 | −549.92 | 100.77 | 58.99 | −589.23 | 100.56 | 58.99 | −187.55 | 100.41 | 58.99 | −212.04 |
| max | 257.52 | 690.00 | 188.68 | 179.98 | 690.00 | 100.69 | 168.54 | 323.04 | 104.70 | 158.18 | 323.04 | 92.50 |
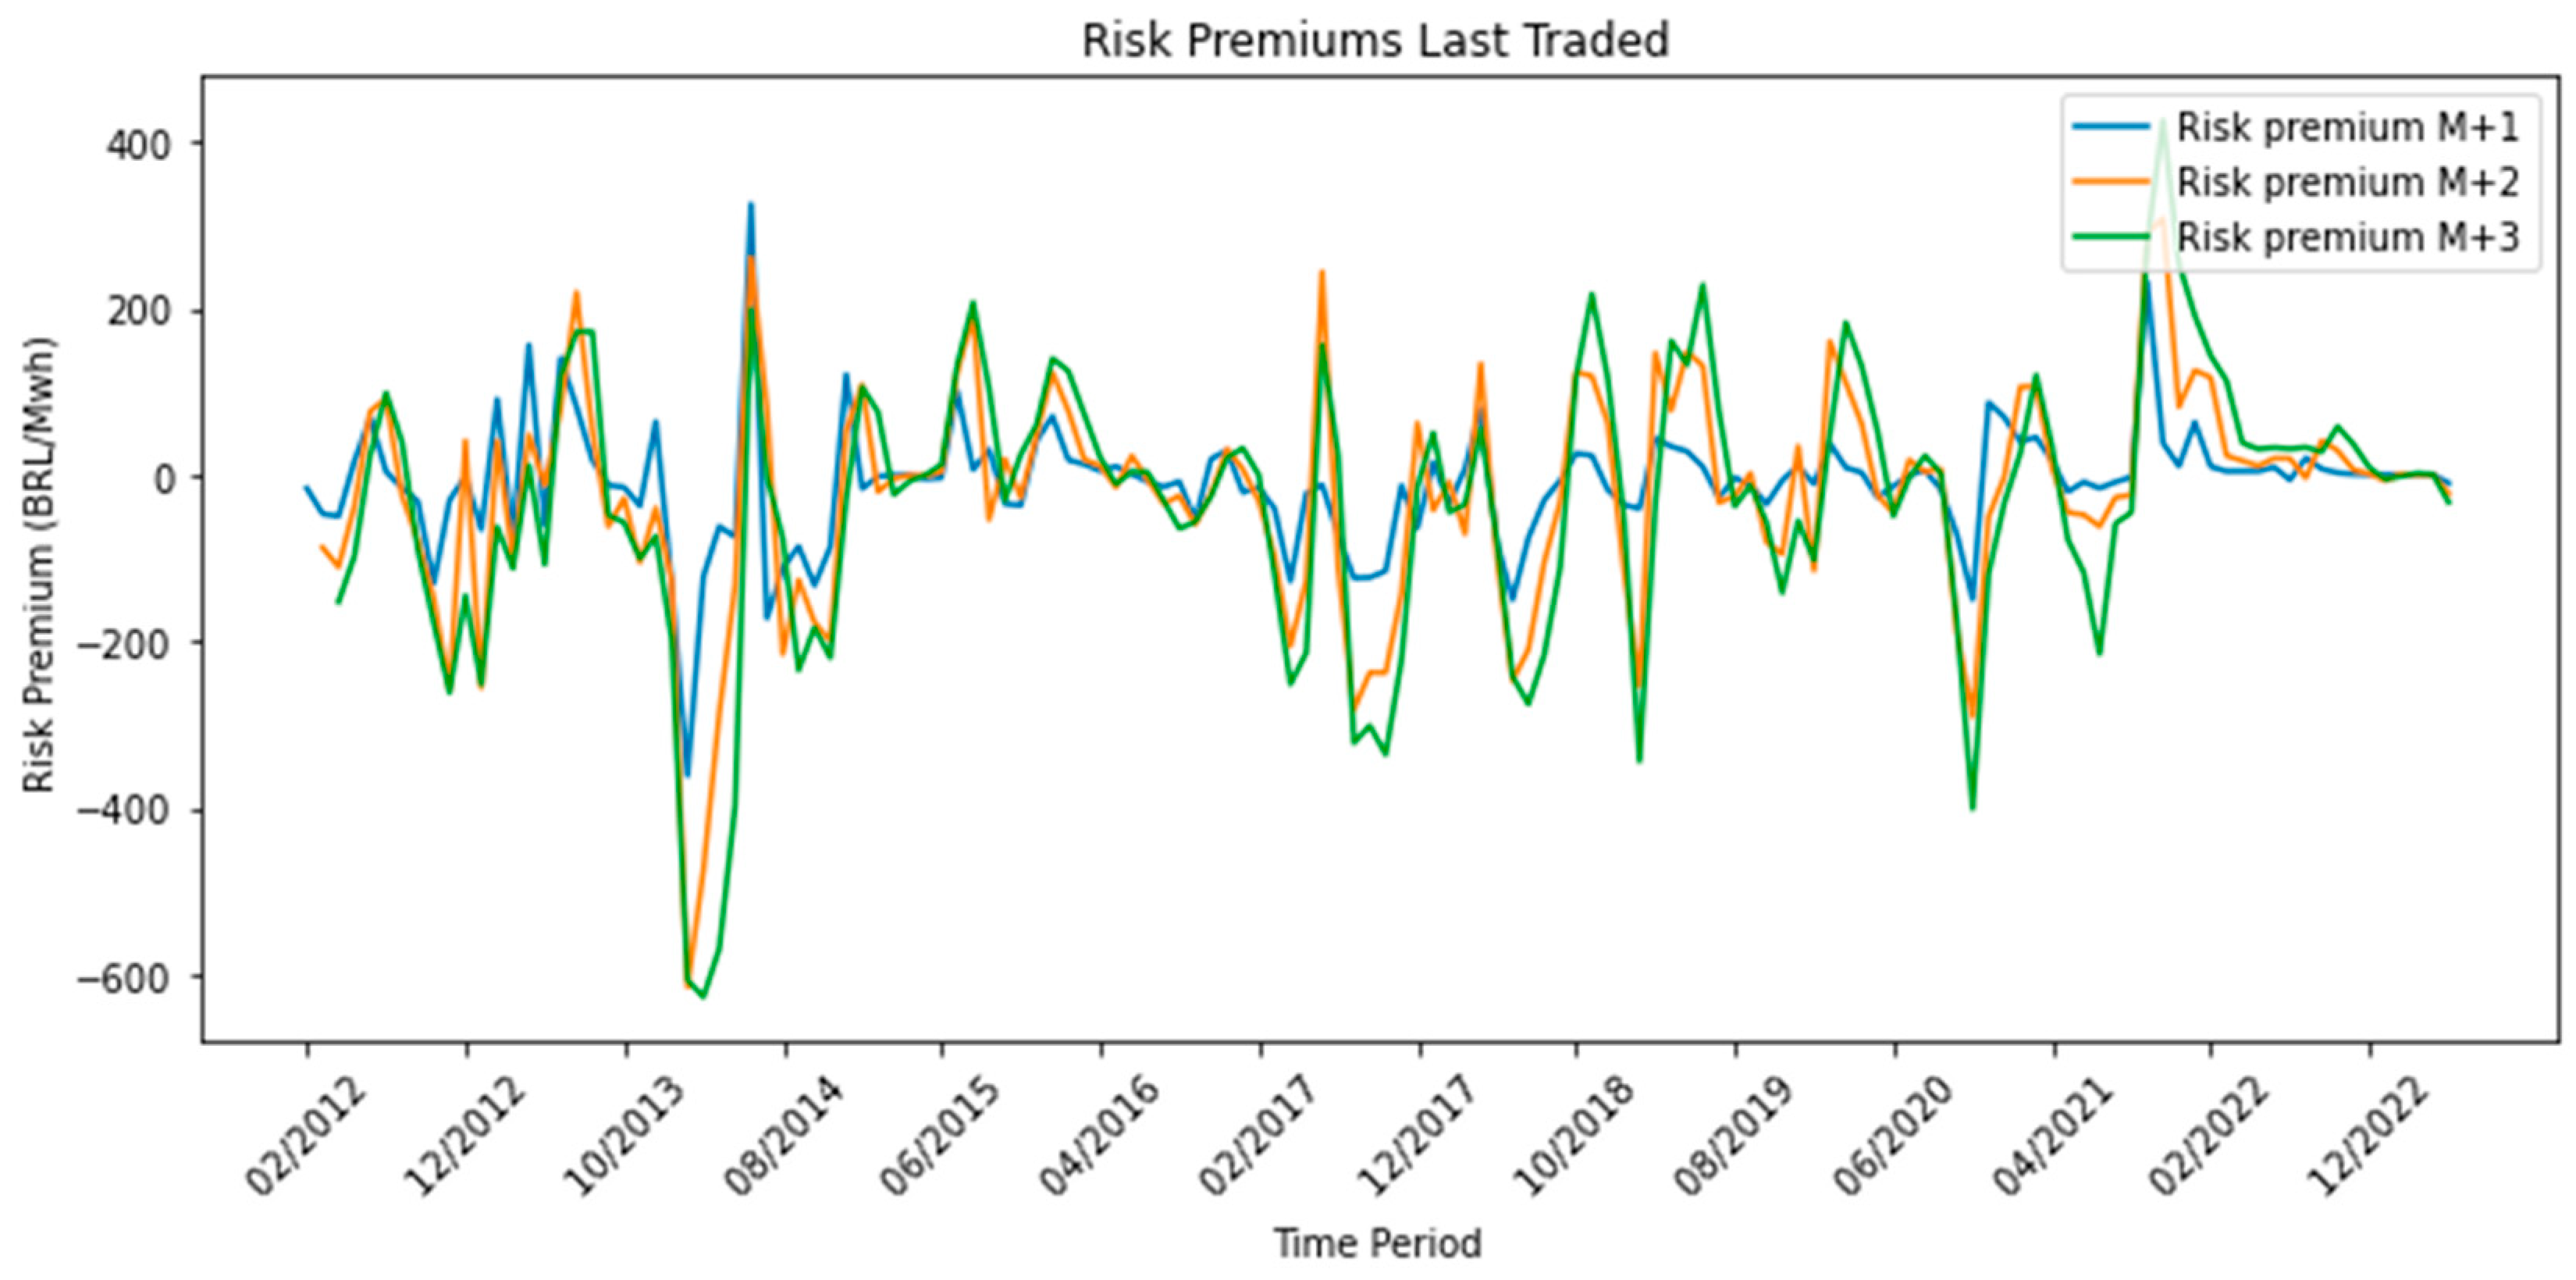
| Delivery Period | Forward Price M + 1 | PLD | Price Difference (Forward − PLD M + 1) | Forward Price M + 2 | PLD | Price Difference (Forward − PLD M + 2) | Forward Price M + 3 | PLD | Price Difference (Forward − PLD M + 3) |
|---|---|---|---|---|---|---|---|---|---|
| 2012 | 158.28 | 179.68 | −21.42 | 138.82 | 192.29 | −53.77 | 115.28 | 200.10 | −84.82 |
| 2013 | 286.04 | 262.54 | 23.50 | 248.59 | 262.54 | −13.94 | 233.88 | 262.54 | −28.66 |
| 2014 | 615.27 | 690.00 | −74.73 | 526.51 | 690.00 | −163.49 | 444.55 | 690.00 | −245.45 |
| 2015 | 294.55 | 288.11 | 6.43 | 320.21 | 288.11 | 32.10 | 342.92 | 288.11 | 54.81 |
| 2016 | 100.40 | 93.91 | 6.48 | 103.76 | 93.91 | 9.85 | 110.28 | 93.91 | 16.37 |
| 2017 | 260.42 | 323.04 | −62.62 | 226.39 | 323.04 | −96.65 | 192.17 | 323.04 | −130.87 |
| 2018 | 267.37 | 287.83 | −20.46 | 256.39 | 287.83 | −31.44 | 250.59 | 287.83 | −37.24 |
| 2019 | 224.00 | 227.10 | −3.10 | 221.81 | 227.10 | −5.29 | 216.02 | 227.10 | −11.08 |
| 2020 | 164.42 | 177.00 | −12.58 | 147.44 | 177.00 | −29.56 | 142.62 | 177.00 | −34.38 |
| 2021 | 312.33 | 279.61 | 32.72 | 337.11 | 279.61 | 57.51 | 328.79 | 279.61 | 49.18 |
| 2022 | 68.86 | 58.99 | 9.88 | 92.66 | 58.99 | 33.68 | 120.93 | 58.99 | 61.94 |
| 2023 | 69.13 | 69.04 | 0.09 | 67.63 | 69.04 | −1.41 | 67.82 | 69.04 | −1.22 |
| mean | 235.09 | 244.74 | −9.65 | 223.94 | 245.81 | −21.87 | 213.82 | 246.44 | −32.62 |
| min | 34.53 | 30.42 | −361.85 | 37.46 | 30.42 | −615.63 | 39.65 | 30.42 | −627.55 |
| max | 760.70 | 822.83 | 325.43 | 674.47 | 822.83 | 307.77 | 632.93 | 822.83 | 426.01 |
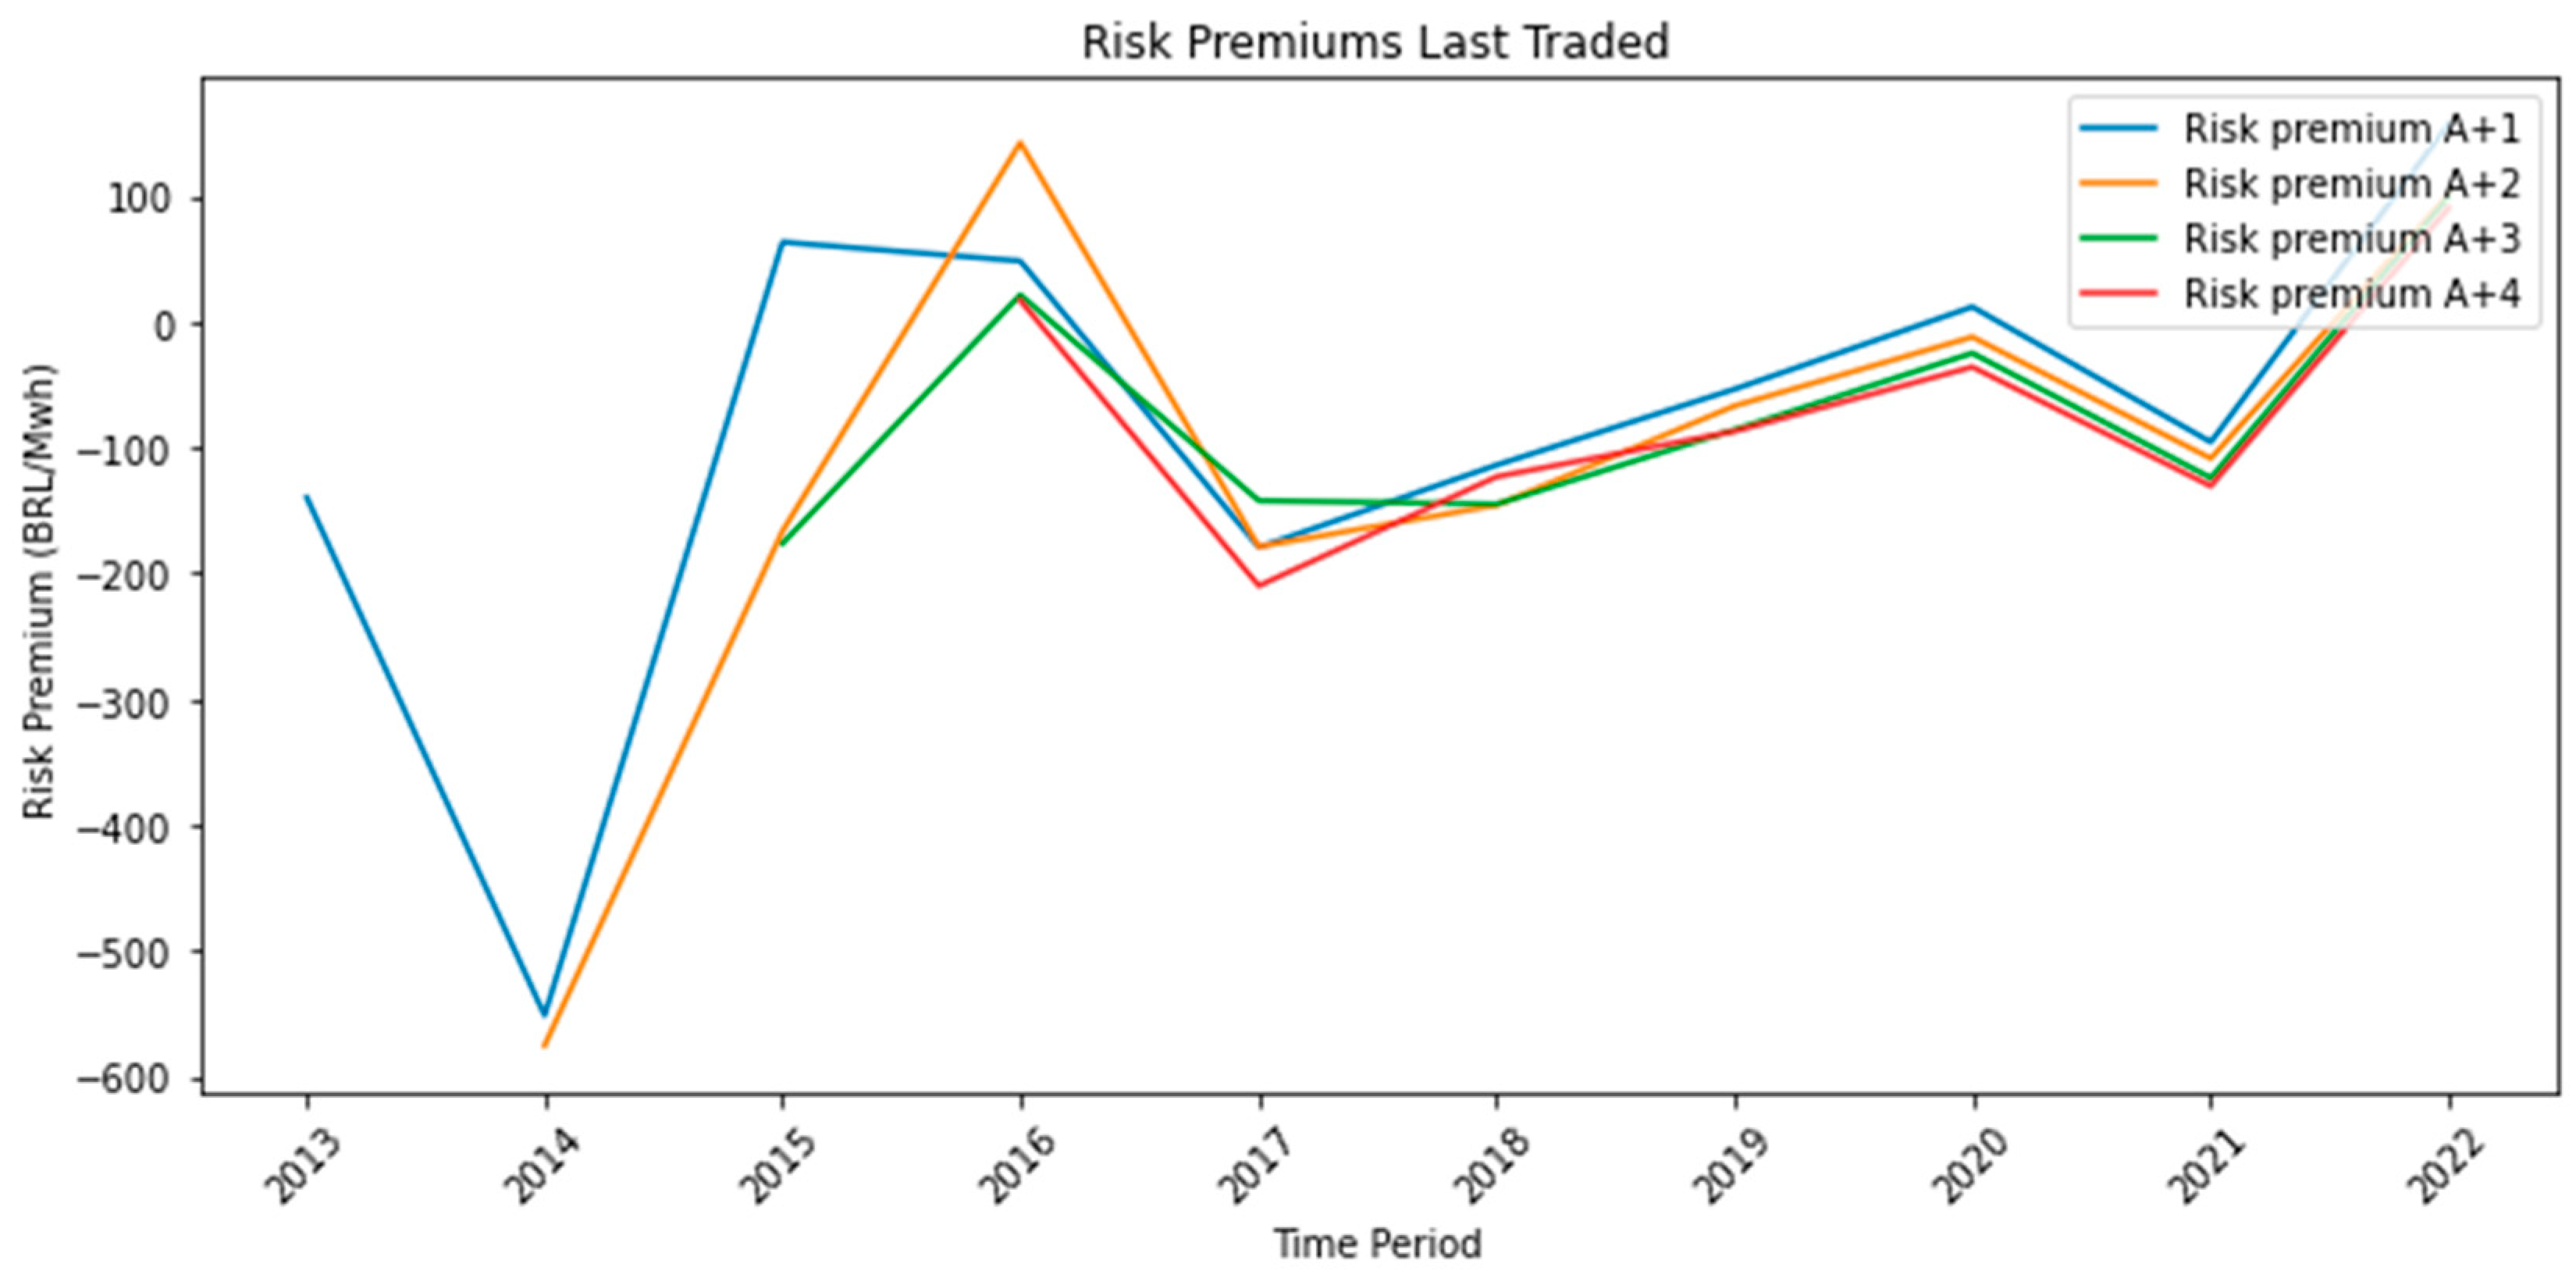
| Delivery Period | Forward Price A + 1 (BRL/MWh) | PLD (BRL/MWh) | Price Difference (Forward − PLD A + 1) (BRL/MWh) | Forward Price A + 2 (BRL/MWh) | PLD (BRL/MWh) | Price Difference (Forward − PLD A + 2) (BRL/MWh) | Forward Price A + 3 (BRL/MWh) | PLD (BRL/MWh) | Price Difference (Forward − PLD A + 3) (BRL/MWh) | Forward Price A + 4 (BRL/MWh) | PLD (BRL/MWh) | Price Difference (Forward − PLD A + 4) (BRL/MWh) |
|---|---|---|---|---|---|---|---|---|---|---|---|---|
| 2013 | 122.88 | 262.54 | −139.66 | |||||||||
| 2014 | 138.60 | 690.00 | −551.40 | 114.77 | 690.00 | −575.23 | ||||||
| 2015 | 351.48 | 288.11 | 63.37 | 121.73 | 288.11 | −166.38 | 111.86 | 288.11 | −176.25 | |||
| 2016 | 142.23 | 93.91 | 48.32 | 236.46 | 93.91 | 142.55 | 115.33 | 93.91 | 21.42 | 110.86 | 93.91 | 16.95 |
| 2017 | 143.74 | 323.04 | −179.30 | 144.26 | 323.04 | −178.78 | 180.87 | 323.04 | −142.17 | 113.18 | 323.04 | −209.86 |
| 2018 | 174.01 | 287.83 | −113.82 | 142.04 | 287.83 | −145.79 | 142.89 | 287.83 | −144.94 | 164.70 | 287.83 | −123.13 |
| 2019 | 173.55 | 227.10 | −53.55 | 160.25 | 227.10 | −66.85 | 141.32 | 227.10 | −85.78 | 140.06 | 227.10 | −87.04 |
| 2020 | 188.88 | 177.00 | 11.88 | 164.96 | 177.00 | −12.04 | 152.08 | 177.00 | −24.92 | 141.11 | 177.00 | −35.89 |
| 2021 | 184.03 | 279.61 | −95.58 | 171.08 | 279.61 | −108.53 | 155.56 | 279.61 | −124.05 | 149.07 | 279.61 | −130.54 |
| 2022 | 216.26 | 58.99 | 157.28 | 160.24 | 58.99 | 101.26 | 158.36 | 58.99 | 99.38 | 149.50 | 58.99 | 90.52 |
| mean | 183.57 | 268.81 | −85.25 | 157.31 | 269.51 | −112.20 | 144.78 | 216.95 | −72.16 | 138.35 | 206.78 | −68.43 |
| min | 122.88 | 58.99 | −551.40 | 114.77 | 58.99 | −575.23 | 111.86 | 58.99 | −176.25 | 110.86 | 58.99 | −209.86 |
| max | 351.48 | 690.00 | 157.28 | 236.46 | 690.00 | 142.55 | 180.87 | 323.04 | 99.38 | 164.70 | 323.04 | 90.52 |
Disclaimer/Publisher’s Note: The statements, opinions and data contained in all publications are solely those of the individual author(s) and contributor(s) and not of MDPI and/or the editor(s). MDPI and/or the editor(s) disclaim responsibility for any injury to people or property resulting from any ideas, methods, instructions or products referred to in the content. |
© 2023 by the author. Licensee MDPI, Basel, Switzerland. This article is an open access article distributed under the terms and conditions of the Creative Commons Attribution (CC BY) license (https://creativecommons.org/licenses/by/4.0/).
Share and Cite
Kristiansen, T. Analyzing Risk Premiums in the Brazilian Power Market: A Quantitative Study. Commodities 2023, 2, 382-397. https://doi.org/10.3390/commodities2040022
Kristiansen T. Analyzing Risk Premiums in the Brazilian Power Market: A Quantitative Study. Commodities. 2023; 2(4):382-397. https://doi.org/10.3390/commodities2040022
Chicago/Turabian StyleKristiansen, Tarjei. 2023. "Analyzing Risk Premiums in the Brazilian Power Market: A Quantitative Study" Commodities 2, no. 4: 382-397. https://doi.org/10.3390/commodities2040022
APA StyleKristiansen, T. (2023). Analyzing Risk Premiums in the Brazilian Power Market: A Quantitative Study. Commodities, 2(4), 382-397. https://doi.org/10.3390/commodities2040022


