2. Methods
In this section, the methodological framework will be described to assess whether machine-learning-based crisis detection frameworks are effective in detecting banking crises in Nigeria. The method is meant to be transparent, repeatable, and robust, as line with best practices for monitoring systemic risks. Its methodology includes the description and preprocessing of the data, the choice of features, model training based on both conventional econometric and machine learning approaches, and evaluation of the model based on cross-validation and out-of-time testing.
2.1. Data Description and Preprocessing
The macro-financial data of Nigeria is analyzed with the African Financial Crises Dataset, covering the 1954–2014 period, which consists of about 60 annual observations [
8].
The variables included in the dataset are exchange rate volatility (calculated as the standard deviation of yearly changes in the exchange rates), inflation (year-over-year CPI), credit-to-GDP ratio, indicators of sovereign default in external debt, a systemic crisis dummy variable that represents concurrent crises in other sectors, debt service ratios, oil price exposure variables, and current account balance variables.
Banking crises are rare in the dataset, with only approximately 11 crisis years. As a result, data preparation was done with caution to avoid overfitting and information leakage. Less than 5% of the data were missing; continuous variables were imputed using the mean, while binary variables were imputed using the mode. The continuous variables were mean-centered and variance-centered to zero and one, respectively, to improve numerical stability and make the models more comparable.
Given the infrequent occurrence of banking crises relative to non-crisis periods, the data is highly imbalanced. To overcome this, the Synthetic Minority Over-sampling Technique (SMOTE) was only used on the training set and not on the test set. The data were temporally split into a training sample (1954–2000) and a distinct out-of-time test sample (2001–2014). This method is consistent with the practice of risk tracking in the real world and does not introduce look-ahead bias. It also ensures that synthetic data do not influence the evaluation phase and that information leakage from the training data to the test period is prevented. The minority class is used for crisis years, and resampling was used to help models more effectively identify crisis years without changing the initial class distribution during testing.
Several precautions were implemented to avoid bias or distortion of the feature space in the synthetic data. To begin with, SMOTE was implemented only after splitting by temporal scale so that the test set (2001–2014) was left intact and a true reflection of the banking situation in Nigeria. Second, stratified cross-validation was applied to make sure that synthetic instances did not saturate but augmented class boundaries. Evaluation metrics (ROC-AUC and Recall) on the out-of-time test sample confirm the validity of this approach, demonstrating the models’ ability to generalize to real-world crisis instances without being misled by synthetic noise.
A key constraint is the relatively small number of observations (
) and the limited number of crisis years (≈11). This limits the complexity of the models that can be estimated with confidence. To prevent overfitting and unstable parameter estimates, the following strategies were implemented: (i) a parsimonious feature set selected using XGBoost importance filtering (see
Section 2.2); (ii) the use of regularized estimators where appropriate; (iii) five-fold stratified cross-validation; (iv) outlier capping at the first and 99th percentiles; and (v) conservative interpretation of performance measures with explicit uncertainty quantification.
2.2. Feature Selection
Given the small number of observations and the relatively large number of macro-financial variables, feature selection was employed to improve model generalizability and robustness. A Gradient-Boosting-based feature selection method was employed because it can detect non-linear relationships and interaction effects, which are often found in macro-financial data.
The Gradient Boosting Classifier was trained on the SMOTE-resampled training data, and the importance of the features was estimated by a gain-based metric, which measures how much each feature contributes to the classification performance of the model. The variables whose importance scores were below 0.01 were dropped, whereas those whose scores were above the value were included based on their economic importance.
The original set of candidates consisted of 11 indicators such as case, year, systemic_crisis, exch_usd, domestic debt in default, sovereign external debt default, gdp weighted default, inflation annual cpi, independence, currency crises, and inflation crises. Following the screening process, the retained variables were “exch_usd” (exchange rate volatility), “year” (temporal index), “systemic_crisis” (systemic crisis indicator), and “inflation_annual_cpi” (inflation). In order to have complete reproducibility,
Table 2 provides the feature importance scores and selection status of all candidate variables.
The “year” variable was initially included in the exploratory candidate set to assess baseline chronological trends; however, we recognize that a sequential temporal index does not represent a structural macro-financial indicator. In order to overcome the possible temporal overfitting issues, a strict robustness test was performed by retraining and retesting all models without the year variable (see
Section 3.7).
The selection of features is the process that balances statistical relevance and economic theory, which is crucial especially when the idea is to track something based on policy.
2.3. Model Development
This research uses four classification models that indicate various modeling strategies that can be used in crisis monitoring frameworks: a linear probabilistic model with regularization (Logistic Regression), an ensemble bagging model (Random Forest), a margin-based model with kernel transformation (Support Vector Machine), and an ensemble boosting model (Extreme Gradient Boosting). This diverse set enables comparison between traditional econometric approaches and machine learning techniques.
Given the small dataset and limited number of crisis observations, several measures were implemented to control model complexity and avoid overfitting:
- (i)
Feature Selection: Feature importance analysis was performed using XGBoost to identify important variables and reduce the dimensionality of the models, focusing on the most relevant macro-financial indicators.
- (ii)
Cross-Validation: To get good performance estimates and to avoid overfitting to the training splits, five-fold stratified cross-validation is used in the training procedure.
- (iii)
Hyperparameter Tuning: For ensemble models, hyperparameter tuning was performed using grid search with cross-validation to choose hyperparameters that perform well on unseen data.
- (iv)
Regularization: L2 regularization was applied to the Logistic Regression model (via scikit-learn’s default C = 1.0 with solver = ‘liblinear’) to penalize large coefficients.
- (v)
Class Imbalance Handling: SMOTE was applied exclusively to the training folds, and class_weight = ‘balanced’ (or scale_pos_weight for XGBoost) was used to adjust class weights during training.
- (vi)
Outlier Capping: There was a numeric capping of the extreme values (first and 99th percentiles) to reduce the effects of outliers on parameter estimates.
The models were trained on the preprocessed training data (1954–2000) and tested on a separate out-of-time period (2001–2014).
2.3.1. Logistic Regression
Logistic regression is used as a benchmark model because it is widely used to track systemic risk and is interpretable. This model is often favored by policymakers and regulators due to the fact that the estimated coefficients can be directly related to economic theory in order to provide clear communication and decision-making.
The model estimates the probability of a banking crisis (
) as
where
X represents the set of macro-financial variables and
denotes the coefficients estimated using maximum likelihood.
L2 regularization is used by default (C = 1.0 and solver = ‘liblinear’) to prevent overfitting and to encourage small coefficients, which is important in light of the few observations of the crisis. The model is used as a baseline to test the view of whether ensemble methods offer further gains in classification performance.
2.3.2. Random Forest
Random Forest is an ensemble learning algorithm that constructs multiple decision trees on bootstrapped samples of the data using random subsets of features. This method minimizes variance by averaging with ensembles and overfitting, so it is suitable for small macro-financial data.
The algorithm finds applications especially in crisis detection since it can automatically derive non-linear relationships, threshold effects, and interactions without necessarily specifying functional forms. For a forest with
K trees, classification is made by majority voting:
where
is the indicator function. Hyperparameter tuning was done using
GridSearchCV and five-fold stratified cross-validation on the training set. The search space was
and
The optimal parameters were chosen to minimize the cross-validated log loss. Moreover, class_weight = ‘balanced’ was applied to balance the classes in training.
2.3.3. Support Vector Machine
Support Vector Machines (SVMs) are margin-based classifiers that seek to identify the optimal decision boundary between crisis and non-crisis observations. SVMs are especially useful in high-dimensional, small-sample settings, which is evident in macro-financial tracking frameworks.
The maximization of the separation between the classes enhances generalization and resilience to noisy features, which is particularly valuable in situations when the number of crisis observations is low, and they may also be affected by measurement error. The optimization problem is formulated as
subject to
and
. A radial basis function (RBF) kernel is employed to model nonlinear patterns:
Hyperparameter tuning was done using
GridSearchCV with five-fold stratified cross-validation, and the hyperparameters searched were
and
The selected values (
,
) balance model flexibility with robustness on the imbalanced dataset.
class_weight=’balanced’ was used to mitigate the impact of class imbalance.
2.3.4. Extreme Gradient Boosting
Extreme Gradient Boosting (XGBoost) is an advanced ensemble learning algorithm that builds decision trees iteratively, with each new tree correcting errors from previous trees. This adaptive learning approach enables XGBoost to effectively identify systemic risk signals associated with rare but severe events such as banking crises.
XGBoost is effective for crisis detection due to its ability to learn complex non-linear relationships, handle imbalanced data, and employ regularization to prevent overfitting. These characteristics are especially useful in the modeling of macro-financial systems that are exposed to structural changes and regime shifts.
The objective function minimized by the model is
in which
is the logistic loss and
is the penalty of model complexity. The algorithm takes advantage of the second-order gradient data to achieve effective convergence.
Hyperparameter tuning was done with
GridSearchCV with five-fold stratified cross-validation, and the hyperparameters were tuned over
and
To achieve the lowest cross-validated log loss, the final parameters were set to
learning_rate = 0.1,
n_estimators = 100,
max_depth = 5, and
subsample = 0.8, with class imbalance addressed by the use of
scale_pos_weight.
The four models were chosen due to their inductive biases and applicability to small samples. L2 regularization gives a stable and interpretable baseline using Logistic Regression. Random Forest and XGBoost use ensemble averaging and shrinkage, respectively, to minimize variance and overfitting. High-dimensional, small-sample problems are theoretically well-posed with SVMs using RBF kernels due to their margin-maximization target. All performance estimates are accompanied by confidence intervals (see
Section 4) to acknowledge the uncertainty associated with the limited number of crisis observations.
2.4. Model Evaluation and Interpretability
Accuracy, precision, recall, F1-score, and area under the receiver operating characteristic curve (ROC-AUC) are used to evaluate model performance. Given the class imbalance and the policy-relevant need to correctly classify crisis periods, greater emphasis is placed on recall and F1-score for the crisis class. Accuracy is also deceptive in imbalanced environments where a model might be very accurate simply by being able to predict the times when there is no crisis. Another application of ROC-AUC is to assess the total discriminatory power at all classification levels.
Models were validated using five-fold stratified cross-validation on the training set and an out-of-time evaluation on the test period (2001–2014). Gain-based feature importance scores from the XGBoost model were used to enhance interpretability. Gain-based importance addresses the black-box problem by giving quantitative scores to features that are proportional to the overall decrease in the loss function, which can be attributed to splits on that feature in all trees. This method is used to determine the most important factors of crisis detection, including exchange rate volatility and inflation, and can be tested against economic theory.
Gain-based importance does not tell which variable influences the ensemble model the most, or which ones have the least impact; however, it can be used to obtain an idea of the most influential variables without necessarily having to explore the inner workings of the ensemble model. Any probability higher than 0.5 was treated as a red alert in the crisis tracking system.
The evaluation methodology favors transparency and replicability, especially because of the shortcomings of annual macro-financial data and the rarity of banking crises. Although the method allows systematic comparison of ML models based on high validation standards, the results can only be considered as a hint and not an absolute indication of the possible ability to track in real time.
3. Results
3.1. Exploratory Data Analysis
Before presenting the model estimation results, this section provides a brief description of the Nigerian banking crisis dataset.
The dataset contains 60 annual observations for Nigeria from 1954 to 2014; 11 of these years (18.3%) are classified as banking crisis years, while the remaining 49 years are non-crisis years. This asymmetry in crisis and non-crisis observations is a typical feature of financial crisis data and the rationale behind the application of resampling methods to model training.
Table 3 provides descriptive statistics for the full set of macroeconomic and crisis-related variables. The descriptive statistics indicate that there is a great difference in significant indicators. Specifically, exchange rate fluctuations are quite dispersed, with phases of steep currency depreciation under the influence of exogenous shocks and fluctuations in oil prices. The annual inflation (CPI) is also very volatile, with the annual inflation in excess of 70% in times of macroeconomic instability, implying that there is high economic volatility over the sample period.
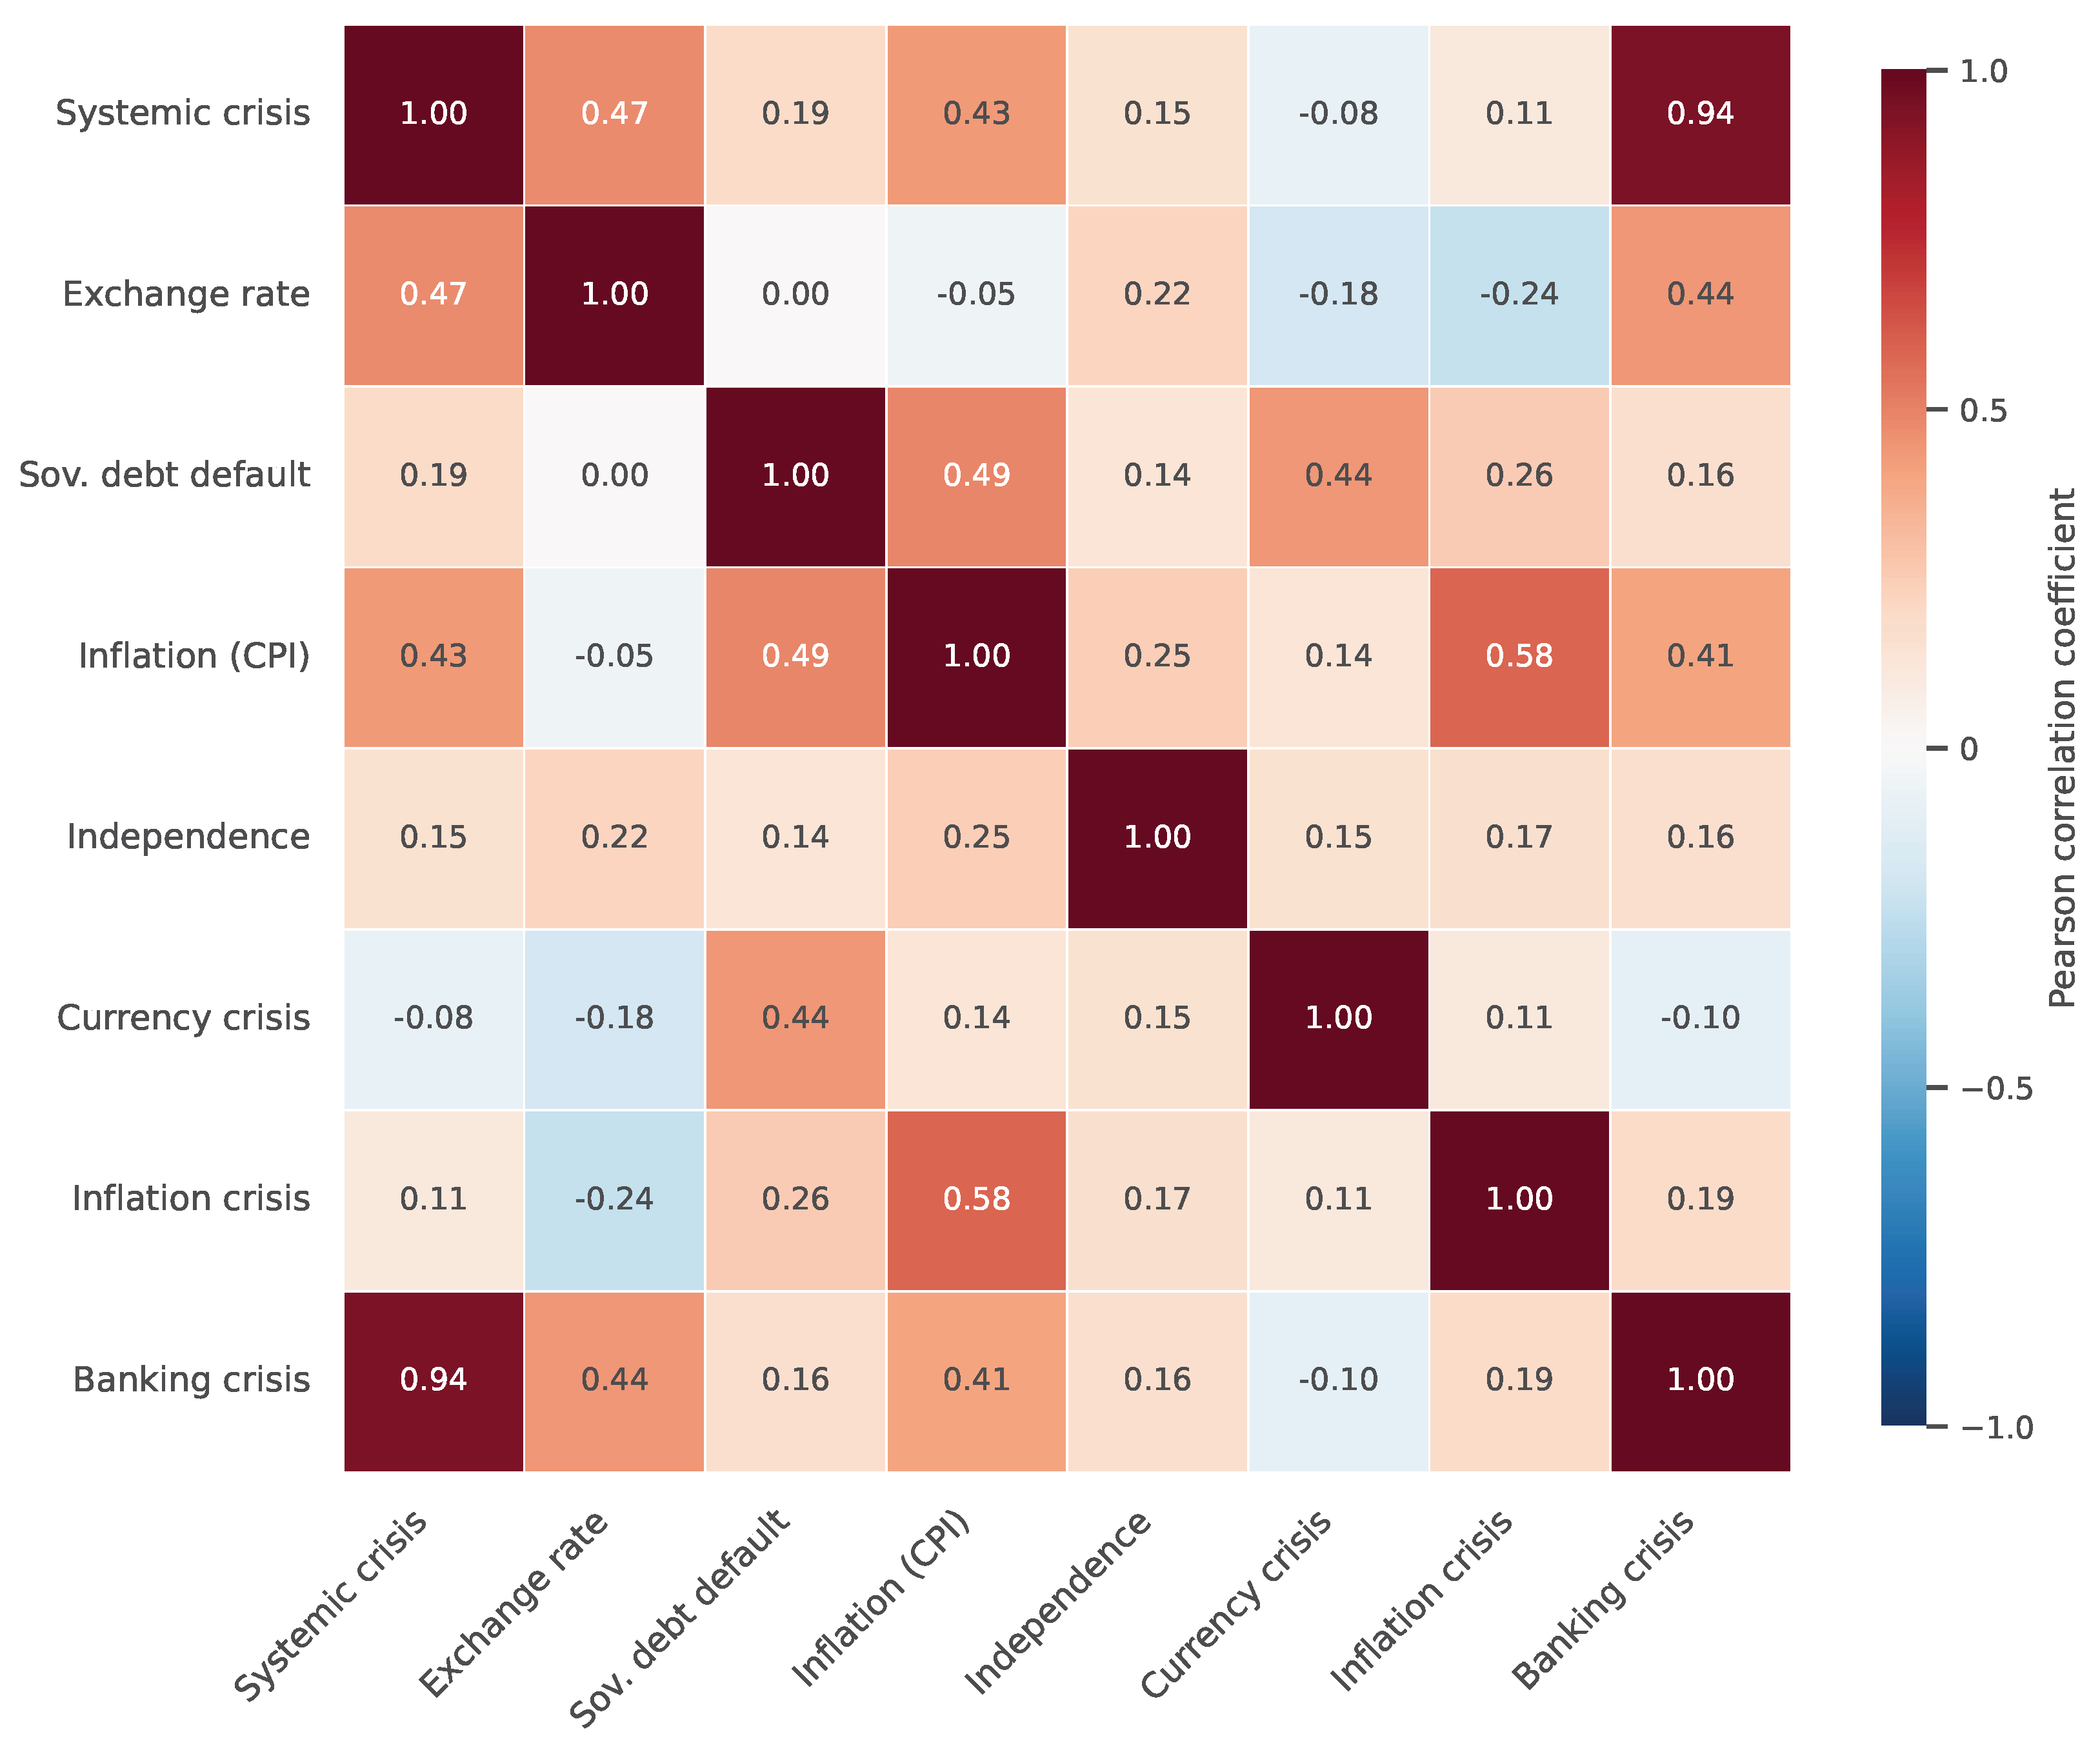
Figure 1 presents a correlation heatmap of the macroeconomic indicators. The correlation between exchange rate volatility and inflation is positive, and periods of high inflationary pressure and exchange rate volatility are associated with sovereign external debt defaults. These preliminary correlations suggest that macroeconomic volatility is associated with banking crises in Nigeria.
A notable finding from the correlation analysis is the high positive correlation (0.94) between systemic_crisis and banking_crisis. This is expected, as banking crises are a subset of systemic crisis events in the dataset. To conduct the analysis within the framework of this study, which is aimed at detecting contemporary but not advanced crises, the indicator of systemic crises is conceptually relevant: the model is used to determine whether a systemic crisis event is a banking crisis. However, readers should take note of this overlap in the interpretation of later results, as it can be a source of the high classification performance seen.
Generally, the exploratory analysis confirms that the dataset captures economically significant variation and crisis-related information, supporting its appropriateness for systemic risk-tracking frameworks.
3.2. Feature Importance
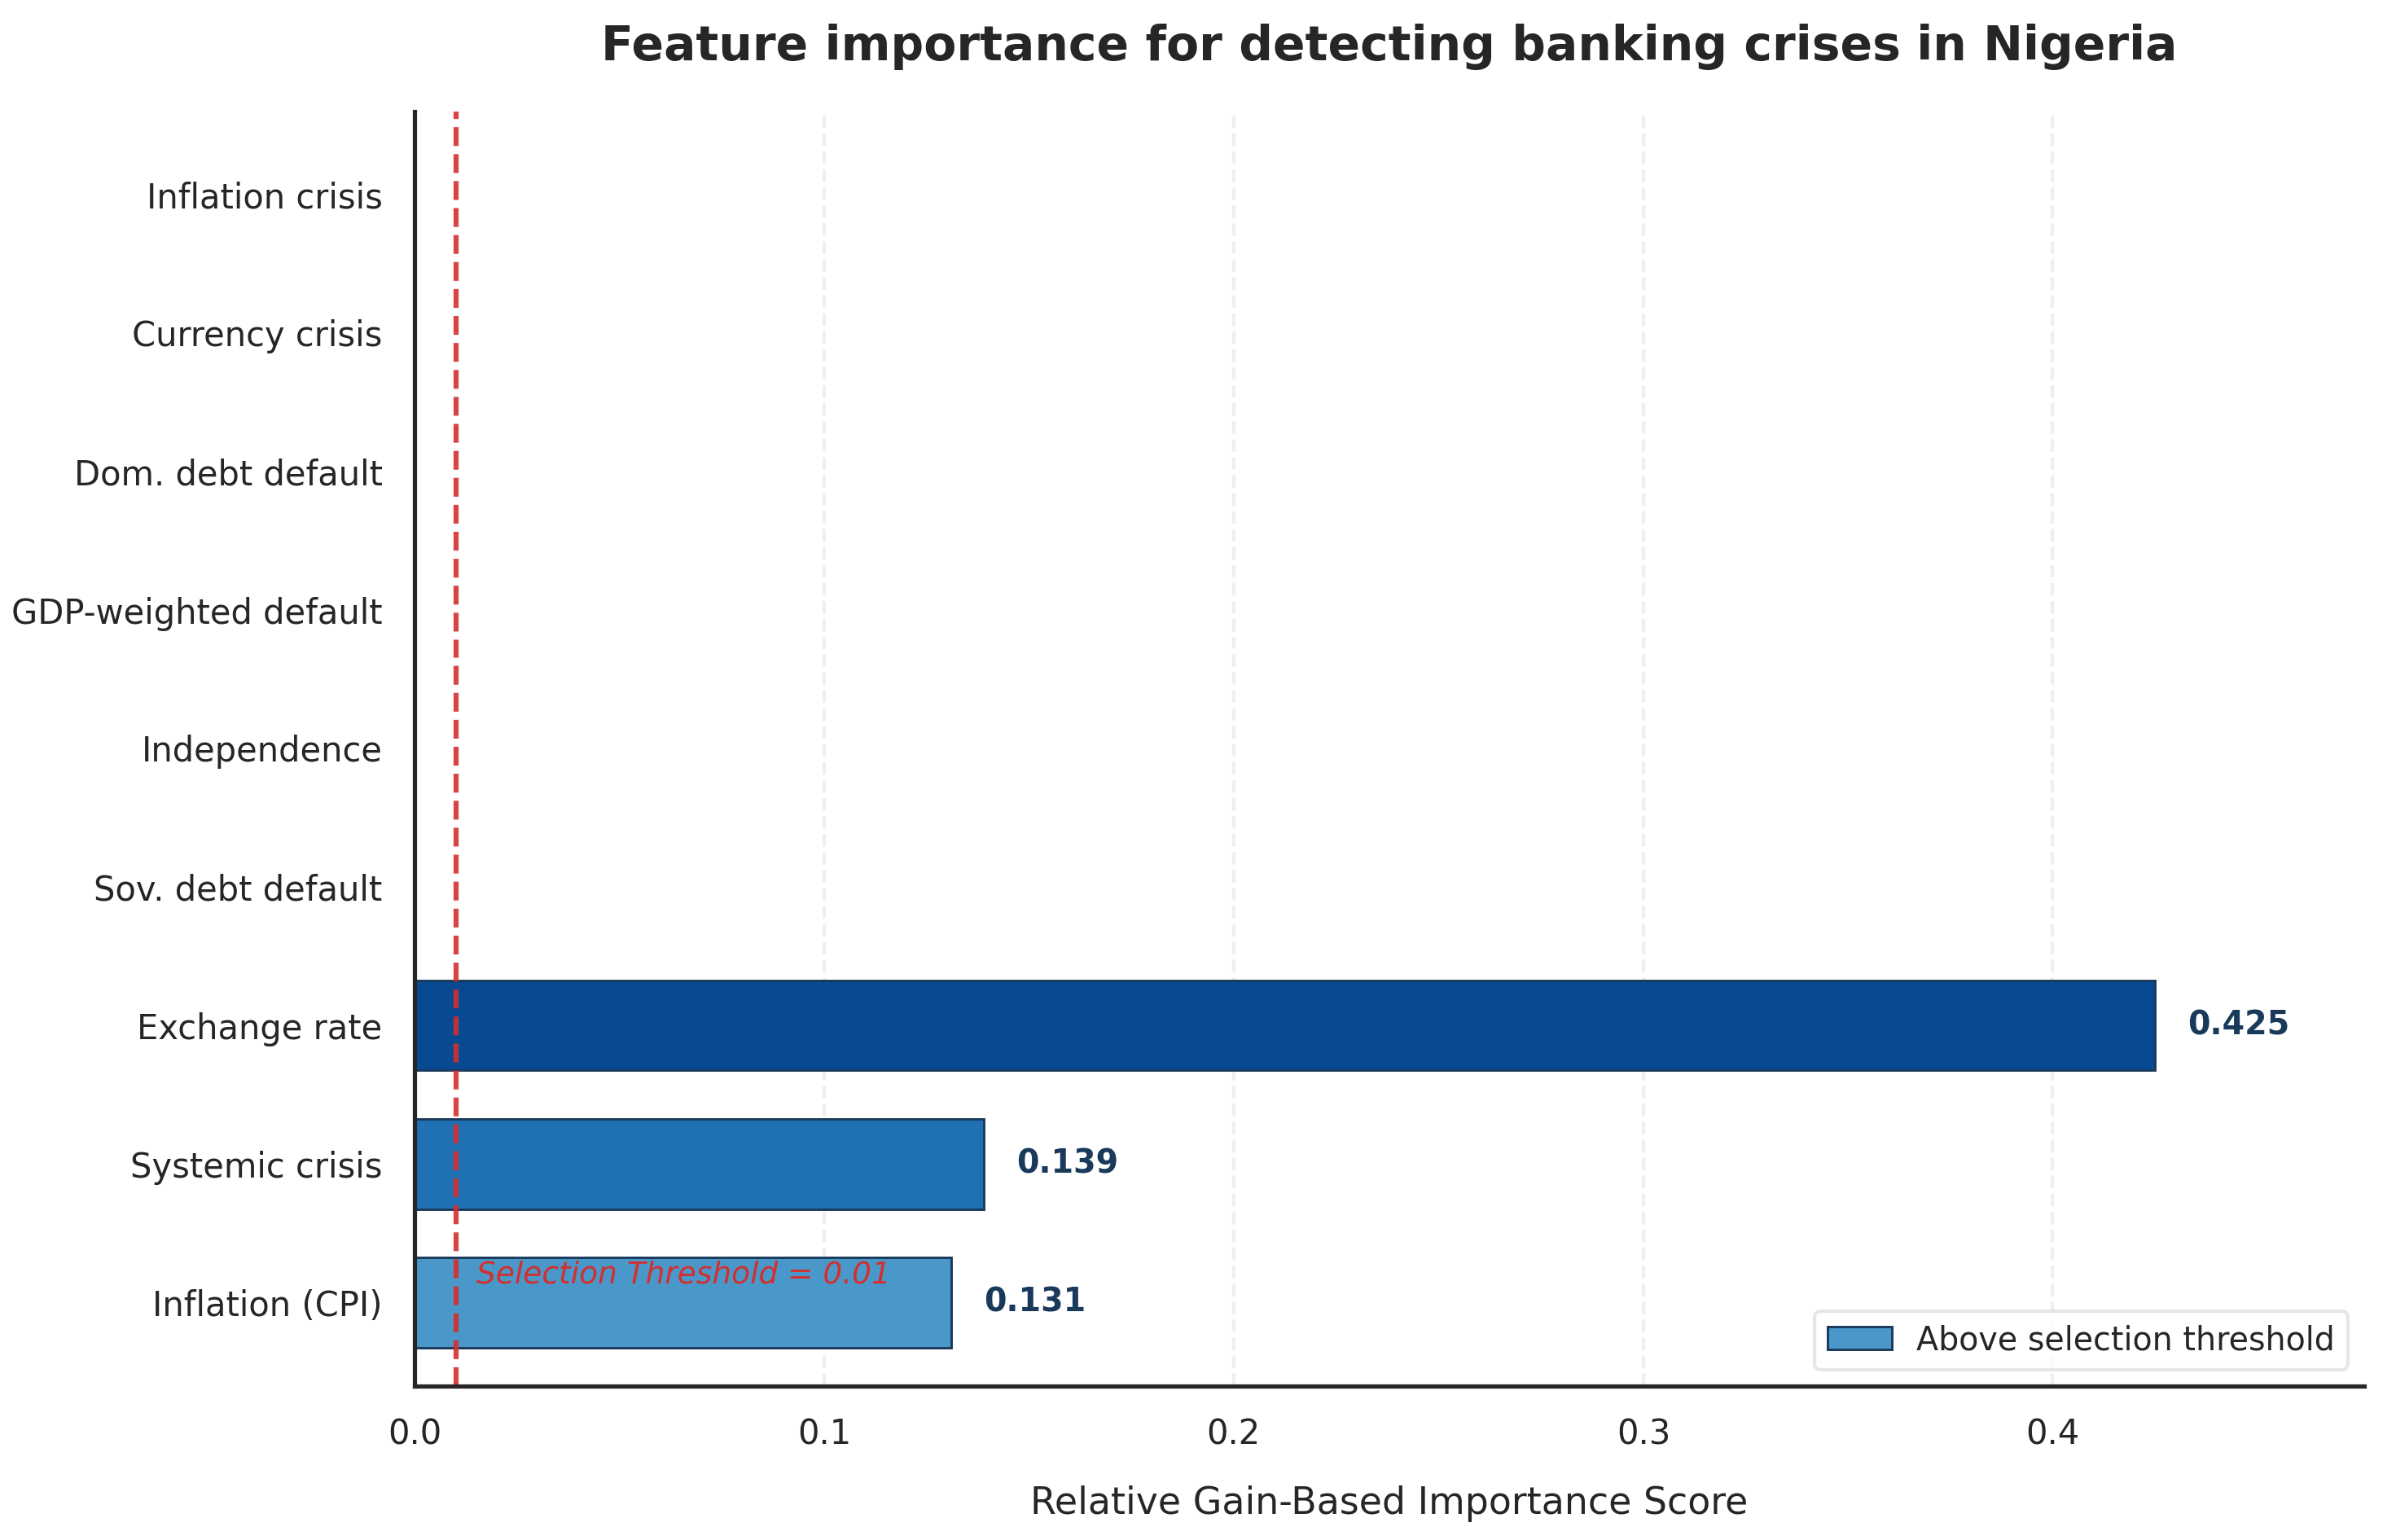
Feature importance was analyzed using the Gradient Boosting and Random Forest algorithms to identify the most important determinants of banking crises in Nigeria. The results are presented in
Figure 2.
The most important indicators were exchange rate volatility (importance = 0.425), systemic crisis (importance = 0.139), and inflation (importance = 0.131). These variables continuously proved to be the major forces behind detection of crises. All the other candidate variables had an importance score of zero and were thus not included in the final model; these include sovereign external debt default. The year variable was not tested but was added to facilitate exploratory results that would be later tested in a robustness check (see
Section 3.7), which showed that this omission does not materially impact model performance.
3.3. Model Performance
3.3.1. Cross-Validation
The initial evaluation of model performance was with five-fold cross-validation of the SMOTE-resampled training dataset.
Table 4 reports the average performance metrics.
Random Forest produced the best overall results with an F1-Score of 0.93, Recall of 0.95, and ROC-AUC of 0.99. XGBoost also demonstrated strong performance, whereas Logistic Regression exhibited moderate classification performance. In contrast, the Support Vector Machine (SVM) model performed relatively poorly.
3.3.2. Test Set Evaluation
While Random Forest achieved the strongest performance during cross-validation on the training data, XGBoost outperformed all other models on the strictly out-of-time test set. Test set performance metrics are reported in
Table 5. XGBoost achieved the highest accuracy (0.92) and the strongest crisis-class F1-score (0.80). Random Forest and Logistic Regression also gave good results. The test set is an out-of-time test (2001–2014), which is only a realistic evaluation of explanatory capacity under current historical detection conditions.
However, there are some key caveats to be considered. The test set comprises only 12 annual observations, with twp crisis years (2012, 2013) and 10 non-crisis years (including 2002 and 2008 as illustrative examples). This extremely limited and homogeneous test sample severely constrains the reliability of our performance metrics. This means that the near-perfect ROC-AUC values (1.00) that are being presented in
Table 5 need to be considered as a proof of concept but not as evidence of the generalizability of the model.
To quantify the uncertainty arising from this small test sample, we computed bootstrapped 95% confidence intervals (1000 iterations, sampling with replacement from the test set) for all performance metrics. These are presented as “Mean [95% CI]” in
Table 5.
The [1.00, 1.00] confidence intervals arise because the test set is extremely small (12 observations). With so few observations, each bootstrapped resample contains the same limited set of crisis and non-crisis years, consistently yielding perfect AUC values. This leads to zero-variance intervals, which are indicative of test sample limitations and not indicative of model perfection. The near-perfect ROC-AUC values (1.00) reported in this study are largely attributable to the extremely small out-of-time test sample (12 observations). These findings are to be understood as exploratory and as a proof of concept, as opposed to evidence of generalizable predictive performance.
We observe that such test set results are not evidence of generalizable perfection but do suggest that the models are able to discriminate crisis years and non-crisis years within the confines of this historical period. These findings should be validated with larger hold-out samples in future work.
3.4. ROC and Precision–Recall Analysis
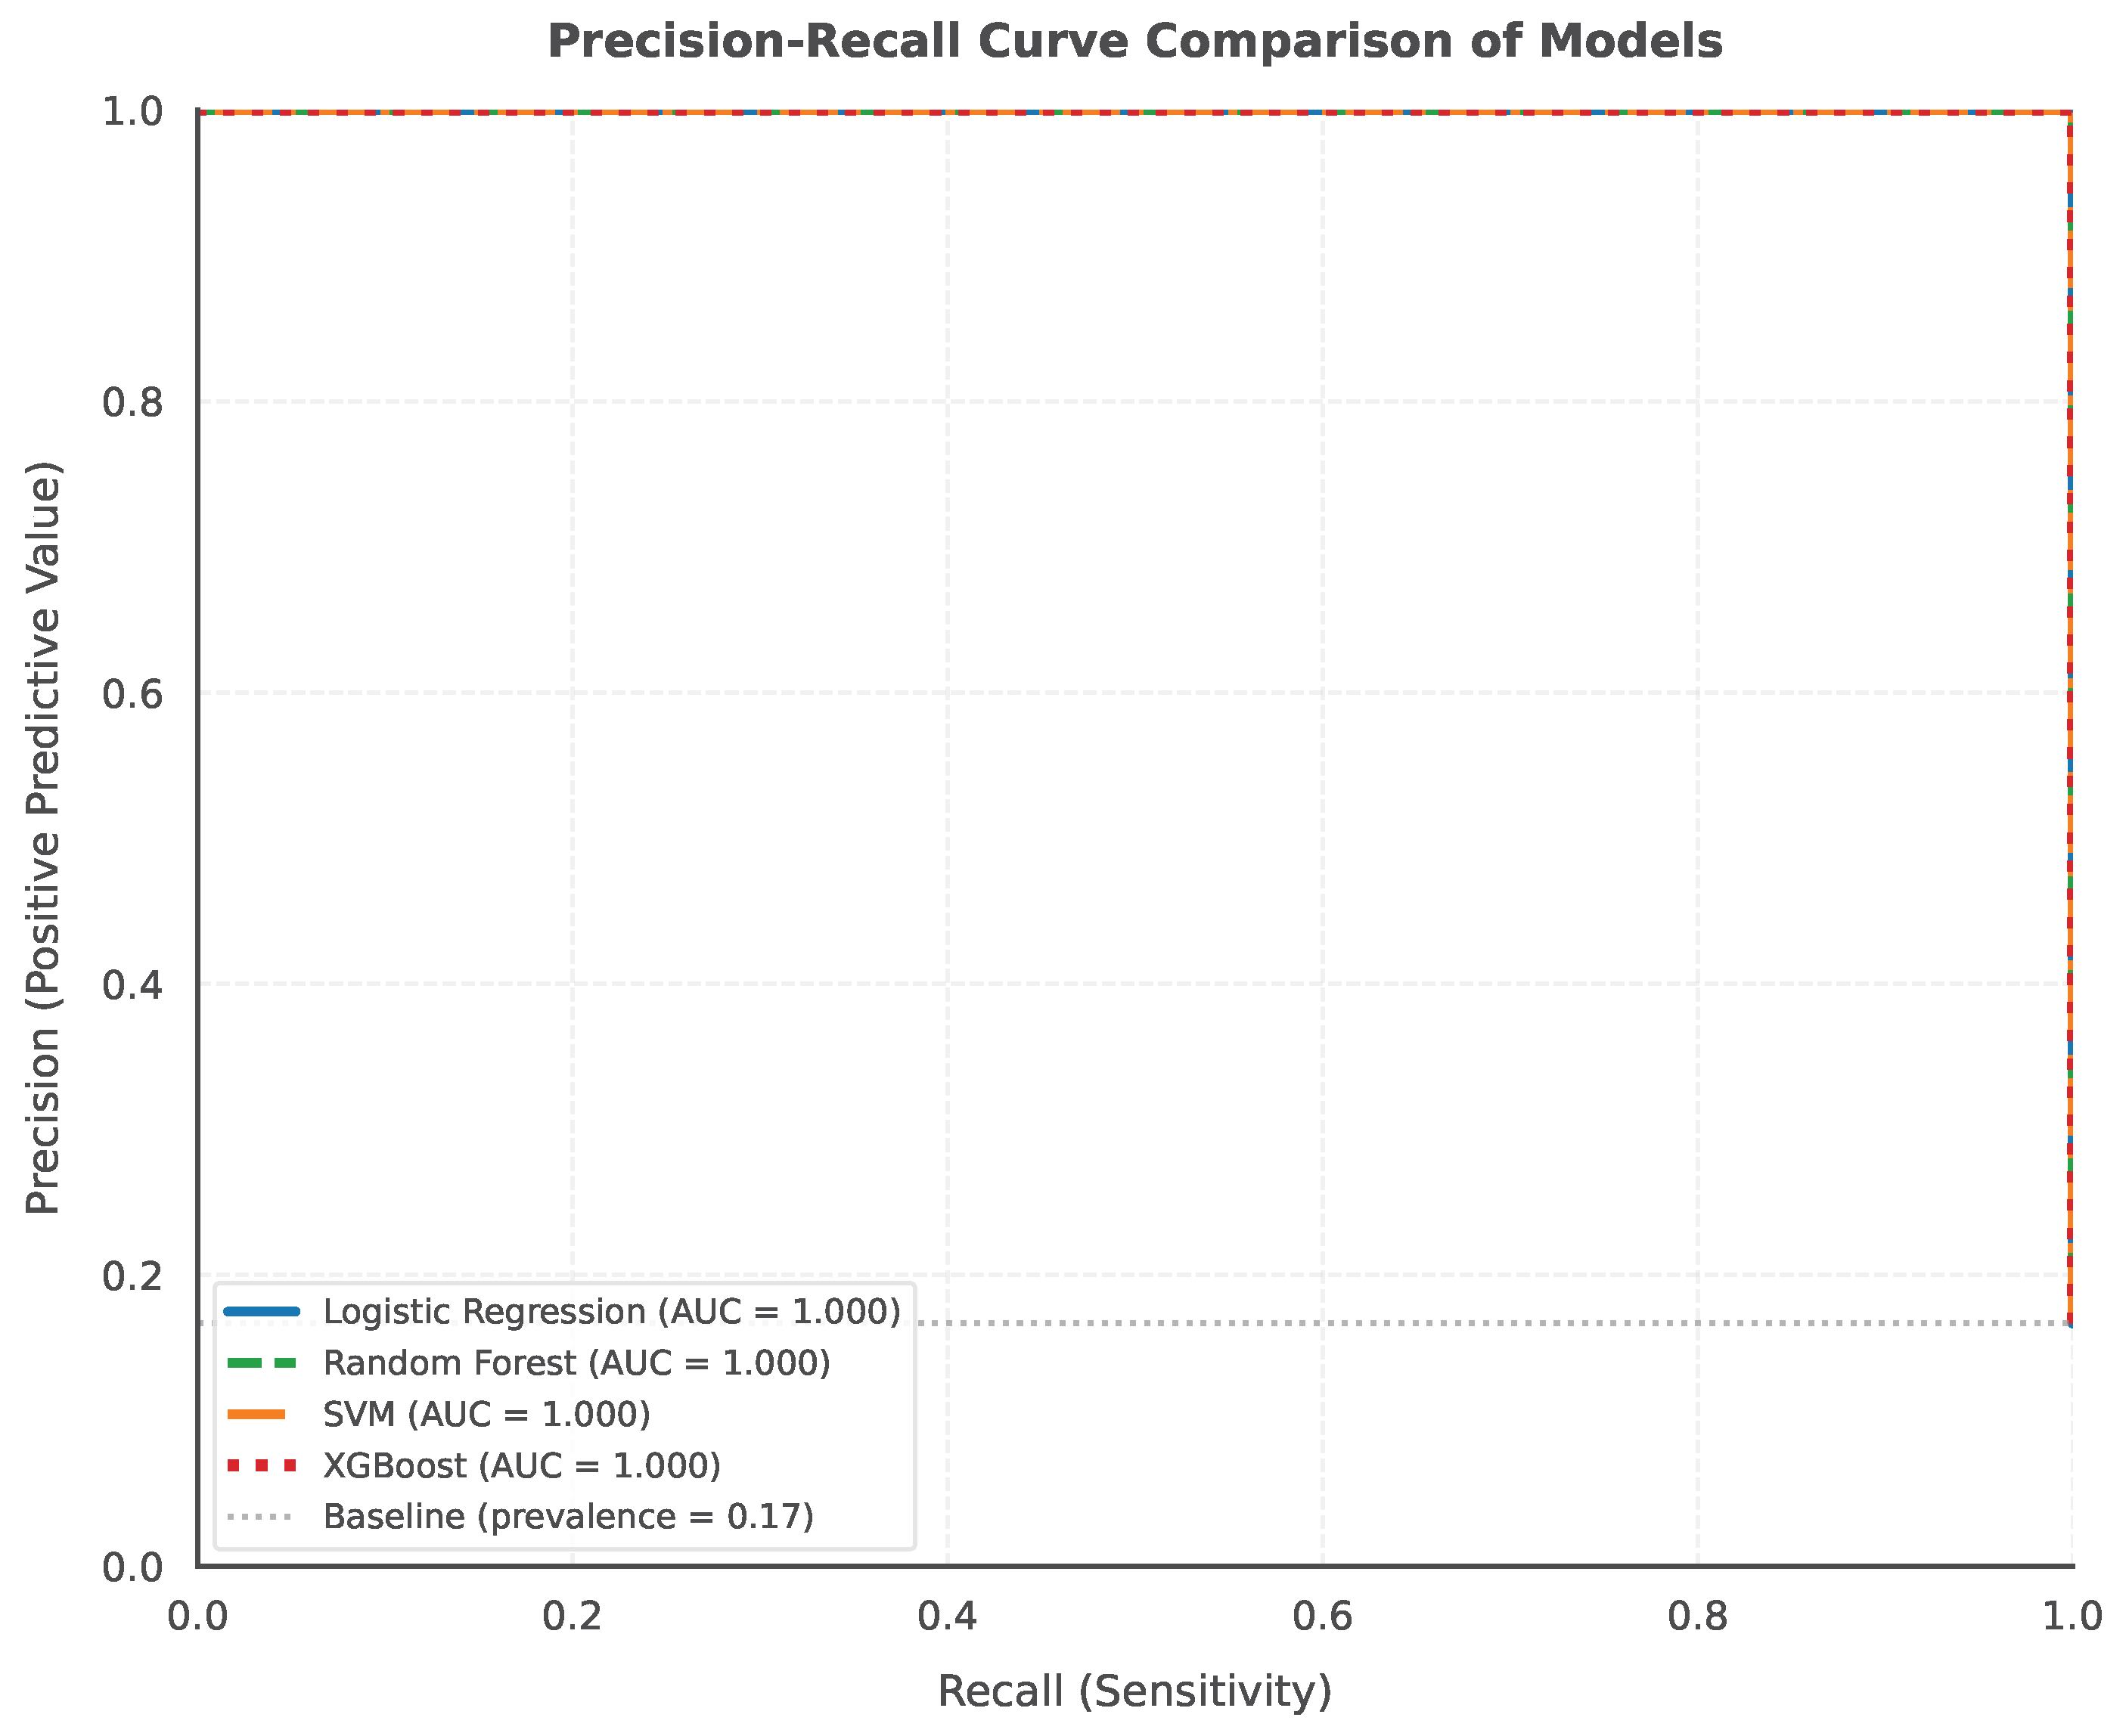
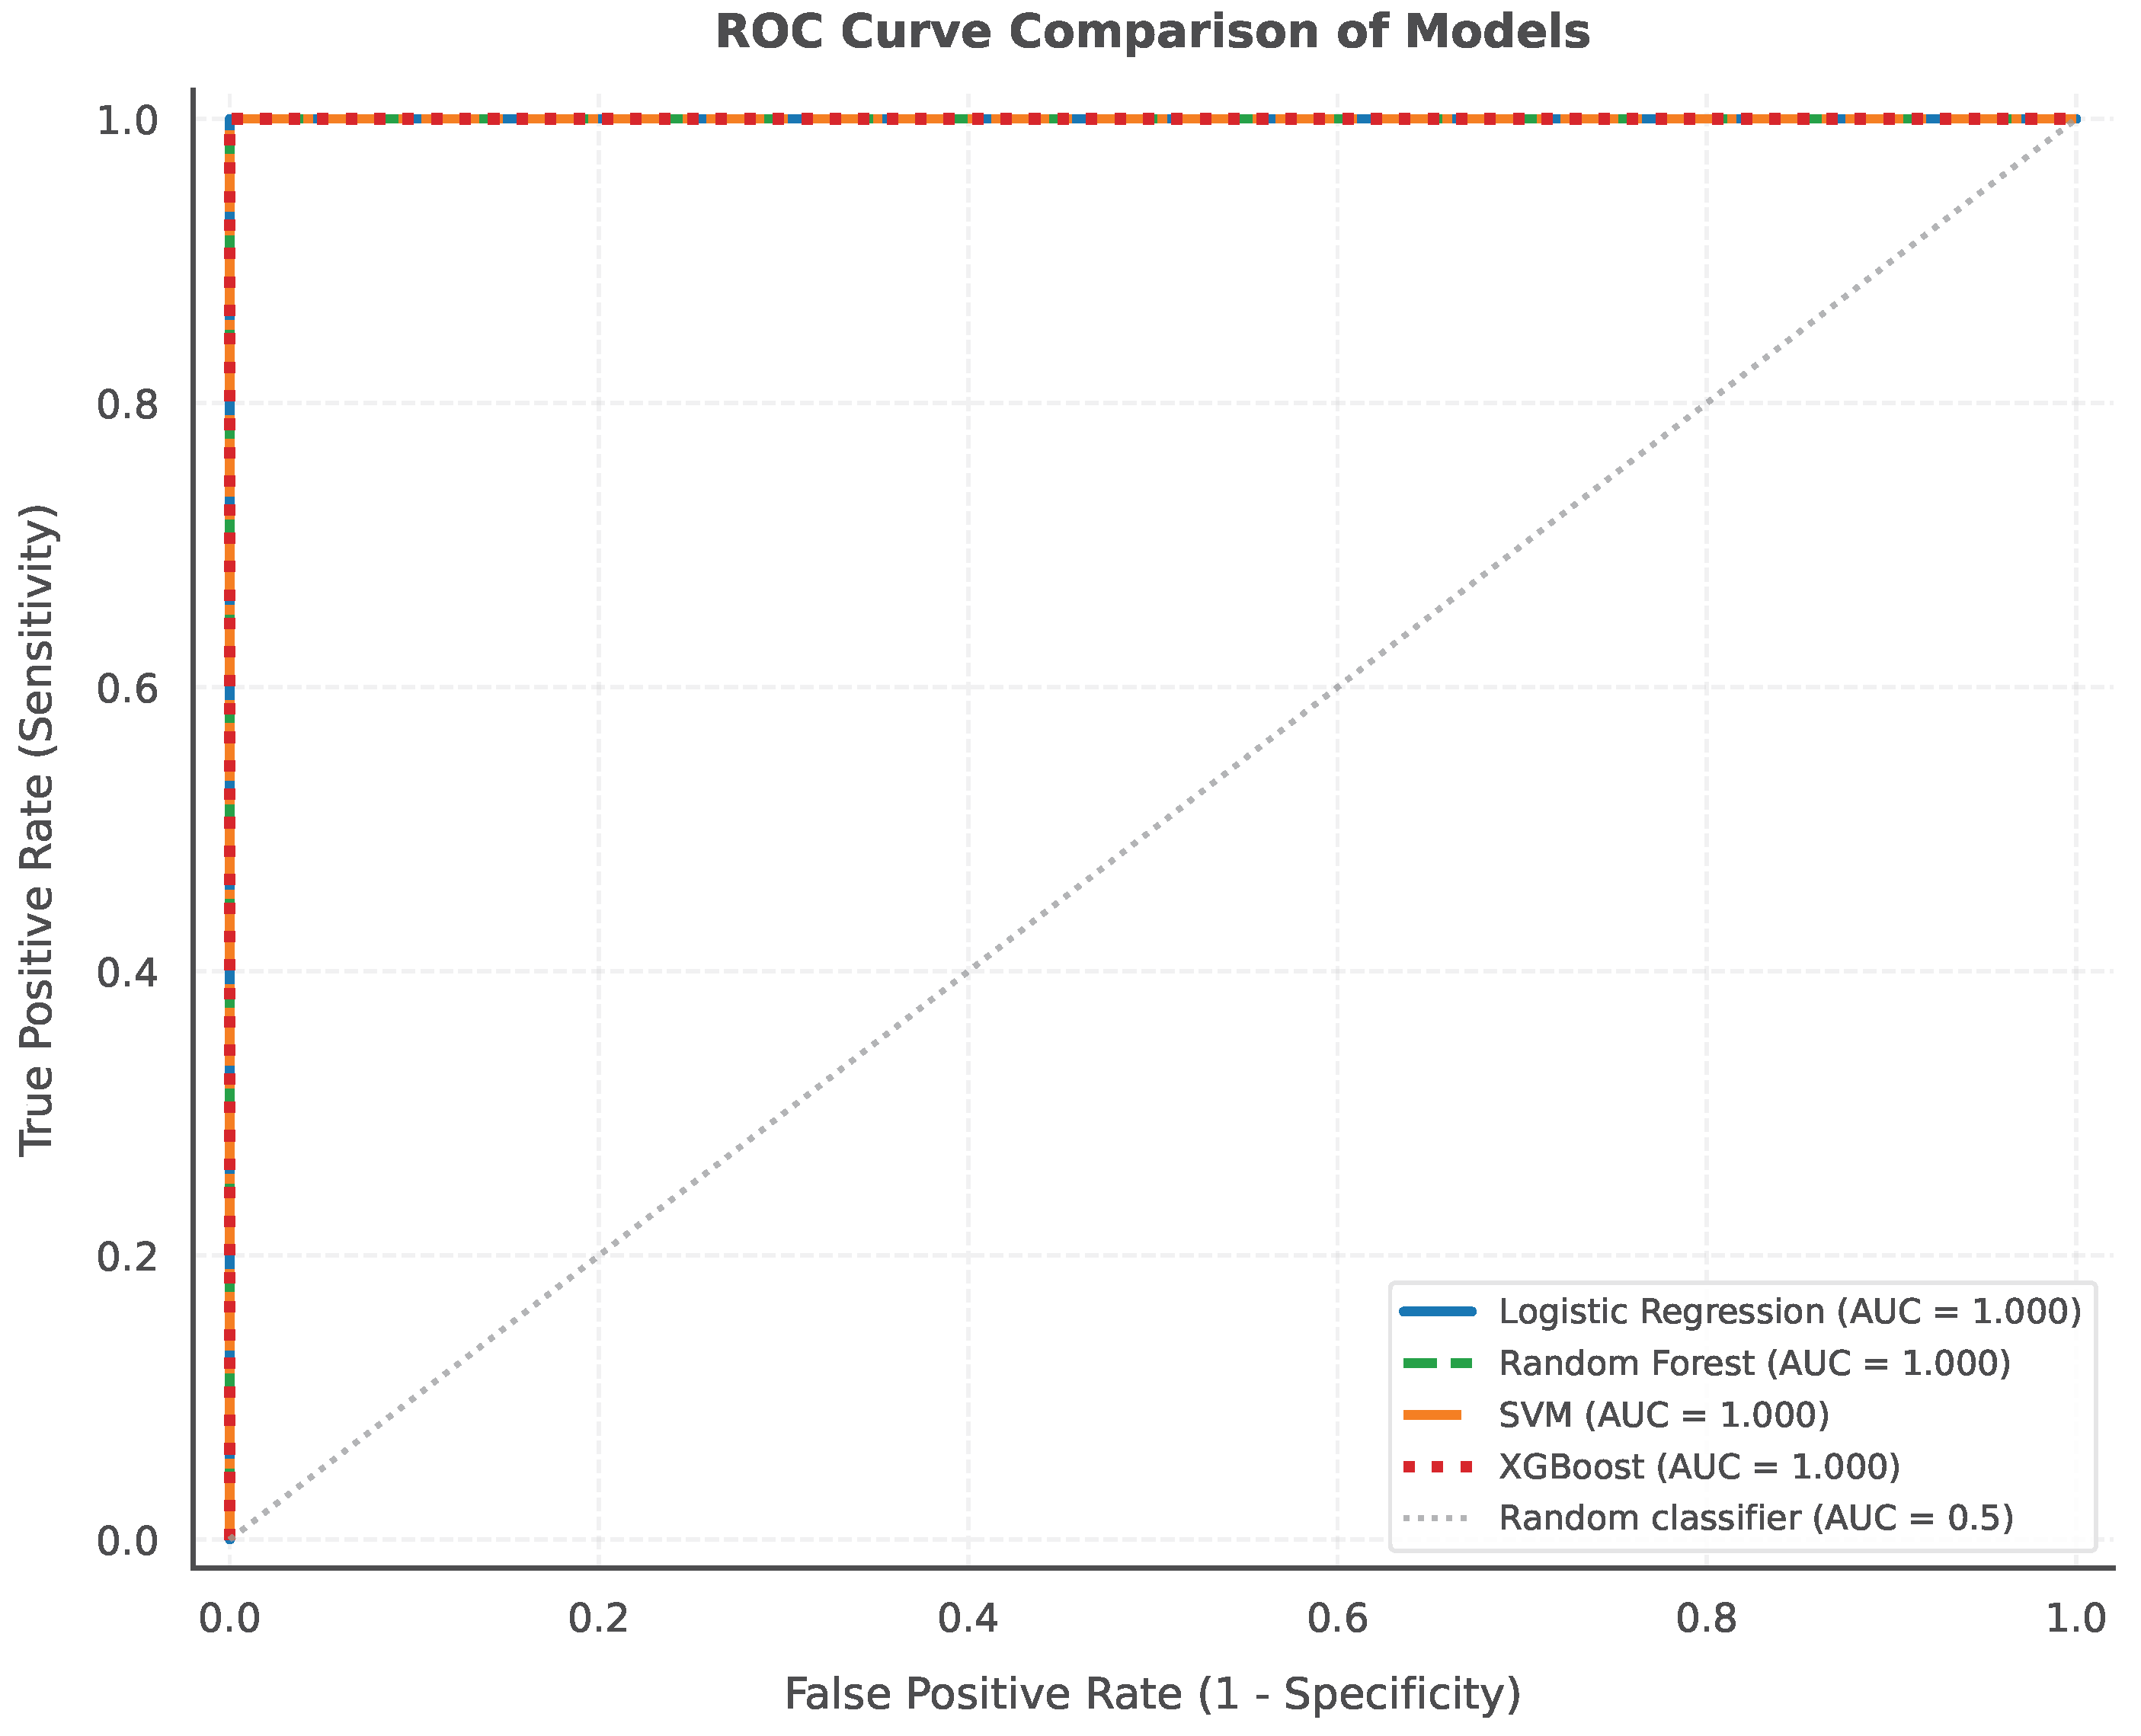
Figure 3 and
Figure 4 show the model’s discrimination ability using Precision–Recall curves and ROC curves. XGBoost and Random Forest perform better than other models, as they can almost perfectly distinguish crisis and non-crisis data points.
3.5. Systemic Risk Tracking Framework Outputs
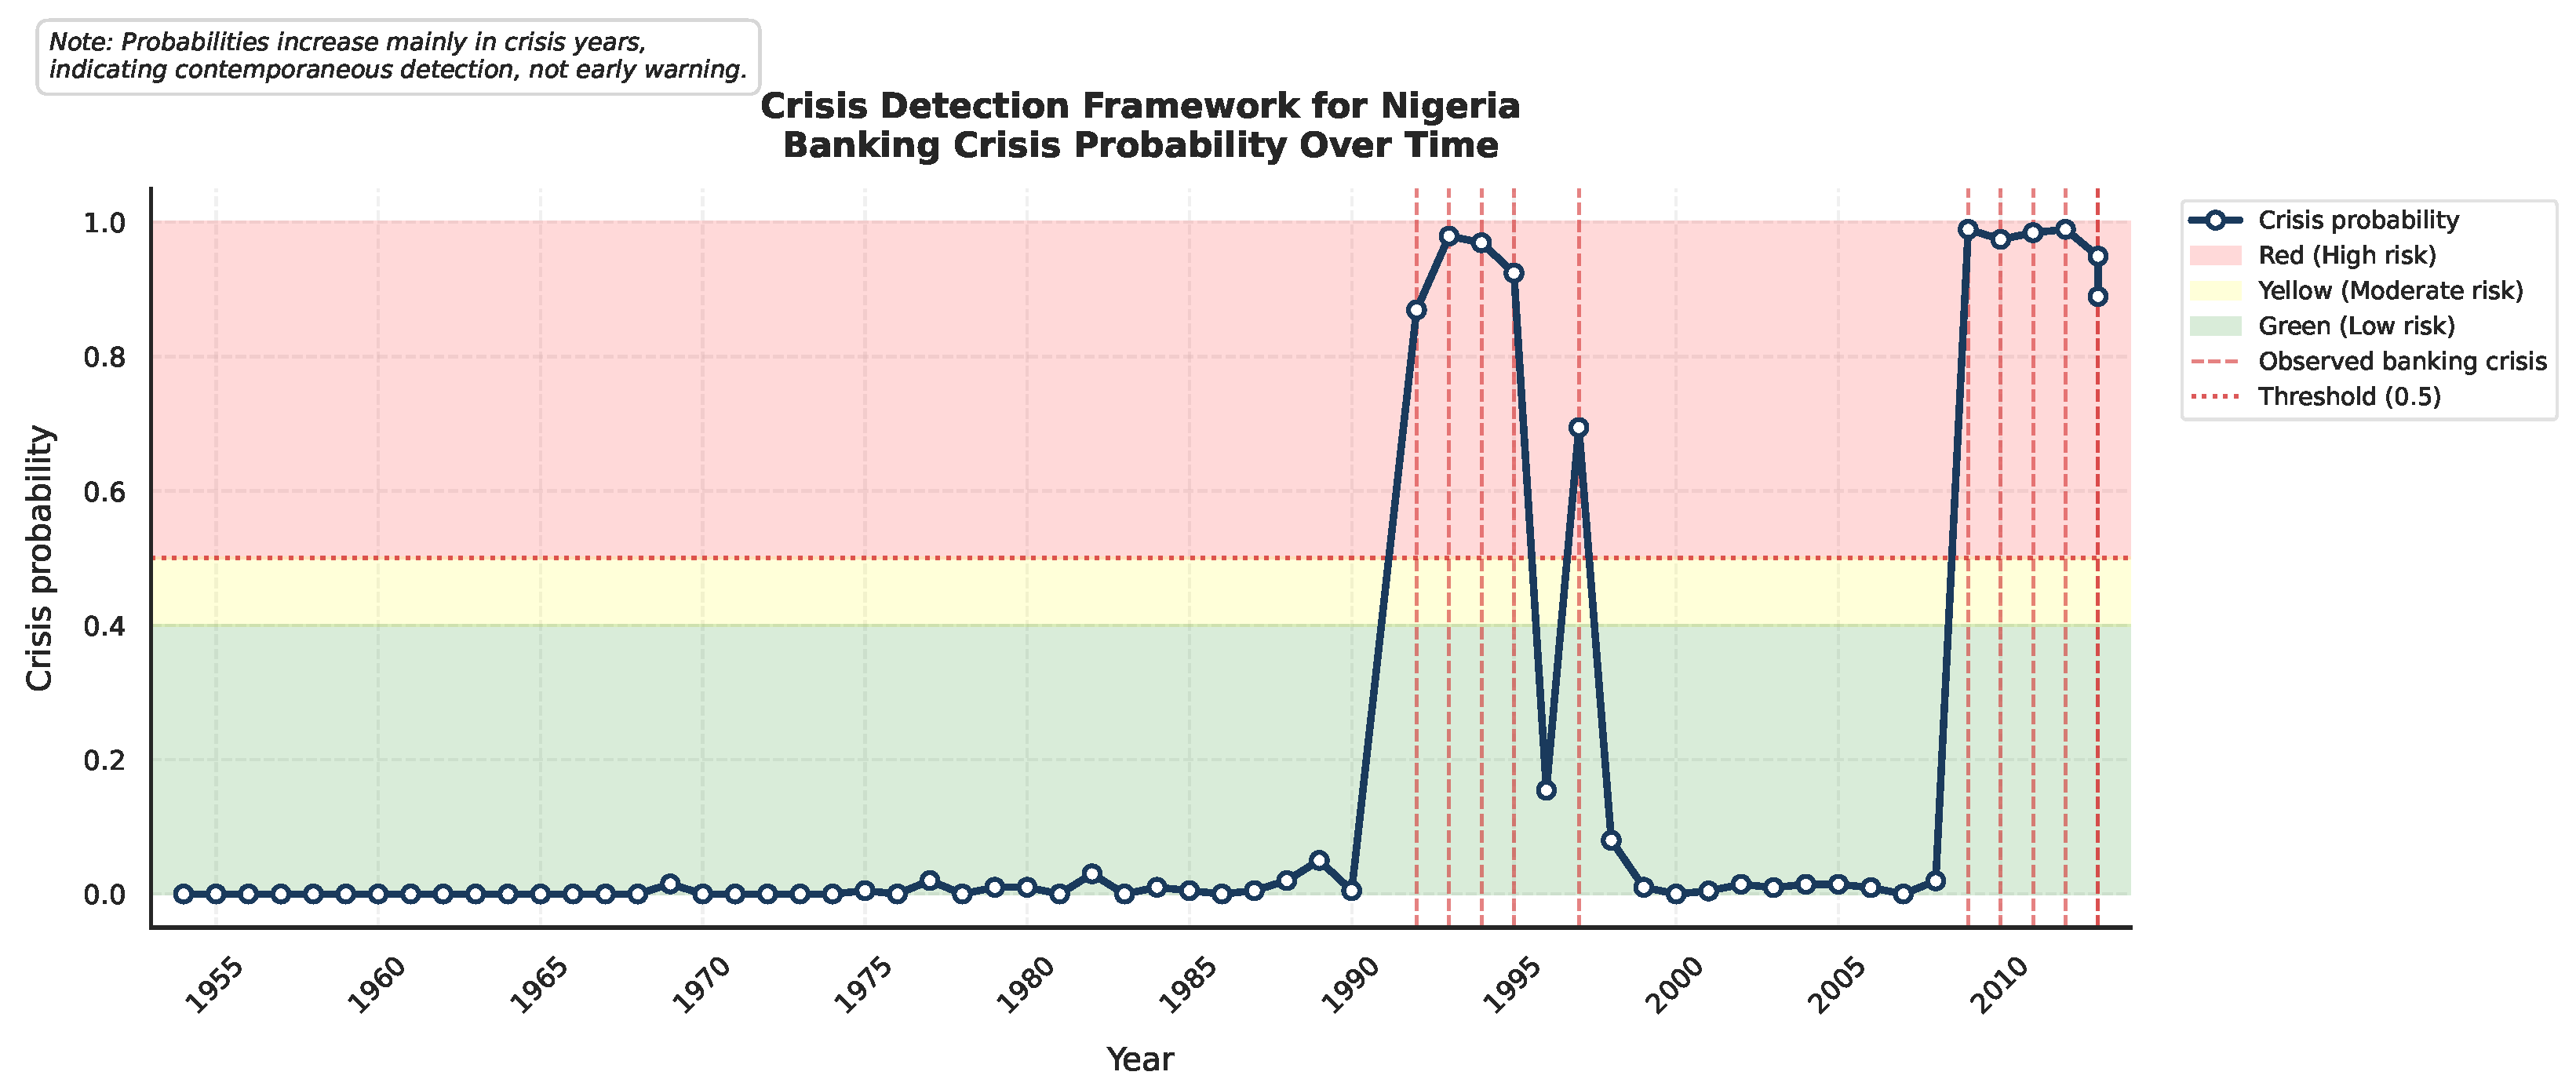
The risk monitoring framework was developed using the predicted crisis probabilities from the XGBoost model, which achieved the best generalization performance on the out-of-time test set. Risk levels were categorized into Green (low risk), Yellow (moderate risk), and Red (high risk).
Figure 5 displays the crisis detection timeline, including estimated probabilities of crises as well as actual banking crises.
The 11 historical crises are all in the Red alert zone, which shows that there is a high level of crisis detection. However, predicted probabilities tend to increase significantly during crisis years themselves, with minimal lead time at or earlier. This supports the analysis that the framework is a modern detection device as opposed to a proactive early warning system. Though the system is very effective at capturing crises as they arise, it lacks good indicators that can be used to initiate the policy proactively.
3.6. Summary of Key Findings
The exploratory analysis provides evidence of the relative performance of machine learning models for banking crisis risk identification in Nigeria under severe data constraints. The key findings are summarized as follows:
Tree-based ensemble models, especially the Random Forest and XGBoost, are always more effective in detecting historical banking crisis events, indicating that they are able to capture complex macro-financial trends.
Exchange rate volatility, inflation and systemic crisis indicators are the most significant indicators across model specifications that illustrate the significance of macroeconomic instability in the Nigerian banking industry.
Given the annual frequency of the data, the model is best suited for contemporaneous crisis detection rather than forward-looking identification. Crisis probabilities are highest during crisis years themselves, indicating limited lead time. Nevertheless, all historical crisis episodes were correctly identified within the alert zone, demonstrating the framework’s effectiveness in identifying crisis years as they occur.
The findings are to be read as suggesting performance above average classification, not necessarily as showing the presence of a working detection mechanism, but the framework is correct in pointing to the presence of historical crisis cases.
In general, the results indicate that machine learning algorithms can be used to supplement traditional econometric techniques to monitor the risk of a banking crisis in Nigeria on a real-time basis. Nonetheless, the application of the system in practice will be subject to the conditions of more comprehensive data accessibility, more transparent lead-time performance, and better interpretability.
When interpreting these results, it is important to consider the limitations of the data and the evaluation framework. However, the findings show that tree-based ensemble algorithms, especially Random Forest and XGBoost, have a high accuracy in classification. The resampling techniques, annual data, and few cases of crisis indicate that performance outcomes are an indication of favorable learning conditions but not an assurance of the real-time detection of crises. The next section discusses these empirical results within the context of the literature, their interpretation, and their limitations for the development of risk detection frameworks in emerging markets.
3.7. Robustness Check: Exclusion of Temporal Index
As the “year” variable was found to be one of the most important variables (importance: 0.305) in feature selection, a robustness test was performed to determine whether the models were overly dependent on temporal indexing rather than substantive economic indicators. Feature selection and model training were repeated without the “year” variable in the candidate feature set.
Without ‘ ‘year”, the features with importance above the selection threshold (importance ) were “exch_usd” (exchange rate volatility, importance: 0.425), “systemic_crisis” (importance: 0.139), and “inflation_annual_cpi” (importance: 0.131). The remaining features had higher absolute importance scores because they were rescaled when “year” was omitted, allowing the analysis to focus solely on economic and crisis indicators.
Table 6 compares the test set performance of models trained with and without the “year” variable. The performance numbers were relatively similar across all the models. The most notable change was an increase in Random Forest’s accuracy from 0.75 to 0.83. Perfect ROC-AUC and PR-AUC scores of 1.00 were maintained by all models and perfect recall (1.00) was preserved for the crisis class.
The robustness test confirms that the models’ ability to detect banking crises is not solely determined by the “year” variable. The economic indicators (exch_usd, systemic_crisis, inflation_annual_cpi) are sufficiently informative to maintain high explanatory power. This enhances trust in the structure, which means it does not rely on time mysteries but rather on substantive economic indicators. When the model works well without the temporal index, it is more likely to be a good indication of actual underlying economic relationships and less likely to be overfitting to certain time periods. We note, however, that the small test set size () may have contributed to the perfect scores, and further validation on larger test sets is required.
4. Discussion
This study demonstrates that ensemble machine learning algorithms, particularly Random Forest and XGBoost, are more effective than traditional logistic regression in detecting past banking crises in Nigeria [
24,
25]. Random Forest demonstrated excellent results on in-sample data, with a recall of 0.95 and an F1-score of 0.93, which indicates its capability to learn the trends in historical crisis events via bagging and deep decision trees. In contrast, XGBoost generalized better on the out-of-time test dataset, achieving an accuracy of 0.92. This improved performance is likely attributable to its sequential boosting process and regularization techniques, which enhance the model’s ability to handle temporal uncertainty.
The analysis of the importance of features showed that exchange rate volatility, systemic crisis, and inflation are the most explanatory factors, which proves that macroeconomic instability is the decisive factor of financial vulnerability in emerging economies. The influence of the year variable can probably be explained by structural changes, such as financial cycles in the world and changes in policy.
It is important to acknowledge that systemic_crisis and banking_crisis exhibit a high correlation (0.94), reflecting that banking crises are a subset of systemic crisis events. This overlap has to be taken into account when the feature importance of systemic crisis is interpreted. Although the variable helps in the high detection ability of the model, the inclusion of the variable implies that the model is in part exploiting information conceptually related to the target variable. This does not invalidate the validity of the detection framework, but it does indicate that performance measures like ROC-AUC and F1-score can be overstated when compared to a model with only independent macroeconomic indicators. Future research ought to examine whether the same detection accuracy is attainable with only variables that are conceptually different from the crisis outcome.
While ensemble methods (Random Forest and XGBoost) achieved higher accuracy and F1-scores on the out-of-time test set compared to Logistic Regression, we caution against attributing this performance difference solely to the ability of ensemble methods to capture non-linear relationships. Bootstrap-based statistical comparisons of ROC-AUC performance revealed no statistically significant differences between linear and non-linear models (p-values close to 1.0000), with mean ROC-AUC differences of 0.0000. This lack of significance is likely due to the perfect ROC-AUC (1.00) achieved by all models on the very small test set (12 observations), which prevented statistical differentiation. Therefore, no direct empirical evidence of non-linear effects on performance differences can be established. To definitively determine whether performance benefits arise from non-linear relationships, formal non-linearity testing (e.g., Ramsey RESET) would need to be conducted on larger datasets.
The temporal validation framework (out-of-time testing) provides a useful template for assessing model robustness that can be replicated in other contexts. The primary challenge in applying this approach to datasets with different properties, such as higher-frequency data, cross-country panels, or more frequent crisis events, is appropriately handling the minority class of crisis observations. In other crisis modeling problems, methods such as SMOTE have been successfully combined with temporal cross-validation to address this issue.
However, the temporal validation framework has structural constraints that must be explicitly recognized. The out-of-time test partition (2001–2014) provides a genuine test interval but is based on only 12 annual observations with a very sparse distribution of banking crisis events. Therefore, the optimal ROC-AUC values (1.00) achieved within the models are not stable in the long term and should not be used as an indication of absolute generalization. Instead, they imply that the models can be useful in monitoring crises in a narrow band of macro-financial deterioration. These high discrimination levels require confirmation in future studies using larger and more flexible target horizons and multi-country panels. It is important to reiterate that the near-perfect ROC-AUC values (1.00) are a direct consequence of the extremely small test set (12 observations) and should not be interpreted as evidence of generalizable predictive performance. Instead, they suggest that the models are viable in the particular context of this historical time frame.
As anticipated in the literature, tree-based ensemble models tend to outperform linear econometric models in detecting emerging-market crises [
24,
25]. Nonetheless, other studies have observed that standard logistic regression can outperform machine learning models in recursive out-of-sample tests [
20].
A granular performance analysis was performed to evaluate the classification mechanics in terms of the imbalance in the classes to evaluate the minority crisis class (Label 1). Although all models had a great baseline capacity to explain historical systemic shocks (test recall of 1.00), significant variations in precision were found. The false-alarm rate for traditional logistic regression was high, with test precision of only 0.50 (CV F1: 0.7569; CV Recall: 0.7393; CV ROC-AUC: 0.9638). The global linear loss function, which optimizes total loss over the entire data space, can distort the decision boundary due to the majority class, leading to a high number of false-positive errors.
Support Vector Machine (SVM) was a special case, with perfect recall of 1.00 and an out-of-time test ROC-AUC of 0.00. The diagnostic examination of the model posterior distributions indicated that there was an inversion of the ranking; the SVM gave an identical probability estimate of 0.5000 to genuine crisis years and slightly more (0.5100 to 0.5330) to years without a crisis. All non-crisis instances scored higher than crisis instances, leading to ideal threshold mapping. The order of the scale ( shifted the ROC-AUC to 1.00, but the stability of cross-validation was low (CV F1: 0.4682; CV Recall: 0.5000; CV ROC-AUC: 0.8821).
Conversely, Random Forest had a high resampled training space dominance (CV F1: 0.9270; CV Recall: 0.9500; CV ROC-AUC: 0.9953), but with a test precision of 0.40. XGBoost, the most effective framework, had the highest test precision of 0.67 and an out-of-time F1-score of 0.80 (CV F1: 0.8687; CV Recall: 0.8679; CV ROC-AUC: 0.9828) and balanced best between target discrimination and false-alarm mitigation.
Though such ensemble architectures have obvious detection advantages, the empirical lead time of the monitoring system is limited by the underlying data, especially its frequency per year. The acute short-term liquidity shocks or abrupt currency runs that may occur mid-year may lead to a systemic banking crisis. Annual aggregation of macro-financial aggregates smooths and masks these rapid inter-annual changes. Visual inspection of the alert timelines confirms that crisis probabilities are very high either in the crisis year itself or, at most, in the preceding year. This framework is thus more of an accurate tracking system or immediate looming sensor rather than a long-term monitoring system. Further studies ought to overcome this limitation by using higher-frequency proxy measures (monthly or quarterly), incorporating more institutional and global risk measures, and testing more sophisticated sequential architectures like Recurrent Neural Networks (RNNs) or Long Short-Term Memory (LSTM) networks, along with explainable AI tools like SHAP, to elucidate current relationships.
Besides the limitations imposed by the data and time, there are other restrictions that should be mentioned. First, the test set comprises only 12 annual observations, with two crisis years (2012, 2013) and 10 non-crisis years. This very limited and homogeneous test sample yields artificially small confidence intervals and practically perfect point estimates (AUC = 1.00 across all models). These results are to be considered as exploratory and proof-of-concept as opposed to evidence of model generalizability. Second, the findings are country-specific in Nigeria and cannot necessarily be extended to other emerging markets with varying institutional structures, policy regimes, or history of previous crises. Third, the importance of gain-based features cannot be interpreted comprehensively because of the complexity of the Random Forest and XGBoost in nature, which makes the models less appropriate in policy communication, which may need causal explanation. Lastly, the model stability over time can be influenced by structural breaks and changes in policy regimes in Nigeria throughout the 60-year sample period. Collectively, these limitations affect the interpretability and generalizability of our results and indicate the necessity to validate them on larger and multi-country datasets.
5. Conclusions
This study demonstrates that machine learning algorithms, particularly tree-based ensemble models, can be more effective at detecting banking crises in Nigeria than traditional logistic regression. The findings indicate that the most important factors associated with banking system distress are macroeconomic uncertainty, as measured by exchange rate volatility, inflation, and systemic crisis indicators. However, the results are constrained by the limited number of banking crises, and the models are unable to provide indicators with substantial advance notice. Instead, they identify increasing risk contemporaneously as crises materialize, making them suitable for monitoring purposes.
A key limitation is that the near-perfect ROC-AUC values (1.00) reported in this study arise from the extremely small out-of-time test sample (12 observations). Consequently, these results can be considered exploratory and as a proof of concept instead of as conclusive evidence of predictive performance that can be generalized. These findings ought to be confirmed in future studies using larger, more diverse sets of data.
A limitation of this study is the conceptual overlap between systemic_crisis and banking_crisis, which are highly correlated (0.94). While this overlap is justified for a contemporaneous detection task, where the goal is to identify whether a systemic crisis is a banking crisis, it may contribute to the strong performance metrics reported. Consequently, the results are to be viewed as an indication of the successful classification of the crisis but not as the ability to forecast on its own. Further study should aim to confirm these findings with only macroeconomic variables that are conceptually independent of the crisis outcome and should incorporate higher frequency data to enhance lead-time possibilities.
This paper shows that machine learning can be used with traditional econometric techniques in data-sparse contexts. It offers a well-defined assessment framework that puts into perspective the potential as well as the limitations of such approaches. The models are to be viewed cautiously and are not to be taken as operational early warning systems as they are. Future research should focus on the use of high-frequency proxy data and multi-country panel models to improve classification robustness and macroprudential policy relevance.