1. Introduction
Natural disasters, disease outbreaks, and infrastructure failures impose severe and often prolonged burdens on communities, disrupting access to healthcare, food systems, retail services, and the broader supply networks that sustain daily life [
1,
2,
3]. The consequences of such events extend well beyond the communities at their epicenter. Because modern communities are structurally interdependent, linked through shared infrastructure, economic relationships, and dense social network; disruption originating in one locality propagates outward, placing compounded pressure on neighboring regions and eroding the capacity of entire systems to function [
4,
5]. When these cascading effects are not contained quickly, they generate secondary disruptions in communities that were not initially at the center of the event, intensify population displacement, and accelerate the deterioration of critical facilities across a region [
6,
7]. The scale and pace of this propagation mean that the window for effective intervention is narrow, and the cost of a delayed or misdirected response is high.
This interconnectedness introduces a fundamental complexity into crisis response. The vulnerability of any given community is shaped not only by its own internal conditions, i.e., its population density, economic capacity, and infrastructure, but also by the conditions of the communities it is most closely linked to. A community with moderate internal exposure may nonetheless face severe disruption if it is tightly connected to regions experiencing high disease burden or infrastructure failure. Conversely, a geographically isolated community may be partially insulated from cascading effects even when nearby regions are severely affected. This network-mediated exposure means that resilience and vulnerability are fundamentally relational properties: they cannot be accurately characterized by examining communities in isolation [
8,
9]. At the same time, the behavioral responses of populations; most notably migration away from high-burden areas alter the distribution of need across the network over time, creating feedback dynamics that further complicate the resource allocation problem [
10,
11,
12,
13,
14]. Decision-makers operating in these environments must therefore contend with a system that is simultaneously interconnected, dynamic, and highly sensitive to the timing and targeting of intervention.
A substantial body of research has investigated crisis response and resource allocation in disaster and epidemic settings from multiple complementary perspectives. Social vulnerability indices have been developed to classify communities according to their relative susceptibility to hazardous events, thereby providing a structural foundation for prioritization and intervention planning [
15,
16]. In parallel, willingness-to-pay (WTP) frameworks have been used to quantify the societal burden associated with service disruptions by assigning relative importance weights to different categories of critical infrastructure and essential services [
17,
18,
19]. Research has also examined how risk perception shapes stakeholder decision-making, demonstrating that the assessment and communication of risk can significantly influence the effectiveness of intervention strategies and crisis-response behavior [
20,
21,
22,
23,
24,
25,
26]. Building on these insights, resilience-oriented operations research has incorporated risk-averse and chance-constrained formulations to support infrastructure restoration and emergency logistics planning under uncertainty [
27,
28,
29,
30,
31]. At the modeling level, agent-based approaches have been widely applied to simulate community-level responses to infectious disease outbreaks, enabling the representation of behavioral heterogeneity among individuals and institutions operating under uncertain conditions [
32,
33,
34]. Complementing these approaches, stochastic simulation and Monte Carlo methods have been employed to evaluate intervention performance and system behavior under parameter uncertainty in epidemic and disaster environments [
35,
36]. This body of work has advanced the understanding of individual components of crisis response, resilience, and uncertainty-aware decision-making.
Despite this progress, a critical gap persists. Network-oriented and agent-based studies have modeled how disruption spreads across connected populations, and resource-allocation studies have modeled how aid is targeted, but these two lines of work have largely developed separately: allocation frameworks typically assess local need and distribute resources without representing how inter-community connectivity shapes the propagation of disruption and the effectiveness of intervention over time, while connectivity-focused models rarely evaluate competing allocation strategies under that propagation [
37,
38,
39]. Recent resilience-oriented studies have further emphasized the importance of interconnected socio-technical systems, adaptive infrastructure planning, cascading regional effects, and network-aware disruption modeling in understanding large-scale crisis behavior [
40,
41,
42,
43,
44,
45,
46,
47,
48,
49,
50,
51,
52,
53,
54,
55,
56,
57,
58,
59]. This independence assumption understates the degree to which conditions in one community are determined by conditions in adjacent ones, and it limits the ability of decision-support tools to capture the cascading regional dynamics that characterize real-world crises. Furthermore, while risk classification and vulnerability indices provide useful snapshots of community exposure, they rarely inform a systematic comparison of how alternative allocation strategies perform across a range of resource constraints, intervention timings, and connectivity configurations. The result is that decision-makers facing large-scale, regionally cascading disruptions lack a quantitative basis for choosing between competing response strategies and understanding the conditions under which each is most effective.
Epidemic crises provide a representative context in which interdependent infrastructure stress, population movement, and policy-driven intervention occur simultaneously. An infectious disease propagates along the same social and economic pathways that connect communities under normal conditions, meaning that social connectivity is often simultaneously the medium of transmission and the structure through which response resources must flow [
60,
61,
62]. The Social Connectivity Index (SCI), derived from Meta’s Data for Good platform, quantifies the strength of inter-county social ties. It has been used as a predictor of disease trajectory similarity and behavioral compliance with public health interventions [
63,
64], and separately as a predictor of inter-area migration destination choice [
65,
66]. The empirical analysis additionally incorporates publicly available demographic, epidemiological, and connectivity datasets to capture regional variation in population structure, COVID-19 burden, and inter-county social relationships [
67,
68,
69]. Integrating such connectivity information into a resource allocation framework; rather than treating it as a background feature offers a principled basis for identifying which communities face the greatest networked exposure and directing aid accordingly. The COVID-19 pandemic provides a rich and well-documented empirical setting for this purpose, with county-level records of disease burden, population mobility, and service disruption that reveal systematic disparities rooted in social and infrastructural conditions [
70,
71]. Critically, this study does not model disease transmission dynamics. COVID-19 case and death counts are instead treated as exogenous inputs derived from historical data, and the framework is designed to analyze how communities and stakeholders respond to observed disruption through migration, resource allocation, and economic adjustment; not how the disease itself spreads.
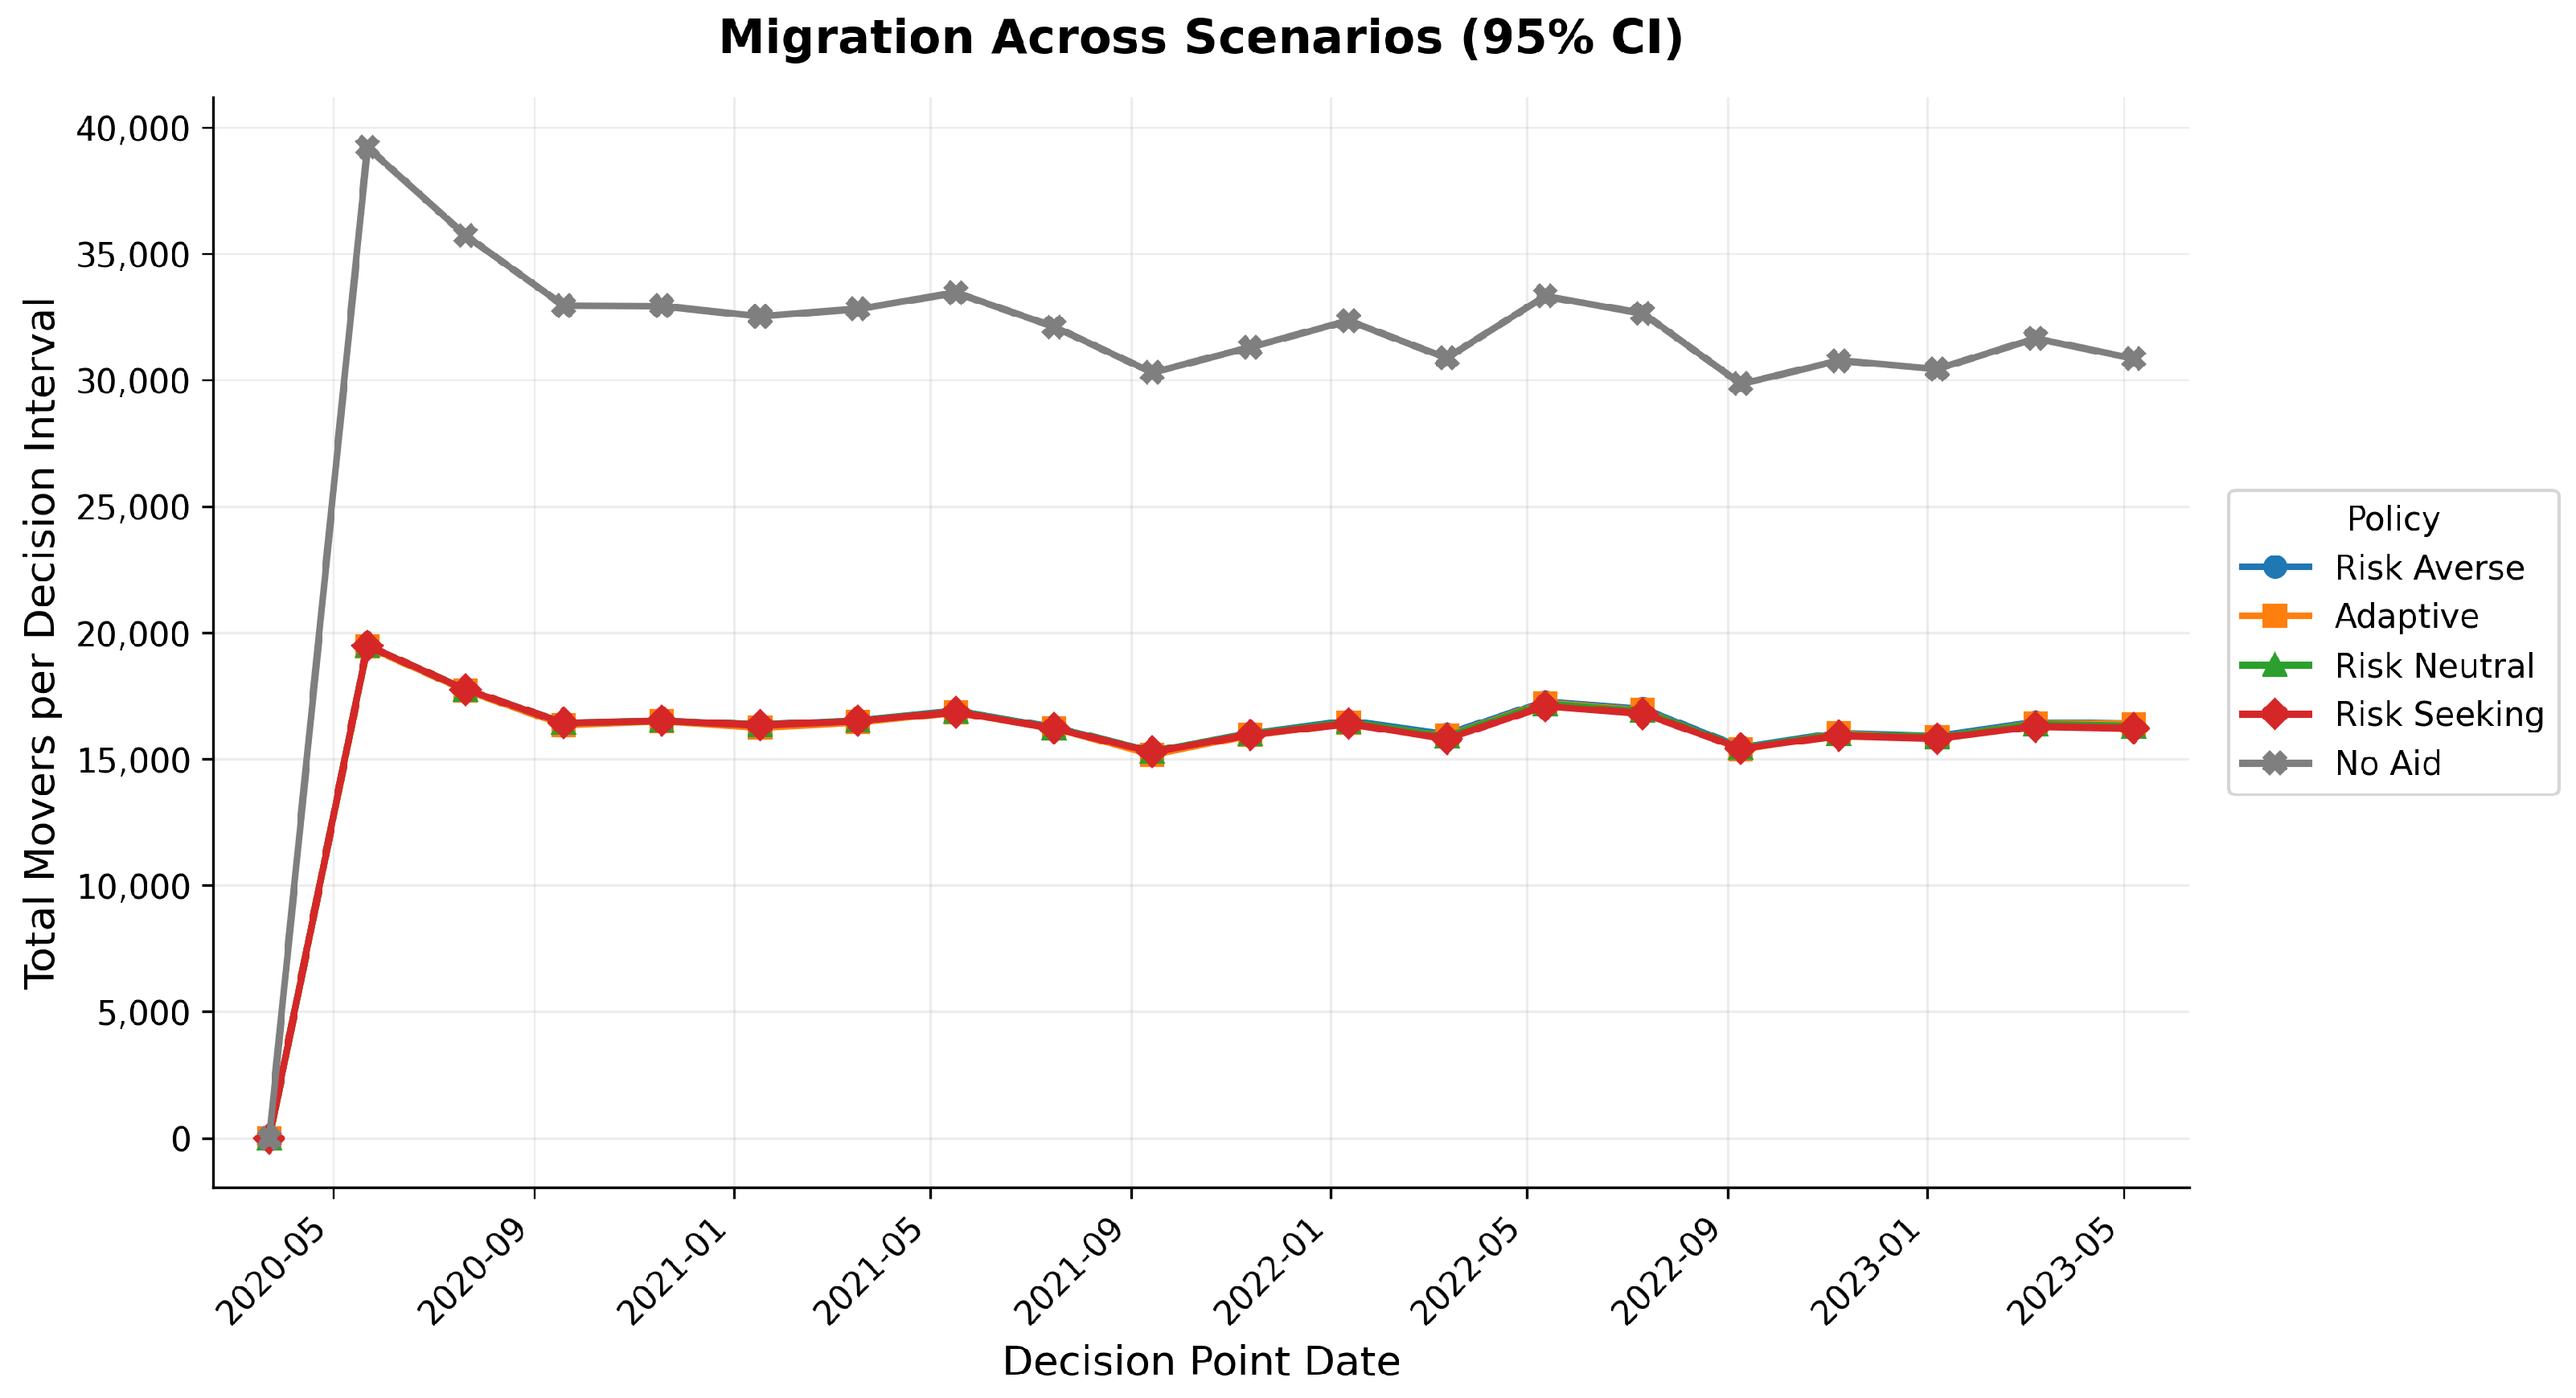
More specifically, this study addresses the identified gap by developing an agent-based response framework that integrates social connectivity, dynamic migration, risk-attitude-based policy regimes, and a WTP-based social cost metric into a unified simulation environment. The framework is instantiated using county-level COVID-19 data for the state of Illinois and evaluated through Monte Carlo simulation across five policy regimes: risk-averse, risk-neutral, risk-seeking, adaptive, and no-aid baseline. By holding external disruption inputs constant across scenarios and varying only the allocation policy, the study isolates the effect of decision logic on regional outcomes including social cost, population movement, and assistance reach.
The principal methodological contribution is the integration of a dynamic, connectivity-weighted Vulnerability Index within a controlled environment for comparing allocation policies under a common hazard trajectory. The Vulnerability Index combines observed local case burden with connectivity-weighted exposure from socially connected communities and evolves as conditions change across the simulation, and it is embedded in a framework that holds an exogenous hazard trajectory constant while varying only the allocation policy. Prior agent-based, mobility, resilience, and network-oriented studies have each addressed components of this problem, modeling disruption propagation or aid targeting separately; the contribution here is to combine dynamic network-mediated vulnerability assessment with the systematic comparison of risk-attitude allocation regimes under identical disruption conditions, with connectivity entering as one component of that environment rather than as the dominant driver of the results. This integration enables three findings that the separated literatures do not directly establish. First, the highest-intensity (risk-averse) regime consistently shows the lowest social cost among the intervention regimes across a broad range of modeling assumptions. Second, intervention timing and prioritization efficiency exert a stronger influence on regional outcomes than total aid volume, with diminishing returns emerging once critical community needs are met. Third, adaptive strategies do not consistently improve upon simpler proactive rules, indicating that consistency and speed of allocation, rather than policy complexity, are the structural determinants of resilience under prolonged disruption.
Note that while the empirical instantiation draws on COVID-19 data, the framework is intended to be transferable in principle to other hazard types, including natural disasters, infrastructure outages, and supply-chain shocks with similar propagation patterns, subject to validation in those settings. The remainder of the paper is organized as follows.
Section 2 presents the conceptual model and its underlying assumptions.
Section 3 develops the formal model formulation, including the Vulnerability Index, policy and decision mechanisms, and the social cost evaluation approach.
Section 4 describes the simulation design and case study.
Section 5 reports robustness, sensitivity, and temporal results.
Section 6 and
Section 7 discuss the findings and outline limitations and directions for future research.
2. Conceptual Framework
2.1. Overview and Design Rationale
The framework developed in this study is designed to support the evaluation of policy-driven resource allocation strategies in regional systems subject to prolonged external disruption. Its central purpose is not to predict the evolution of a hazard, but to analyze how communities and centralized decision-making agents respond to observed disruption through the reallocation of limited resources, the adjustment of economic activity, and the redistribution of population across an interconnected regional network. This distinction is deliberate. In most real crisis-response environments, stakeholders do not control the hazard itself, instead they act on its observed consequences. The framework is therefore formulated as a response model, in which the disruption signal is treated as an exogenous input and all modeled dynamics concern the behavioral, economic, and mobility responses that follow from it.
Three core design choices shape the structure of the framework. First, communities are represented as nodes in a network rather than as independent units, reflecting the empirical reality that disruption propagates through inter-community connections and that the vulnerability of any given community is partly determined by the conditions of its neighbors. Second, the performance of the system is evaluated through a unified social cost metric that aggregates the burden of service disruption across multiple facility types into a single comparable measure, enabling systematic comparison across communities and policy scenarios. Third, resource allocation is governed by behavioral policy regimes rather than optimization, reflecting the heuristic and institutionally constrained nature of real-world emergency decision-making.
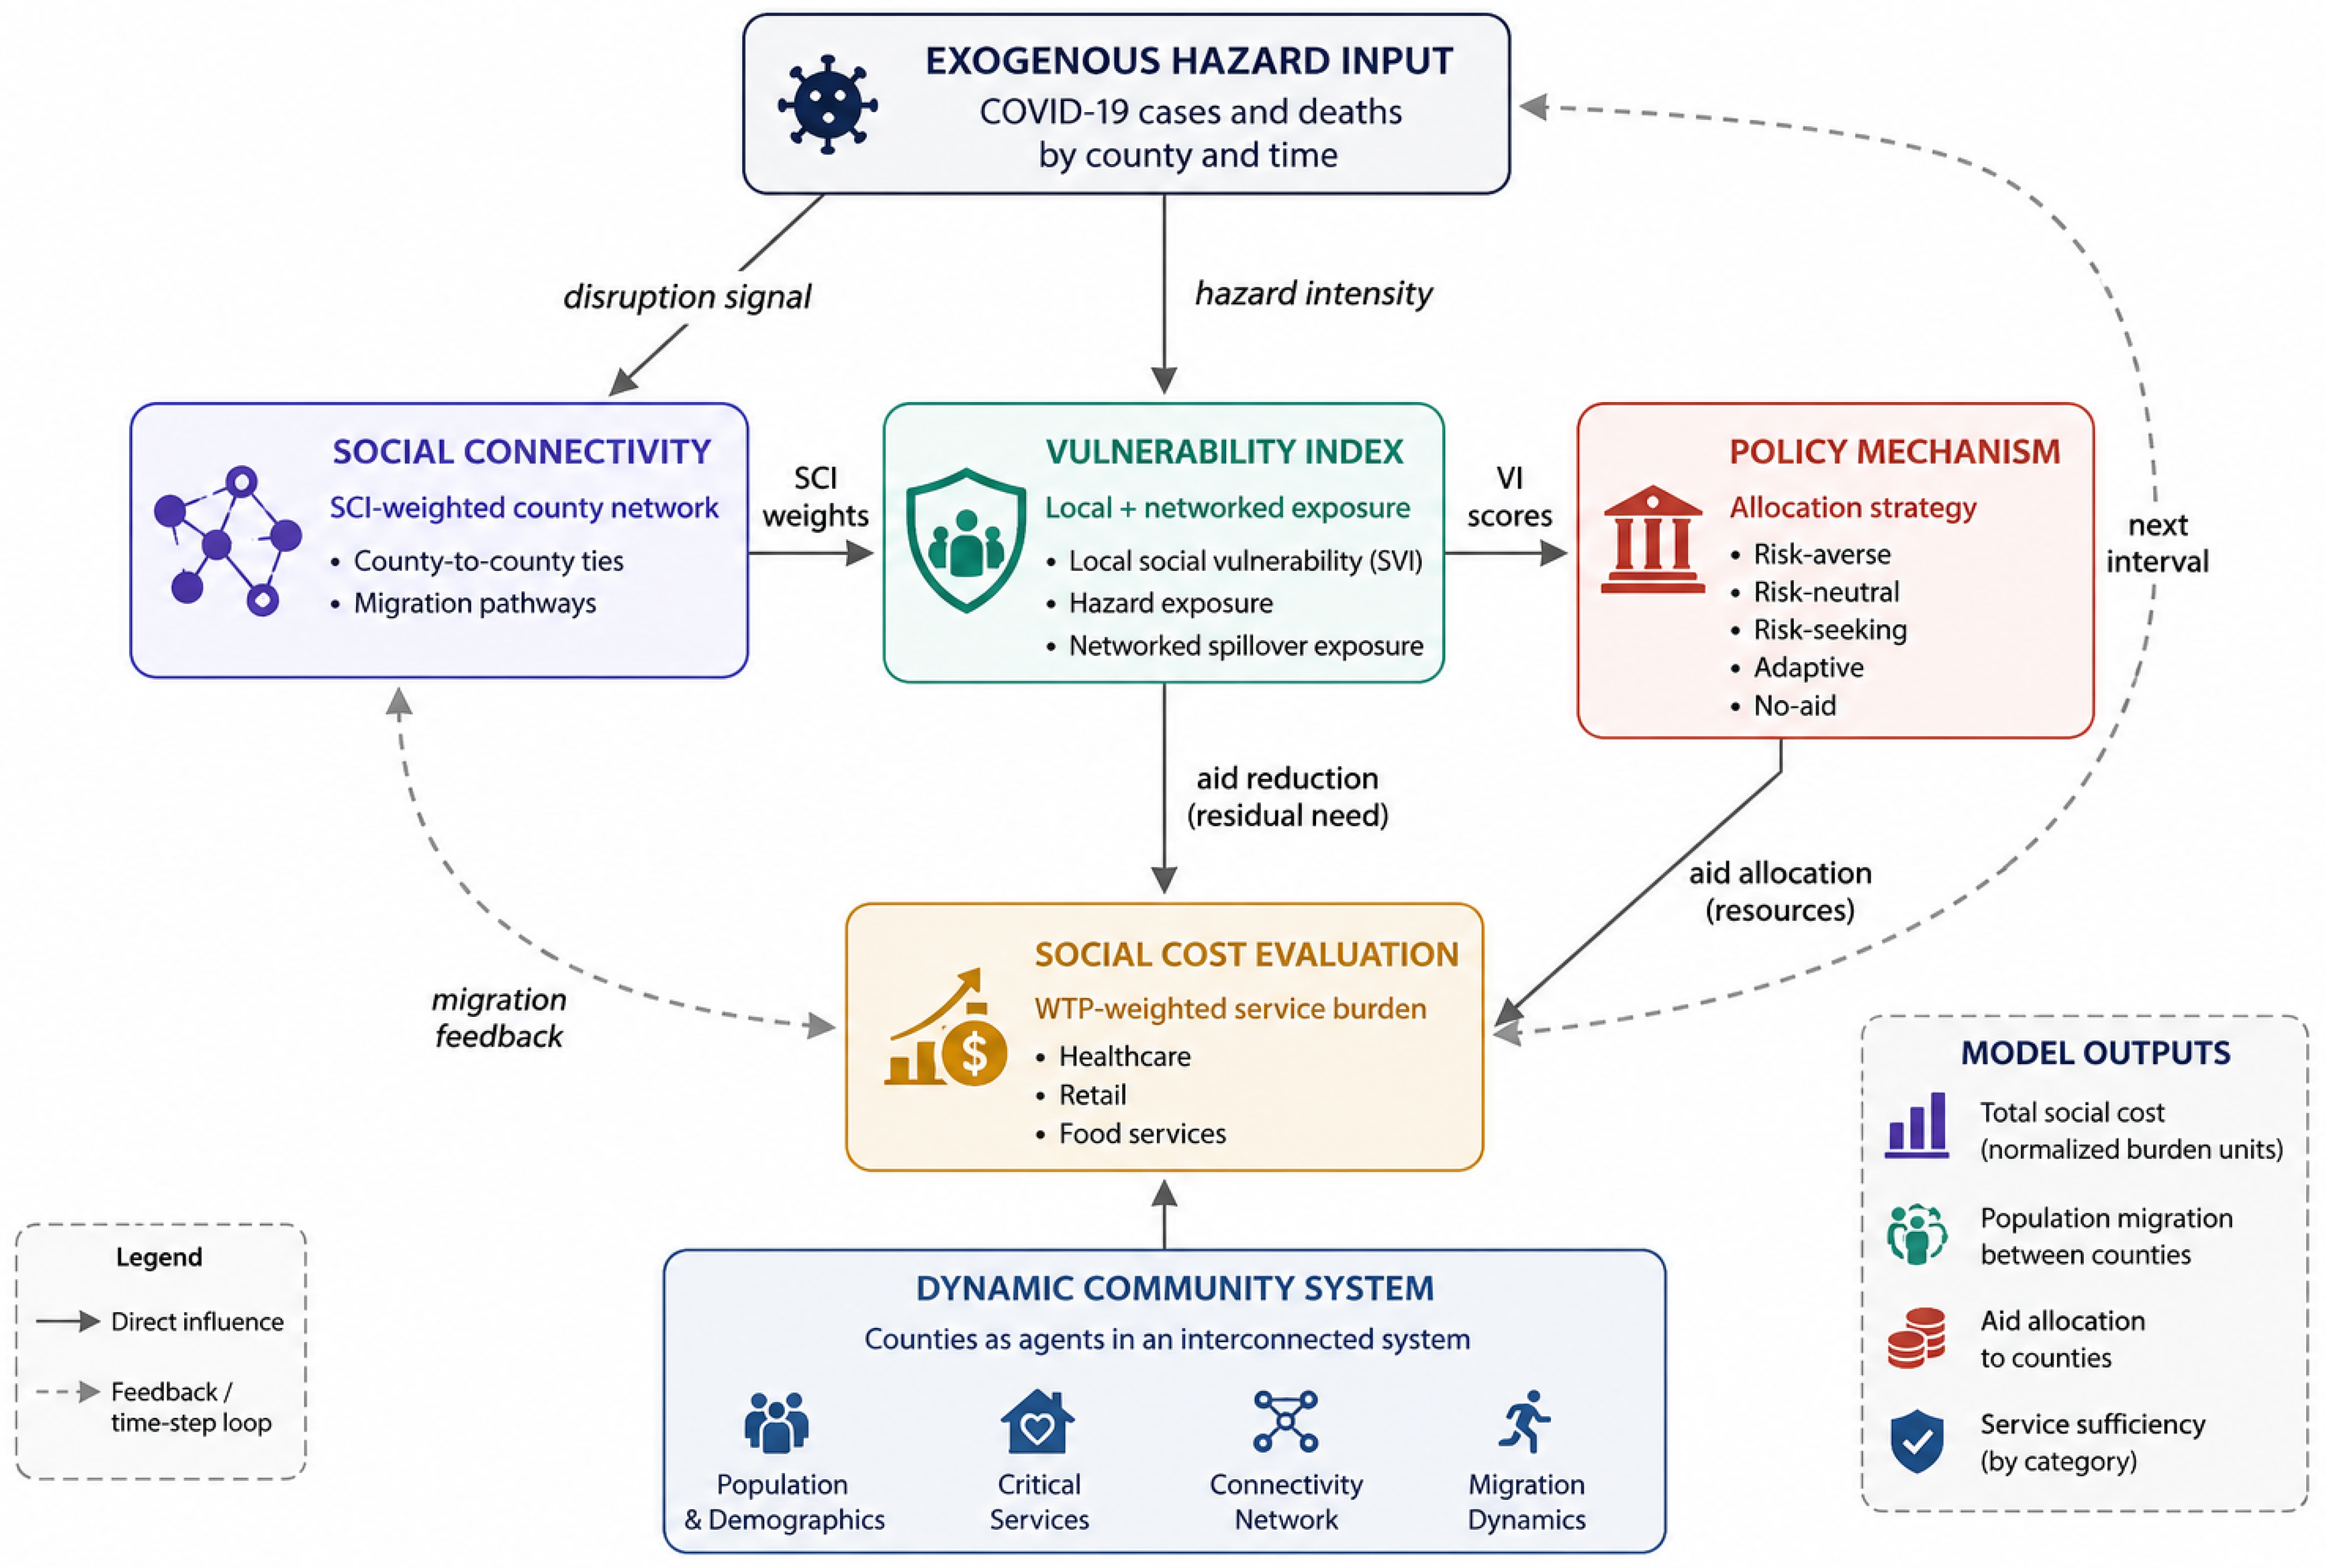
Figure 1 summarizes the conceptual structure of the proposed framework, showing how observed hazard inputs, inter-community connectivity, vulnerability assessment, policy allocation, and social cost evaluation interact across sequential decision intervals. Each of these choices is elaborated in the subsections that follow.
2.2. Community Representation and Networked Interdependence
Each community in the framework is characterized by a set of state variables describing its demographic composition, economic capacity, and the availability of critical service facilities. These variables evolve over discrete decision intervals in response to both external disruption and the policy interventions applied by the centralized agent. Communities are not modeled as isolated entities; they are embedded within a connectivity structure that encodes the strength of social and economic ties between pairs of communities. This structure governs two key dynamics: the propagation of disruption signals across the network, and the movement of population between communities in response to changing local conditions.
The connectivity structure is operationalized using Meta’s Social Connectivity Index (SCI), which quantifies inter-county social ties as a weighted county-to-county network. Each edge represents the relative strength of social connectedness between a pair of counties and provides the structural basis for modeling network-mediated exposure and migration pathways. Each edge in this graph represents the relative strength of interaction between a pair of counties, and the bidirectional nature of the index reflects the symmetric character of social connection. This network provides the structural basis for computing a Vulnerability Index (VI) for each community: a composite measure that combines local disruption intensity with connectivity-weighted exposure from neighboring communities. Communities that are both internally burdened and tightly connected to other high-burden areas receive higher vulnerability scores, reflecting their elevated priority for resource allocation.
Migration is modeled as a sequential, population-conserving redistribution process along SCI-defined connections. For each origin–destination pair, the migration rate is determined by normalized differences in hazard intensity and social cost, the origin community’s baseline migration tendency, the migration scaling parameter, and the aid-adjustment factor. Positive differences direct movement toward communities with lower disruption and social burden, while similar conditions across communities leave baseline migration tendencies as the primary driver. The rate is bounded to ([0, 1]), and migrants are removed from the origin population and added to the destination population. Within each decision interval, migration is evaluated after population has been updated for growth and observed mortality. Although migration conserves population during redistribution, total regional population may still change because growth and mortality are applied beforehand. These movements subsequently alter service demand, vulnerability, and future allocation conditions across the connected regional system.
2.3. Social Cost as the Performance Metric
The primary outcome measure of the framework is social cost, which refers to the aggregate burden imposed on a community’s population due to disrupted access to critical services. Social cost is evaluated across three categories of facilities: healthcare, retail, and food services. Each category is assigned a WTP weight that reflects its relative importance to community functioning [
19]. These weights do not represent direct monetary valuations; instead, they function as relative scaling coefficients that allow heterogeneous service disruptions to be aggregated into a single interpretable metric. Consequently, social cost values reported throughout the manuscript represent aggregated weighted burden units rather than direct monetary currency values and should therefore be interpreted comparatively across policy scenarios rather than as literal dollar-denominated economic losses. A community with a high concentration of healthcare facilities, for example, will incur higher social cost when those facilities are disrupted than a community of comparable size with fewer such facilities because healthcare carries the highest relative weighting in the formulation.
This formulation serves two purposes. At the community level, it translates the operational status of critical facilities into a measure of population-level burden that can be tracked over time. At the system level, it provides a consistent basis for comparing outcomes across communities and across policy scenarios, allowing the analysis to identify which allocation strategies reduce aggregate regional burden most effectively and under what conditions. Social cost is computed at every decision interval, making it a dynamic rather than static measure, capturing how burden accumulates or diminishes as the disruption evolves and as policy interventions take effect.
2.4. Policy Regimes and the Decision-Making Agent
Resource allocation in the framework is performed by a centralized agent that distributes assistance across communities at each decision interval. The agent does not solve an optimization problem; instead, it follows one of several predefined behavioral policy regimes that translate observed community conditions into allocation decisions. This design reflects the institutional reality of emergency management, in which allocation rules are often shaped by organizational priorities, political constraints, and simplified assessment criteria rather than formal optimization.
Four policy regimes are evaluated. The risk-averse regime applies the highest assistance-effectiveness posture uniformly across all aided communities, converting available capacity into support at the strongest rate and reflecting a precautionary stance toward worst-case outcomes. The risk-neutral regime applies an intermediate effectiveness posture, and the risk-seeking regime applies the lowest, reflecting a delayed or minimal intervention stance. The three static regimes therefore differ in how effectively a common baseline capacity is translated into assistance, not in how that capacity is targeted across communities. The adaptive regime is the only regime that reclassifies individual communities during the simulation, raising the effectiveness posture for communities whose hazard or vulnerability exceeds the system mean. A fifth no-aid scenario serves as a counterfactual baseline, capturing system evolution in the complete absence of external intervention. By holding all external inputs constant and varying only the policy regime, the framework enables direct comparison of how different allocation logics shape system-level outcomes under identical disruption conditions.
2.5. Scope and Generalizability
The framework is designed to analyze response dynamics rather than hazard generation. The external disruption is represented as an observed signal; operationalized in this study using historical COVID-19 case and death data for Illinois counties that informs the hazard intensity input to the model at each decision interval. No assumptions are made about how the disruption itself evolves; its trajectory is determined entirely by the historical record. This design choice isolates the analysis from the considerable uncertainties associated with epidemic or disaster forecasting, allowing the framework to focus on the comparative performance of allocation strategies under a common disruption trajectory.
Although the empirical instantiation is grounded in COVID-19 data, the conceptual structure of the framework does not depend on the characteristics of any specific hazard type. The community representation, connectivity structure, social cost formulation, and policy regime architecture are each defined in terms that generalize across disruption contexts. The framework is therefore intended to be transferable in principle, subject to validation with appropriate data inputs, to the analysis of resource allocation under natural disasters, prolonged infrastructure outages, and supply-chain disruptions, that is, settings in which an external event generates cascading service disruptions across an interconnected regional system and in which a centralized agent must allocate limited resources under uncertainty.
3. Model Formulation
3.1. System Structure and State Representation
The proposed framework is formulated as a discrete-time, agent-based system designed to capture the evolution of interconnected communities under conditions of external stress. The model consists of three primary components: (i) community units that represent geographically defined populations, (ii) a centralized decision-making entity responsible for allocating limited resources, and (iii) an exogenous hazard signal that reflects observed disruption intensity. The system evolves over a sequence of discrete decision intervals indexed by t, allowing the model to represent dynamic adjustments in response to changing conditions.
Each community is represented as an aggregate entity characterized by a set of state variables that describe its demographic, economic, and infrastructural conditions. These include population (), economic attributes such as employment and income, and the availability of critical service facilities. The aggregation at the community level is a deliberate modeling choice that enables tractable representation of large-scale systems while preserving the key structural features necessary to analyze system-level responses. Communities are embedded within a connectivity structure that governs interactions across the system. This structure captures interdependencies among communities and enables the representation of non-local effects, such as migration flows and the propagation of stress signals across connected regions.
The decision-making component is modeled as a centralized agent that observes system conditions and allocates resources across communities at each decision interval. This agent does not optimize a global objective function; rather, it operates according to predefined policy regimes that reflect different behavioral orientations toward risk. This formulation is intended to represent stylized decision-making processes observed in practice, where policy actions are often guided by heuristics or institutional rules rather than fully optimized solutions. By holding the external conditions constant and varying the policy regime, the framework enables systematic comparison of alternative allocation strategies and their implications for system performance.
The external hazard is represented as an exogenous signal that varies across communities and over time, operationalized using observed indicators derived from historical data. Two county-level quantities are drawn from the data at each interval
t: the number of newly reported COVID-19 cases
and the number of reported COVID-19 deaths
. Hazard intensity is defined from the case count,
the ratio of newly reported cases to the current county population. Deaths enter the model only through the population update,
where
g is the baseline growth factor. Case counts drive the hazard term and, through it, vulnerability and policy response. Deaths reduce the population at risk, which influences migration, vulnerability, and allocation at subsequent intervals through the changed population base. Both series are obtained from daily USAFacts county reports and aggregated to the bimonthly decision intervals of the simulation. The label “observed impact” used in the simulation procedure refers to the aggregated case count
within an interval and is not a separate variable. Case incidence serves as the primary hazard indicator because the framework targets resilience and intervention effectiveness and does not model disease progression.
The framework does not model disease transmission and does not include epidemiological state variables such as susceptible, exposed, infectious, or recovered populations. Observed case incidence is treated as an exogenous disruption signal because rising case prevalence accompanies greater healthcare demand, workforce absenteeism, supply-chain strain, and reductions in service availability. These effects fall on the healthcare, retail, and food-service categories that define the model’s social-cost formulation, which makes case incidence a practical proxy for broader community disruption.
Time progression in the model is governed by discrete decision intervals, during which the system state is updated sequentially. At each interval, population levels are adjusted based on growth and reported deaths , the hazard signal is updated, and derived quantities such as vulnerability and social cost are computed. This sequential update structure provides a transparent and modular representation of system dynamics, enabling the integration of multiple interacting components while maintaining clarity in how state transitions occur over time.
3.2. Networked Risk and Community Dynamics
The framework represents communities as elements of an interconnected system in which local conditions depend on internal characteristics and on interactions with other communities. A network-based representation of social connectivity governs the propagation of external stress signals and the movement of populations across the system, allowing the model to characterize
networked risk: the exposure of a community is shaped by its own conditions together with those of its connected neighbors. This relational view is consistent with recent evidence that disruption and recovery in community systems propagate through inter-community dependencies and do not remain confined to individual localities [
4,
6,
7].
To quantify community-level exposure, the model defines a
Vulnerability Index (
VI) that combines local disruption burden with connectivity-weighted external signals. For community
i at time
t,
where
denotes the observed county-level case burden during interval
t,
represents the social connectivity between communities
i and
j, and
is a binary hazard indicator equal to 1 when the hazard intensity in community
j exceeds the system median and 0 otherwise. The parameter
controls the influence of high-risk neighboring communities on the connectivity-weighted exposure term. The neighborhood set
contains the counties connected to community
i through the SCI network. Because the SCI data include both inter-county and self-referential ties, the exposure term reflects a combination of local and network-mediated disruption conditions, with
carrying the local burden explicitly and the SCI-weighted sum carrying the influence of connected communities.
The index expresses two sources of risk within a single quantity. Local case incidence captures disruption inside the focal community, and the weighted exposure term captures pressure originating from socially connected communities that are experiencing elevated disruption. A community with high local case burden and strong ties to other high-risk regions receives a larger vulnerability score and is prioritized more aggressively under risk-based allocation. Dividing the weighted exposure term by the total SCI weight prevents communities with large aggregate connectivity from receiving high scores merely because of network size. The hazard indicator is binary and threshold-based. It separates counties experiencing elevated disruption from those at routine levels and limits sensitivity to short-term fluctuations in reported case incidence, which keeps the exposure term focused on whether a neighbor is currently a high-risk source rather than on the precise magnitude of its case count. The threshold is the system-wide median of hazard intensity at each interval, so classification is relative to the current state of the system and not fixed at an absolute case level. This relative definition suits the comparative design of the study, since a county counts as a high-risk neighbor when its hazard exceeds the prevailing system level at that interval, and the same rule applies across all policy scenarios. A median split partitions counties by relative standing by construction, so during low-disruption intervals roughly half of all counties are labeled high hazard even though their absolute case burden is low. This behavior is intended. The indicator marks which neighbors are comparatively elevated within the network, while the continuous local term in Equation (2) carries absolute burden, so a county with low local cases receives a low vulnerability score even when several of its neighbors sit above the interval median. The two terms play distinct roles: encodes relative neighbor standing, and anchors the index to absolute local conditions.
Relationship to Existing Vulnerability Frameworks
The proposed Vulnerability Index relates to several established approaches in disaster resilience, public health preparedness, and community risk assessment. Widely used examples include the Centers for Disease Control and Prevention (CDC) Social Vulnerability Index (SVI) [
72], Cutter’s Social Vulnerability framework [
73], and the Baseline Resilience Indicators for Communities (BRIC) [
74]. These indices identify populations likely to be disproportionately affected by disasters, disease outbreaks, and infrastructure disruptions, and they have informed preparedness planning and resource targeting across a range of hazard contexts.
The CDC SVI characterizes community susceptibility using demographic and socioeconomic indicators such as income, age distribution, disability status, housing conditions, and transportation access [
72]. Cutter’s framework similarly emphasizes how social and economic characteristics shape a community’s capacity to prepare for, respond to, and recover from disruptive events [
73]. BRIC broadens this perspective across social, economic, institutional, infrastructural, environmental, and community-capacity dimensions [
74]. These frameworks draw on indicators that change slowly, which suits them to characterizing baseline vulnerability and limits their ability to track the evolving conditions of an active crisis.
Recent work has begun to address this temporal limitation. Longitudinal modifications of the CDC SVI extend the index across historical census periods so that vulnerability can be examined as societal composition changes over time [
75]. Mobility-based formulations move further in this direction by deriving vulnerability from population movement and updating it across the pre- and post-disaster phases of an event [
76]. These developments reflect a broader shift toward vulnerability measures that respond to changing conditions during a disruption.
The Vulnerability Index used here belongs to this emerging class of dynamic measures and is distinguished by its explicit treatment of inter-community connectivity. Vulnerability evolves across the simulation as observed disruption intensity changes, so the index tracks the trajectory of the crisis directly. Inter-community social connectivity enters through the SCI, allowing a community’s score to reflect network-mediated exposure from connected regions. Population redistribution feeds back into both connectivity and local conditions, so migration alters vulnerability trajectories over the course of the simulation. The index complements established vulnerability frameworks by supplying a connectivity-aware, time-varying measure suited to policy evaluation within interconnected socio-technical systems under prolonged disruption.
The SCI provides the structural basis for inter-community interaction.
SCI values act as weights on a dense county-to-county network that encodes the relative strength of interaction between community pairs [
61,
63]. To reflect changing system conditions, connectivity weights evolve with population. Connectivity between communities
i and
j at time
updates as
where
and
denote proportional population changes in the respective communities. This update is a modeling approximation that encodes the intuition that shifts in population distribution can alter the intensity of inter-community interaction. It introduces a mechanism for adjusting network influence over time and does not assert an empirically estimated relationship.
SCI values are constrained to remain nonnegative after each update and are not explicitly re-normalized between intervals. Normalization instead occurs inside the Vulnerability Index through the weighted-average structure of Equation (2), where the SCI-weighted exposure term is divided by the total SCI weight of each focal community. Meta’s SCI is a static measure of baseline social connectedness, and the update rule allows population redistribution to modify interaction intensity while preserving the original SCI network as the baseline structure. Counties gaining population exert greater interaction influence, and counties losing population exert less. Because the update is proportional to interval-level population change and bounded below at zero, it keeps connectivity nonnegative while permitting limited temporal adjustment in connectivity strength. The updated SCI values are interpreted as a simulation construct and not as directly observed changes in social relationships. The update changes the relative weights within a focal county’s neighborhood, since the destination term varies across neighbors, so it is not a pure common rescaling. The internal normalization in Equation (2) removes only the component of the drift that is common to all of a county’s edges, the overall scale of its total SCI weight, while preserving the relative differences among neighbors that the weighted average is intended to capture. Larger relative SCI weights therefore continue to exert greater influence on exposure by design, and the nonnegativity constraint keeps the updated weights well defined.
Influence across county pairs is heterogeneous even though the network is dense. Counties with stronger social ties contribute more heavily to vulnerability through the SCI-weighted exposure term. For migration, SCI defines the feasible movement pathways, while migration volume follows from hazard differences, social-cost differences, baseline migration tendencies, and aid conditions. The use of social connectivity to structure relocation pathways is supported by evidence that the Facebook Social Connectedness Index predicts inter-area migration destination choice, including during the COVID-19 period [
65], and that social-network structure causally shapes where migrants relocate [
66]. The uniform-connectivity ablation reported in
Section 5 removes this heterogeneity and isolates whether the results depend on the specific SCI weighting structure.
Migration between connected communities is modeled as a sequential, population-conserving redistribution process. For an origin community
i and destination community
j, the migration rate is
where
is the normalized difference in hazard intensity between counties
i and
j,
is the normalized difference in social cost,
is the baseline migration tendency of community
i, realized at each interval as the risk-adjusted value
,
is the migration scaling parameter, and
is the aid-adjustment factor. Migration rates are bounded to
to prevent unrealistic population transfers. When two communities present similar hazard and social-cost conditions, the normalized difference terms approach zero and the baseline tendency
governs movement, which keeps destination selection well defined when origin and destination share comparable disruption profiles.
The number of migrants transferred along a connection is
where
is the current population of community
i and
is the portion of that population assisted in the previous interval. Migration is evaluated before the current-interval assistance step (Algorithm 1), so the most recent available assisted count is the one carried from interval
. Subtracting this previously assisted population lowers migration pressure in communities that received effective intervention in the prior interval while keeping the redistribution population-conserving. Positive values of
and
arise when the origin carries greater hazard burden or social cost than the destination, so movement is directed toward communities with comparatively lower disruption and lower social burden, which serve as the more attractive destinations in the network. Migration is evaluated only along existing SCI connections, so social connectedness sets the feasible movement pathways and shapes migration volume indirectly through the structure of available destinations. SCI enters the destination choice as an eligibility filter and not as a flow weight: it determines which origin–destination pairs are admissible, while the migrated volume along each admissible pair is set entirely by
in Equation (4), which contains no SCI term. Two neighbors with identical hazard and social-cost gaps therefore receive equal migration pull regardless of their SCI magnitude.
| Algorithm 1: Monte Carlo agent-based simulation procedure |
- Data:
County-level demographic and economic data, SCI network, and observed county-level case counts and death counts . - Result:
Time-series measures of migration, social cost, vulnerability, assistance, and sufficiency.
 |
Several safeguards keep the redistribution physically consistent with migration behavior observed in disaster settings [
11,
14]. Bounding the rate to
prevents any single transfer from exceeding the available source population at the time it is evaluated. Migration is applied sequentially, so once migrants move from an origin to a destination, both populations update before the next transfer is computed, which prevents cumulative outflows from driving a county below feasible levels during redistribution. All transfers are within-network, so individuals leaving one county enter another SCI-connected county and remain in the regional system. Assistance influences migration through the aid-adjustment factor, through the previous-interval assisted population subtracted in Equation (
5), and through subsequent changes in social cost and policy conditions; current-interval assistance is computed after migration and therefore affects relocation only at the following interval.
Together, the Vulnerability Index, the dynamic connectivity update, and the migration process define the mechanisms through which networked interactions drive system evolution. They allow the model to represent local and non-local effects and to trace how stress propagates across connected communities and how behavioral responses redistribute population and risk over time.
3.3. Policy and Decision Mechanism
A centralized decision-making agent distributes assistance across communities at each decision interval. The agent applies a set of predefined behavioral rules that represent stylized decision environments in which allocation follows heuristics and institutional priorities rather than a fully specified objective function. At each interval the agent evaluates two indicators for every community: hazard intensity and the Vulnerability Index. Together these characterize the observed stress level of a community. The static regimes do not use these indicators to target individual communities; they hold one effectiveness posture for all aided communities throughout the run. The adaptive regime alone uses the two indicators to reclassify communities over time, as stated in
Table 1.
Under each static regime, every aided community receives the baseline capacity a and the same regime-specific effectiveness band, so the regimes set how strongly that capacity is converted into assistance rather than which communities are favored. The risk-averse band is highest, the risk-neutral band intermediate, and the risk-seeking band lowest, which produces progressively weaker mitigation of social burden across the three. These regimes are behavioral strategies that enable systematic comparison of how the strength of intervention shapes system outcomes, and they are not intended as optimal policies.
The adaptive regime adjusts allocation as system conditions evolve. At each interval it reclassifies every community: a community whose hazard intensity or Vulnerability Index exceeds the current system-wide mean receives a risk-averse posture and more aggressive assistance, and a community below both means receives a risk-seeking posture and lower assistance. A community held in the risk-averse posture for three consecutive intervals is reassigned to a neutral posture, which prevents persistent over-prioritization of the same locations.
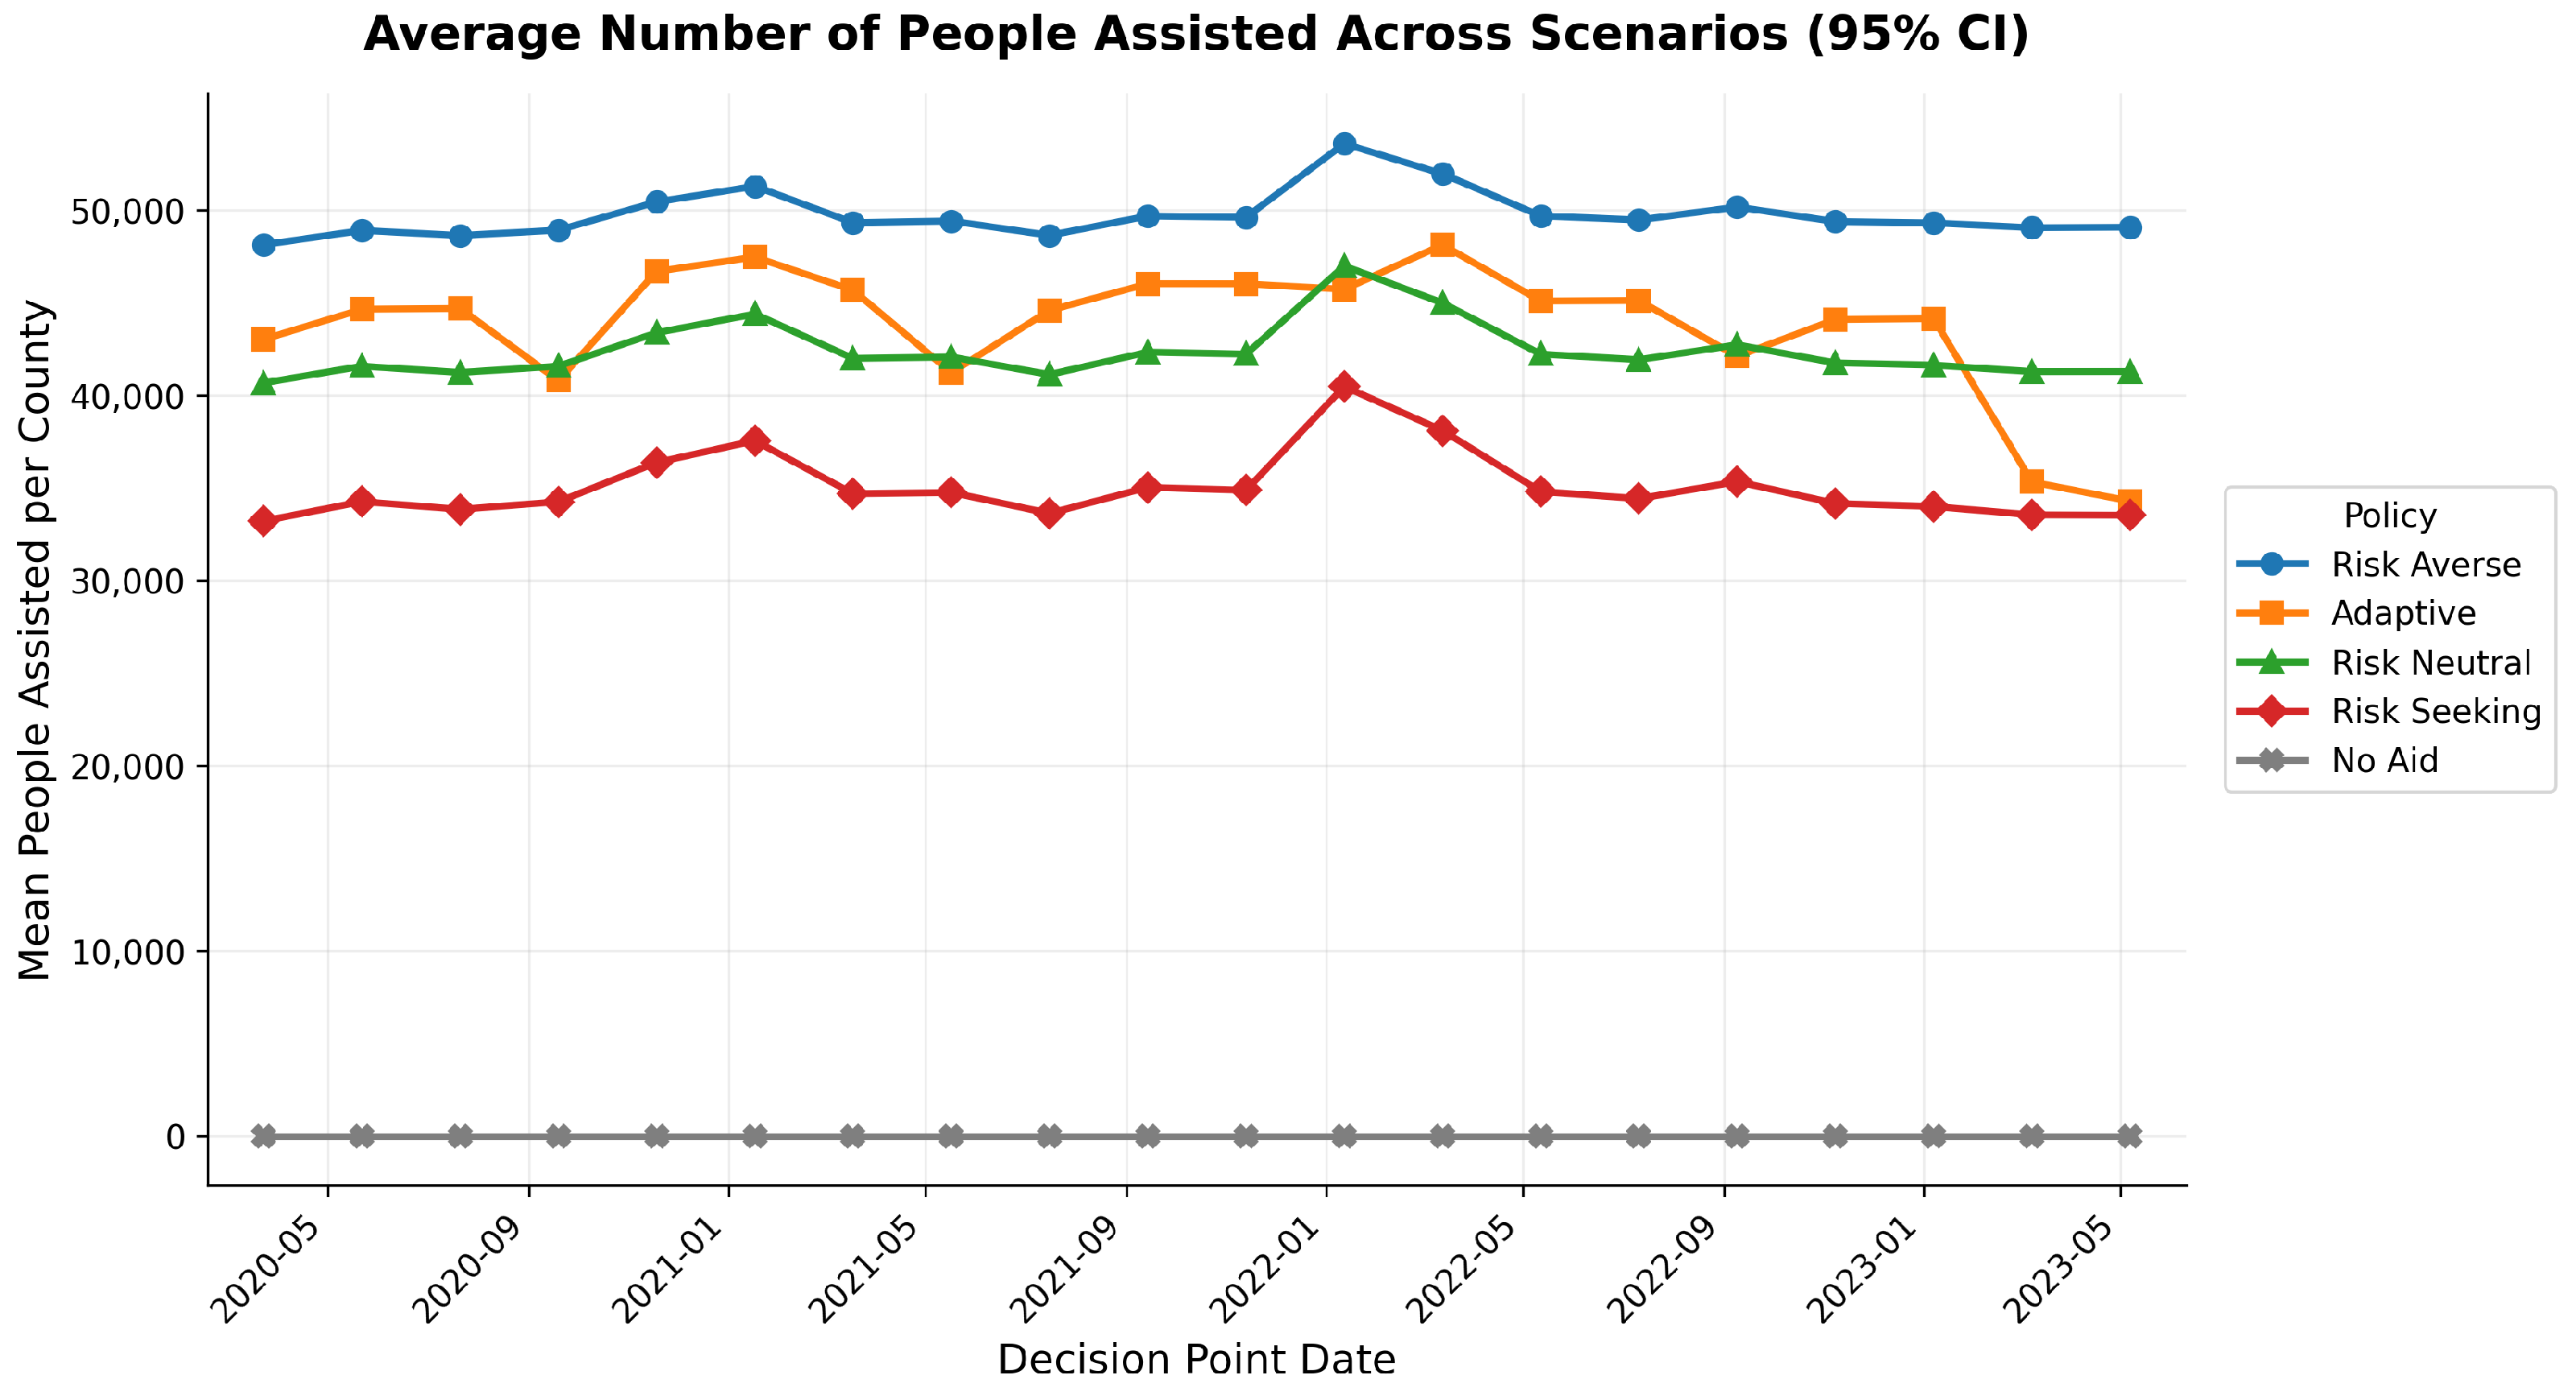
Assistance enters the system through population support, business support, and the resulting mitigation of service disruptions, which alter economic capacity and social cost at later intervals and reshape migration incentives across the network. Holding external conditions identical across scenarios isolates the effect of the decision logic itself on system outcomes. Assistance is computed in three steps: each aided county starts from the same intervention capacity, the policy regime sets how effectively that capacity converts into support, and a random draw within the regime’s effectiveness range determines the realized assistance for that county and interval. When aid is active, every aided county receives the same baseline intervention-capacity parameter a, set to in the baseline scenario. The parameter a is an abstract intervention-capacity value, not a count of individuals, so the reported “People Assisted” figures are the estimated number of individuals reached after capacity passes through this assistance function, summed across all aided counties; this is why a per-county capacity of produces system-wide totals in the tens of thousands. The no-aid scenario sets assistance to zero for every county.
The capacity pool is not divided among counties; each county draws on the full parameter independently. The policy regime then fixes an assistance-effectiveness interval
, which sets how strongly that capacity is converted into support:
A higher interval means capacity converts into assistance more effectively. The risk-averse regime therefore has the strongest effectiveness, applied uniformly to all aided counties, and the risk-seeking regime the weakest. For each county
i and interval
t, a single draw
is taken uniformly from the regime’s effectiveness interval. The assistance computation is discretized into
S sub-trials per interval, and the draw is converted into an integer success count
so
of the
S sub-trials deliver effective assistance and the remaining
deliver only a low baseline level. A higher effectiveness interval yields a larger
and therefore more effective support. Population assistance is the average over these
S sub-trials of the support delivered in each:
where
is the number of new cases and
is the current county population. In a successful sub-trial, the case population receives full support and the remaining population receives partial support at coefficient
; in an unsuccessful sub-trial, the whole population receives only the low baseline coefficient
. The corresponding number of individuals effectively reached is
Business assistance is computed the same way, using an independent draw from the same interval and county business counts in place of population.
3.4. Economic and Social Cost Evaluation with Simulation Design
The evaluation of system performance combines economic capacity modeling with a unified social cost metric. The economic component represents baseline productive capacity and demand, while the social cost formulation quantifies the burden associated with disruptions to critical services. Economic conditions within each community are represented using aggregate measures of capability, demand, and sufficiency. Capability reflects the productive potential of a community based on its population and economic attributes, while demand represents the level of economic activity required to sustain normal operations. For community
i at time
t, capability and demand are defined as
The ratio of available resources to required demand is captured through a sufficiency measure,
which indicates whether a community can maintain economic functionality given internal capacity and external assistance. The assistance terms
and
are expressed on the same income-equivalent scale as capability so that the ratio is dimensionally consistent.
The primary outcome measure of the framework is
social cost, which quantifies the burden imposed on a community due to disruptions in access to critical services. Social cost is a weighted aggregation of service disruptions across facility categories, including healthcare, retail, and food systems. For community
i at time
t,
where
k indexes facility types,
is the weight associated with each service category, and
T is the duration of the decision interval. The
values act as relative weighting coefficients that differentiate the social importance of service categories and do not represent direct monetary valuations, which allows heterogeneous service disruptions to be aggregated into a single comparable metric. Because the metric aggregates weighted burden units across all facilities and the full residual exposed population without rescaling, the social-cost values are large in absolute magnitude and carry no standalone units; they are meaningful only in comparison across policy scenarios and intervals.
Aid enters social cost through the residual exposed population , so counties with larger effective assistance carry lower residual burden. This residual population is then scaled by the aid-adjustment factor . Under active aid, , so the baseline gives . The no-aid scenario is treated as a separate branch: the multiplicative form does not apply, because no county receives assistance, and the residual-burden factor is set directly to to represent unmitigated disruption pressure. The factor is a model-based adjustment linking the remaining exposed population and intervention capacity to social burden, and does not represent an outage probability or a monetary discount.
4. Simulation Design and Case Study
4.1. Case Study Description
To demonstrate the applicability of the proposed framework, the model is instantiated using a county-level case study of the state of Illinois. This setting provides a diverse set of communities with varying demographic, economic, and connectivity characteristics, enabling evaluation of policy behavior across heterogeneous conditions. The analysis spans the period from March 2020 to May 2023, with the simulation implemented over bimonthly decision intervals, resulting in approximately 20 time steps. This temporal structure allows the model to capture both short-term fluctuations and longer-term system adjustments under sustained external stress.
The empirical instantiation integrates multiple data sources to parameterize the system. Social connectivity between counties is derived from Meta’s SCI, which provides a network-based measure of interaction intensity between geographically separated populations. Hazard intensity is operationalized using observed COVID-19 case and death data obtained from USAFacts [
77], which serve as externally observed indicators of disruption. Socio-economic attributes, including population, employment, and income characteristics, are obtained from publicly available U.S. Census data [
78]. These datasets collectively enable the construction of a data-driven representation of community conditions while preserving the general structure of the proposed framework.
County-level COVID-19 case and mortality data were obtained from USAFacts and aggregated from daily observations to the bimonthly decision intervals used by the simulation. This aggregation was performed to align the temporal resolution of the empirical inputs with the decision-making structure of the model. To reduce the influence of reporting irregularities and uncertainty observed during the earliest stages of the pandemic, the analysis period was restricted to portions of the dataset exhibiting more stable reporting behavior across Illinois counties. Because USAFacts occasionally contains delayed or irregular county-level reporting during the earliest months of the pandemic, no attempt was made to interpolate missing observations. Instead, reported values were aggregated directly within each bimonthly interval, which reduced the influence of short-term reporting artifacts while preserving the observed temporal pattern of disruption. No epidemiological forecasting or statistical smoothing procedures were applied beyond temporal aggregation because the objective of the framework is comparative policy evaluation rather than reconstruction of disease dynamics. Consequently, reported case observations were used directly as exogenous disruption indicators within the simulation.
The Illinois case study provides a realistic and data-rich environment for evaluating how different policy regimes influence system behavior across interconnected communities. By maintaining consistent model structure and parameters across scenarios, the analysis enables direct comparison of policy outcomes under identical external conditions, thereby isolating the impact of decision logic on social cost, migration, and assistance distribution.
4.2. Parameterization
Model parameters are specified to keep conditions consistent across simulation scenarios and to support controlled comparison of alternative policy regimes. All parameters are held constant across scenarios unless explicitly varied, so differences in system outcomes can be attributed to the underlying decision logic and not to exogenous variation in model inputs. The parameters fall into three groups: weighting coefficients used in the social cost formulation, network influence parameters, and behavioral assumptions governing growth and migration.
Table 2 summarizes the primary parameters used in the analysis. The WTP values act as relative weighting coefficients that aggregate heterogeneous service disruptions into a single comparable metric and carry no direct monetary interpretation.
The connectivity amplification parameter
supplies a moderate level of network influence within the Vulnerability Index. Setting
to zero removes connectivity amplification, and large values let neighboring high-risk communities dominate local vulnerability calculations. The baseline value places network effects at a level that meaningfully shapes vulnerability while leaving local disruption conditions controlling. The sensitivity analysis in
Section 5 shows that the principal policy conclusions hold across alternative values of
. Migration behavior is governed by the county-specific baseline tendency
and the global responsiveness multiplier
that appear in Equation (
4). The baseline tendency is read from the county-level migration attribute in the initialization file,
, and transformed as
which gives each county its own behavioral baseline for relocation rather than imposing a uniform rate across communities. The baseline tendency entering Equation (
4) is the risk-adjusted value
so
is scaled by a small stochastic factor set by the county’s current risk posture. With this substitution, the migration rate
in Equation (
4) combines the normalized hazard-intensity difference
, the normalized social-cost difference
, and
, scaled by
and the aid-adjustment factor
. The baseline multiplier is
, and the aid-adjustment factor follows the implementation
with
a the baseline intervention capacity of
Section 3.3. The rate is bounded to
as in Equation (
4), and the migrant count along
follows Equation (
5), with the result floored to whole individuals in implementation.
Because migration behavior is context-dependent and difficult to calibrate consistently across crisis settings,
and
are treated as stylized behavioral assumptions rather than directly estimated parameters. The global sensitivity analysis varies the migration multiplier across
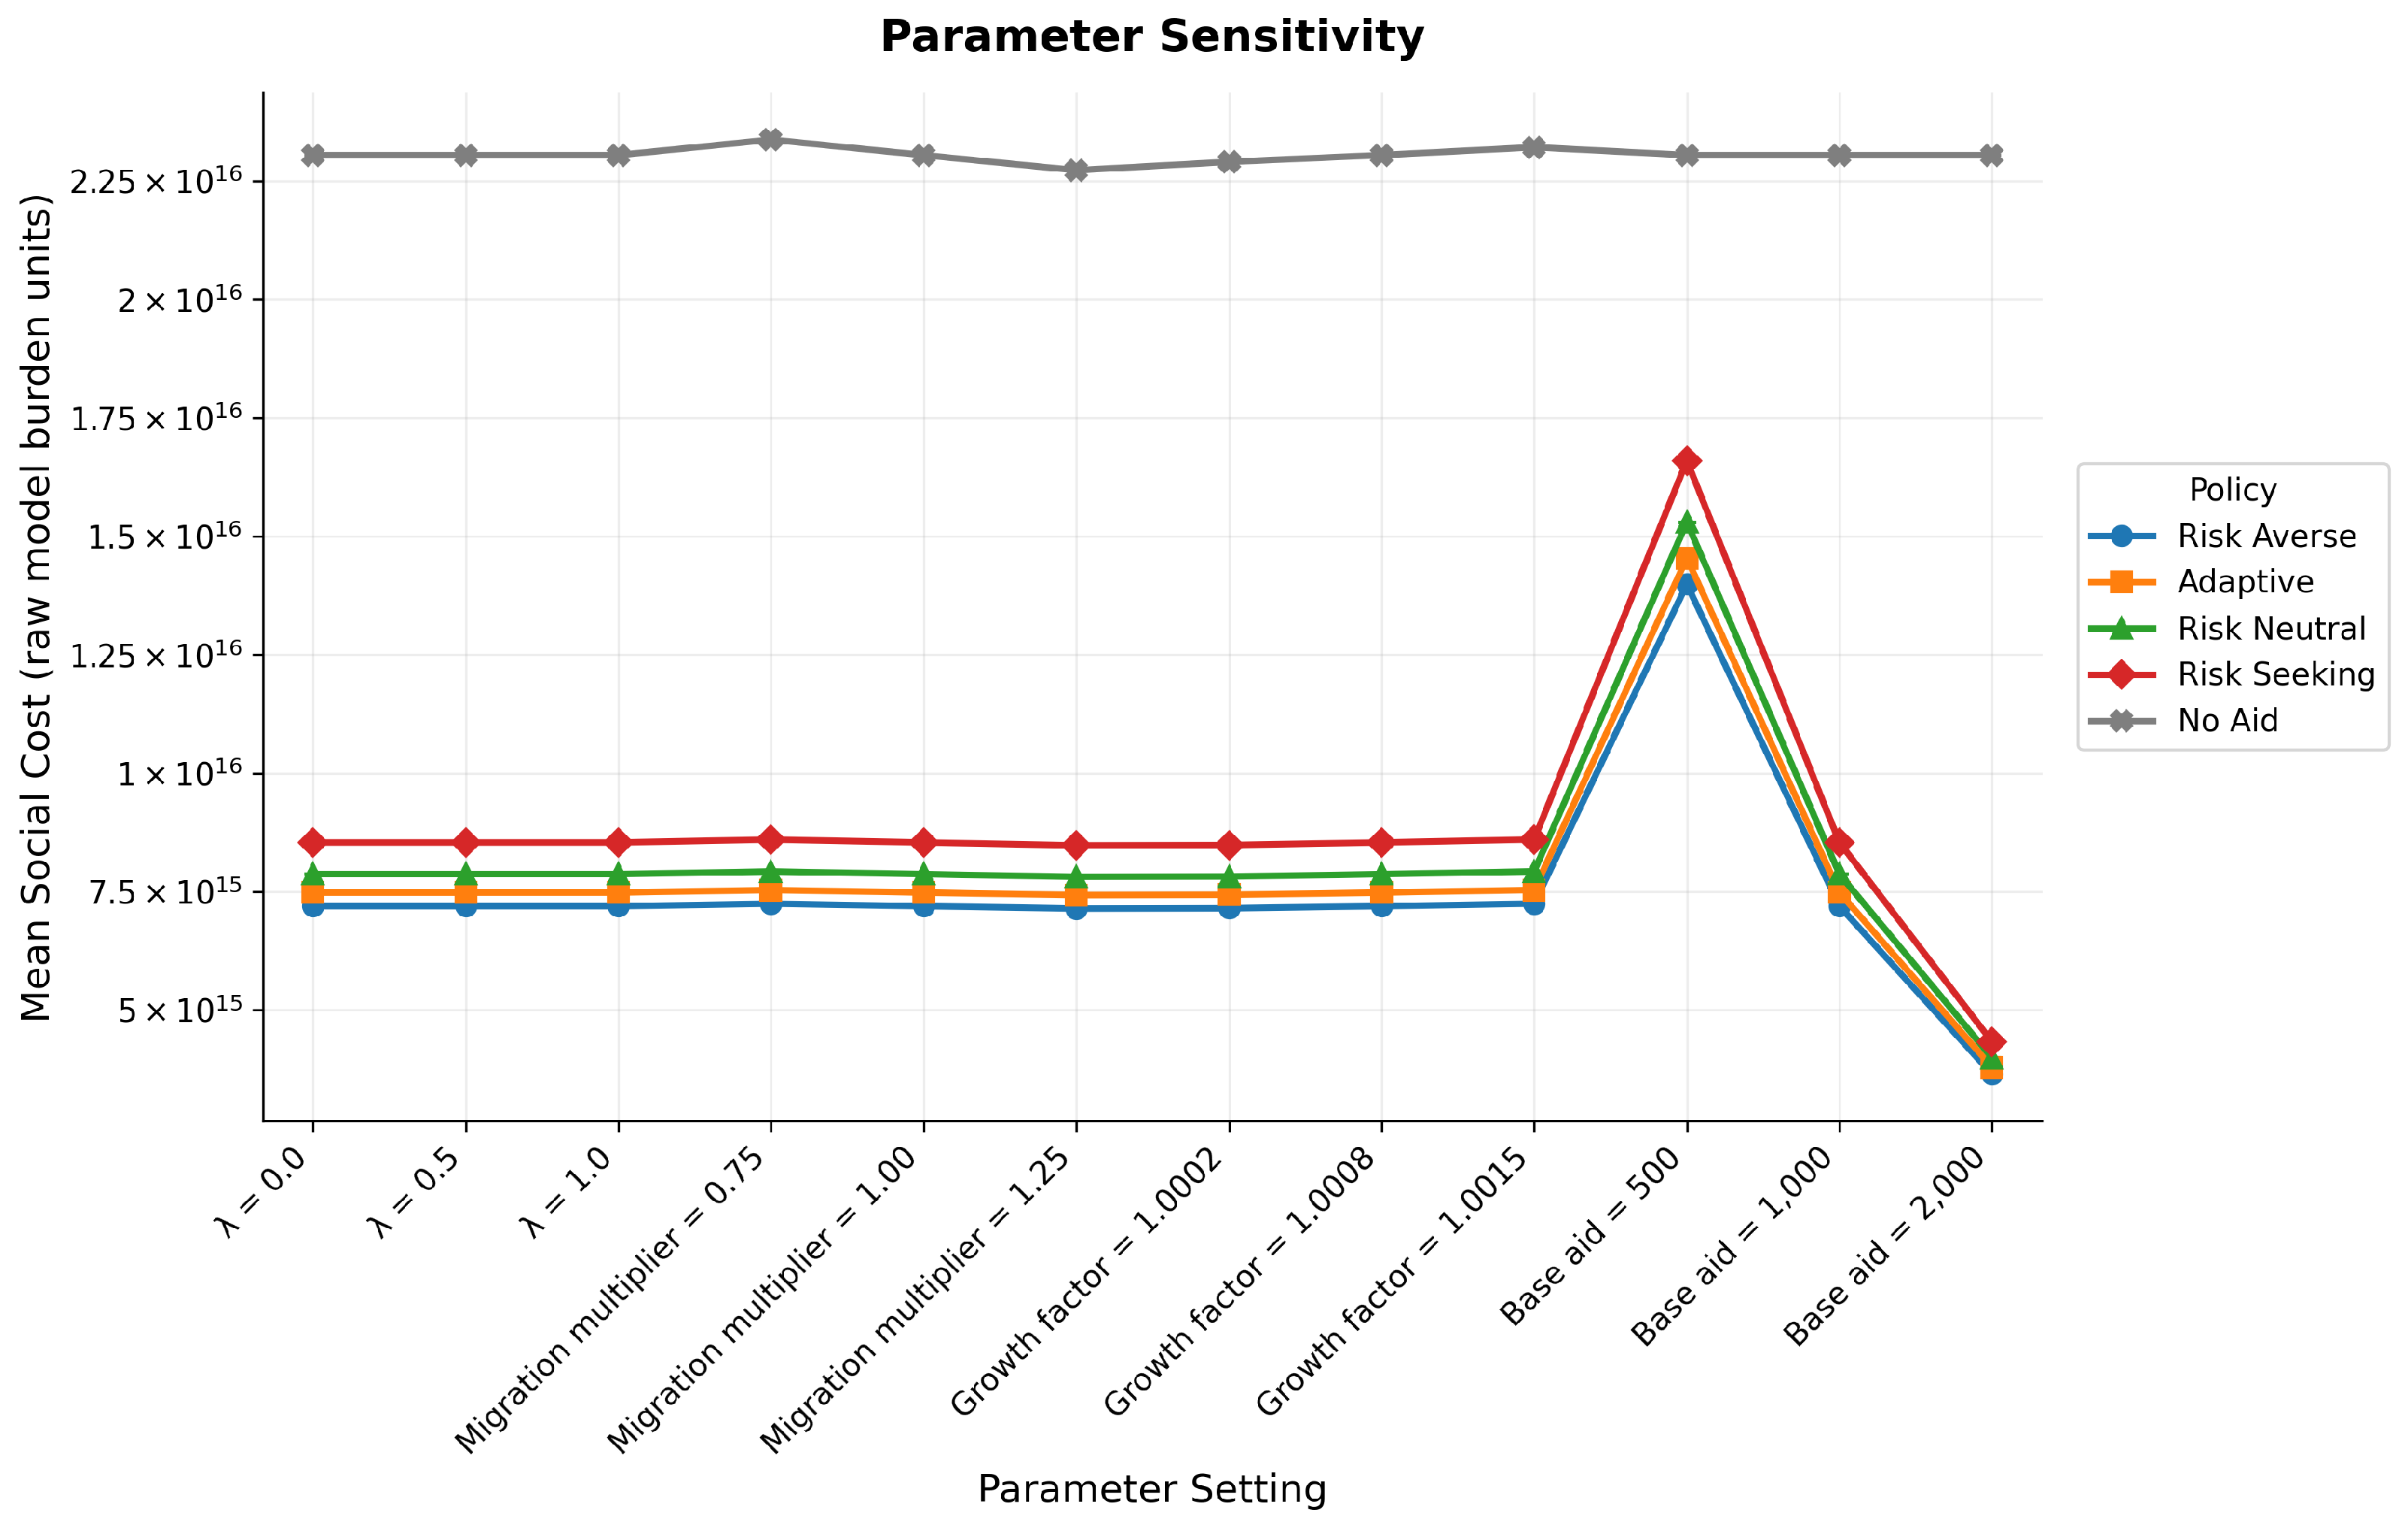
to evaluate whether the relative policy conclusions remain stable under lower, baseline, and higher responsiveness to disruption gradients.
The service-weighting coefficients
,
, and
reflect the relative societal burden of disruptions to each service category. Healthcare carries the highest weight because the resilience literature identifies healthcare systems as critical societal infrastructure whose disruption propagates into public health and emergency response capacity, with downstream economic consequences [
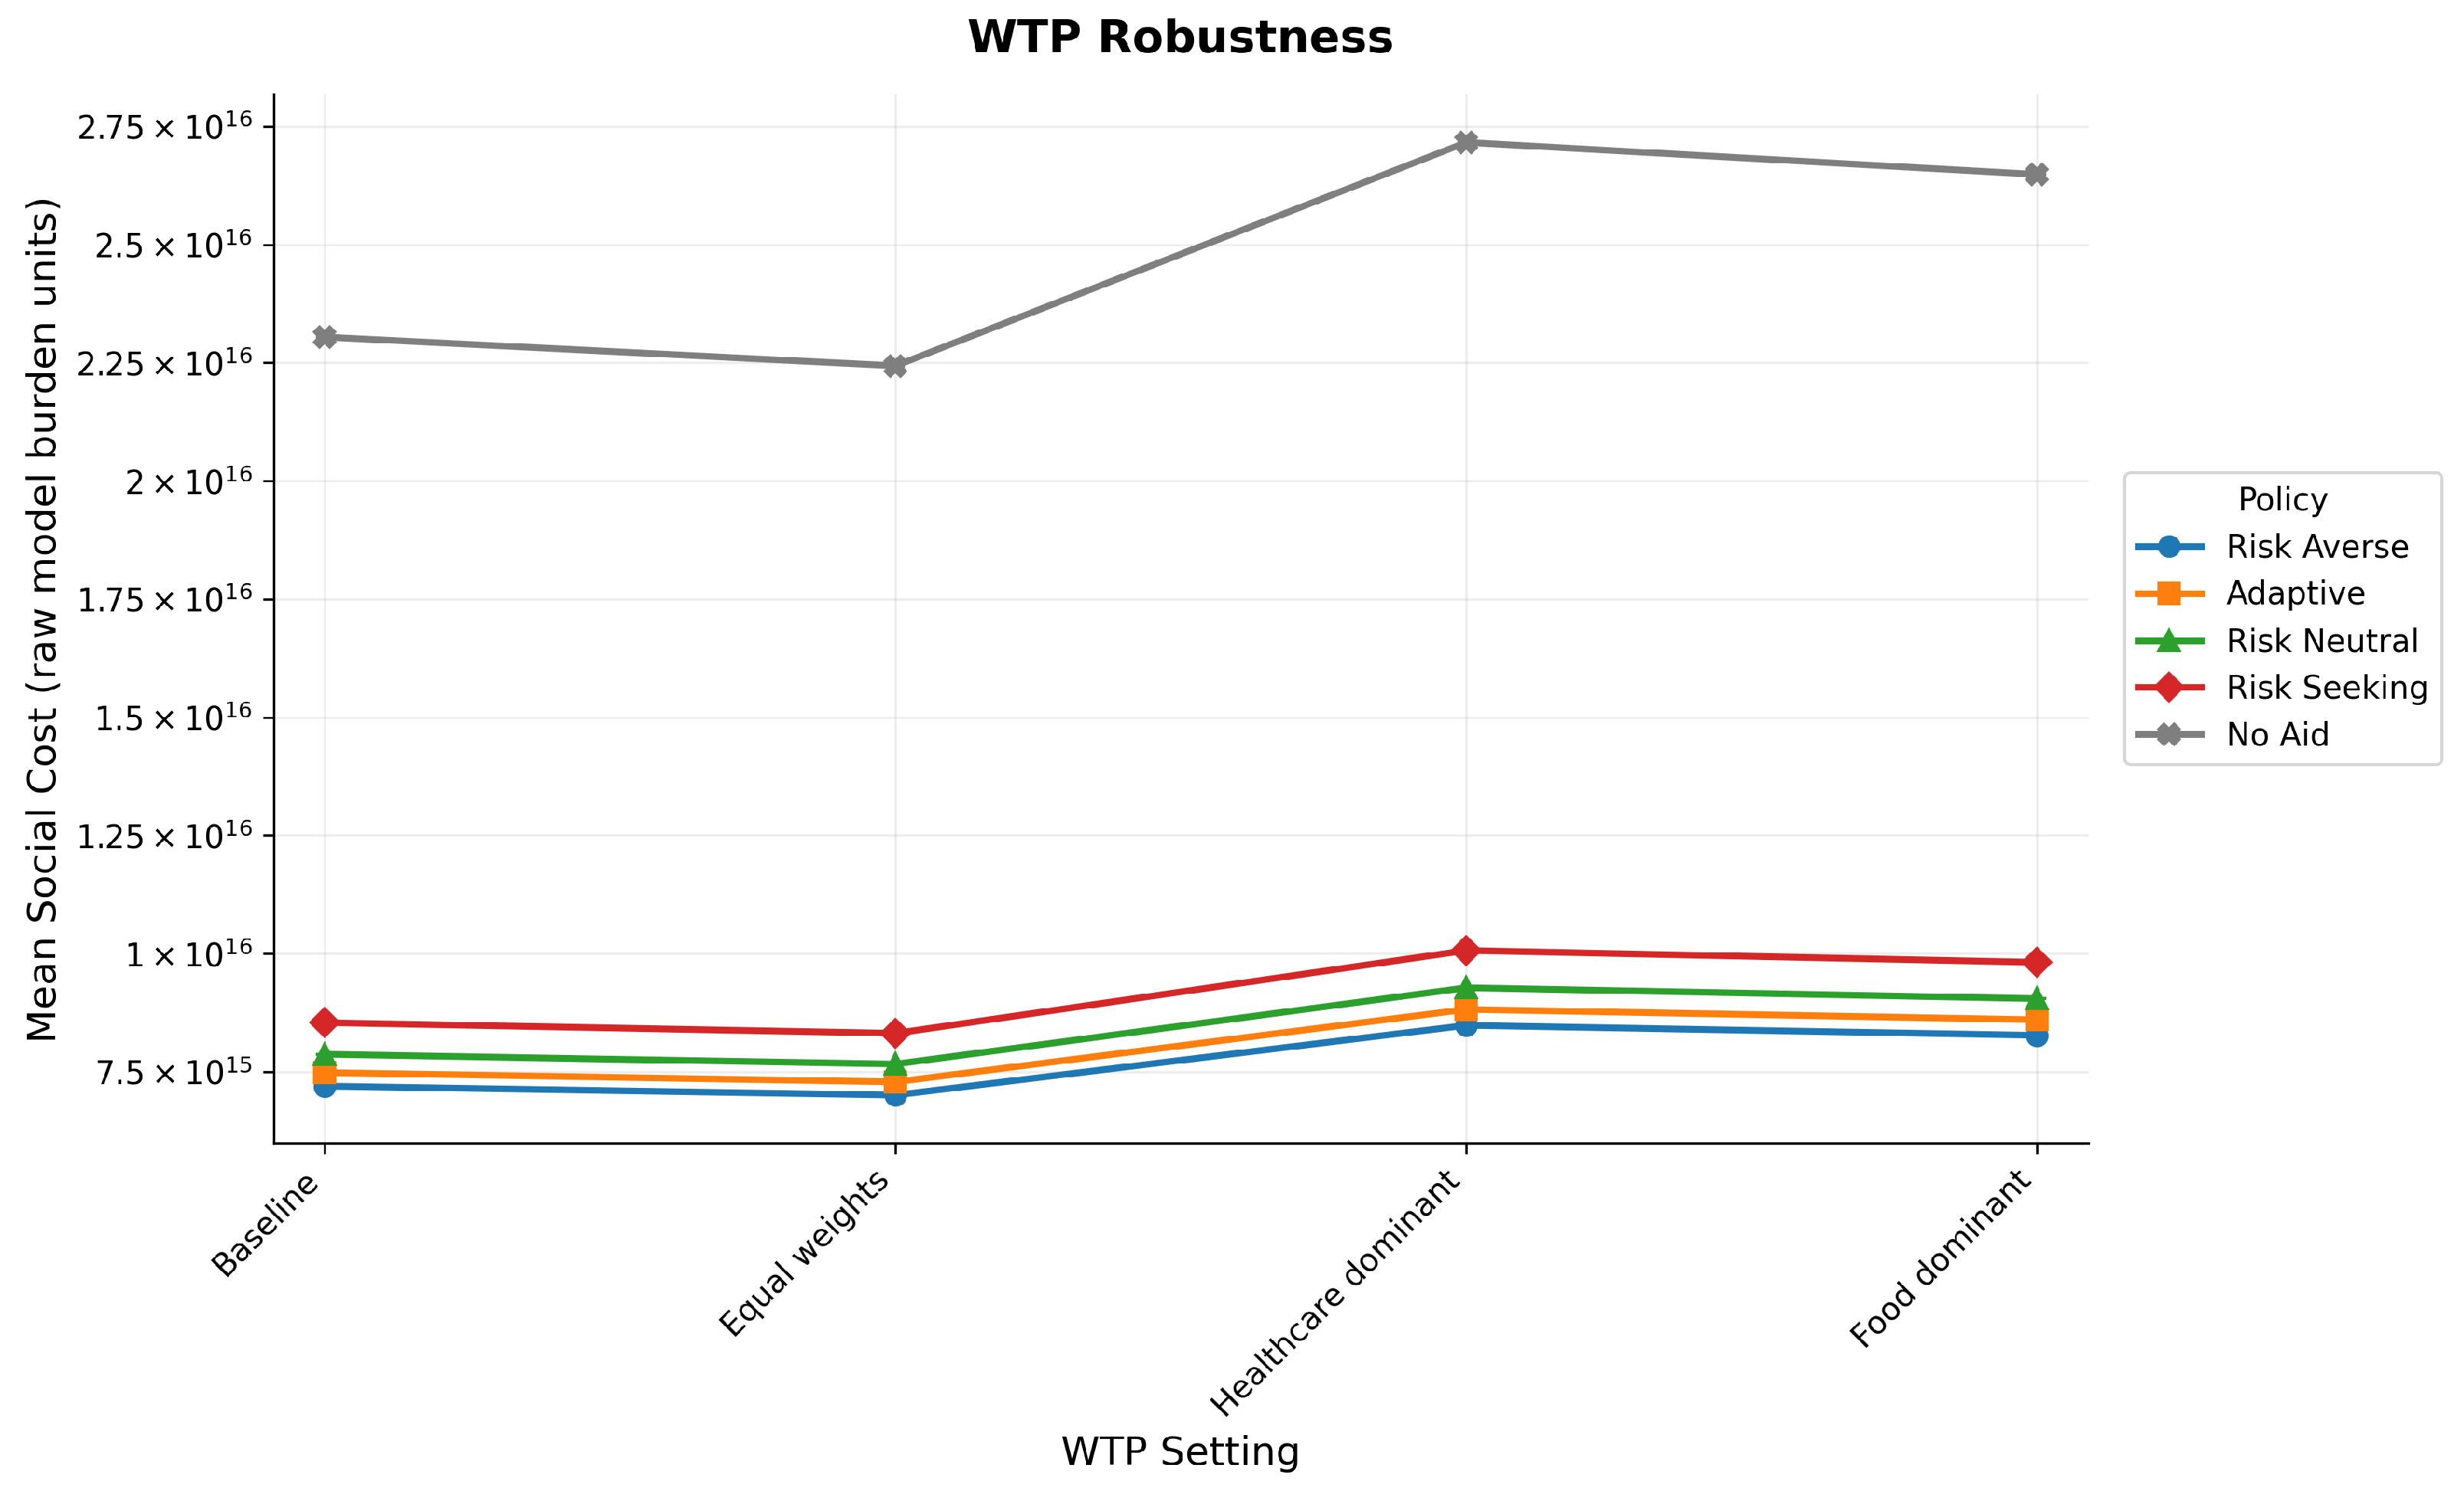
79]. Interruptions in medical access also bear directly on morbidity and mortality. Retail and food services carry substantial weights for their contribution to economic continuity and daily community operations, with disruption effects that are generally less immediate than healthcare outages. These values are relative weighting coefficients rather than direct monetary willingness-to-pay estimates; only their ratios affect the social-cost computation, so the absolute magnitudes set an arbitrary common scale. Sensitivity analysis on the weights shows that the absolute social cost magnitude shifts with the chosen values while the relative ranking of policy scenarios holds, which supports the comparative conclusions.
These choices define a baseline scenario against which alternative assumptions are evaluated. The robustness analyses show that absolute outcome magnitudes change under alternative parameter settings while the relative ranking of policy regimes holds, indicating that the primary conclusions do not hinge on any single parameter choice.
4.3. Simulation Procedure
The simulation is conducted over a sequence of discrete decision intervals spanning the study period, with each interval representing a bimonthly update of system conditions. For each scenario, the model is initialized using county-level demographic, economic, and connectivity data, and the system state is reset at the beginning of each simulation run to ensure consistency across replications.
At each decision interval, the system evolves through a structured sequence of updates. First, community populations are adjusted to reported deaths. The hazard signal is then updated using the exogenous input data, followed by recalculation of derived quantities, including the Vulnerability Index and connectivity adjustments. Migration flows are subsequently determined based on relative system conditions, allowing population redistribution across communities. The centralized decision-making agent then allocates resources according to the policy regime defined for the scenario, after which economic indicators and social cost are computed for each community. This sequence captures the dynamic interaction between system state, behavioral responses, and policy intervention.
To account for stochastic variability in migration behavior and resource allocation, each scenario is evaluated using a Monte Carlo simulation approach. Specifically, a minimum of
independent replications are conducted per scenario. For each replication, key outcome variables—including social cost, migration, assistance levels, and economic sufficiency—are recorded at each decision interval. The stochastic elements of the model are the policy-effectiveness draw
that sets the success count
, the analogous independent draw governing business assistance, and the risk-attitude migration multiplier
that scales the baseline migration tendency in Equation (
11); all are drawn from uniform distributions over their policy-specific ranges. Each of the
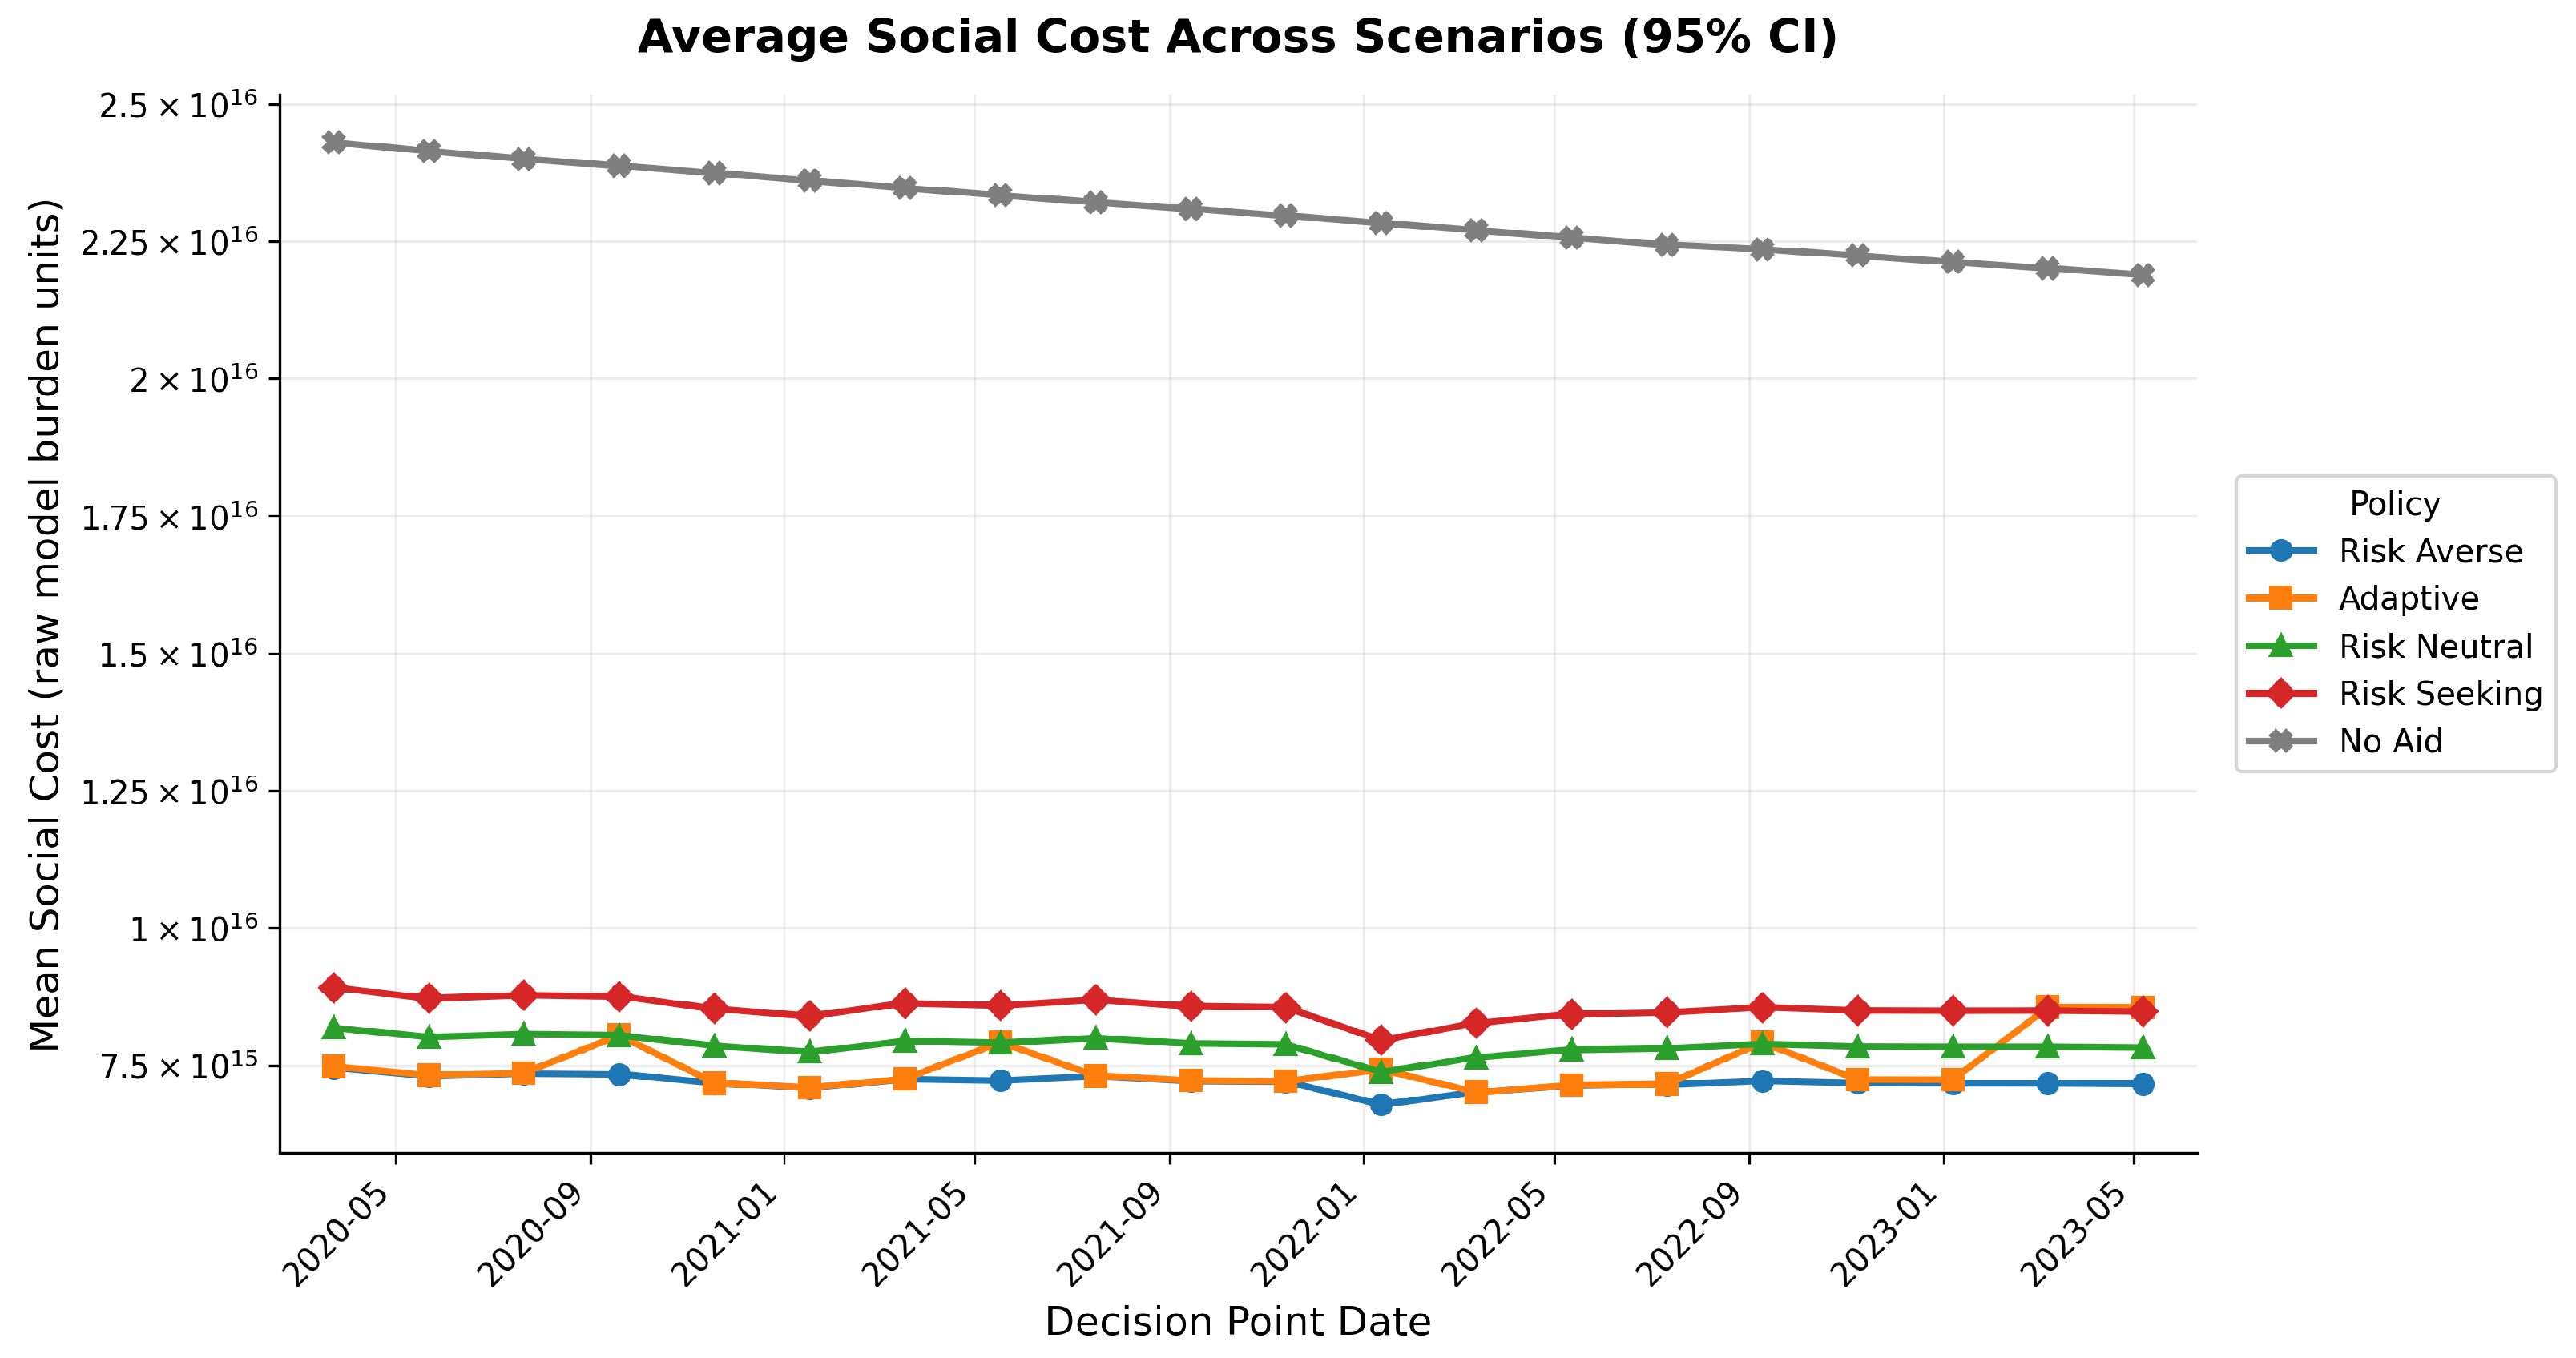
replications per scenario uses an independent random stream, and deterministic inputs (case and death series, facility counts, economic attributes) are held fixed across replications. Interval-level confidence intervals are computed across replications at each decision interval, while scenario-level intervals first collapse each replication across the simulation horizon and then compute the interval across replications, so time points are not treated as independent samples. Aggregated results are summarized using statistical measures such as mean values, confidence intervals, and interquartile ranges (see
Section 5) The simulation procedure follows the sequential update logic described in Algorithm 1.
6. Discussion
The findings of this study indicate that intervention structure plays a central role in shaping regional resilience outcomes during prolonged disruptions. Across all experimental settings, proactive and risk-averse allocation strategies consistently produced lower social cost than reactive or no-intervention approaches. More importantly, this relative ordering remained stable under substantial variation in aid availability, intervention timing, weighting assumptions, migration parameters, and network connectivity structures. Such consistency suggests that the observed policy behavior was not driven by isolated parameter choices, but instead reflected persistent characteristics of the modeled response dynamics.
One noteworthy finding is that the adaptive policy did not consistently outperform the simpler risk-averse allocation strategy. Although the adaptive regime continuously adjusts its prioritization decisions in response to evolving hazard and vulnerability conditions, the results suggest that rapid and consistent intervention may be more important than dynamic reassessment in this particular context. Because the adaptive policy periodically reallocates attention away from previously prioritized communities as conditions change, assistance may become distributed more broadly across the system before the most vulnerable locations fully stabilize. The static risk-averse strategy instead applies the highest effectiveness posture uniformly to all aided communities for the full horizon, which sustains a higher assistance level system-wide and yields lower overall social cost across most experimental conditions. This finding suggests that under prolonged disruption, consistency of intervention may provide greater resilience benefits than increased policy complexity.
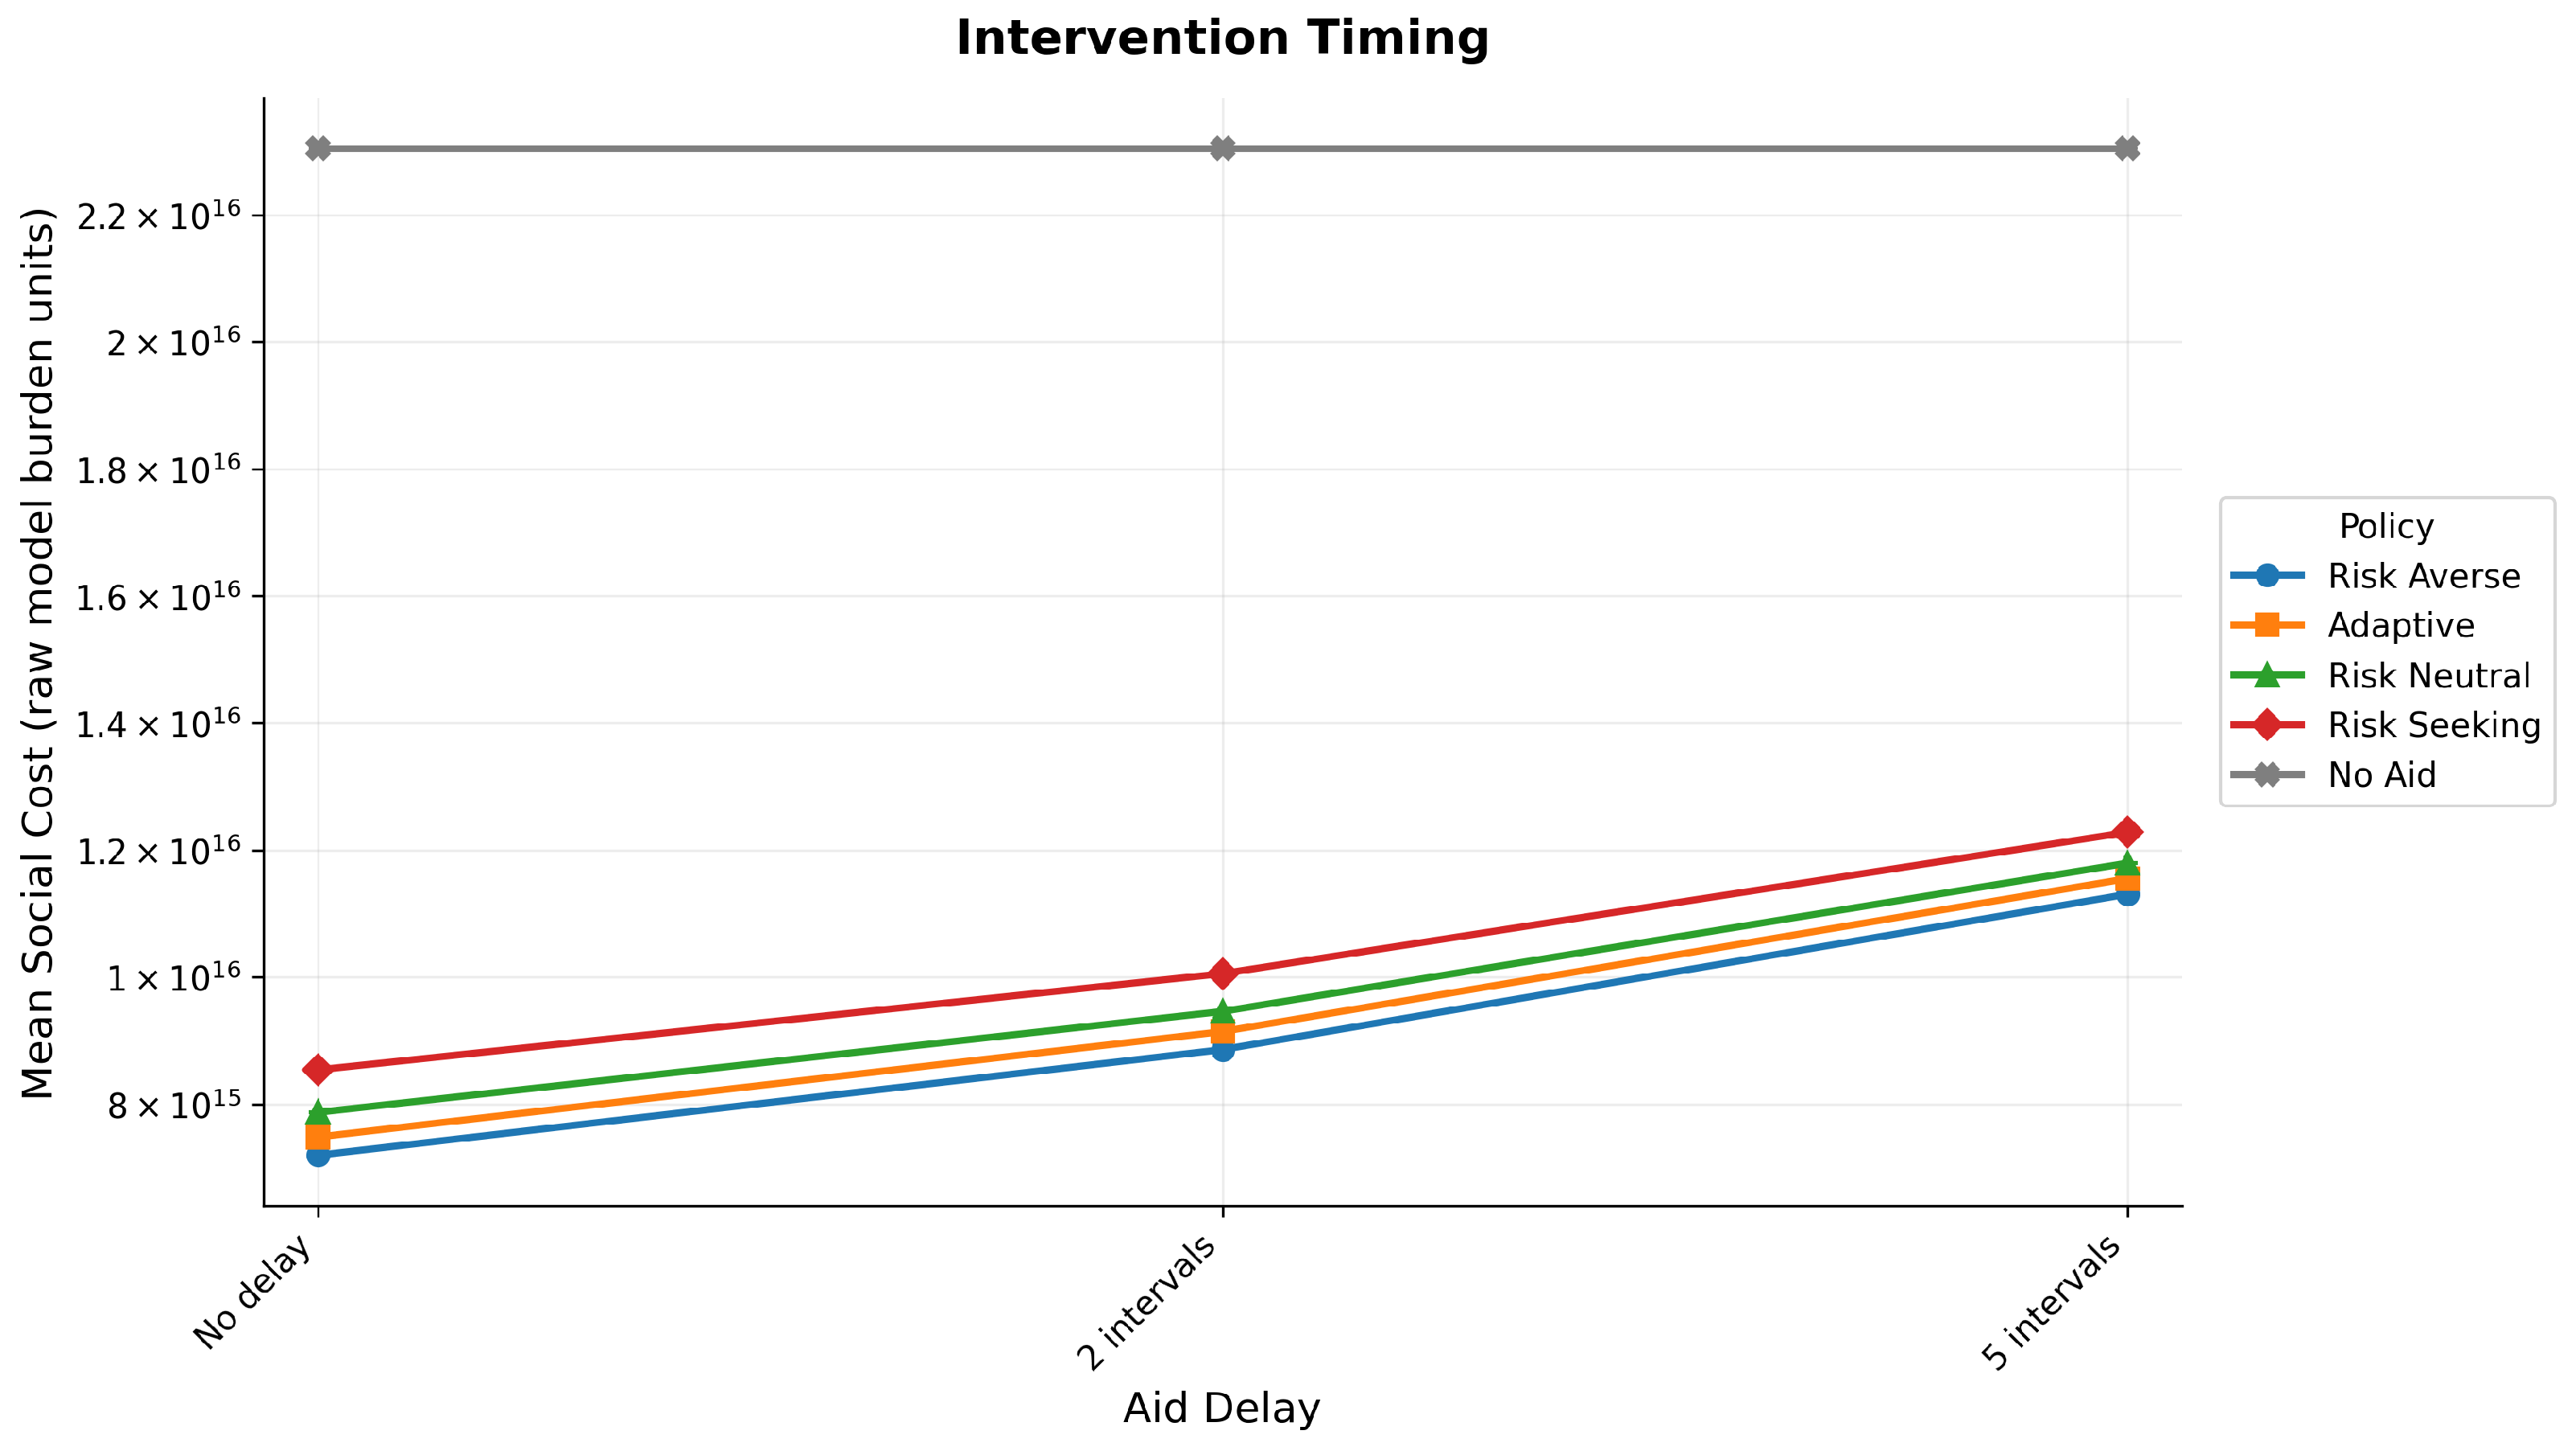
One of the most important observations emerging from the analysis concerns the role of intervention timing. Delays in aid deployment consistently amplified system-wide social burden, particularly in highly connected environments where migration and inter-community influence accelerated the propagation of stress conditions. In practical terms, the results imply that emergency response effectiveness depends not only on the quantity of available resources, but also on how rapidly those resources can be mobilized and distributed. Even relatively moderate delays allowed vulnerability conditions to accumulate across connected communities before mitigation measures became active. This behavior highlights the operational importance of pre-positioned resources, adaptive logistics planning, and rapid coordination mechanisms during the early stages of disruption.
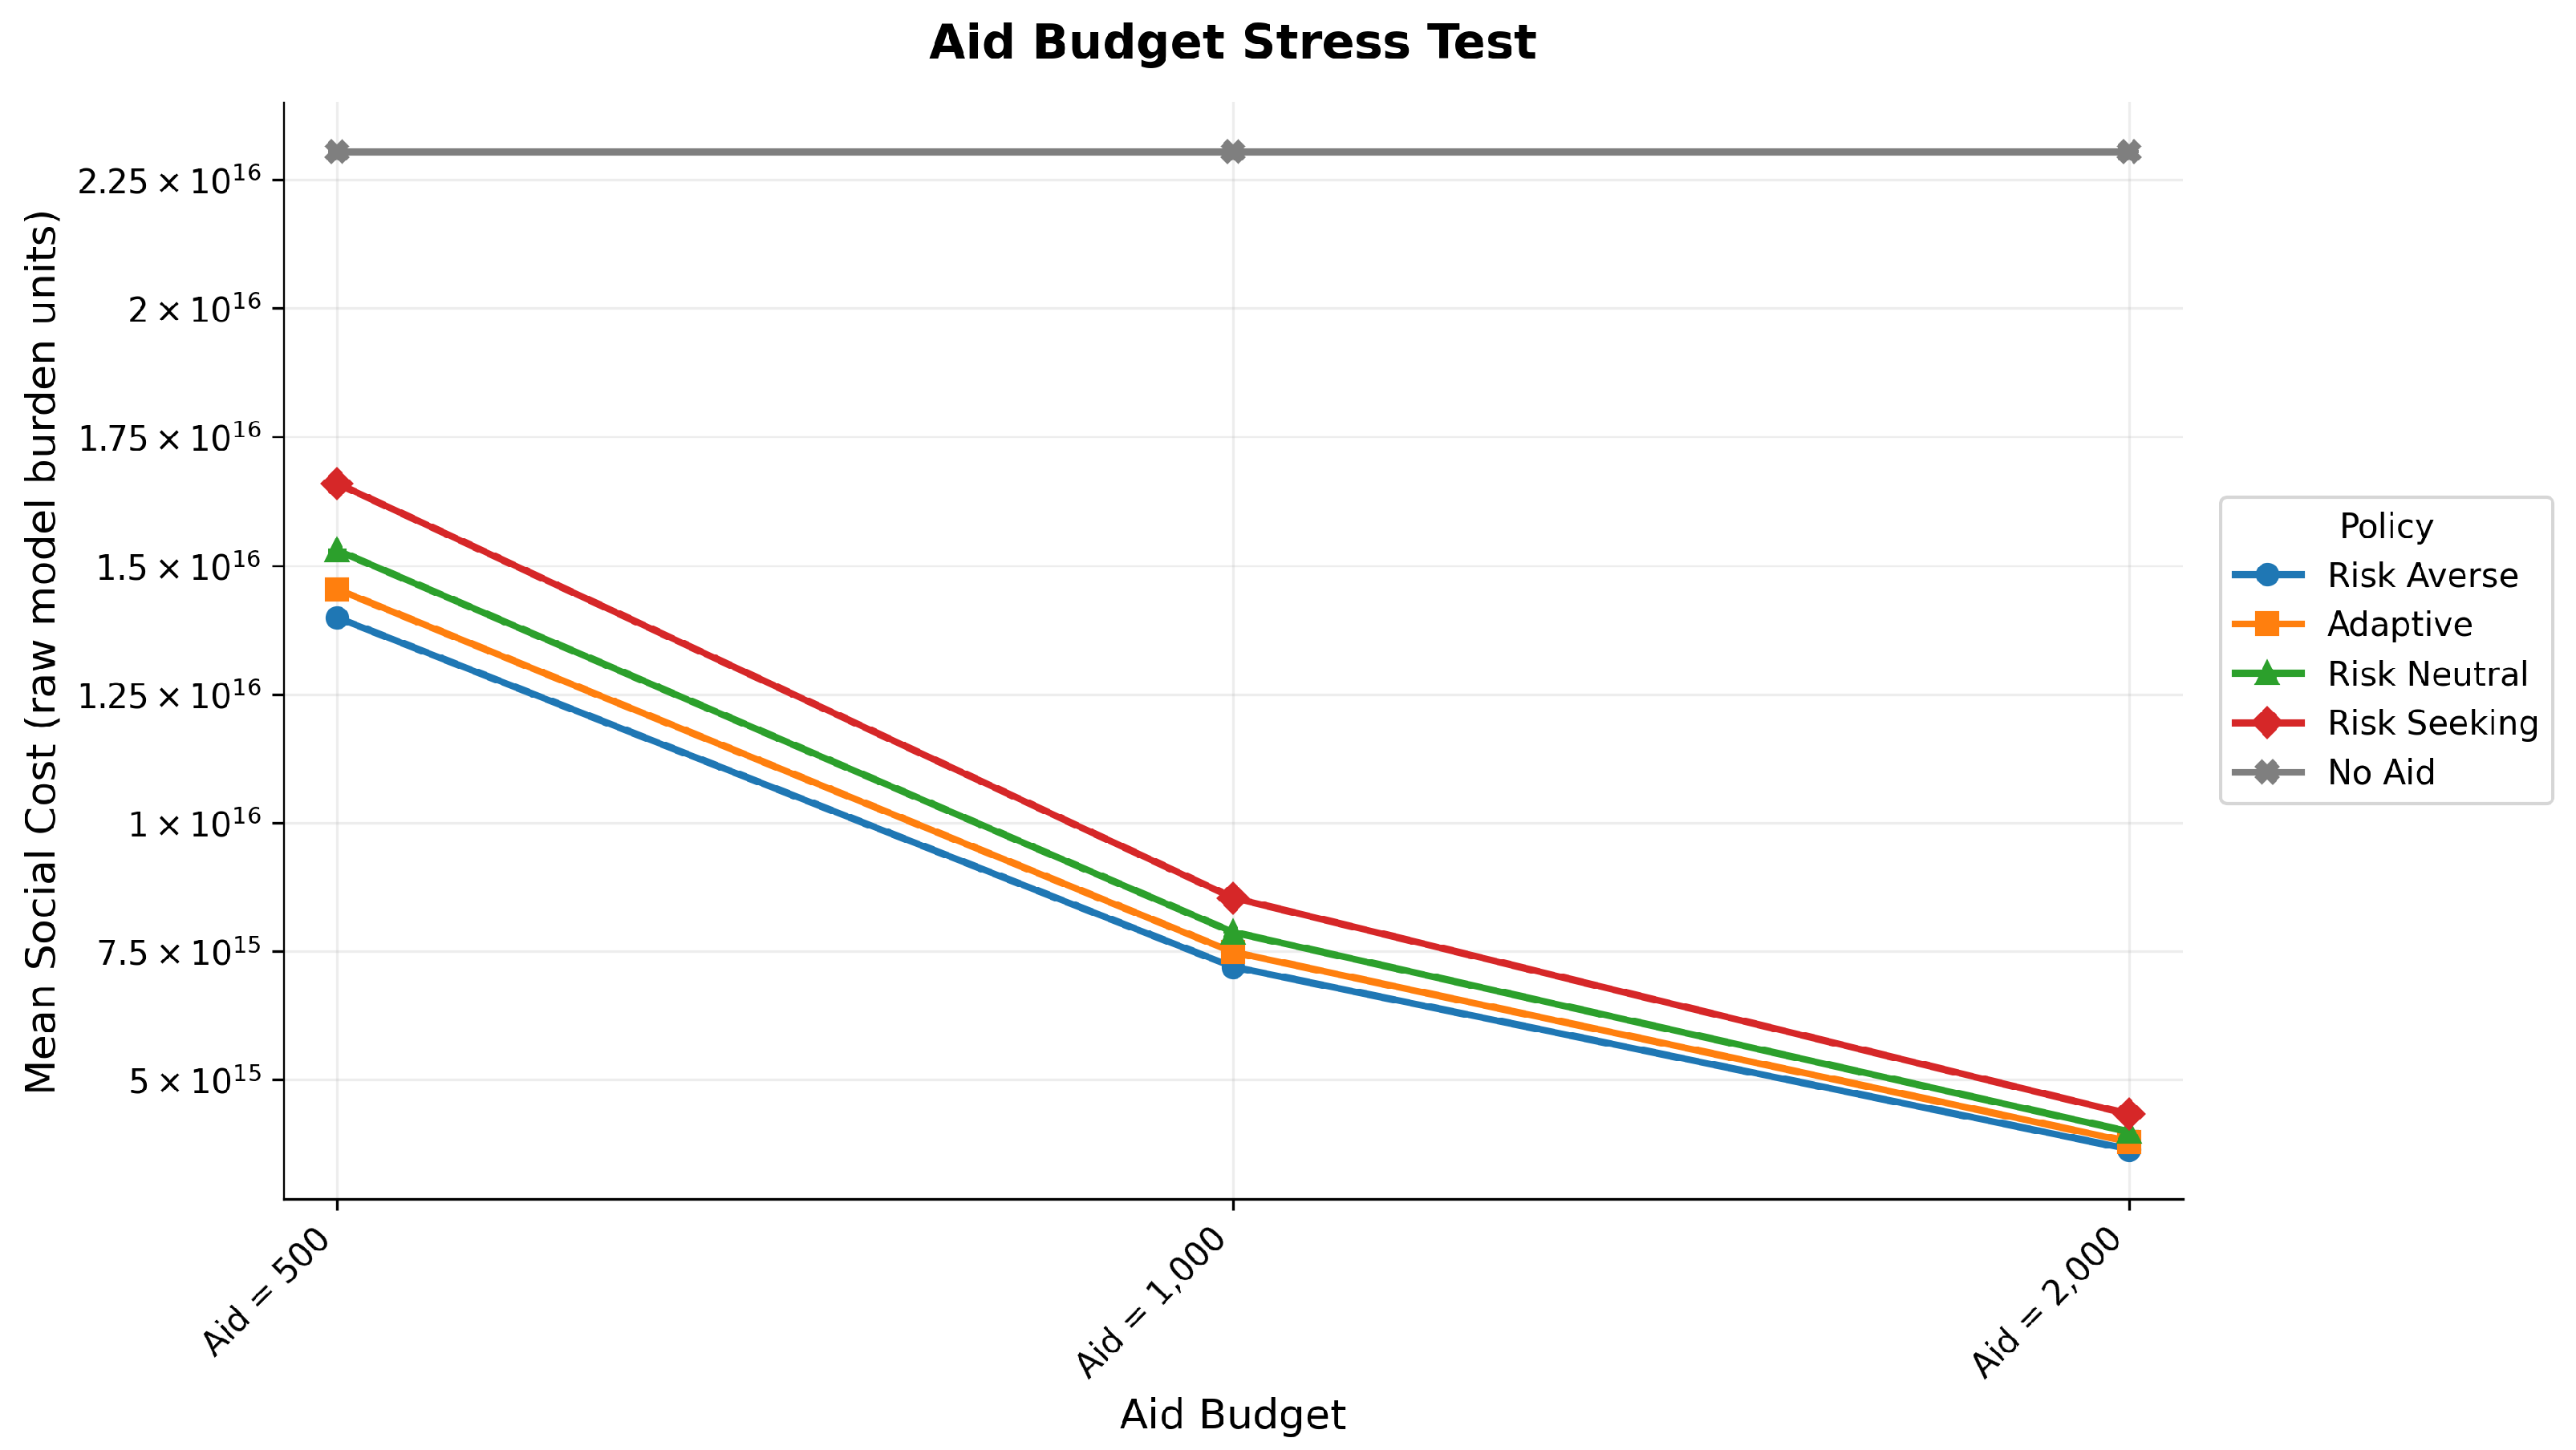
The aid experiments revealed a similarly important pattern. Although increasing aid availability reduced social cost across all intervention-based policies, the rate of improvement declined at higher resource levels. The largest reductions in social burden occurred during the transition from severely constrained aid conditions to moderate resource availability, whereas additional increases beyond that point produced comparatively smaller improvements. This diminishing-return behavior suggests that resilience gains are strongly associated with the ability to stabilize critical needs early in the disruption cycle. For policymakers operating under fiscal or logistical constraints, the findings indicate that improving allocation efficiency and prioritization strategy may generate greater system-level benefit than simply increasing total resource expenditure.
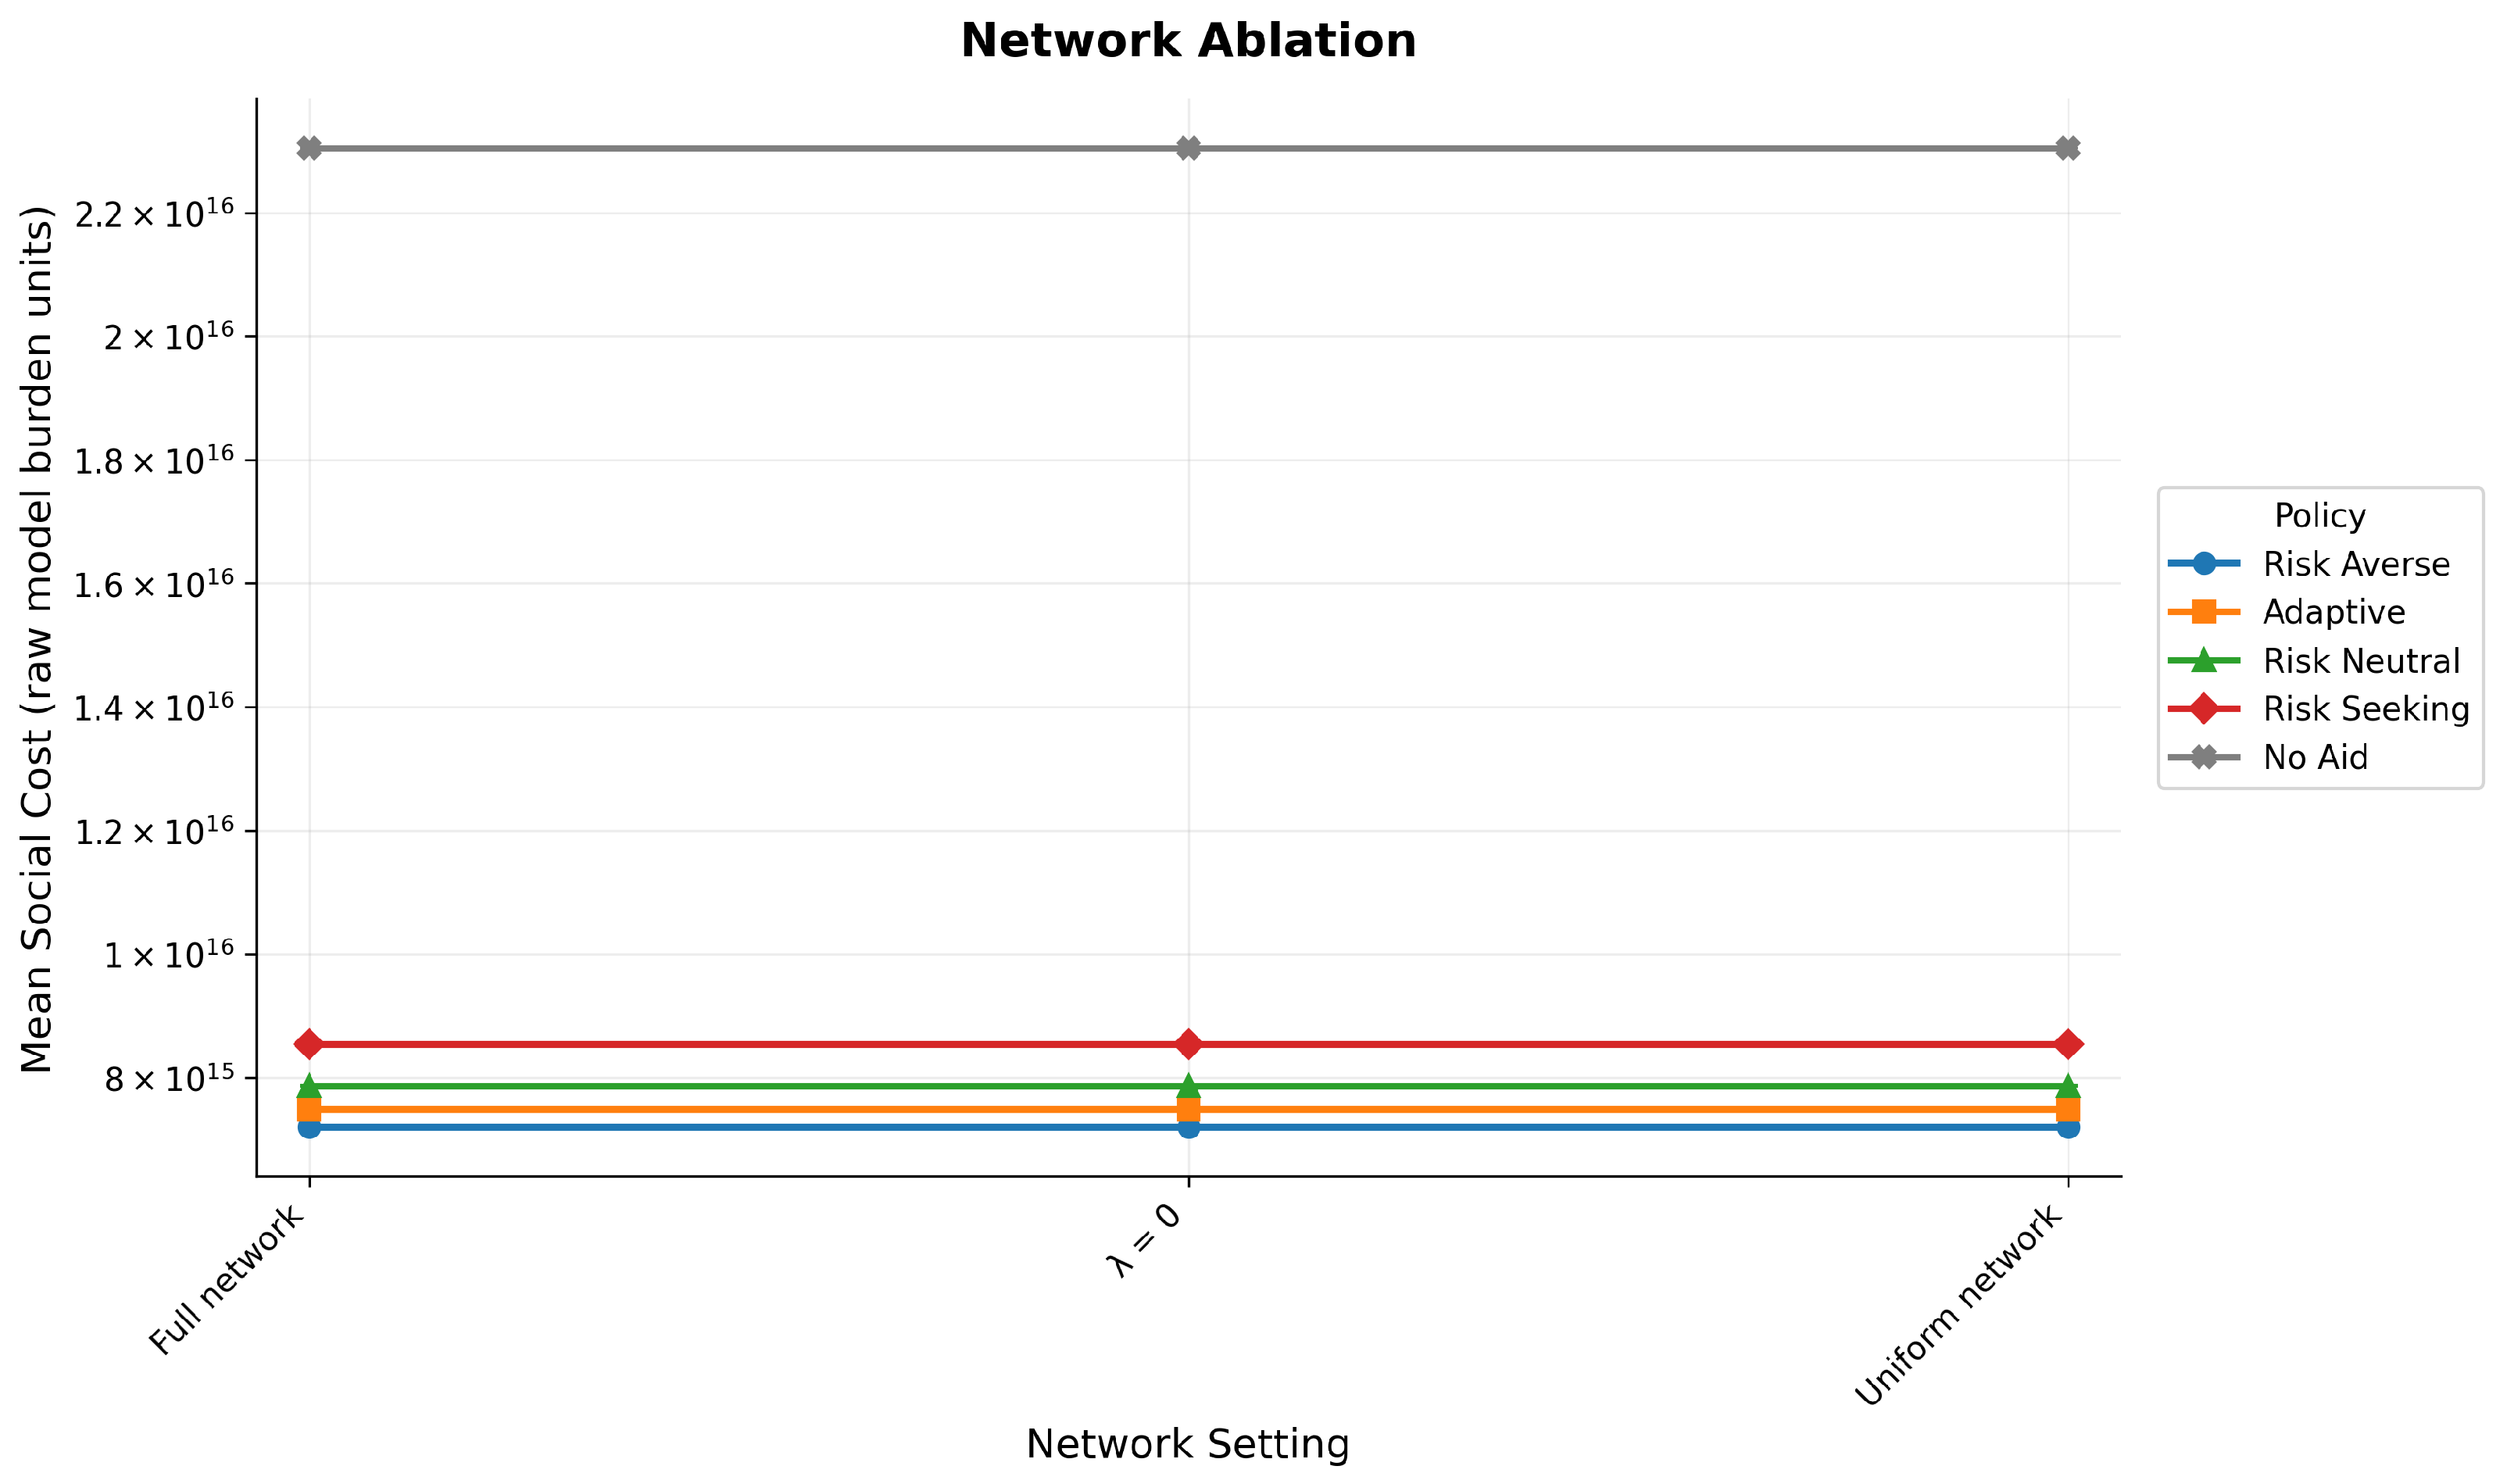
The study also demonstrated the importance of representing interconnected regional dynamics within crisis-response models. Traditional aid-allocation frameworks frequently evaluate communities independently, implicitly assuming that disruptions remain spatially localized. The proposed framework instead modeled migration-driven redistribution effects and inter-community influence through the SCI-based connectivity structure. The network ablation experiments showed that the relative policy ordering remained stable across alternative connectivity assumptions, so the connectivity mechanisms shape where and how disruption propagates across communities without altering the comparative ranking of allocation strategies. Such effects are particularly relevant in real-world disruptions where population displacement, infrastructure outages, and resource shortages propagate across neighboring regions rather than remaining confined to a single locality.
The network ablation experiments yield a further insight. The SCI-based connectivity structure shapes migration pathways, vulnerability propagation, and the spatial distribution of disruption, yet the ranking of policy performance held when alternative connectivity assumptions were introduced. Social connectivity therefore operates as a moderating mechanism within the framework and not as the dominant driver of resilience outcomes: it governs how disruption spreads and which communities absorb secondary effects, while the effectiveness of a given intervention strategy depends more strongly on allocation posture, intervention timing, and resource availability. The network component contributes explanatory detail about where and when burden accumulates, and the stability of the rankings across specifications indicates that the advantage of proactive intervention reflects a system-level characteristic of the model rather than a feature of the SCI formulation.
From a managerial perspective, the framework provides several practical insights for emergency managers and resilience planners. First, the consistent performance of the risk-averse strategy suggests that applying a strong intervention posture early and uniformly may substantially reduce aggregate regional burden during prolonged disruptions; under the adaptive regime, which alone targets by hazard and vulnerability, the same level of targeting did not improve on this uniform posture. Second, the strong sensitivity to intervention timing indicates that investments in rapid deployment capability, emergency coordination infrastructure, and decentralized resource staging may produce significant resilience benefits even when total aid availability is limited. Third, the relatively lower sensitivity to migration and connectivity scaling parameters suggests that intervention structure and operational prioritization exert stronger influence on overall system performance than secondary behavioral assumptions within the explored parameter space.
Beyond emergency response operations, the framework may also support broader resilience-oriented planning applications. Because the modeling environment captures cascading stress propagation and migration-driven redistribution dynamics, it may, with further validation, be adaptable to disaster-relief coordination, emergency shelter allocation, healthcare resource distribution, evacuation planning, infrastructure restoration prioritization, and regional recovery strategies. The framework is intended for disruptions characterized by prolonged cascading effects, including hurricanes, wildfires, prolonged utility outages, climate-related displacement events, and large-scale supply-chain disruptions. In such settings, localized intervention decisions frequently generate secondary consequences across interconnected regions, making system-wide evaluation increasingly important for policy development.
These results should be read in light of the framework’s intended scope. The model is a controlled simulation environment for comparing the relative performance of allocation strategies under common disruption conditions, and its outputs are meaningful as comparisons across policy regimes rather than as forecasts of realized social cost, migration, or assistance for any specific event. Within that scope, the study demonstrated that integrating interconnected social dynamics with intervention-oriented policy modeling can provide meaningful insight into regional resilience behavior under sustained external stress.
7. Conclusions, Limitations, and Future Research Directions
This study presented a simulation-based framework for evaluating crisis-response and aid-allocation strategies under conditions characterized by interconnected social stress, migration-driven redistribution, and cascading regional disruption. The framework is intended as a controlled environment for comparing allocation strategies under common disruption conditions rather than as a predictive or operational planning tool. Within this scope, the model isolates the effect of decision logic by holding external disruption inputs constant across scenarios, so its outputs are meaningful as comparisons across policy regimes rather than as forecasts of realized social cost, migration, or assistance for any specific region or event. The reported social-cost, migration, and assistance values therefore support conclusions about the relative ordering of allocation strategies and the conditions under which each performs best, and they are not intended as absolute estimates for a particular hazard. By integrating aid allocation dynamics, inter-community connectivity, migration behavior, and infrastructure-sensitive social cost modeling within a unified simulation environment, the study provided a mechanism for analyzing how intervention structure and timing influence regional resilience outcomes during prolonged disruptions.
From a theoretical perspective, the study contributed to the growing body of resilience and crisis-response literature by explicitly incorporating interconnected community dynamics into the evaluation of intervention policies. Where conventional allocation models frequently assess communities independently, the proposed framework captured how localized disruptions propagated through migration and influence mechanisms across connected regions. The results demonstrated that policy effectiveness cannot be evaluated solely through localized outcomes because intervention decisions generated secondary redistribution effects throughout the broader system. The study therefore extended existing resilience-oriented modeling approaches by emphasizing the importance of cascading regional interactions in shaping system-wide social burden under sustained stress conditions.
The study also contributed to the practical understanding of crisis-response policy design and emergency management planning. Across all robustness and sensitivity experiments, proactive and risk-averse intervention strategies consistently produced lower social cost than reactive or no-aid approaches. The findings further demonstrated that intervention timing exerted substantial influence on system performance, particularly within highly connected environments where vulnerability conditions propagated rapidly across communities. The aid experiments also revealed diminishing marginal improvements at higher resource levels, suggesting that effective prioritization and early deployment may provide greater resilience benefit than simply increasing total aid availability. These findings provide actionable insights for emergency managers, resilience planners, and policymakers seeking to design resource-allocation strategies under constrained operational conditions.
The framework is designed for potential transferability across a range of disruption contexts in which cascading regional interactions influence recovery behavior. Potential applications include disaster-relief coordination, emergency shelter allocation, healthcare resource distribution, evacuation planning, infrastructure restoration prioritization, and regional resilience assessment under hurricanes, wildfires, prolonged utility outages, supply-chain disruptions, and climate-related displacement events. Because the framework captures interconnected migration and stress-propagation dynamics, it is intended to support evaluation of policy behavior in large-scale disruptions where localized decisions generate broader regional consequences, pending validation in those settings.
Several limitations nevertheless define the scope of the present study and motivate future research. The migration and social influence mechanisms adopted in the framework were intentionally stylized and were not calibrated using region-specific empirical behavioral datasets. Similarly, the WTP weighting structure represented relative infrastructure importance rather than empirically validated economic valuation. The Social Connectedness Index is derived from Facebook friendship ties and under-represents older, lower-income, and less digitally connected populations; because these groups are often among the most vulnerable, the connectivity-weighted component of the Vulnerability Index may understate their networked exposure, which qualifies the interpretation of the network-mediated term and its use in prioritization. The connectivity update in Equation (
3) adjusts SCI weights with population change but holds the network topology fixed across the simulation horizon, so the set of inter-county ties does not itself evolve, and the weight update is a modeling approximation rather than an empirically estimated change in social connectedness. Real-world disruptions also alter transportation accessibility, communication infrastructure, and mobility behavior in ways the present formulation does not capture. The framework also does not impose a shared regional budget constraint of the form
: each aided county receives the baseline capacity
a independently, so the regimes differ in how effectively capacity is converted into assistance rather than in how a scarce common pool is divided among competing counties. The comparison is therefore one of allocation posture and effectiveness rather than constrained allocation under a fixed budget, and incorporating an explicit budget constraint with county-level decision variables is an important extension. In addition, the analysis focused on comparative policy behavior under synthetic stress scenarios rather than operational forecasting for a specific geographic region or disaster event. The present study demonstrates the framework using a single empirical setting, county-level COVID-19 data for Illinois, and transferability to other hazard types such as hurricanes, wildfires, infrastructure outages, and supply-chain disruptions remains a design goal to be validated with case studies specific to those contexts.
Future research may extend the framework in several directions. Incorporating empirically calibrated mobility and demographic datasets would improve the realism of migration and redistribution dynamics. Network topology adaptation, in which inter-county ties form or dissolve as infrastructure accessibility changes during a disruption, could extend the fixed-edge structure used here. Additional extensions may include stochastic hazard evolution, multi-agent coordination behavior, adaptive intervention strategies, and integration with real-time infrastructure and mobility data streams. Further work may also examine competing policy objectives, equity-oriented allocation mechanisms, and cross-regional coordination strategies under uncertain resource availability.