

Clustering Matrix Variate Longitudinal Count Data

Abstract
:1. Introduction
2. Methods
2.1. Longitudinal Data and Family of Models
2.2. Parameter Estimation
- Conditional on the variational parameters , , and and on , , , and , the is given byAs the marginal distribution of is difficult to compute, we use an approximation of using the ELBO such that
- Given , variational parameters , , and are updated conditional on , , , and .
- (a)
- A fixed-point method is used for updating :where the vector function is a vector of the exponential of each element of the r-dimensional vector , puts the diagonal elements of the matrix into a t-dimensional vector, and ⊙ is the Hadamard product.
- (b)
- A fixed-point method is used for updating :where the vector function is a vector of the exponential of each element of the t-dimensional vector , puts the diagonal elements of the matrix into an r-dimensional vector, and ⊙ is the Hadamard product.
- (c)
- Newton’s method is used to update :where .
- Given and the variational parameters , , and , the updates of model parameters , , and are obtained asEstimates of the model parameters and can be obtained by maximizing the approximation of the log-likelihood with respect to the parameters and . If we define as:the estimates of and are analogous to [7]. The elements of can be estimated as:where , and the updates for can be obtained as
2.3. Model Selection and Performance Assessment
3. Results
3.1. Simulation Studies
3.1.1. Scenario 1
3.1.2. Scenario 2
3.1.3. Comparison with Other Approaches
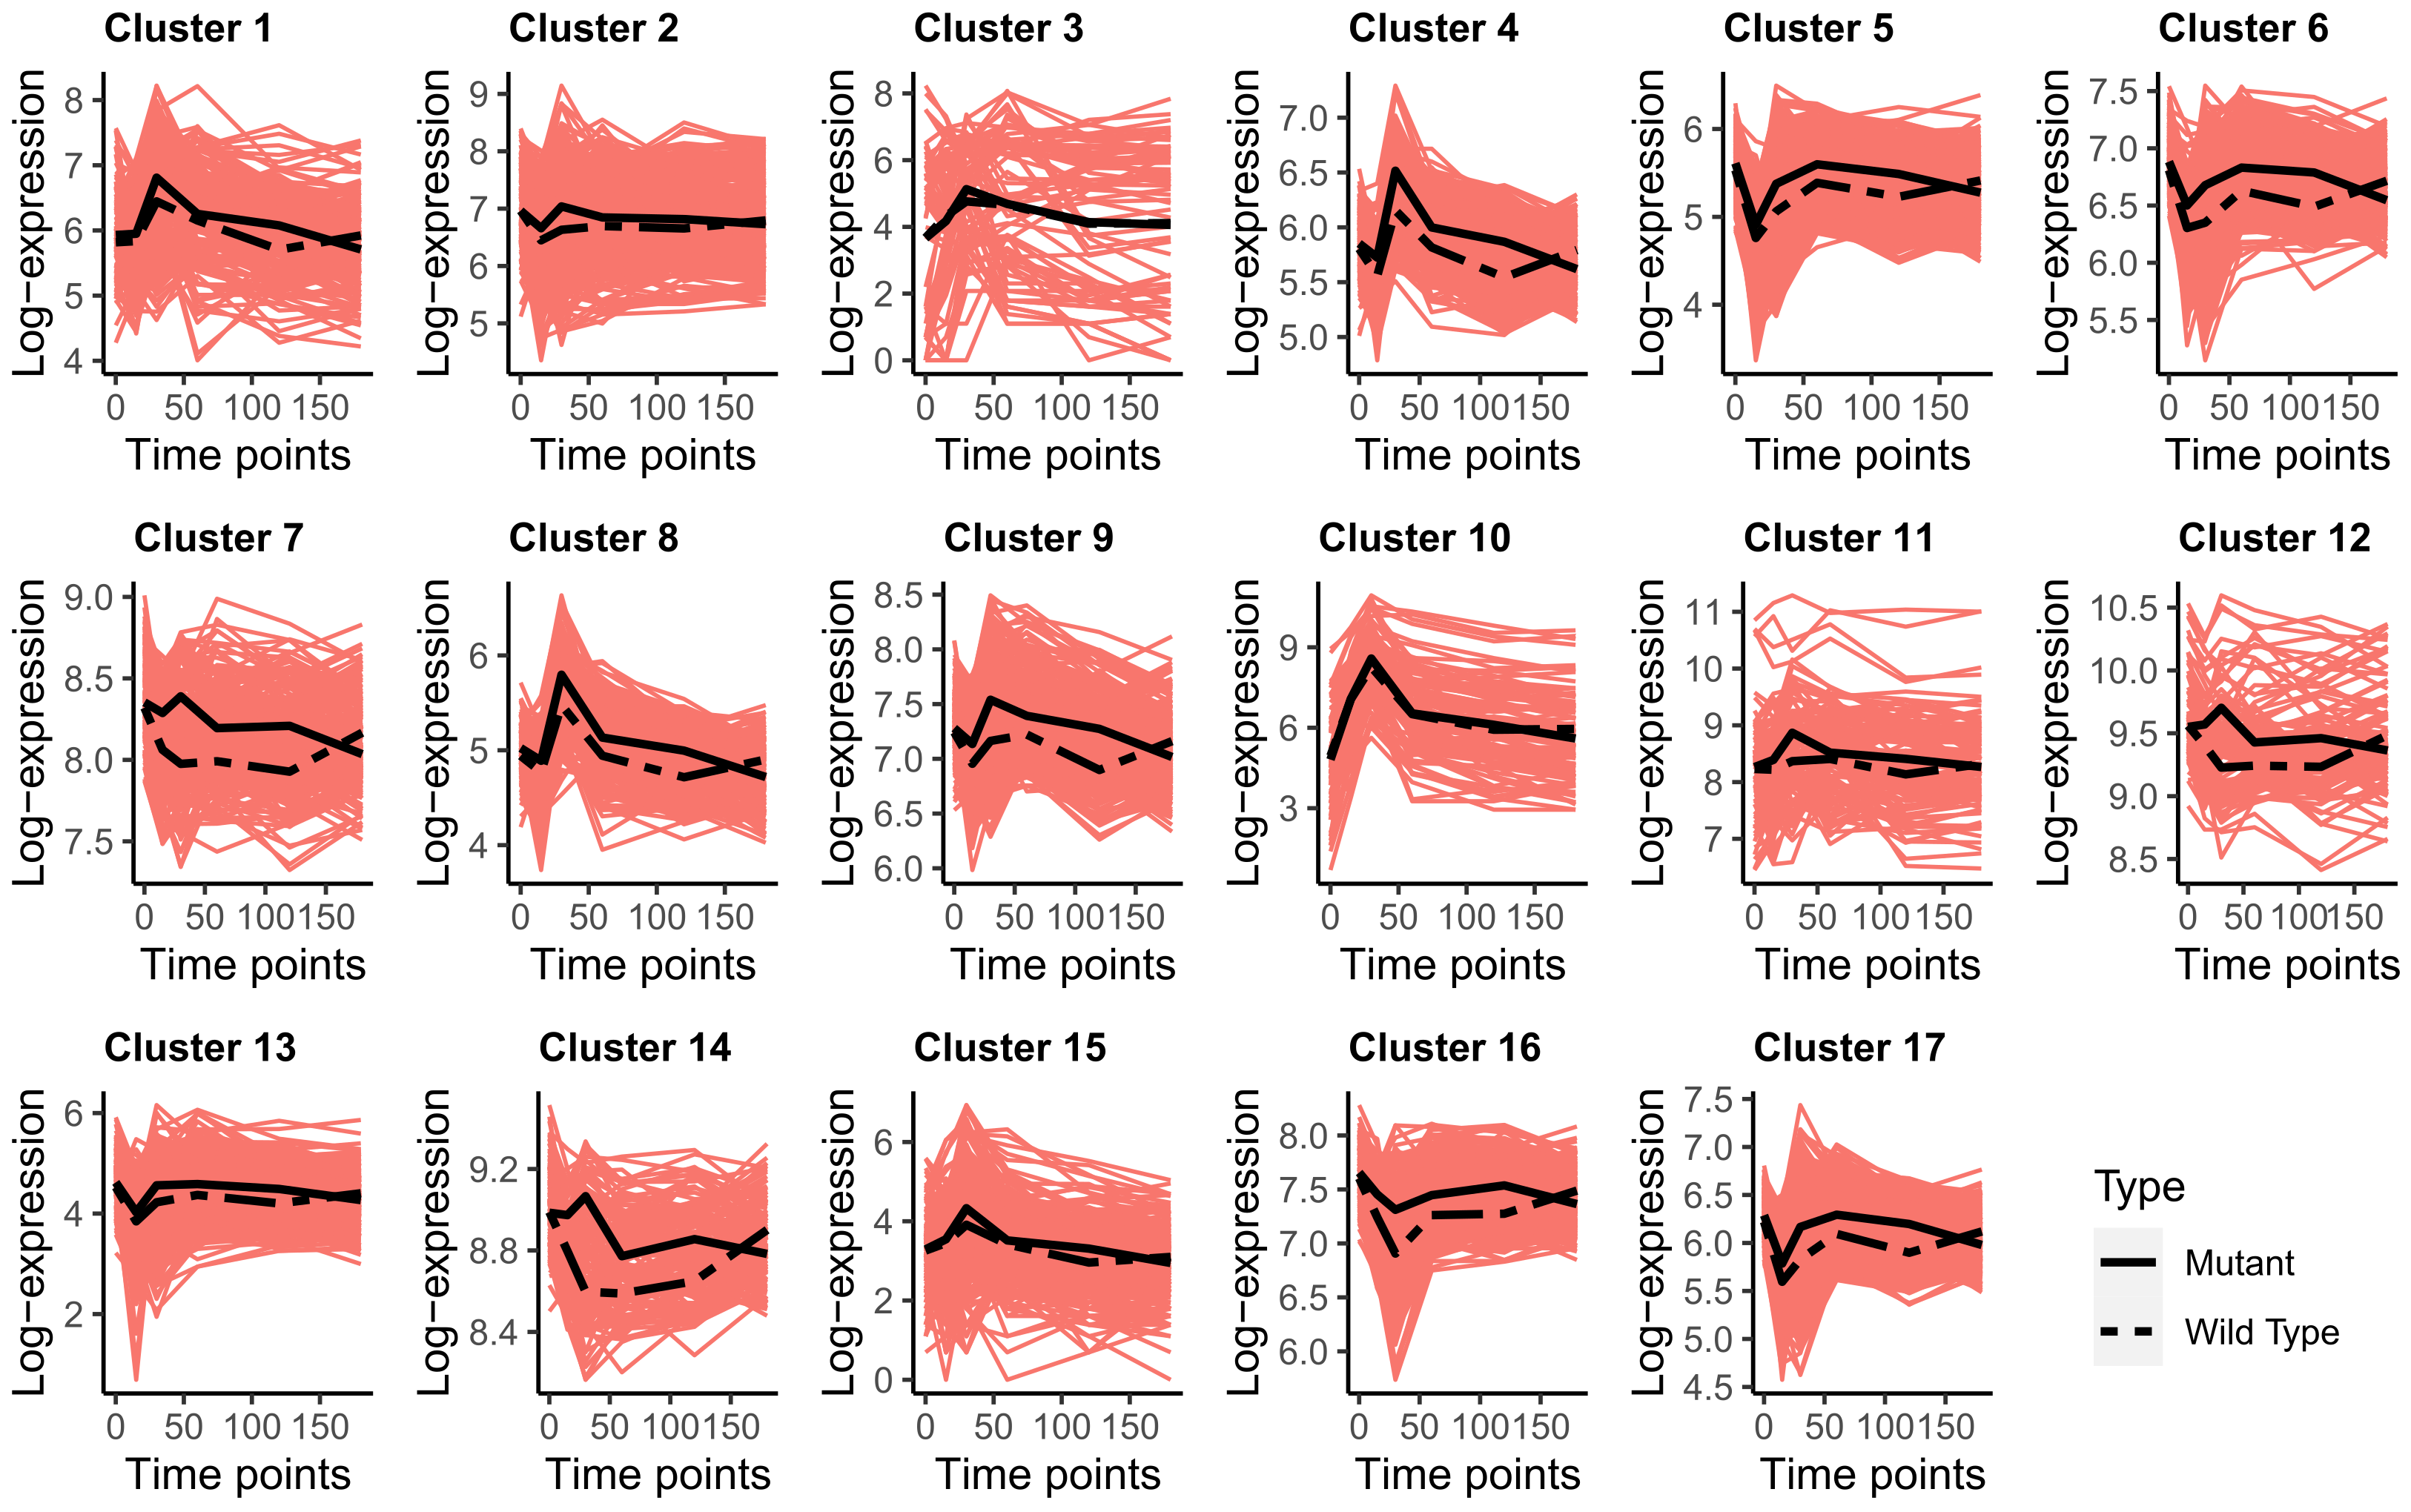
3.2. Transcriptomics Data Analysis
4. Conclusions
Author Contributions
Funding
Institutional Review Board Statement
Informed Consent Statement
Data Availability Statement
Acknowledgments
Conflicts of Interest
Abbreviations
| ARI | adjusted Rand index |
| BIC | Bayesian information criterion |
| ELBO | evidence lower bound |
| EM | expectation-maximization |
| KL | Kullback-Leibler |
| MCMC-EM | Markov chain Monte Carlo expectation-maximization |
| MPLN | multivariate Poisson lognormal |
| MVPLN | matrix variate Poisson lognormal |
References
- Spellman, P.T.; Sherlock, G.; Zhang, M.Q.; Iyer, V.R.; Anders, K.; Eisen, M.B.; Brown, P.O.; Botstein, D.; Futcher, B. Comprehensive identification of cell cycle–regulated genes of the yeast Saccharomyces cerevisiae by microarray hybridization. Mol. Biol. Cell 1998, 9, 3273–3297. [Google Scholar] [CrossRef]
- Lee, C.W.; Stabile, E.; Kinnaird, T.; Shou, M.; Devaney, J.M.; Epstein, S.E.; Burnett, M.S. Temporal patterns of gene expression after acute hindlimb ischemia in mice: Insights into the genomic program for collateral vessel development. J. Am. Coll. Cardiol. 2004, 43, 474–482. [Google Scholar] [CrossRef]
- Louis, E.; Raue, U.; Yang, Y.; Jemiolo, B.; Trappe, S. Time course of proteolytic, cytokine, and myostatin gene expression after acute exercise in human skeletal muscle. J. Appl. Physiol. 2007, 103, 1744–1751. [Google Scholar] [CrossRef] [PubMed]
- Li, Y.; Li, M.; Tan, L.; Huang, S.; Zhao, L.; Tang, T.; Liu, J.; Zhao, Z. Analysis of time-course gene expression profiles of a periodontal ligament tissue model under compression. Arch. Oral Biol. 2013, 58, 511–522. [Google Scholar] [CrossRef] [PubMed]
- McLachlan, G.J.; Bean, R.W.; Peel, D. A mixture model-based approach to the clustering of microarray expression data. Bioinformatics 2002, 18, 413–422. [Google Scholar] [CrossRef]
- Inoue, L.Y.; Neira, M.; Nelson, C.; Gleave, M.; Etzioni, R. Cluster-based network model for time-course gene expression data. Biostatistics 2007, 8, 507–525. [Google Scholar] [CrossRef] [PubMed]
- McNicholas, P.D.; Murphy, T.B. Model-based clustering of longitudinal data. Can. J. Stat. 2010, 38, 153–168. [Google Scholar] [CrossRef]
- Si, Y.; Liu, P.; Li, P.; Brutnell, T.P. Model-based clustering for RNA-seq data. Bioinformatics 2014, 30, 197–205. [Google Scholar] [CrossRef]
- Rau, A.; Maugis-Rabusseau, C.; Martin-Magniette, M.L.; Celeux, G. Co-expression analysis of high-throughput transcriptome sequencing data with Poisson mixture models. Bioinformatics 2015, 31, 1420–1427. [Google Scholar] [CrossRef]
- Silva, A.; Rothstein, S.J.; McNicholas, P.D.; Subedi, S. A multivariate Poisson-log normal mixture model for clustering transcriptome sequencing data. BMC Bioinform. 2019, 20, 394. [Google Scholar] [CrossRef]
- Holmes, I.; Harris, K.; Quince, C. Dirichlet multinomial mixtures: Generative models for microbial metagenomics. PLoS ONE 2012, 7, e30126. [Google Scholar] [CrossRef] [PubMed]
- Subedi, S.; Neish, D.; Bak, S.; Feng, Z. Cluster analysis of microbiome data by using mixtures of Dirichlet–multinomial regression models. J. R. Stat. Soc. Ser. C (Appl. Stat.) 2020, 69, 1163–1187. [Google Scholar] [CrossRef]
- Lo, K.; Brinkman, R.R.; Gottardo, R. Automated gating of flow cytometry data via robust model-based clustering. Cytom. Part A J. Int. Soc. Anal. Cytol. 2008, 73, 321–332. [Google Scholar] [CrossRef] [PubMed]
- Chan, C.; Feng, F.; Ottinger, J.; Foster, D.; West, M.; Kepler, T.B. Statistical mixture modeling for cell subtype identification in flow cytometry. Cytom. Part A J. Int. Soc. Anal. Cytol. 2008, 73, 693–701. [Google Scholar] [CrossRef] [PubMed]
- Shen, R.; Mo, Q.; Schultz, N.; Seshan, V.E.; Olshen, A.B.; Huse, J.; Ladanyi, M.; Sander, C. Integrative subtype discovery in glioblastoma using iCluster. PLoS ONE 2012, 7, e35236. [Google Scholar] [CrossRef]
- Higgins, J.P.; Shinghal, R.; Gill, H.; Reese, J.H.; Terris, M.; Cohen, R.J.; Fero, M.; Pollack, J.R.; Van de Rijn, M.; Brooks, J.D. Gene expression patterns in renal cell carcinoma assessed by complementary DNA microarray. Am. J. Pathol. 2003, 162, 925–932. [Google Scholar] [CrossRef]
- Ma, X.J.; Salunga, R.; Tuggle, J.T.; Gaudet, J.; Enright, E.; McQuary, P.; Payette, T.; Pistone, M.; Stecker, K.; Zhang, B.M.; et al. Gene expression profiles of human breast cancer progression. Proc. Natl. Acad. Sci. USA 2003, 100, 5974–5979. [Google Scholar] [CrossRef]
- Haqq, C.; Nosrati, M.; Sudilovsky, D.; Crothers, J.; Khodabakhsh, D.; Pulliam, B.L.; Federman, S.; Miller III, J.R.; Allen, R.E.; Singer, M.I.; et al. The gene expression signatures of melanoma progression. Proc. Natl. Acad. Sci. USA 2005, 102, 6092–6097. [Google Scholar] [CrossRef]
- Humbert, S.; Subedi, S.; Cohn, J.; Zeng, B.; Bi, Y.M.; Chen, X.; Zhu, T.; McNicholas, P.D.; Rothstein, S.J. Genome-wide expression profiling of maize in response to individual and combined water and nitrogen stresses. BMC Genom. 2013, 14, 3. [Google Scholar] [CrossRef]
- Misyura, M.; Guevara, D.; Subedi, S.; Hudson, D.; McNicholas, P.D.; Colasanti, J.; Rothstein, S.J. Nitrogen limitation and high density responses in rice suggest a role for ethylene under high density stress. BMC Genom. 2014, 15, 681. [Google Scholar] [CrossRef]
- Wolfe, J.H. Pattern clustering by multivariate mixture analysis. Multivar. Behav. Res. 1970, 5, 329–350. [Google Scholar] [CrossRef]
- Luan, Y.; Li, H. Clustering of time-course gene expression data using a mixed-effects model with B-splines. Bioinformatics 2003, 19, 474–482. [Google Scholar] [CrossRef]
- McNicholas, P.D.; Subedi, S. Clustering gene expression time course data using mixtures of multivariate t-distributions. J. Stat. Plan. Inference 2012, 142, 1114–1127. [Google Scholar] [CrossRef]
- Coffey, N.; Hinde, J.; Holian, E. Clustering longitudinal profiles using P-splines and mixed effects models applied to time-course gene expression data. Comput. Stat. Data Anal. 2014, 71, 14–29. [Google Scholar] [CrossRef]
- Koestler, D.C.; Marsit, C.J.; Christensen, B.C.; Kelsey, K.T.; Houseman, E.A. A recursively partitioned mixture model for clustering time-course gene expression data. Transl. Cancer Res. 2014, 3, 217. [Google Scholar] [PubMed]
- Love, M.I.; Huber, W.; Anders, S. Moderated estimation of fold change and dispersion for RNA-seq data with DESeq2. Genome Biol. 2014, 15, 550. [Google Scholar] [CrossRef]
- Dong, K.; Zhao, H.; Tong, T.; Wan, X. NBLDA: Negative binomial linear discriminant analysis for RNA-Seq data. BMC Bioinform. 2016, 17, 369. [Google Scholar] [CrossRef]
- Doss, D. Definition and characterization of multivariate negative binomial distribution. J. Multivar. Anal. 1979, 9, 460–464. [Google Scholar] [CrossRef]
- Brijs, T.; Karlis, D.; Swinnen, G.; Vanhoof, K.; Wets, G.; Manchanda, P. A multivariate Poisson mixture model for marketing applications. Stat. Neerl. 2004, 58, 322–348. [Google Scholar] [CrossRef]
- Subedi, S.; Browne, R.P. A family of parsimonious mixtures of multivariate Poisson-lognormal distributions for clustering multivariate count data. Stat 2020, 9, e310. [Google Scholar] [CrossRef]
- Silva, A.; Rothstein, S.J.; McNicholas, P.D.; Subedi, S. Finite mixtures of matrix-variate Poisson-log normal distributions for three-way count data. arXiv 2018, arXiv:1807.08380. [Google Scholar] [CrossRef]
- Pourahmadi, M. Joint mean-covariance models with applications to longitudinal data: Unconstrained parameterisation. Biometrika 1999, 86, 677–690. [Google Scholar] [CrossRef]
- Dempster, A.P.; Laird, N.M.; Rubin, D.B. Maximum likelihood from incomplete data via the EM algorithm. J. R. Stat. Soc. Ser. B 1977, 39, 1–22. [Google Scholar]
- Wainwright, M.J.; Jordan, M.I. Graphical models, exponential families, and variational inference. In Foundations and Trends in Machine Learning; The Essence of Knowledge: Delft, The Netherlands, 2008; Volume 1, pp. 1–305. [Google Scholar]
- McNicholas, P.D.; Jampani, K.R.; Subedi, S. Longclust: Model-Based Clustering and Classification for Longitudinal Data; R Package Version 1.2.3; R Package: Vienna, Austria, 2019. [Google Scholar]
- Aitken, A.C. A series formula for the roots of algebraic and transcendental equations. Proc. R. Soc. Edinb. 1926, 45, 14–22. [Google Scholar] [CrossRef]
- Böhning, D.; Dietz, E.; Schaub, R.; Schlattmann, P.; Lindsay, B. The distribution of the likelihood ratio for mixtures of densities from the one-parameter exponential family. Ann. Inst. Stat. Math. 1994, 46, 373–388. [Google Scholar] [CrossRef]
- Schwarz, G. Estimating the dimension of a model. Ann. Stat. 1978, 6, 461–464. [Google Scholar] [CrossRef]
- Hubert, L.; Arabie, P. Comparing Partitions. J. Classif. 1985, 2, 193–218. [Google Scholar] [CrossRef]
- Rau, A.; Celeux, G.; Martin-Magniette, M.; Maugis-Rabusseau, C. Clustering High-Throughput Sequencing Data with Poisson Mixture Models; Technical Report RR-7786; INRIA: Saclay, France, 2011. [Google Scholar]
- Rau, A.; Celeux, G.; Martin-Magniette, M.L.; Maugis-Rabusseau, C. HTSCluster: Clustering High-Throughput Transcriptome Sequencing (HTS) Data; R Package Version 2.0.4; R Package: Vienna, Austria, 2016. [Google Scholar]
- Si, Y. MBCluster.Seq: Model-Based Clustering for RNA-Seq Data; R Package Version 1.0; R Package: Vienna, Austria, 2012. [Google Scholar]
- Leong, H.S.; Dawson, K.; Wirth, C.; Li, Y.; Connolly, Y.; Smith, D.L.; Wilkinson, C.R.; Miller, C.J. A global non-coding RNA system modulates fission yeast protein levels in response to stress. Nat. Commun. 2014, 5, 3947. [Google Scholar] [CrossRef]

| Model | Total Parameters in | |||
|---|---|---|---|---|
| Group | Group | Diagonal | ||
| “VVA” | Variable | Variable | Anisotropic | |
| “EVA” | Equal | Variable | Anisotropic | |
| “VEA” | Variable | Equal | Anisotropic | |
| “EEA” | Equal | Equal | Anisotropic | |
| “VVI” | Variable | Variable | Isotropic | |
| “EVI” | Equal | Variable | Isotropic | |
| “VEI” | Variable | Equal | Isotropic | |
| “EEI” | Equal | Equal | Isotropic | |
| True Value | Means | Standard Deviations | |
|---|---|---|---|
| True Value | Means | Standard Deviations | |
|---|---|---|---|
| Simulation Scenario 1 | |||
|---|---|---|---|
| G Selected | Average ARI | Time in Minutes | |
| Approach | (# of Times) | (SD) | Average (SD) |
| Long. MVPLN | 2 (25) | 1.000 (0.000) | 76.590 (20.970) |
| HTSCluster | 5 (25) | 0.002 (0.005) | 0.057 (0.010) |
| MBCluster.Seq | 4 (1), 5 (24) | 0.000 (0.002) | 0.237 (0.004) |
| Simulation Scenario 2 | |||
| G Selected | Average ARI | Time in Minutes | |
| Approach | (# of Times) | (SD) | Average (SD) |
| Long. MVPLN | 2 (25) | 1.00 (0.000) | 78.928 (7.886) |
| HTSCluster | 5 (25) | −0.011 (0.012) | 0.047 (0.007) |
| MBCluster.Seq | 5 (25) | −0.000 (0.004) | 0.237(0.003) |
Disclaimer/Publisher’s Note: The statements, opinions and data contained in all publications are solely those of the individual author(s) and contributor(s) and not of MDPI and/or the editor(s). MDPI and/or the editor(s) disclaim responsibility for any injury to people or property resulting from any ideas, methods, instructions or products referred to in the content. |
© 2023 by the author. Licensee MDPI, Basel, Switzerland. This article is an open access article distributed under the terms and conditions of the Creative Commons Attribution (CC BY) license (https://creativecommons.org/licenses/by/4.0/).
Share and Cite
Subedi, S. Clustering Matrix Variate Longitudinal Count Data. Analytics 2023, 2, 426-437. https://doi.org/10.3390/analytics2020024
Subedi S. Clustering Matrix Variate Longitudinal Count Data. Analytics. 2023; 2(2):426-437. https://doi.org/10.3390/analytics2020024
Chicago/Turabian StyleSubedi, Sanjeena. 2023. "Clustering Matrix Variate Longitudinal Count Data" Analytics 2, no. 2: 426-437. https://doi.org/10.3390/analytics2020024
APA StyleSubedi, S. (2023). Clustering Matrix Variate Longitudinal Count Data. Analytics, 2(2), 426-437. https://doi.org/10.3390/analytics2020024