Article

On Sense Making and the Generation of Knowledge in Visual Analytics

VRVis Zentrum für Virtual Reality und Visualisierung Forschungs-GmbH, 1220 Vienna, Austria
*
Author to whom correspondence should be addressed.
Analytics 2022, 1(2), 98-116; https://doi.org/10.3390/analytics1020008
Submission received: 25 May 2022 / Revised: 1 July 2022 / Accepted: 15 September 2022 / Published: 2 October 2022

Abstract

:
Interactive visual tools and related visualization technologies, built to support explorative data analysis, ultimately lead to sense making and knowledge discovery from large volumes of raw data. These processes namely rely on human visual perception and cognition, in which human analysts perceive external representations (system structure, dataset, integral data visualizations) and form respective internal representations (internal cognitive imprints of external systems) that enable deeper comprehension of the employed system and the underlying data features. These internal representations further evolve through continuous interaction with external representations. They also depend on the individual’s own cognitive pathways. Currently, there has been insufficient work on understanding how these internal cognitive mechanisms form and function. Hence, we aim to offer our own interpretations of such processes observed through our daily data exploration workflows. This is accomplished by following specific explorative data science tasks while working with diverse interactive visual systems and related notebook style environments that have different organizational structures and thus may entail different approaches to thinking and shaping sense making and knowledge generation. In this paper, we deliberate on the cognitive implications for human analysists when interacting with such a diverse organizational structure of tools and approaches when performing the essential steps of an explorative visual analysis.

1. Introduction

1.1. Overview

Visualization research has generally focused on the intelligent and cohesive visual representation of data and related information to support prompt understanding, sense making and efficient knowledge discovery from large volumes of raw data [1,2]. In this respect, the essential aspects guiding the data visualization design are human visual perception and cognition [3,4]. Visual perception (i.e., conceptual information comprehension through vision) of a given feature (e.g., shape, color, position, and orientation) is nearly instantaneous, with the process taking as little as 13 milliseconds [5]; cognition (i.e., a mental process of deeper information comprehension), on the other hand, requires thorough cerebral processing and is thus lagging behind human visual capacities [6,7]. However, when we talk about the individual contributions of visual perception and cognition to sense making specific to the data visualization domain, we can say that our visual capacities form the very basis of and are generally driving our cognitive faculties [8,9]. These two processes are becoming ever more intertwined with the introduction of interactivity in the data visualization design [10,11,12,13]. This fusion of interactivity and data visualization modalities, further enriched by analytical computation, is commonly referred to as the visual analytics (VA) approach [14,15]. The general aim of VA is informed visual data exploration supporting analytically sound data-centric reasoning and sense making [16,17].
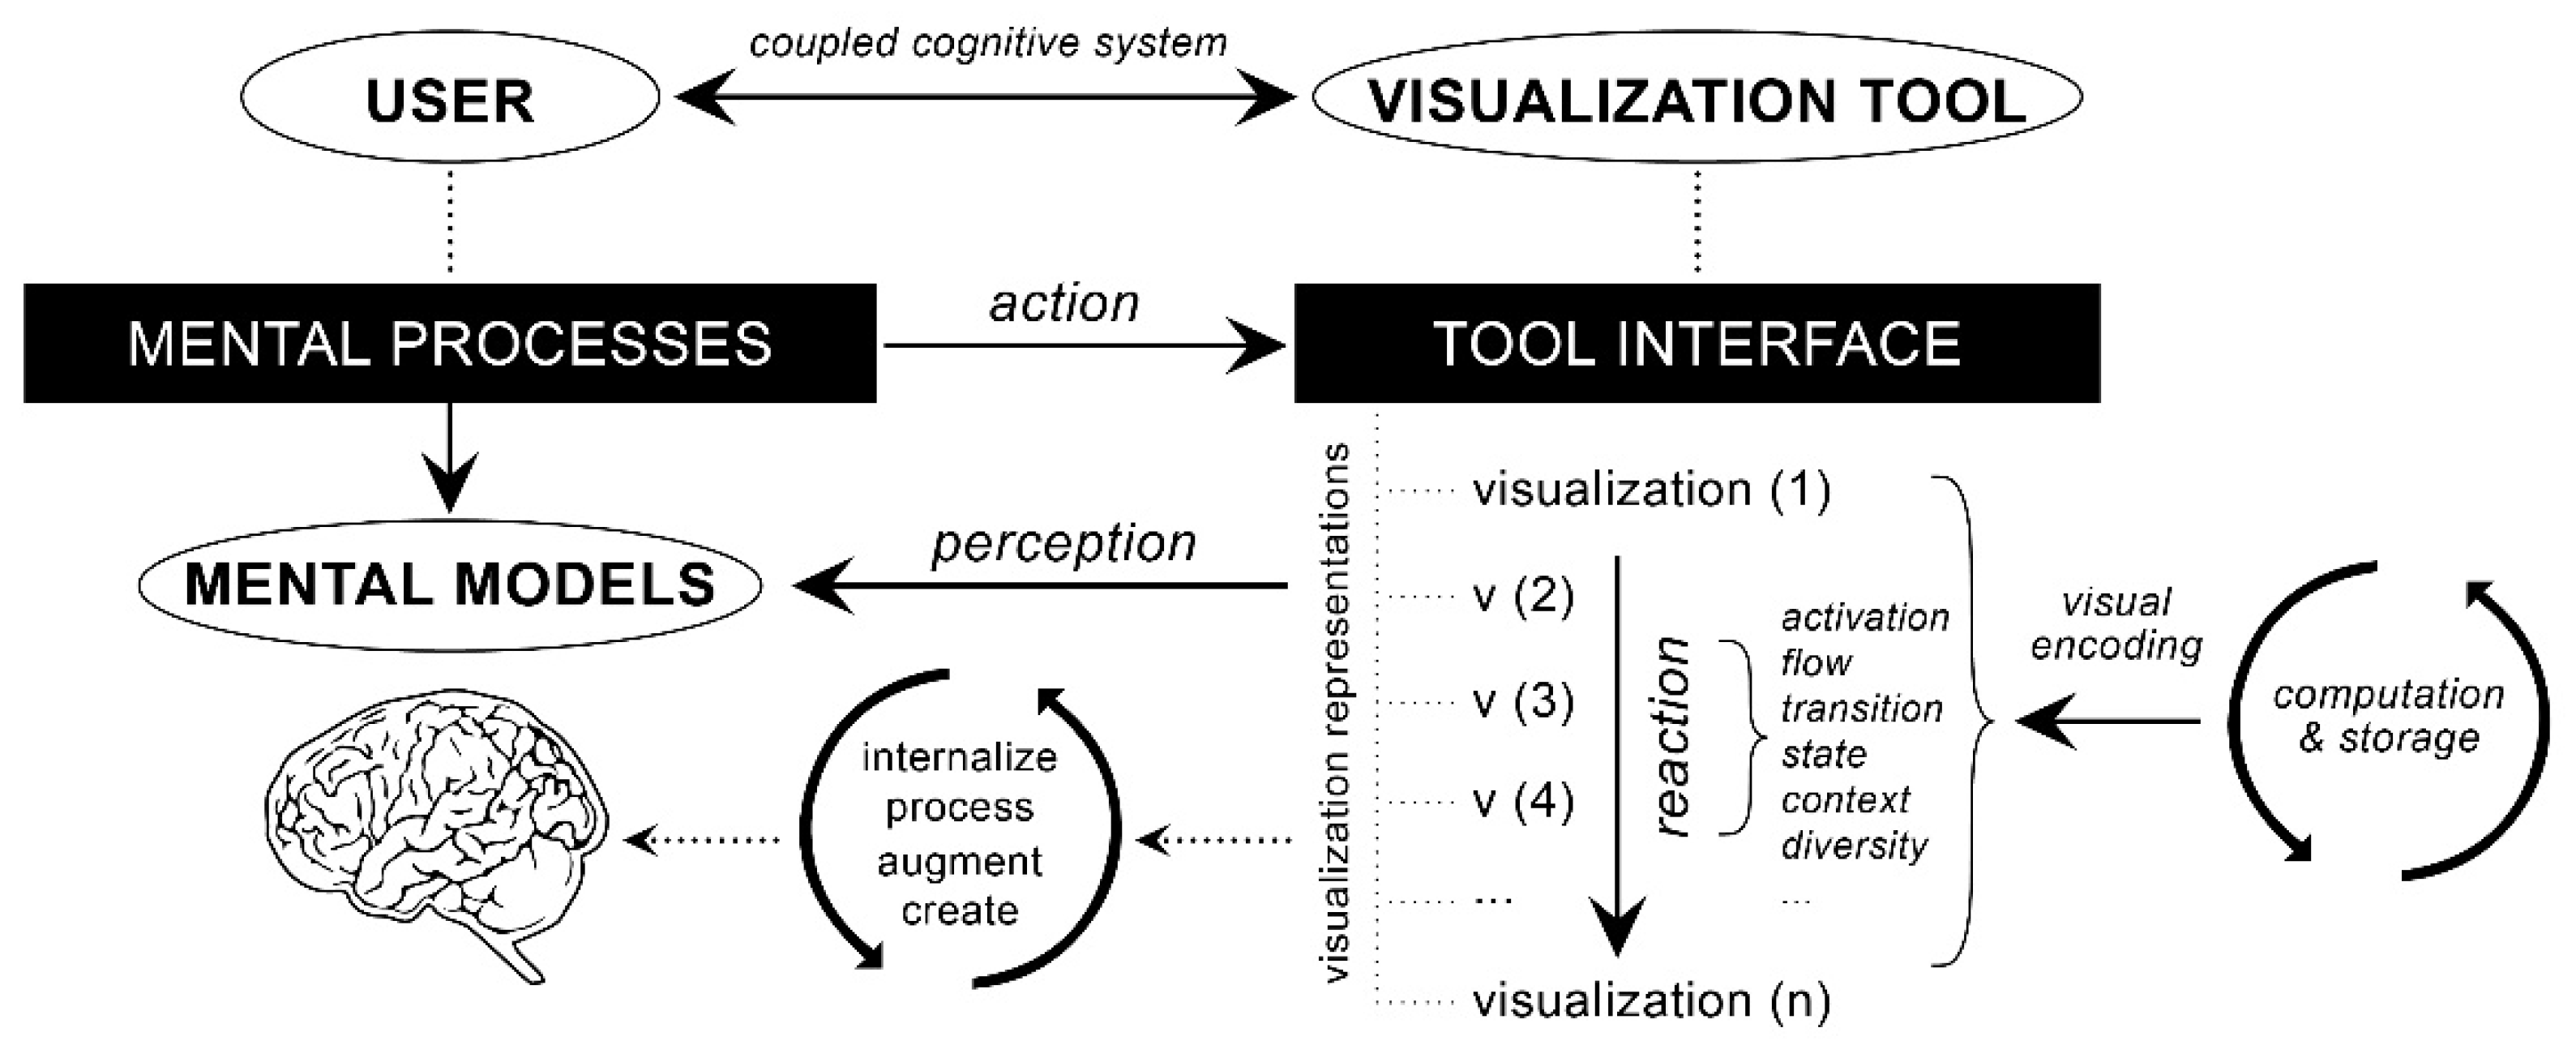
Although interactivity is observed as the core aspect of VA systems, human interaction with such a system and its features defines the quality and the degree of usefulness of a VA system in supporting complex explorative activities [18,19]. In a related work by Sedig et al. [18], multiple levels of interaction (activities, tasks, actions, and events) and interactivity (micro- and macro-level) are discussed, whereby interaction is observed as a process that takes place between a user and a visualization system, while interactivity refers to the quality of such interaction. This distinction holds importance due to its impact on the performance of complex cognitive activities (e.g., analytical reasoning, problem solving, and sense making) given that these are as much driven by the characteristics of tools as they are by the characteristics of users. As a result, a dynamic coupled cognitive system is eventually formed (Figure 1), in which the user and the VA system are continuously affecting and simultaneously being affected by each other [18].
Hence, when tackling interactive VA systems and human interaction with their integral interactive data visualizations, the sense making process becomes a bidirectional loop of seeing and thinking—more specifically, of perception, cognitive encoding, and retrieval [20,21]. In particular, there is a continuous interplay between external representations (i.e., data visualizations) and internal representations within humans (i.e., internal cognitive/mental mechanisms), as further discussed by Liu and Stasko [22]. Such postulate is in direct agreement with notions from the already discussed work of Sedig et al. [18,23], who claimed that cognitive processes tend to emerge from a coupling that is formed between the internal representations (processes of the user) and external representations (processes at the interface), as seen in Figure 1. Likewise, Kirsh [24] discussed that such internal representations are in essence an innate human need by which additional representations are created to aid human understanding and help us make sense of situations, diagrams, illustrations, instructions and problems. Additionally, external representations act as the means for cognitive offloading onto and within the external environment (e.g., a VA system), which in principle enables coordinated coupling between internal and external representations [25,26]. This interplay is highly dynamic and constantly evolves when engaging with interactive visual representations of data, as the process itself implies immersive data exploration and information discovery within the visualization itself. Ultimately, the purpose of such an interplay is knowledge generation and drawing intelligence regarding a phenomenon or a process under study.
There is ample evidence on what makes an effective (external) visual representation of data, in which the collection of best practices may be found within “The Grammar of Graphics” proposed by Leland Wilkinson [27]. Likewise, there are a number of relevant studies on the conceptual design of interactive visualization systems, whereby aspects such as human–computer interfaces, computer-mediated interactive communication, human–computer interaction, and human-centered interactivity are discussed [28,29,30,31,32]. However, a smaller proportion of the effort is directed towards a comprehensive understanding of how internal cognitive mechanisms form and function. These are commonly referred to as “mental models” [22,33]—internal cognitive imprints of an external system that enable deeper comprehension of system’s features—ultimately leading to sense making and knowledge generation about a system (in this context, a dataset, a data visualization, or a dashboard). Initial mental models may be driven by individual’s prior experience and domain knowledge of a system, whereby these further evolve through interaction with external representations and individual’s own cognitive pathways. Thus, there does not exist a singular generalizable mental model; however, as Mayr et al. [32] pointed out, these are expected to thrive on consistency and coherence. The developmental process of such models in our brains is equally discussed by Liu and Stasko [22], which can be seen as an extension to the previously introduced dynamic coupled cognitive process by Sedig et al. [18]. Figure 2 illustrates such an extension, where mental processes triggered by external visualizations are seen as a driving force to the formation of mental models.
In this contribution, we start by reflecting on the most prominent theoretical models regarding sense making and knowledge generation process by which mental models form. We proceed by looking into a number of studies that focus on the role of interactive visual data exploration in human cognitive activities and the development of corresponding mental models induced by such interactivity. We conclude by offering our own interpretations of mental model generation observed through our daily workflows that build on previously developed models and theories. This is accomplished by interacting with diverse VA frameworks (i.e., with a predefined analytical dashboard structure, with a “blank canvas” structure) and related notebook-style environments (i.e., a web-based interactive computing platform—Jupyter Notebooks). The aim is to deliberate on cognitive implications for human analysists when interacting with such a diverse organizational structure of tools and approaches when carrying out the essential steps of an explorative visual data analysis.

1.2. Related Work on Sense Making and Knowledge Generation Process

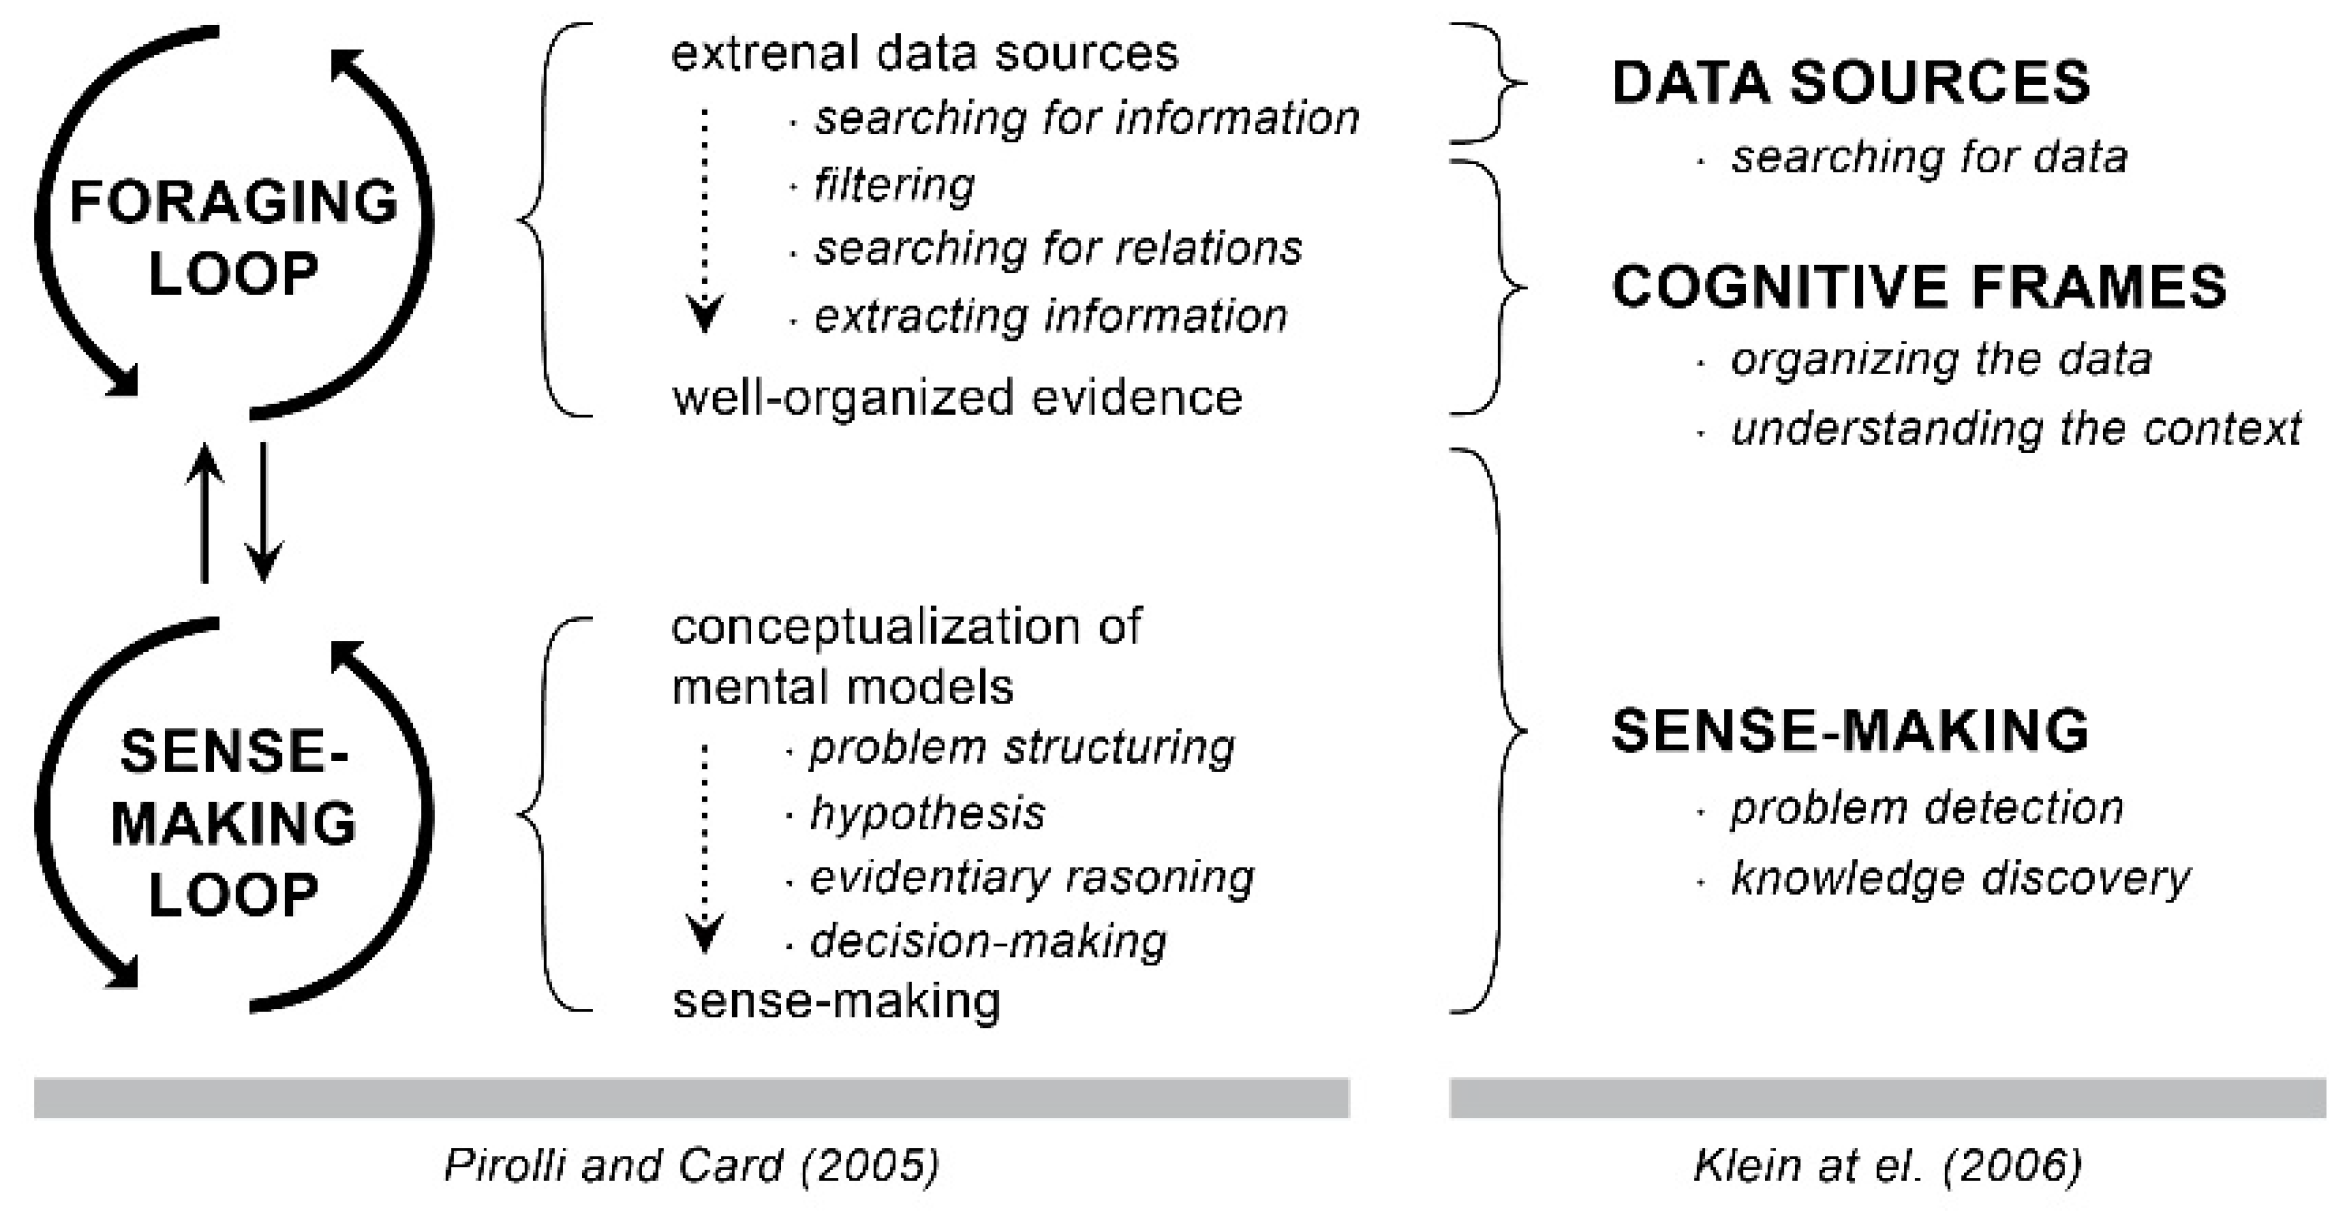
The sense making process is commonly understood as a deliberate process of constructing meaning from information, ultimately leading to generation of knowledge and insight [34]. The process itself is observed from a number of vantage points throughout the literature and further spans different disciplines and domains. For instance, Pirolli and Card [35] investigated a sense-making process specific to human analysts engaged in intelligence analysis (i.e., accurate and timely analysis of critical socio-cultural information assisting mitigation of threats and criminal activity). In their study, they aimed to define a conceptual model of the way raw data is converted into novel intelligence by human analysts. On a higher level, their sense-making process involved two main sub-processes: (1) uncovering new data (i.e., “foraging loop”) and (2) making sense of the information (i.e., “sense making loop”). On a finer level, a multitude of iterative cognitive activities occurred in between. Starting from searching, filtering, and extracting raw information from external data sources to assemble well-organized evidence (“foraging loop”), human analysts proceeded to the development of a mental model (a conceptualization) for problem structuring, evidentiary reasoning, and decision making (“sense making loop”). Pirolli and Card have shown that all of these in-between processes often generated new questions and hypotheses requiring additional inquiry, making them iterative by nature.
Following, Klein et al. [36] investigated the sense making process as an effort to understand events in a natural setting (i.e., from the real world). Although not directly related to the data analytics/visualization domain, their research may have relevance for linking the data to a suitable context. In this respect, they suggested a “data/frame” based theory of sense making that describes the relationship between data (observed as signals or events occurring in a natural setting) and cognitive frames (observed as explanatory structures—a story, a script, a map) that account for the data and guide the search for more data. In particular, a cognitive frame may be understood as a mental structure (e.g., a mental model) that organizes the data, while sense making as the process of fitting information into that cognitive frame. Klein et al. further documented that the sense making process may adapt to the circumstance. In some instances, the purpose of sense making may be problem detection, while in others the purpose may be knowledge discovery. As such and further aligned with the study of Pirolli and Card, Klein et al. have shown that the sense-making process is in constant flux. Namely, the data are used to select and alter a cognitive frame, whereby a cognitive frame is equally used to select and configure the data. However, they argued that once the initial frame is deemed inadequate, the sense-making and data exploration processes might suffer significantly. In this, we may draw another parallel to the data analytics/visualization domain in which the importance of domain expertise appears to be indisputable for fruitful data exploration, particularly reflected on defining a suitable cognitive frame within which data is mentally and visually processed and analyzed.
The above-discussed studies serve as exemplary theoretical explanations on the way individuals interact with data and related information in general, along with the cognitive processes they go through to make sense of a system or a situation. Figure 3 illustrates how these theories correlate and overlap. Following are the selected studies with pronounced focus on interactive visual data exploration and corresponding mental models (i.e., internal representation of an external interactive visualization system).
The work of Liu and Stasko [22] offered a deeper understanding of the role of interactive visualization in human cognitive activities. Namely, they investigated the way external data visualizations may shape the human analyst’s internal representations of such data, giving a specific focus to interaction modalities in information visualization (commonly referred to as InfoVis). Due to its inherent complexity, they suggested that a mental model specific to an interactive InfoVis system resembles a “cognitive collage”, where multiple visual cues (e.g., text, images, color and size of data attributes, behavioral aspects of visualizations, and spatial organization of an InfoVis interface) overlap and are equally used in the thinking and reasoning process. These aspects are considered to trigger a mental simulation, seen as a central working mechanism of mental models. As such, they considered the familiarity with inner workings of deployed interactive Infovis system as equally important in mental model formulation, which transcended the simple bidirectional relation between mental models and external visualizations (i.e., data visualizations) alone. Hence, four high-level dynamics between mental models and external visual cues are considered: (1) internalization, (2) processing, (3) augmentation, and (4) creation (as seen in Figure 2). “Internalization” is understood as a familiarity with the used InfoVis system forming the initial internalized mental model. “Processing” builds on the resulting internalized mental models, while considering them as processors of new external phenomena including data visualizations. “Augmentation” uses such processed mental models as the basis for reasoning and sense making. “Creation” takes the final mental models and uses them as drivers for new concepts and innovation, including the design of novel visual representations. Such dynamics are highly fluid and form an internal-external coupled system of three main building blocks resulting from continuous interaction with visualizations: (1) external anchoring, (2) information foraging, and (3) cognitive offloading. Essentially, “external anchoring” relates to eye fixation and movement led by visual forms (colors, shapes, spatial arrangement) in an external representation, resulting in the location of appropriate representational anchor points of interest for internal–external coupling. “Information foraging” relates to restructuring of the same data by applying a new sorting order or new color mapping to allow for a new perspective on the data during the process of visual exploration. Finally, “cognitive offloading” relates to creation of stable representations of internal structures lead by two previous steps, which reduces the overall cognitive load.
Mayr et al. [33] further discussed the conceptualization of mental models in InfoVis, especially touching on the topic of whether a single or multiple mental models form during an interaction with an InfoVis system. This notion aligns well with the “cognitive collage” proposition of Liu and Stasko. Similarly, Mayr et al. postulate that users tend to build a number of mental models that address the knowledge of the InfoVis tool (“tool mental model”), the knowledge of the data and their structural and relational characteristics (“data mental model”), but also mental models of the problem that needs to be solved (“problem space”). They further stressed that a mental model builds on earlier mental models and prior experiences with InfoVis systems or similar data sets.
Additionally, the work of Sedig et al. [23] stressed the importance of the organizational structure of a system in aiding sense making. This further aligns with the notion of a “tool mental model” from Mayr et al. [33], introduced above. They focused on the sense-making process when studying complex objects, such as multi-dimensional geometric shapes, elaborate chemical compounds, or mathematical structures, which are innately composed of many constituent components with intricate relationships. These are known to trigger complex cognition that involves complex psychological processes (e.g., reasoning, apprehension, memory encoding, and mental modeling) and complex external conditions (e.g., dynamic, uncertain, large, heterogeneous, interdependent pieces of information) [23,37,38]. Such studies are relevant from the perspective of how the difficulty of mental manipulation of complex information may be resolved by coordinated and complementary interactive interfaces. Sedig et al. stressed that design strategies of visibility and complementarity are seen as vital for the conceptualization of an effective visualization tool capable of portraying the essential aspects of complex 4D entities. Here, visibility relates to both the visibility of actions a user may employ and the visibility of data in the interface. The notion of complementarity, on the other hand, guided the design and selection of interaction techniques available in the tool. Namely, such interactions should be simple to use and sufficiently supportive of human sense-making activities. They also need to be complementary and to enhance the overall usability of the tool once combined. These suggested design principles guided the interface design of their developed tool that was further tested using three interaction techniques—filtering, focus and scoping, and stacking/unstacking.

1.3. Omitted Areas of Investigation

Although highly valuable in enhancing the existing knowledge base on mental models, sense making, and knowledge discovery, these studies do not reflect on the related cognitive implications arising from carrying out specific data science tasks (i.e., discover, integrate, profile, model, report). The studies of Liu and Stasko [22], Mayr et al. [33], and Sedig et al. [23] discussed above namely focused on analytic evaluation of mental model creation and sense making while employing selected interaction techniques and features available in used visualization tools. Some of these techniques and features relate to filtering, sorting, pairwise comparison, focus and scoping, and stacking/unstacking. However, there are some initial phases integral to all data science workflows that commonly begin outside of a given visualization tool. These phases are expected to equally trigger additional mental models, which are not considered in the studies above. These will be discussed in more detail in Section 2.3 and within the “Results” section.
Likewise, these studies do not consider cognitive implications arising from working with interactive systems that have a different organizational structure (i.e., predefined visual dashboards vs. user-defined/customized visual dashboards) and thus entail different approaches to thinking and shaping the sense making and knowledge generation. The importance of such considerations was indeed highlighted in the work of Sedig et al. [18,19,23], specifically in regard to the performance of complex cognitive activities being driven by both the characteristics of tools and by the characteristics of users, as discussed at the outset. Consistent with such notions, Mayr et al. [33] disclosed on the creation of mental models driven by the functionalities of the visualization tools, specifically driven by the inner workings of the tool and how to perceive the structure of the tool. However, to the best of our knowledge, no respective work has been carried out on investigations related to the formation of mental models driven by the different organizational and functional structure of interactive visual systems. Hence, in the following sections, we will discuss a number of these noted omitted instances and their relevance to the creation of mental models leading to sense making and knowledge discovery.

2. Methodology

2.1. Overview of VA Systems and Data Exploration Environments

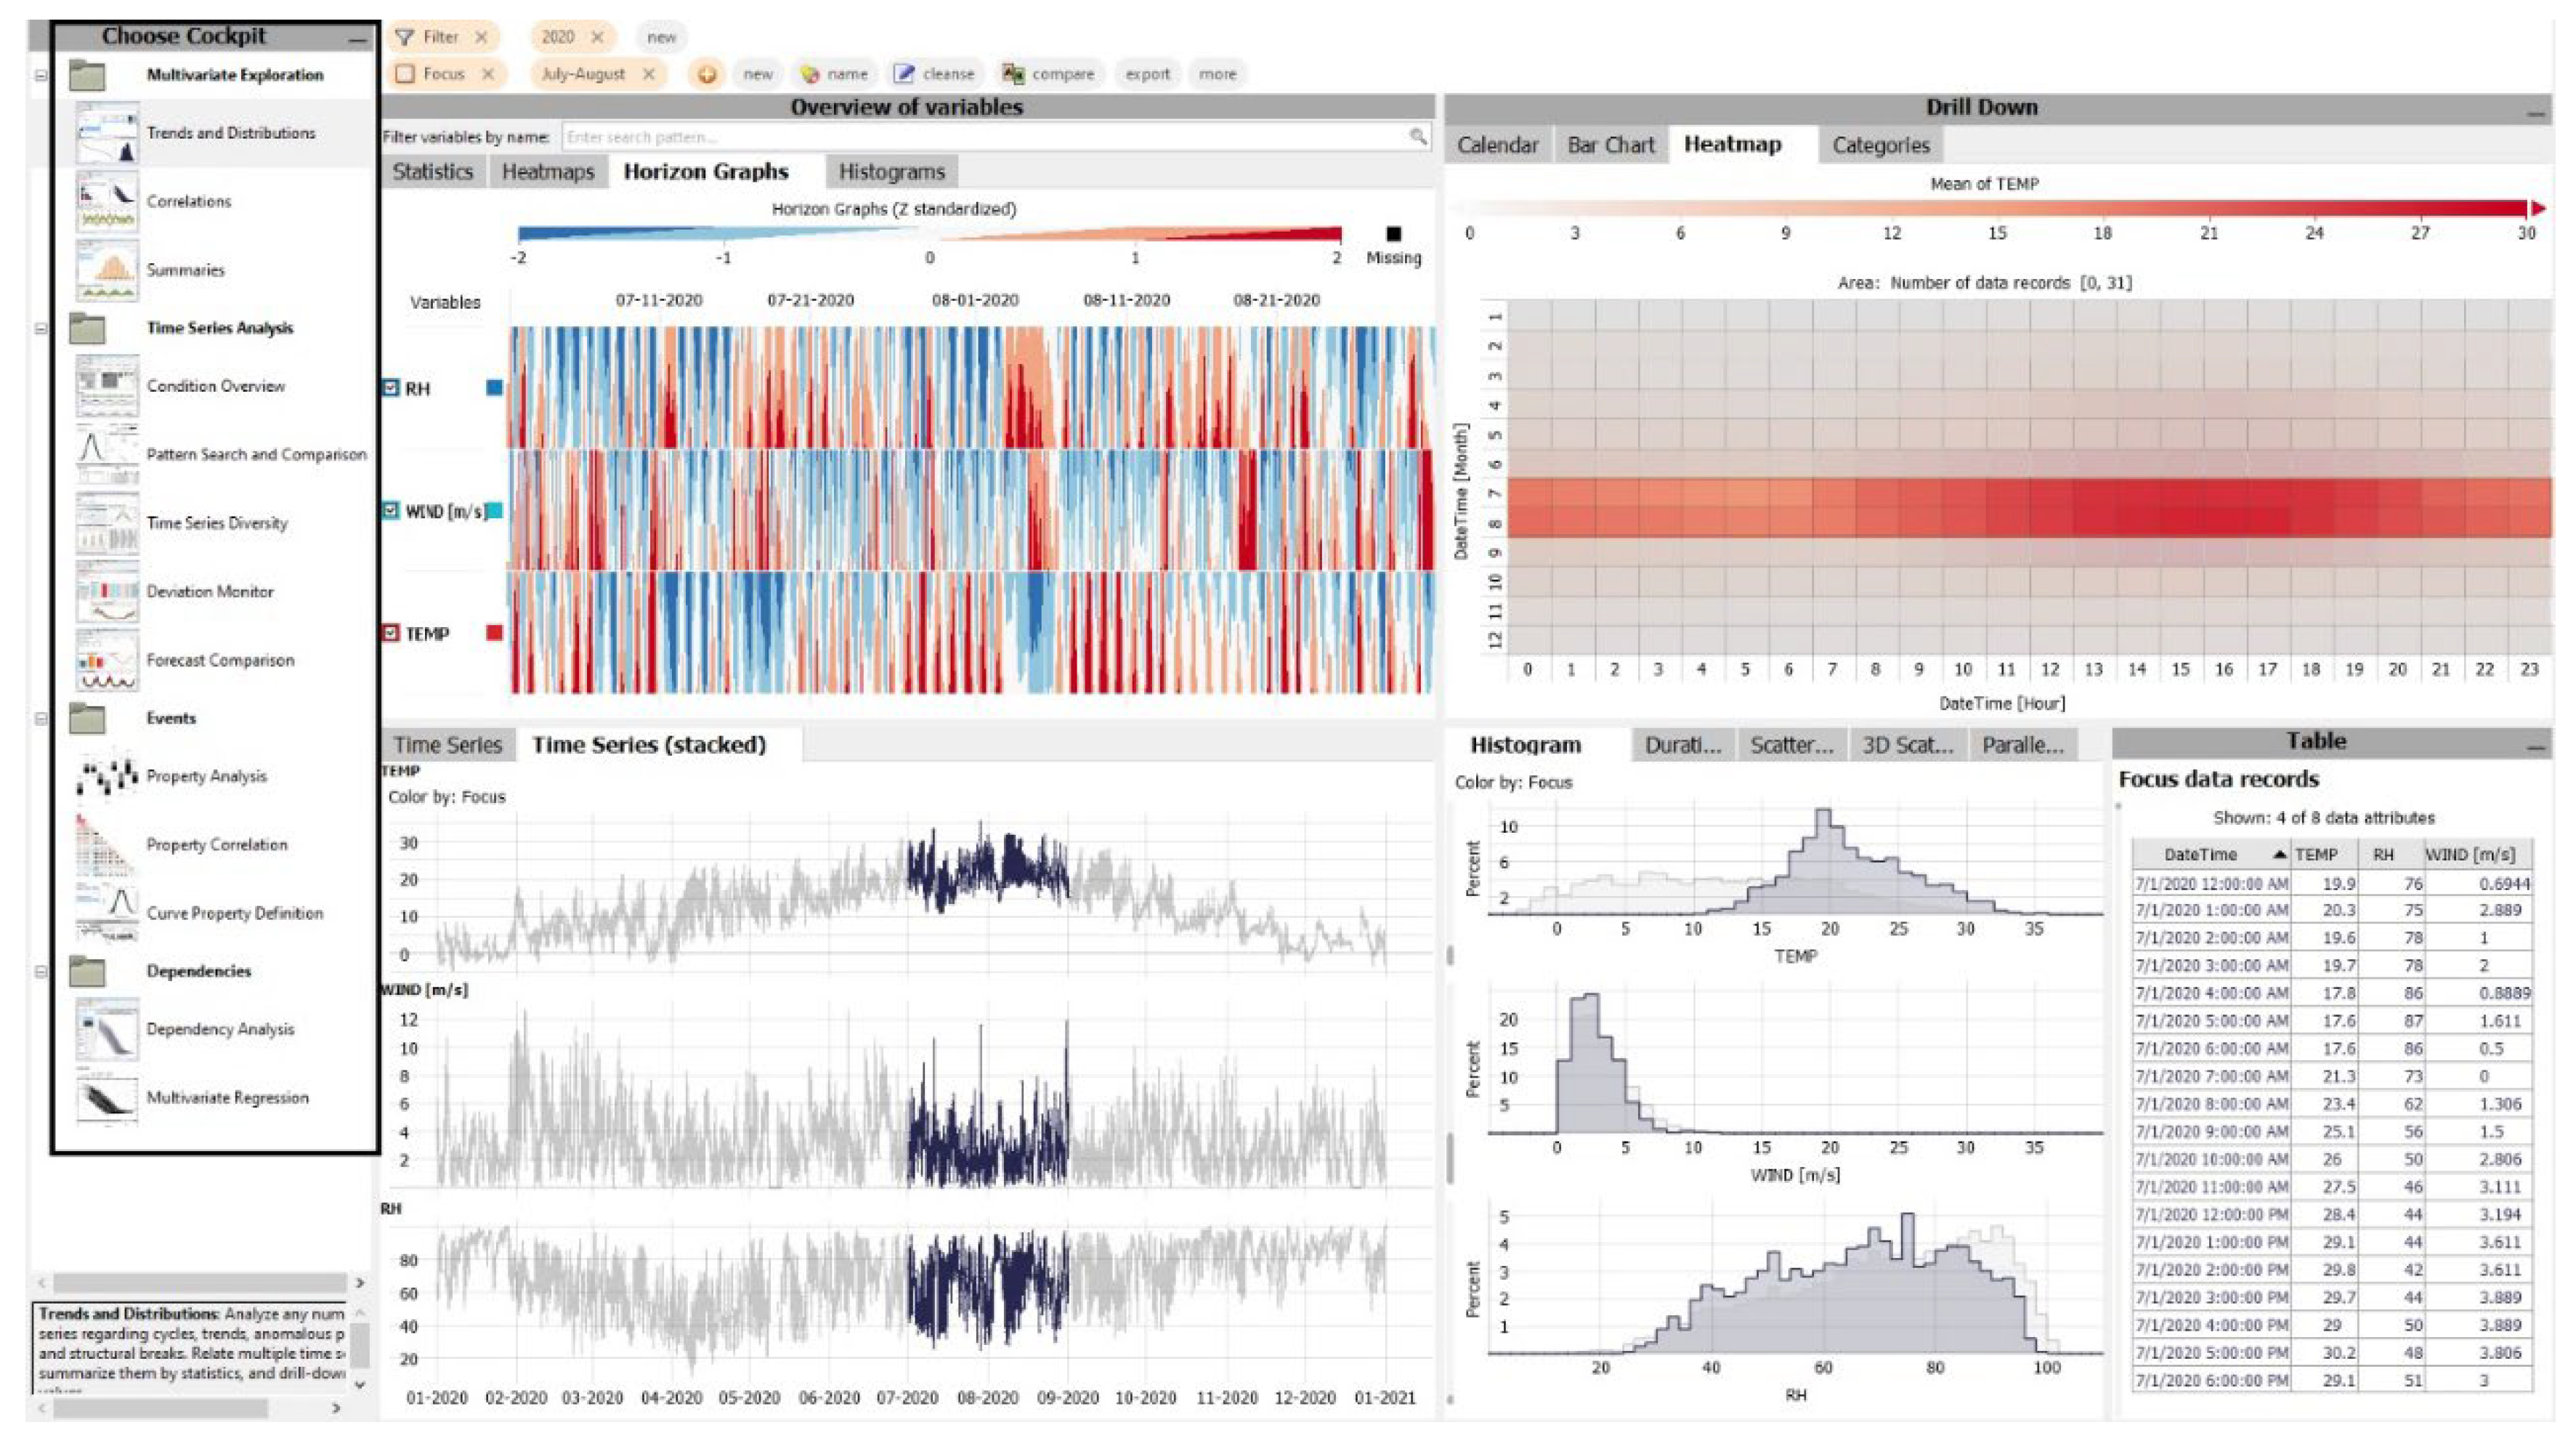
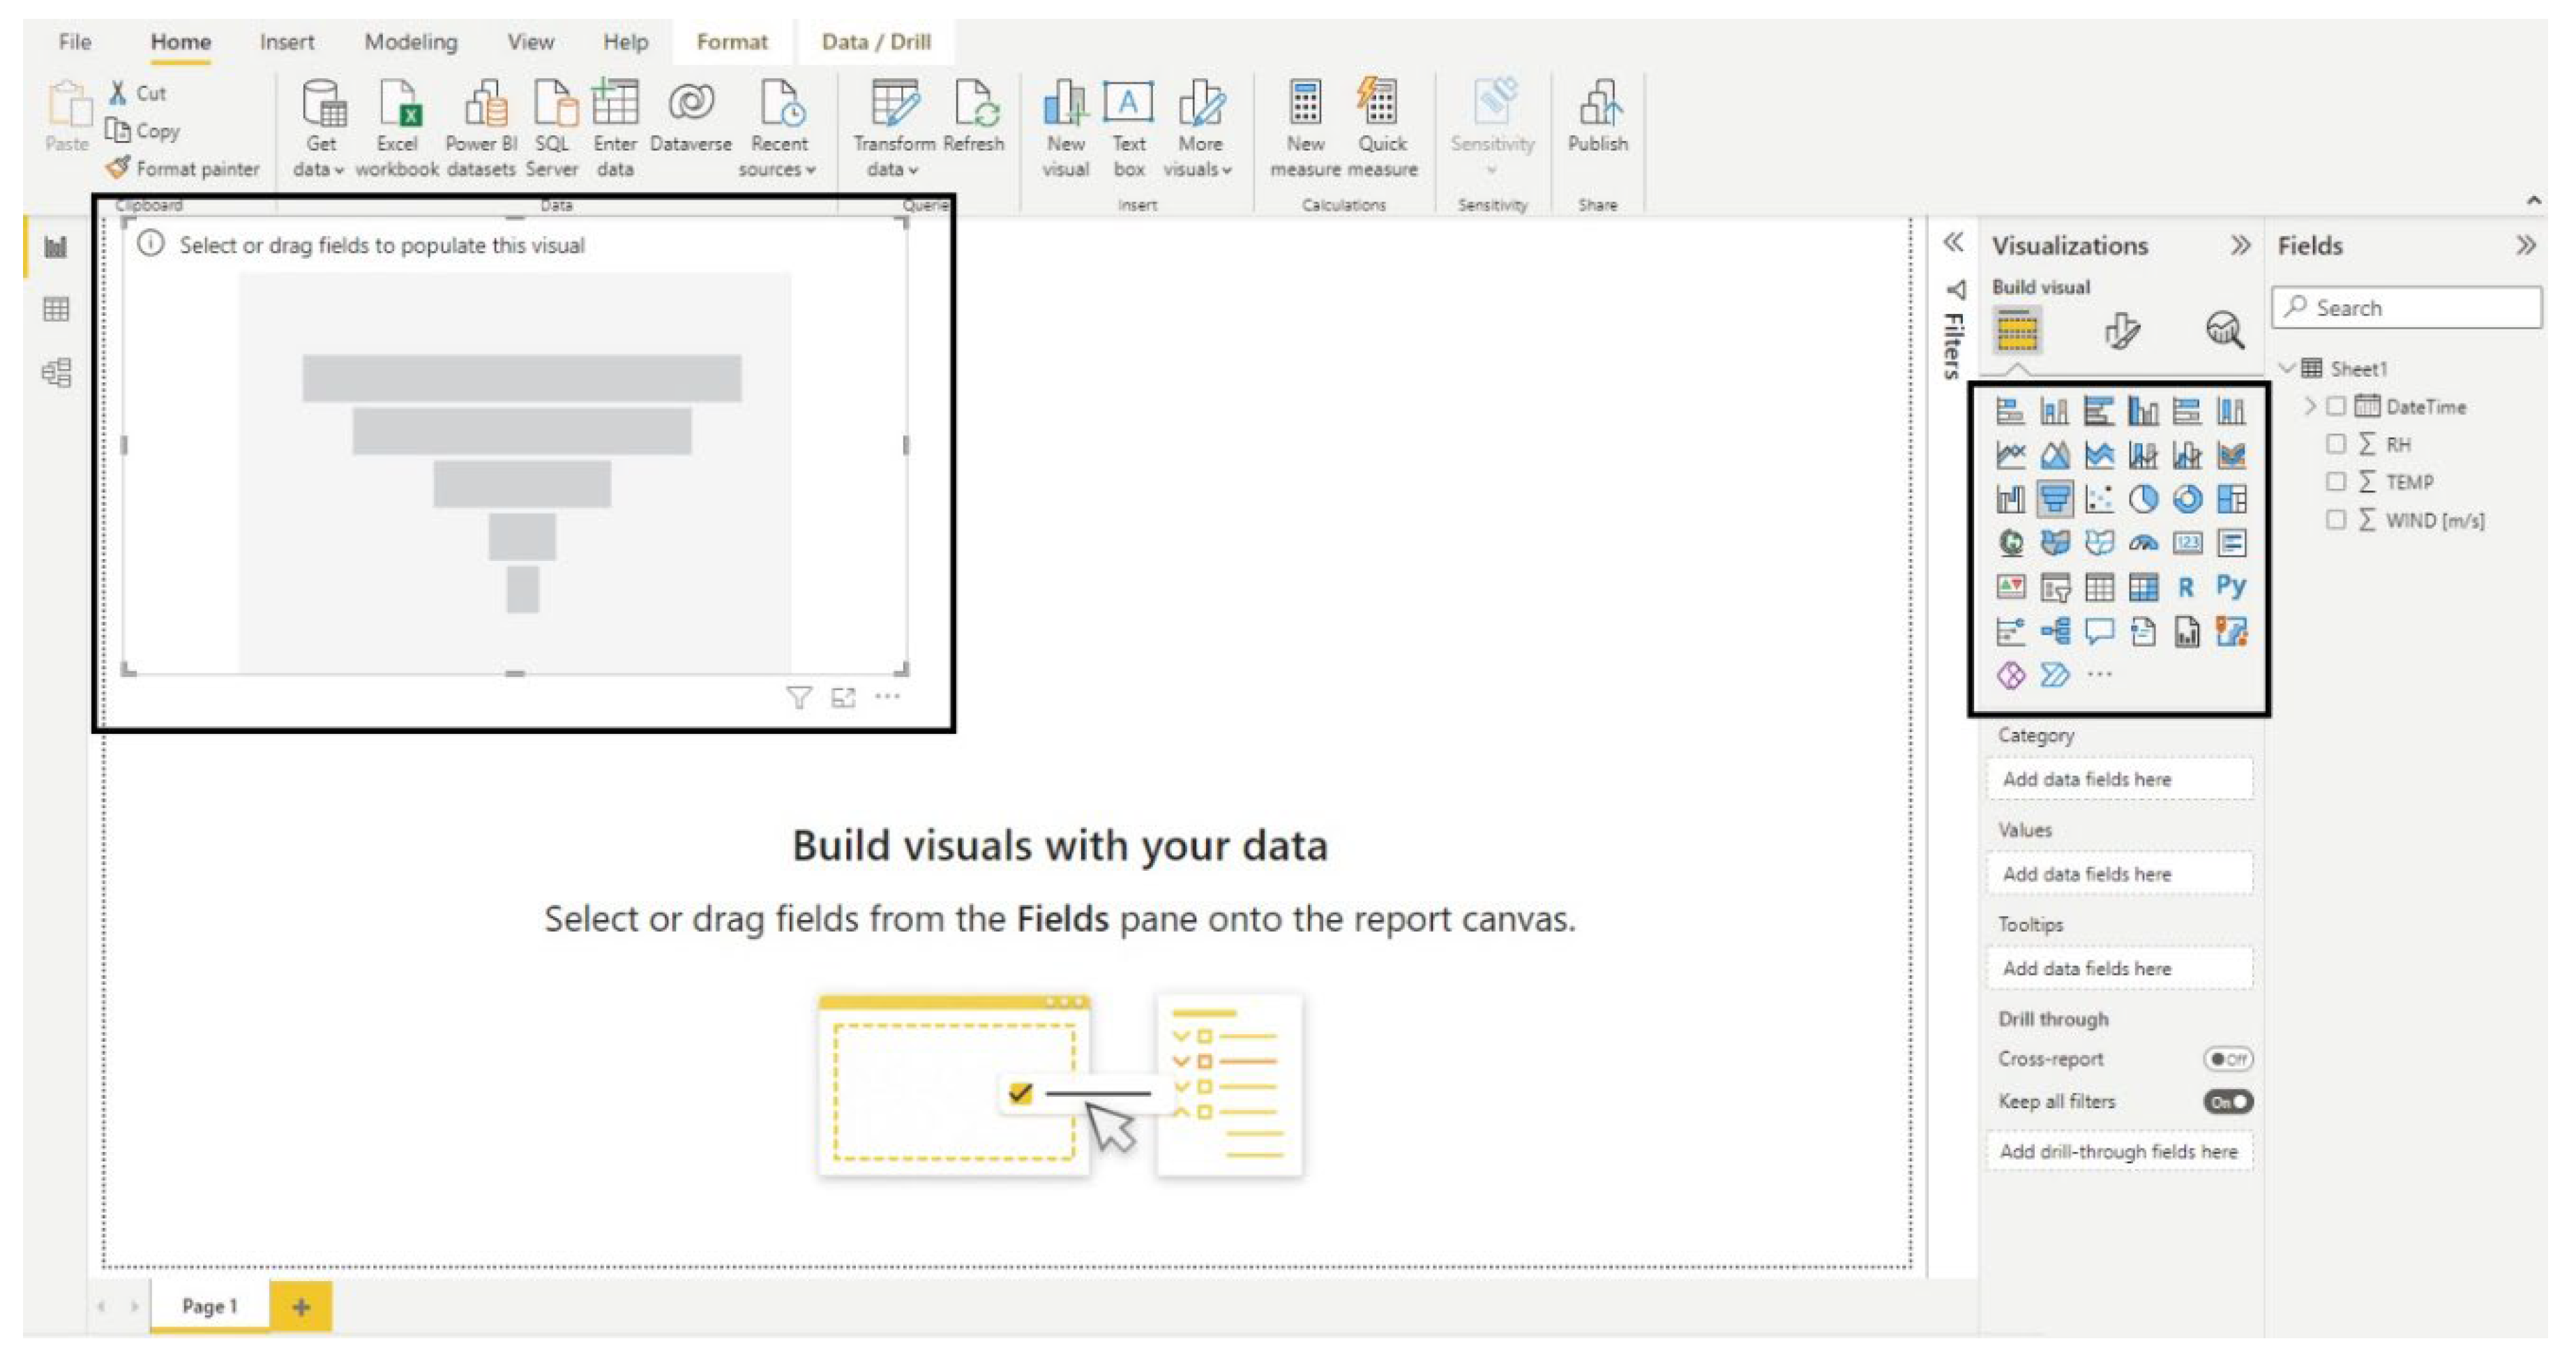
For our assessment, we considered two distinct categories of VA systems that may be classified as scientific and commercial type of systems. The scientific system is an analytical ensemble solution developed at our institution, specifically designed for interactive visual exploration of multi- and high-dimensional time series data, including categorical and functional data [39,40]. The selected commercial system (Microsoft Power BI) is representative of interactive visualization software solutions currently available on the market that are typically used to drive business intelligence [41]. In addition to their different application classification, these systems are characterized by a diverse internal organizational structure. This namely means that the scientific system comes with a predefined (i.e., fixed) analytical dashboard structure (Figure 4) with highly responsive interlinked 2D analytical visual modules (e.g., histogram, time distribution plot, parallel coordinates plot, heatmap, etc.). Namely, any user activity (e.g., point click, sequence selection, labelling) performed within any visual module will instantaneously trigger a corresponding response in all other visual modules within the concerned dashboard by highlighting the analogous data point/sequence. Furthermore, the system is equipped with a number of analytical cockpits attentively tailored to support diverse analytical tasks (e.g., trend analysis, pattern search, quality check). In contrast, the commercial system has a “blank canvas” structure without any initial default dashboard organization. Hence, it is expected that a user will configure his or her own interactive dashboard by dragging and dropping the desired visualization (i.e., a chart, a graph) onto a blank canvas and filling it with desired data items (Figure 5).
We also considered a type of literate programming tool (e.g., a notebook style environment) supporting the visual exploration of data by following a narrative approach that allows human analysts to keep track of their data analysis workflow. We have selected Jupyter notebook with Python [42] as a suitable environment to portray an alternative way to thinking and engaging with data in comparison to the VA solutions introduced above (Figure 6). We feel that such contrasting structures will adequately illustrate a variety of cognitive pathways of human analysists when interacting with differently organized systems and resulting approaches during an explorative visual analysis.

2.2. Approach to Conceptualization of Mental Models

The conceptualization of different mental models, as discussed by both Liu and Stasko [22] and Mayr et al. [33], that proposes a “cognitive collage” concept resulting in cognitive impressions of the tool (“tool mental model”), the data (“data mental model”), and the problem that needs to be solved (“problem space”), is a high-level differentiation that we generally agree with. We equally support the notion that these models are in a constant flux and that they evolve given new evidence (e.g., detection of outliers, trends, patterns, correlations). However, we also see the potential for further refinement.
We thus followed the formation of mental models systematically in our work and evaluated them by applying well established think-aloud and task-oriented techniques to follow the respective formation of mental models [43,44]. The think-aloud technique considers the verbalization of thought development and reasoning while performing a task or engaging with a system. The task-oriented technique follows a human while performing a defined task. In this context, we have foreseen the engagement with interactive visual tools and related environments and the performance of common tasks related to a data science workflow. In our approach, these two techniques are applied concurrently. Figure 7 illustrates our approach in a schematic way.
In terms of the data, we selected a time series data depicting meteorological conditions (air temperature, relative humidity, wind speed) representative of the city of Vienna, Austria [45]. The data denotes 3 years’ worth of records documented on an hourly basis. It should be noted that we are aware of the fact that the selection of data itself may in part drive the formation of mental models specific to the domain to which data belongs.

2.3. Envisioned Explorative Tasks

In order to explore the potential cognitive paths to sense making and knowledge discovery when using diverse interactive visual tools and related visualization technologies, we followed the essential stages of a data science workflow as introduced by Kandel et al. [46]. More specifically, we reflected on the following stages: discover (finding the data), integrate (data restructuring, fitting the data into a desired format), profile (data structure and quality check), model (advanced analytics), and report (final presentation of the relevant findings). As the discover stage involves a general search for appropriate data, either internal or external, this process is observed as unique across all concerned system applications. Likewise, data wrangling in part follows a similar scheme across system applications and approaches. The profile and model stages are found to significantly differ across the selected visual systems; thus, we will reflect on their conceptualization and characteristics from the perspective of each system individually. Finally, the report stage may share a common approach across systems, whereby we will highlight all deviating instances.

3. Results

3.1. Data Discovery

The data discovery stage essentially happens outside of the given system application. This stage involves the search for internal (e.g., integral to an ongoing research project or a host institution) and external raw data sources (e.g., originating from diverse web-based data repositories). The main challenge here, however, may be restricted data access, inadequate data resolution, or poor metadata information (e.g., supporting documentation of data items). Hence, human analysts need to think about the possible sources of trustworthy, freely available data of good quality that can be found, for example, in national or international open government data catalogues. Once identified, the data are first judged for relevance and later locally stored or made available within a shared database repository.
On a higher level, data discovery is categorized as the initial step of a “data mental model”. This stage aligns equally well with the concept of a “foraging loop” from the study of Pirolli and Card [35] that focuses on seeking, uncovering, and extracting new data. While refining this high-level categorization, we borrowed the notion of cognitive frames from the “data/frame” theory by Klein et al. [36]. Hence, we suggest that more refined mental models generated at this stage may relate to a “data search frame” (i.e., searching and locating a space where data may reside) and a “data taxonomy frame” (i.e., relevance estimation based on data type, resolution, applied aggregation, provided attributes and parameters).

3.2. Data Integration

The main purpose of data integration is to make the acquired raw data usable, ready for analysis, and to later bring it into a deployed software environment. Hence, this is the stage where data are brought into a desired format, where different data items from multiple sources may be integrated/joined together into a single dataset, and where data restructuring and cleansing takes place. Such data cleaning and restructuring actions are referred to as the data wrangling process, seen as integral to data integration, and are commonly carried out using additional software tools independent of interactive visual tools used for data exploration, such as, for example, Microsoft Excel [47], or tools specifically designed for data wrangling (e.g., Wrangler [48]), or other programmatic solutions that build on programming languages such as Python, SQL, and R. Hence, the initial stage of data wrangling may happen outside of the given system application. This especially holds true for the scientific system used in this study, which requires the data to be assembled outside of the tool. Only some simple data wrangling functionalities are given in the tool, such as removing the missing values. In the case of the commercial system, a range of built-in features are offered that may aid data preparation. However, such functionalities are provided within a different interface (Power Query in Microsoft Power BI) that needs to be initiated separately (outside of the main tool). Hence, analysts may still resolve to use other more familiar methods for data wrangling, such as those mentioned above. In contrast, within a notebook style environment, analysts are more inclined to directly prepare and transform the data using the selected programming language (in the current case Python) and a number of specially developed library of tools. In this case, data integration is closely integrated with a data wrangling phase and may be observed as a unified process.
On a higher level, data integration is categorized as the following step of a “data mental model”. In respect to the discussed sense making theories and models, this stage may equally be considered as a part of a “foraging loop” from the study of Pirolli and Card [35], as it concerns organization and enrichment of gathered data for further processing. However, as their study does not necessarily focus on computer-aided analysis but is more oriented towards a qualitative evaluation (e.g., organizing a large collection of descriptions of people, addresses, telephone numbers, etc.), we feel the related mental model should be more explicit. Hence, we may suggest that concerned mental models relate to a “methodological frame” (i.e., selection of a technique or a procedure for data wrangling), “data preparation frame” (i.e., data integration/joining, data formatting), and “data transformation frame” (i.e., data restructuring, cleansing, and enrichment).

3.3. Data Profiling

The data profiling stage is the stage where analysts start exploring the data to understand its structure, distribution, and behavior. The process itself is iterative and changes with every new discovery. It is also heavily driven by domain knowledge. Commonly, analysts start by understanding the very nature of the data at hand, which relates to their tendencies, regularities, correlations, and patterns (i.e., periodical, regular). Following this, any unusual or irregular occurrences that significantly deviate from the majority of data points are being recognized, such as outliers (i.e., point-based, sequential, contextual), extreme values, and unusual patterns (i.e., singular, irregular). Additional quality issues, such as missing or error values or gaps in the timestamp, are also acknowledged and corrected if deemed possible given the underlying data.
In general, we can say that the overall intention of the data profiling process is the same. Hence, the resulting general mental model may be considered as the initial phase of the “sense making loop” from the study of Pirolli and Card [35], in which analysts start to conceptualize a cognitive representation of behavioral, structural, and functional aspects of data. Likewise, we find that all three models (tool, data, and problem) from [22] and [33] are equally triggered and fused together. However, as the approach to understanding the structure and quality of the data at hand differs substantially across the evaluated visual systems, on a more granular level we could expect a number of mental models that may overlap or appear as specific to the deployed visual system.
Scientific system: The scientific system is equipped with an analytical cockpit tailored for data structure and quality check (Figure 8). Analysts can employ numerous inherent functionalities and interactive visual modules to inspect the completeness of the data (detection of missing values), threshold breaches, anomalies (outliers, duplicate entries, time gaps), trends, and derive the basic descriptive statistics of the imported data (e.g., number of time stamps, mean, maximum, minimum, standard deviation). Hence, due to the readily available instruments for an efficient evaluation of potential quality issues, a general cognitive focus is more on the inspection of the data and its inherent features using the available interaction techniques and visualizations. Such functionalities are then used to filter out identified data issues and to prepare the data for further processing. In this respect, we find that a “cognitive collage” concept [22,33] is indeed a suitable depiction of the respective mental processes. A starting point is a “functional frame” (i.e., knowledge about the tool interface and its analytical functions) that is closely intertwined with a “data problem frame” (i.e., inspection and recognition of data deficiencies), leading to the “data remediation frame” (i.e., evaluation, amendment, filtering, and preparation for further processing).
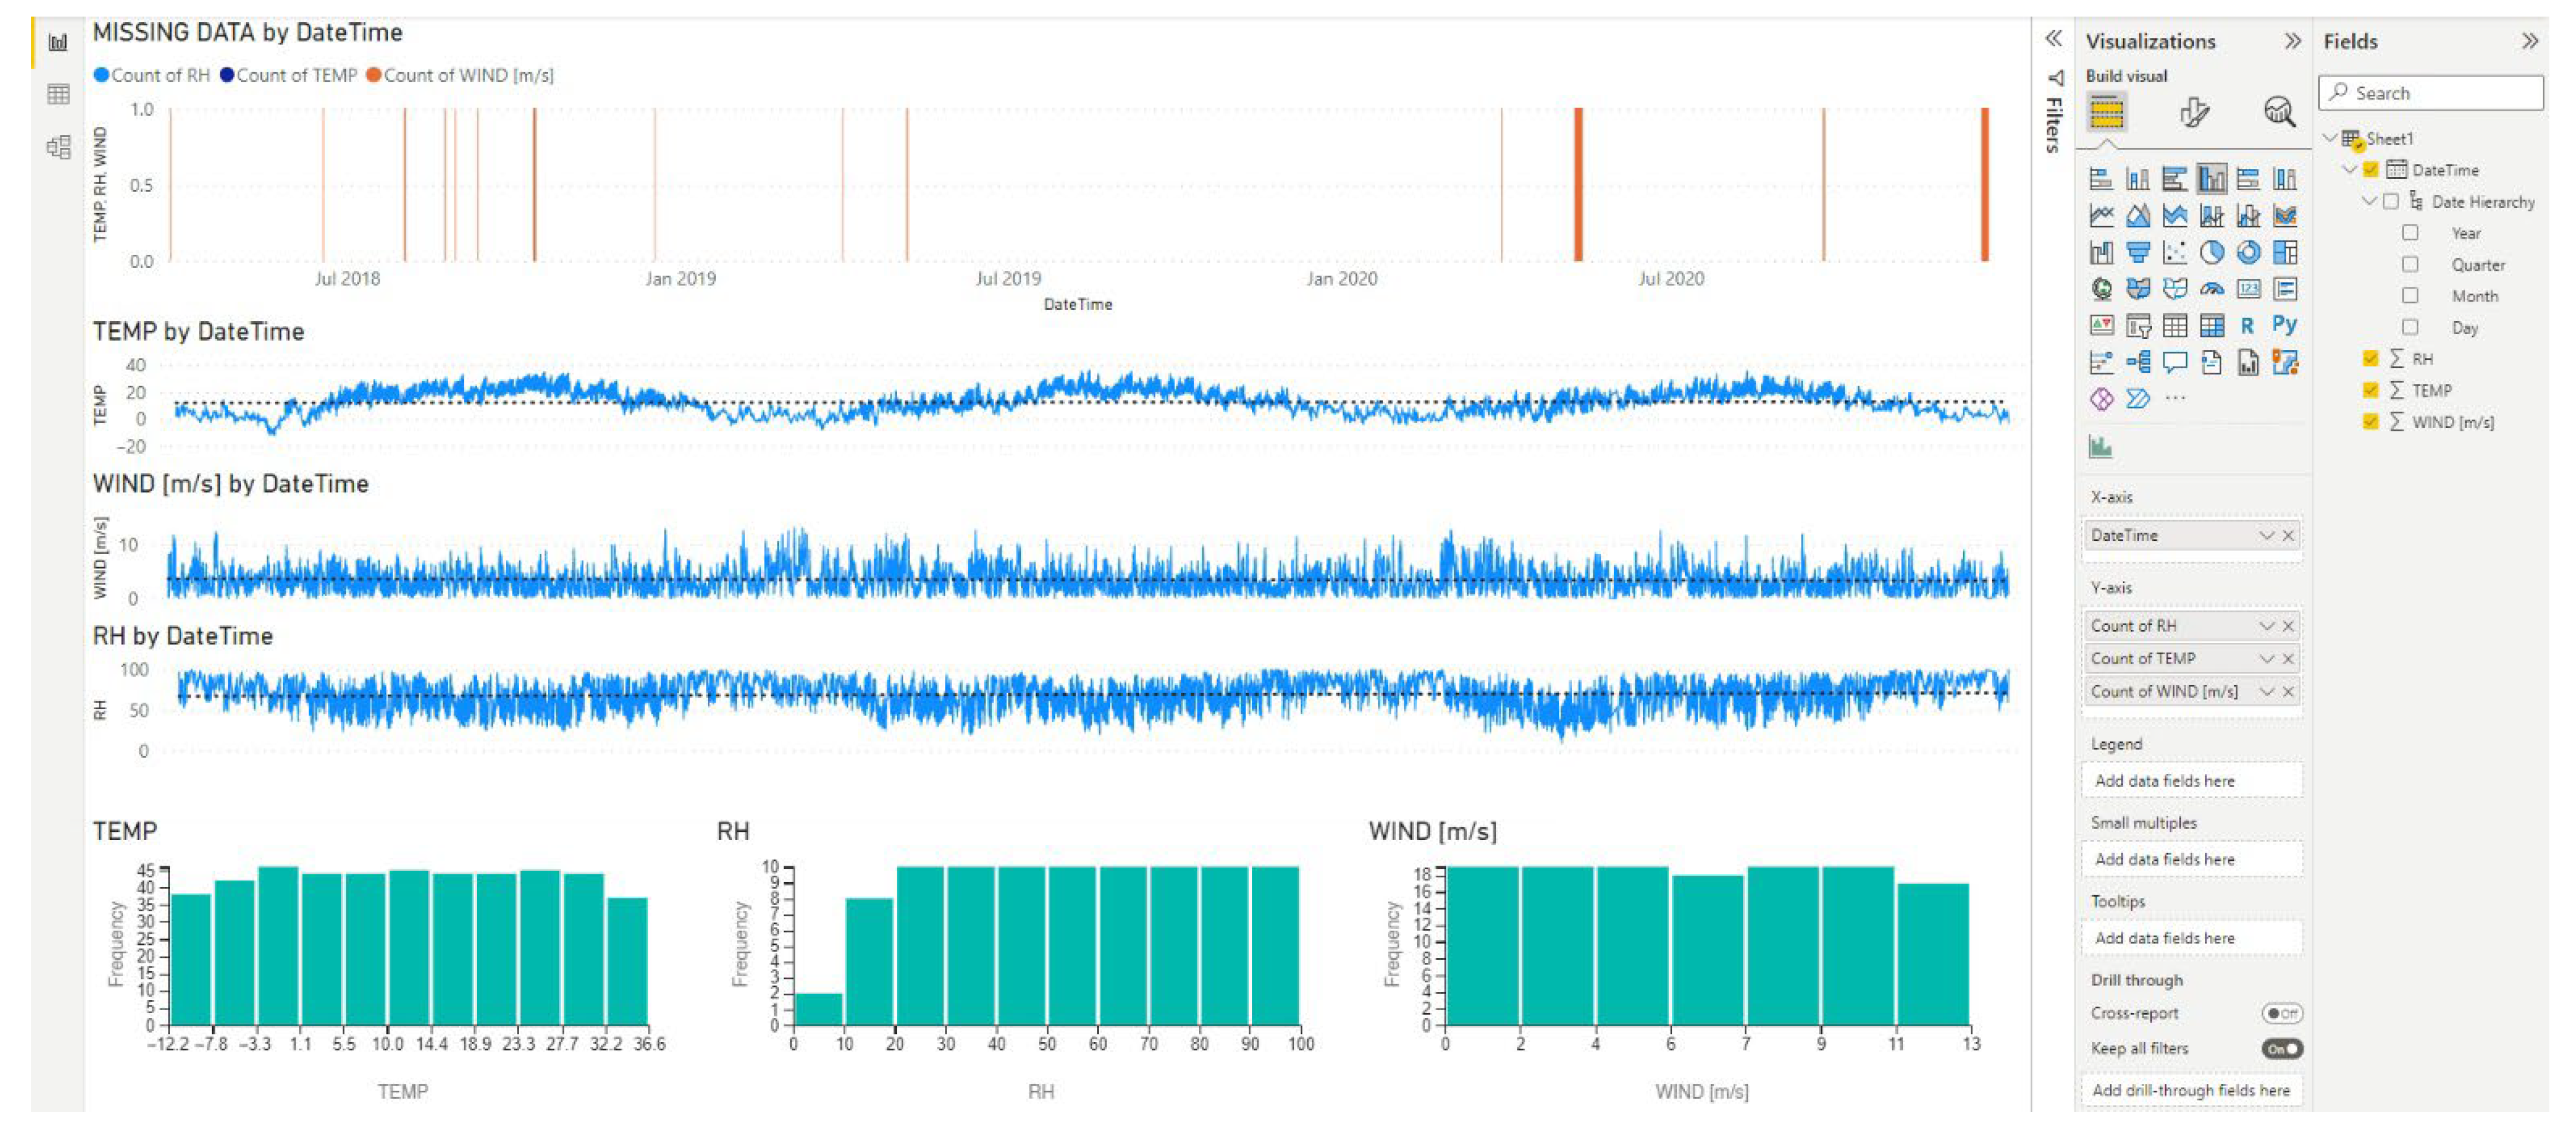
Commercial system: The commercial system offers a few functions that may aid data inspection, such as a summary distribution chart plotting distinct value distribution of each data column where basic column quality could be assessed (e.g., null values, outliers). However, this summary is descriptive only and it provides an overall count of existing faulty instances with no distinct positioning in the data. Hence, for a more intelligent analysis of data structure, trends, and distinct localities of any faulty instances, analysts have to design a custom dashboard (given the “blank canvas” system structure) with visualizations that could optimally portray data structure and existing quality features (Figure 9). In this respect, not only domain knowledge on the data is needed, but also knowledge on data visualization and representation techniques. Building on the “cognitive collage” concept and our prior propositions regarding the mental models in the scientific system, we may say that “functional frame” and “data problem frame” may still be considered as starting points, while introducing an additional “data visualization frame”. Once the last frame is set up, the “data remediation frame” may proceed.
Notebook style environment: In the case of notebooks, all the steps have to be completed manually (see Figure 6). This requires experience with the notebook framework itself, along with having a deeper knowledge of relevant libraries (i.e., collections of reusable pieces of code) and their areas of application. Especifically relevant are the libraries that facilitate scientific computing and data manipulation (e.g., NumPy, pandas), data quality assessment (e.g., pydqc), and cater for the generation of diverse (statistical) data visualizations (e.g., matplotlib, seaborn). The workflow itself entails gradual code conceptualization and execution, in which each line of code has to be written, executed, and adjusted if necessary. This equally relates to data visualization, which is only depicted in the environment once the line with a corresponding code is run. In addition, new lines of code are needed to initialize different visualization types (e.g., line chart, histogram, scatter plot). Getting an overview of the data and its structure is therefore less intuitive compared to the previously discussed systems. This equally calls for a more complex “cognitive collage” in accordance with all the steps that need to be taken. Hence, we start with a “functional frame”, but then proceed to the “programming frame” (e.g., code conceptualization, writing, and execution), which continuously overlaps with a “data problem frame” and a “data visualization frame”. All of these steps are setting up the grounds for a “data remediation frame”.
All of the introduced cognitive frames change constantly during the interaction with the external representations (i.e., tool interface, code, visualizations). They are cognitively assessed, evaluated, restructured, and enriched based on novel perspectives and discoveries within the data.

3.4. Data Modeling

Data modeling stage is the most perception- and cognition-intensive phase. Essentially, this is a phase of data exploration and modeling, which facilitates perceptual and cognitive navigation in complex and rich spaces of information. As such, this phase does not have a concrete task-based structure. Rather, it is navigated by a multitude of analytical decision points and visual cues within the data, visual system interface, and respective data visualizations. In this, it may be in part explained by well-established gestalt principles of visual perception describing the way human brain interprets signals pertaining to relationships and hierarchy [49,50]. Namely, it is found that a human mind shows a tendency towards grouping and organizing elements, recognizing patterns, and simplifying complex imagery in a more predictable way, which is further driven by visual cues like proximity, similarity, continuity, closure, and order/symmetry. Such properties would essentially help humans to mentally organize simultaneous stimuli arising from multiple linked views integral to a VA system, interactivity features (i.e., zooming, filtering, and refocusing), instantaneous responses across different analytical modules, and diverse data dimensions and features portrayed in numerous data visualizations. Once organized, such stimuli may incrementally form meaningful internal representations eventually leading to a cohesive and integrated understanding of data and its features. In this regard, the investigations on the importance of complementary and coordinated interactions of a visualization system in aiding sense making from the work of Sedig et al. [18,19,51] further come to the foreground. According to Sedig et al., complementary interactions may support flexibility of user action, which in turn may encourage more autonomous and self-regulated exploratory processes. Likewise, a good-quality interaction is one that provides diversity, harmony, flexibility, and appropriateness given a specific problem or system. Hence, a system that may offer such quality in most of its aspects may be seen as valuable in supporting a user’s analytical needs and seamlessly facilitating comprehension.
This phase is considered as the essence of the “sense making loop” suggested by Pirolli and Card [35]. We also find that these are the most dynamic mental models that may not abide by any permanent scheme or definition. In an effort to provide a potentially suitable delineation, we will discuss some of the potential cognitive developments given the nature of the underlying data and deployed visual systems.
Scientific system: Given the predefined structure of the scientific system, analysts are provided with diverse analytical cockpits (see Figure 4) that support time series analysis (i.e., pattern search and comparison, time series diversity, forecasting), multivariate exploration (i.e., correlations, trends and distributions), and dependencies on multiple variables (i.e., multivariate regression). All of these features are highly responsive across all analytical cockpits, supporting thus the development of both local (native to a single cockpit) and global (holistic across the whole VA system) mental models. Hence, we suggest that potential mental models build on the previously introduced “functional frame”, which may require subsequent partitioning into local and global sub-frames. The local sub-frame considers perceptions and comprehensions originating from a single visualization, progressing to complex developments stemming from multiple coordinated visualizations within an entire analytical cockpit. Such singular and complex developments drive a “data discovery frame” in which humans construct exemplary mental models going from an initial, to a transitional, and finally to a conclusive cognitive comprehension of data. Transitional comprehensions are the ones that are in a constant flux, as these ones change and adapt based on new discoveries arising from other analytical cockpits and their features. Conclusive comprehensions result from a global sub-frame (i.e., comprehension of the entire system, its features, and data) and drive ultimate sense making and knowledge discovery.
Commercial system: As mentioned before, commercial systems generally require a dashboard to be built by an analyst from the ground up. Such a development is strongly driven by discipline-specific knowledge (e.g., visualization research, analytics) and data domain knowledge. Once built, the dashboard may be as elaborate as needed; however, it commonly resides only on one page. As a result, the local and global sub-frames introduced above may in this case take on a different extent, in which local would relate only to perceptions and comprehensions specific to a single visualization, whereby a global would relate to a complete dashboard from the entire page. Such perceptions will synchronously drive the “data discovery frame”, following the same initial, transitional, and conclusive dynamics as in the case of the scientific system.
Notebook style environment: Simply put, in the case of notebooks, perceptions and comprehensions are built sequentially, following a programmatically chronological order (i.e., from loading the libraries and data, to data restructuring and cleansing, and finally to visual exploration and sense making). However, this chronological order is commonly disrupted in practice due to new discoveries in the data that call for new batches of code considering different analytical techniques, data variables, and data visualizations. Hence, if we try to apply a concept of local and global sub-frames to a notebook-style environment, the local dimension becomes more intricate and multi-dimensional. Namely, the local dimension would reflect on both programming and data visualization, due to their tight dependencies, and on every single instance of it. All instances would form a “data discovery frame”. Only after all those instances are carried out would global perceptions and comprehensions take place, ultimately leading to sense making and knowledge discovery.

3.5. Data Reporting

The reporting stage is the concluding stage in a data-driven sense-making and knowledge discovery process. This stage considers the presentation and communication of derived insights to different types of audiences. The importance of this stage stems from the need to ensure transparency and trustworthiness of communicated facts and knowledge [52]. Given that such information should inform the often non-technical stakeholders about a given issue and a possible course of action for remediation, the means of public diffusion of scientific knowledge should be able to bridge the gap between science and the public understanding and acceptance of scientific facts. Oftentimes, this is done through storytelling, supporting systematic visual dialogue, incremental information processing, and avoiding cognitive strain. In the case of both the scientific system and notebooks, this is done outside of the system application. Specifically, selected visualizations stemming from the data exploration and modeling phase are exported as individual imagery, which are then assembled in a desired software tool. It should be noted, however, that the resulting imagery in both cases are a static derivative of the original interactive visualization. In contrast, commercial systems generally support interactive storytelling in which a compelling sequential narrative displaying selected contextual visualizations can be created.
The report stage is recognized as a final fragment of the “sense making loop” suggested by Pirolli and Card [35]. As the communication during reporting stage may reflect on different contextual challenges (i.e., communicating assumptions made during analysis, communicating final findings of the analysis), an additional cognitive frame pertaining to “contextual communication” should be introduced. Such a frame would primarily consider the target audience (e.g., domain experts, non-professionals) and the type of information to be communicated. In turn, this would govern the level and amount of detail and supporting information within a data visualization; along the way, the encoding of data attributes (i.e., colors, size, and type of graph) as visual elements is carried out.

4. Discussion

During all investigated stages of a data science workflow (i.e., discover, integrate, profile, model, and report) users tend to construct a number of mental models respective of the subtasks that the principal stage entails. Specific to the stage itself, these subtasks and their respective mental models may either be analogous across different visualization systems (as suggested in this study), or may significantly differ across the considered systems. In this section we aim to provide a synthesis across all investigated stages of a data science workflow and the used visualization systems, rather than looking at each of these systems independently, as in the section above.
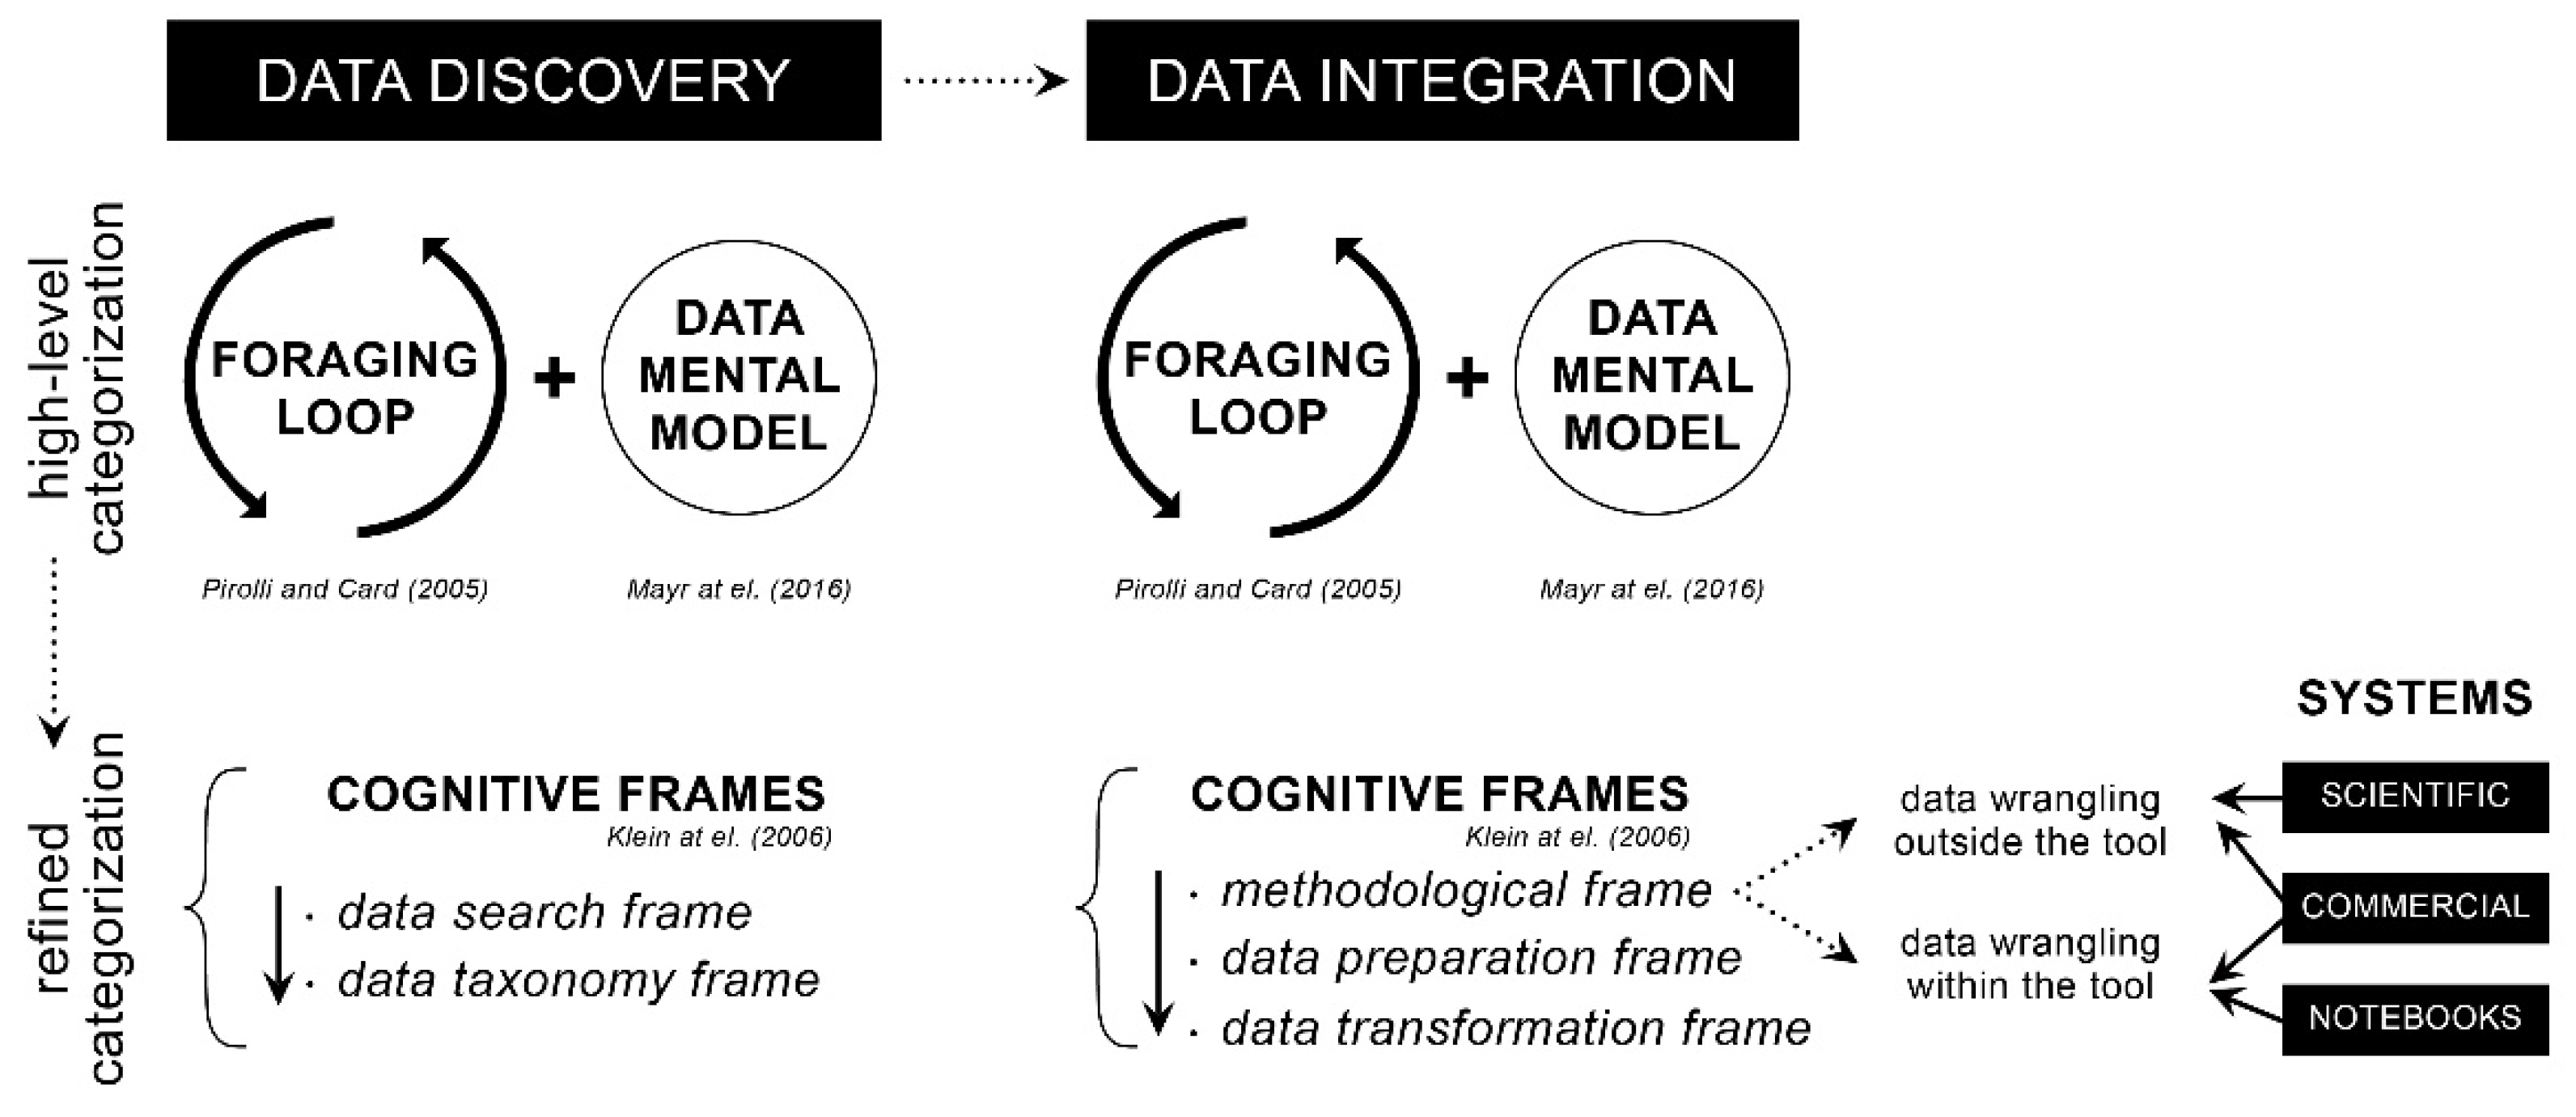
The two initial stages—discover and integrate—appear to be generally comparable across deployed systems, whereby both stages can be placed within a “foraging loop” [35] and are found to be integral to a “data mental model” [33], when observed on a higher level. However, in practice, central to these stages are a number of subtasks that require different strands of thinking, reasoning, and discovery, and thus require a more refined categorization. Figure 10 illustrates these higher and the suggested refined levels of categorization for both data discovery and data integration stages. In this figure, we can observe how these stages may be interpreted within the existing theoretical frameworks and related research, and how these may be further mediated by additional cognitive processes, dubbed “cognitive frames” as per [36], and their respective mental models. These respective mental models follow a linear progression due to their portrayal of tasks with a logical subsequent execution.
Looking at the data profiling stage, the objective is generally the same—understanding the nature of the data and resolving any potential deficiencies. On a higher level, this stage is classified as the initial phase of the “sense making loop” [35] and is further associated with all three mental models from [33]—tool, data, and problem. However, it was found that the intermediate mental models related to the subtasks depend in part on the logical, temporal, and hierarchical progression of the cognitive needs and processes given the data problem (e.g., missing or error values, gaps in timestamp, etc.), but also given the organizational structure and unique features of different visualization systems. Such properties are found to affect the complexity under which a data problem or a data anomaly is detected and are likely to impact the user’s efficiency towards an effective resolution. Hence, the resulting mental models appear more intricate in those systems where a user is tasked with building and organizing his or her own analytical environment (i.e., commercial system, notebooks), as seen in Figure 11. In this case, a more circular process is observed, where subtasks and respective mental models are highly iterative due to their interlinked nature.
We proceed to the most perception- and cognition-intensive phase, which is the data modeling stage. This stage represents the core of the “sense making loop” [35]. As in the profiling stage, the association with all three mental models from [33]—tool, data, and problem—is observed. On a refined level, the most prominent mental models relate to the “functional frame” and the “data discovery frame”, which further trigger initial, transitional, and conclusive cognitive comprehension of data. The first two phases of comprehension (initial and transitional) are in a constant flux and evolve with any new visual/cognitive impulse originating from external representations, while the conclusive phase results from the ultimate comprehension of the entire system and its data, eventually leading to sense making and knowledge generation. What differs across systems is the way that these manifest during data exploration and modeling. This is due to the intricacy of the data modeling stage, which is strongly driven by the organizational structure of the selected systems, further driving local and global cognitive sub-frames, as discussed in the previous section. In the case of scientific and commercial types of systems, the resulting cognitive perceptions and activities are driven by the way in which a human mind cognitively organizes simultaneous stimuli arising from multiple interlinked and responsive visualizations, their integral interactivity features (i.e., zooming, filtering, and refocusing), and diverse data dimensions and data features (i.e., position, size, color, shape). In case of selected notebook environment, the resulting cognitive perceptions and activities are driven by its inherent programmatic approach and the need to execute a number of batches of code of differing functions (data loading, data restructuring and cleansing, generation of data visualizations). Figure 12 illustrates these convoluted relationships.
The final stage of a “sense making loop” is the reporting to the external audience. Here, a distinct cognitive frame of “contextual communication” accounts for specifics that govern the visual and contextual nature of communicated knowledge. Such a cognitive frame generally applies to all systems under study. What differs across systems is the communication medium. In scientific system and notebook environments, this is a static derivative of the original interactive visualization, whereby the commercial system supports interactive storytelling.

5. Conclusions

In this paper, we introduced a number of relevant theories and studies regarding sense making and knowledge generation and offered our own perspectives on those processes applied to a visual analytics domain. Specifically, we observed our daily workflows and elaborated on possible ways in which analysts may build up knowledge and make sense of the visual system and the data. In particular, we tried to explain how such external representations and associated features and tasks might shape an analyst’s internal representations, commonly referred to as mental models, while interacting with different visual systems and related environments. In general, our aim was to contribute to the existing body of knowledge on formation of mental models and visual reasoning, while equally initiating a new discourse on task-specific refinements.
We suggested a number of respective cognitive phases that helped address the evolution of thought and reason by following the essential stages of a data science workflow. Such an approach has not been considered before. In this, we focused on crucial intermediate steps that happen in each of the stages, rather than providing some high-level differentiations. We found that each of these steps triggered a distinct mental model. Some of the mental models are more routine driven, becoming more of a constant in an analyst’s workflow, such as the data discovery stage. Others appear to be more thought provoking. Furthermore, these models may be reorganized once a system with a different internal structure is deployed. As expected, the most dynamic restructuring happened during the data exploration phase, which was equally found to be the most perception- and cognition-intensive phase. Altogether, our observations further corroborated the nature of relationships between mental models and external visualizations being highly fluid and constantly evolving, as discussed in existing literature.
Our study focused on time series data originating from the climate domain. We feel that this may in part influence the formation of mental models for some of the cognitive phases introduced in this paper. Especially relevant may be the type of the data (e.g., numerical, categorical) and the domain to which data belongs, as this would influence the search for applicable features and behavior within a data exploration phase, along the interaction with different data visualizations appropriate for depicting that particular data type. Hence, in our future efforts, we plan to expand our research to other domains towards a more comprehensive analysis.

Author Contributions

Conceptualization, M.V. and J.S.; Methodology, M.V. and J.S.; Software, M.V.; Validation, M.V.; Formal analysis, M.V. and J.S.; Investigation, M.V. and J.S.; Resources, M.V.; Data curation, M.V.; Writing—original draft preparation, M.V.; Writing—review and editing, M.V. and J.S.; Visualization, M.V. All authors have read and agreed to the published version of the manuscript.

Funding

This research received no external funding.

Institutional Review Board Statement

Not applicable.

Informed Consent Statement

Not applicable.

Data Availability Statement

Data used in this research are a part of open data initiatives of Austria. Publicly archived datasets may be found at the following links: http://at-wetter.tk/ (accessed on 3 May 2022); https://www.data.gv.at/ (accessed on 3 May 2022).

Acknowledgments

VRVis is funded by BMK, BMDW, Styria, SFG (Steirische Wirtschaftsförderungsgesellschaft m.b.H. SFG) and Vienna Business Agency in the scope of COMET—Competence Centers for Excellent Technologies (879730), which is managed by FFG (Österreichische Forschungsförderungsgesellschaft).

Conflicts of Interest

The authors declare no conflict of interest.

References

  1. Anouncia, S.M.; Gohel, H.A.; Subbiah, V. Data Visualization: Trends and Challenges toward Multidisciplinary Perception, 1st ed.; Springer: Singapore, 2020; p. 179. [Google Scholar]
  2. Qin, X.; Luo, Y.; Tang, N.; Li, G. Making data visualization more efficient and effective: A survey. VLDB J. 2020, 29, 93–117. [Google Scholar] [CrossRef]
  3. Ware, C. Information Visualization: Perception for Design; Morgan Kaufmann: San Francisco, CA, USA, 2000. [Google Scholar]
  4. Patterson, R.E.; Blaha, L.M.; Grinstein, G.G.; Liggett, K.K.; Kaveney, D.E.; Sheldon, K.C.; Havig, P.R.; Moore, J.A. A human cognition framework for information visualization. Comput. Graph. 2014, 42, 42–58. [Google Scholar] [CrossRef]
  5. Potter, M.C.; Wyble, B.; Hagmann, C.E.; McCourt, E.S. Detecting meaning in RSVP at 13 ms per picture. Atten. Percept. Psychophys. 2014, 76, 270–279. [Google Scholar] [CrossRef] [PubMed] [Green Version]
  6. Few, S. Data Visualization for Human Perception. In The Encyclopedia of Human-Computer Interaction, 2nd ed.; Soegaard, M., Dam, R.F., Eds.; Interaction Design Foundation: Aarhus, Denmark, 2014. [Google Scholar]
  7. Tran, P.V.; Truong, L.X. Approaching human vision perception to designing visual graph in data visualization. Concurr. Comput. Pract. Exp. 2021, 33, e5722. [Google Scholar] [CrossRef]
  8. Fisher, B.; Green, T.M.; Arias-Hernández, R. Visual analytics as a translational cognitive science. Top. Cogn. Sci. 2011, 3, 609–625. [Google Scholar] [CrossRef] [PubMed]
  9. Green, T.M.; Ribarsky, W.; Fisher, B. Building and Applying a Human Cognition Model for Visual Analytics. Inf. Vis. 2009, 8, 1–13. [Google Scholar] [CrossRef] [Green Version]
  10. Sedig, K.; Parsons, P. Interaction Design for Complex Cognitive Activities with Visual Representations: A Pattern-Based Approach. AIS Trans. Hum. Comput. Interact. 2013, 5, 84–133. [Google Scholar] [CrossRef] [Green Version]
  11. Ward, M.; Grinstein, G.; Keim, D. Interactive Data Visualization: Foundations, Techniques, and Applications, 2nd ed.; A.K Peters, Ltd./CRC Press: Natick, MA, USA, 2015. [Google Scholar]
  12. Elmqvist, N.; Vande Moere, A.; Jetter, H.-C.; Cernea, D.; Reiterer, H.; Jankun-Kelly, T.J. Fluid interaction for information visualization. Inf. Vis. 2011, 10, 327–340. [Google Scholar] [CrossRef]
  13. Pike, W.A.; Stasko, J.T.; Chang, R.; O’Connell, T. The Science of Interaction. Inf. Vis. 2009, 8, 263–274. [Google Scholar] [CrossRef]
  14. Keim, D.; Kohlhammer, J.; Ellis, G.; Mansmann, F. Mastering the Information Age: Solving Problems with Visual Analytics; 436 Eurographics Association: Goslar, Germany, 2010; ISBN 978-3-905673-77-7. [Google Scholar]
  15. Cui, W. Visual Analytics: A Comprehensive Overview. IEEE Access 2019, 7, 81555–81573. [Google Scholar] [CrossRef]
  16. Keim, D.; Andrienko, G.; Fekete, J.-D.; Görg, C.; Kohlhammer, J.; Melançon, G. Visual Analytics: Definition, Process, and Challenges. In Information Visualization-Human-Centered Issues and Perspectives, 1st ed.; Kerren, A., Stasko, J.T., Fekete, J.-D., North, C., Eds.; Springer: Berlin/Heidelberg, Germany, 2008; pp. 154–175. [Google Scholar]
  17. Keim, D.A.; Mansmann, F.; Schneidewind, J.; Thomas, J.; Ziegler, H. Visual Analytics: Scope and Challenges. In Visual Data Mining; Simoff, S.J., Böhlen, M.H., Mazeika, A., Eds.; Springer: Berlin/Heidelberg, Germany, 2008; pp. 76–90. [Google Scholar]
  18. Sedig, K.; Parsons, P.; Dittmer, M.; Haworth, R. Human-Centered Interactivity of Visualization Tools: Micro- and Macro-level Considerations. In Handbook of Human Centric Visualization; Huang, W., Ed.; Springer: New York, NY, USA, 2014; pp. 717–743. [Google Scholar]
  19. Parsons, P.; Sedig, K. Adjustable Properties of Visual Representations: Improving the Quality of Human-Information Interaction. J. Assoc. Inf. Sci. Technol. 2014, 65, 455–482. [Google Scholar] [CrossRef]
  20. Skarbez, R.; Polys, N.F.; Ogle, J.T.; North, C.; Bowman, D.A. Immersive Analytics: Theory and Research Agenda. Front. Robot. AI 2019, 6, 82. [Google Scholar] [CrossRef] [PubMed] [Green Version]
  21. Funke, J. Complex problem solving: A case for complex cognition? Cogn. Process. 2010, 11, 133–142. [Google Scholar] [CrossRef] [Green Version]
  22. Liu, Z.; Stasko, J.T. Mental Models, Visual Reasoning and Interaction in Information Visualization: A Top-down Perspective. IEEE Trans. Vis. Comput. Graph. 2010, 16, 999–1008. [Google Scholar] [CrossRef] [Green Version]
  23. Sedig, K.; Parsons, P.; Liang, H.-N.; Morey, J. Supporting Sensemaking of Complex Objects with Visualizations: Visibility and Complementarity of Interactions. Informatics 2016, 3, 20. [Google Scholar] [CrossRef] [Green Version]
  24. Kirsh, D. Interaction, External Representation and Sense Making. In Proceedings of the 31st Annual Conference of the Cognitive Science Society, Amsterdam, The Netherlands, 29 July–1 August 2009; pp. 1103–1108. [Google Scholar]
  25. Scaife, M.; Rogers, Y. External cognition: How do graphical representations work? Int. J. Hum. Comput. Stud. 1996, 45, 185–213. [Google Scholar] [CrossRef] [Green Version]
  26. Hutchins, E. Cognition, Distributed. In International Encyclopedia of the Social & Behavioral Sciences; Elsevier Science: Amsterdam, The Netherlands, 2001; pp. 2068–2072. [Google Scholar]
  27. Wilkinson, L. Statistics and Computing: The Grammar of Graphics, 2nd ed.; Springer: New York, NY, USA, 2005. [Google Scholar]
  28. Downes, E.J.; McMillan, S.J. Defining Interactivity: A Qualitative Identification of Key Dimensions. New Media Soc. 2000, 2, 157–179. [Google Scholar] [CrossRef]
  29. Spence, J.W.; Tsai, R.J. On human cognition and the design of information systems. Inf. Manag. 1997, 32, 65–73. [Google Scholar] [CrossRef]
  30. Nazemi, K.; Stab, C.; Kuijper, A. A Reference Model for Adaptive Visualization Systems. In Human-Computer Interaction. Design and Development Approaches; HCI 2011; Lecture Notes in Computer Science 6761; Jacko, J.A., Ed.; Springer: Berlin/Heidelberg, Germany, 2011. [Google Scholar] [CrossRef]
  31. Tan, D.; Nijholt, A. (Eds.) Brain-Computer Interfaces and Human-Computer Interaction. In Brain-Computer Interfaces; Human-Computer Interaction Series; Springer: London, UK, 2010. [Google Scholar] [CrossRef]
  32. Nardi, B.A.; Zarmer, C.L. Beyond models and metaphors: Visual formalisms in user interface design. J. Vis. Lang. Comput. 1993, 4, 5–33. [Google Scholar] [CrossRef] [Green Version]
  33. Mayr, E.; Schreder, G.; Smuc, M.; Windhager, F. Looking at the Representations in our Mind. Measuring Mental Models of Information Visualizations. In Proceedings of the BELIV ′16: Sixth Workshop on Beyond Time and Errors on Novel Evaluation Methods for Visualization, Baltimore, MD, USA, 24 October 2016. [Google Scholar]
  34. Weick, K.E. Sensemaking in Organizations; SAGE Publications, Inc.: New York, NY, USA, 1995; Volume 3, p. 248. [Google Scholar]
  35. Pirolli, P.; Card, S. The Sensemaking Process and Leverage Points for Analyst Technology as Identified through Cognitive Task Analysis. In Proceedings of the International Conference on Intelligence Analysis, Atlanta, GA, USA, 2–4 May 2005. [Google Scholar]
  36. Klein, G.; Phillips, J.K.; Rall, E.L.; Peluso, D.A. A data-frame theory of sensemaking. In Expertise Out of Context: Proceedings of the 6th International Conference on Naturalistic Decision Making, London, UK, 23–26 June 2006; Lawrence Erlbaum Associates Publishers: Mahwah, NJ, USA, 2006. [Google Scholar]
  37. Knauff, M.; Wolf, A.G. Complex cognition: The science of human reasoning, problem-solving, and decision-making. Cogn. Process. 2010, 11, 99–102. [Google Scholar] [CrossRef]
  38. Schmid, U.; Ragni, M.; Gonzalez, C.; Funke, J. The challenge of complexity for cognitive systems. Cogn. Syst. Res. 2011, 12, 211–218. [Google Scholar] [CrossRef] [Green Version]
  39. Vuckovic, M.; Schmidt, J. Visual Analytics Approach to Comprehensive Meteorological Time-Series Analysis. Data 2020, 5, 94. [Google Scholar] [CrossRef]
  40. Vuckovic, M.; Schmidt, J.; Ortner, T.; Cornel, D. Combining 2D and 3D Visualization with Visual Analytics in the Environmental Domain. Information 2022, 13, 7. [Google Scholar] [CrossRef]
  41. Microsoft Power BI. 2022. Available online: https://powerbi.microsoft.com/en-au/ (accessed on 3 May 2022).
  42. Jypiter Nootebook. 2022. Available online: https://jupyter.org/ (accessed on 3 May 2022).
  43. Güss, C.D. What Is Going Through Your Mind? Thinking Aloud as a Method in Cross-Cultural Psychology. Front. Psychol. 2018, 9, 1292. [Google Scholar] [CrossRef] [Green Version]
  44. Ericsson, K.A. Protocol Analysis and Expert Thought: Concurrent Verbalizations of Thinking during Experts’ Performance on Representative Tasks. In The Cambridge Handbook of Expertise and Expert Performance; Ericsson, K., Charness, N., Feltovich, P., Hoffman, R., Eds.; Cambridge University Press: Cambridge, UK, 2006. [Google Scholar] [CrossRef] [Green Version]
  45. Vuckovic, M.; Schmidt, J. Visual Analytics for Climate Change Detection in Meteorological Time-Series. Forecasting 2021, 3, 276–289. [Google Scholar] [CrossRef]
  46. Kandel, S.; Paepcke, A.; Hellerstein, J.M.; Heer, J. Enterprise Data Analysis and Visualization: An Interview Study. IEEE Trans. Vis. Comput. Graph. 2012, 18, 2917–2926. [Google Scholar] [CrossRef] [PubMed] [Green Version]
  47. Microsoft Excel. 2022. Available online: https://www.microsoft.com/en-ww/microsoft-365/excel (accessed on 3 May 2022).
  48. Kandel, S.; Paepcke, A.; Hellerstein, J.M.; Heer, J. Wrangler: Interactive visual specification of data transformation scripts. In Proceedings of the SIGCHI Conference on Human Factors in Computing Systems, CHI ′11, Vancouver, CO, Canada, 7–12 May 2011. [Google Scholar]
  49. Rock, I.; Palmer, S. The Legacy of Gestalt Psychology. Sci. Am. 1990, 263, 84–91. [Google Scholar] [CrossRef] [PubMed]
  50. Wertheimer, M. A Gestalt Perspective on the Psychology of Thinking. In Towards a Theory of Thinking On Thinking; Glatzeder, B., Goel, V., Müller, A., Eds.; Springer: Berlin/Heidelberg, Germany, 2010. [Google Scholar] [CrossRef]
  51. Sedig, K.; Liang, H.-N. Interactivity of visual mathematical representations: Factors affecting learning and cognitive processes. J. Interact. Learn. Res. 2006, 17, 179–212. [Google Scholar]
  52. Sanchez-Mora, M.C. Towards a taxonomy for public communication of science activities. J. Sci. Commun. 2016, 15, Y01. [Google Scholar] [CrossRef]
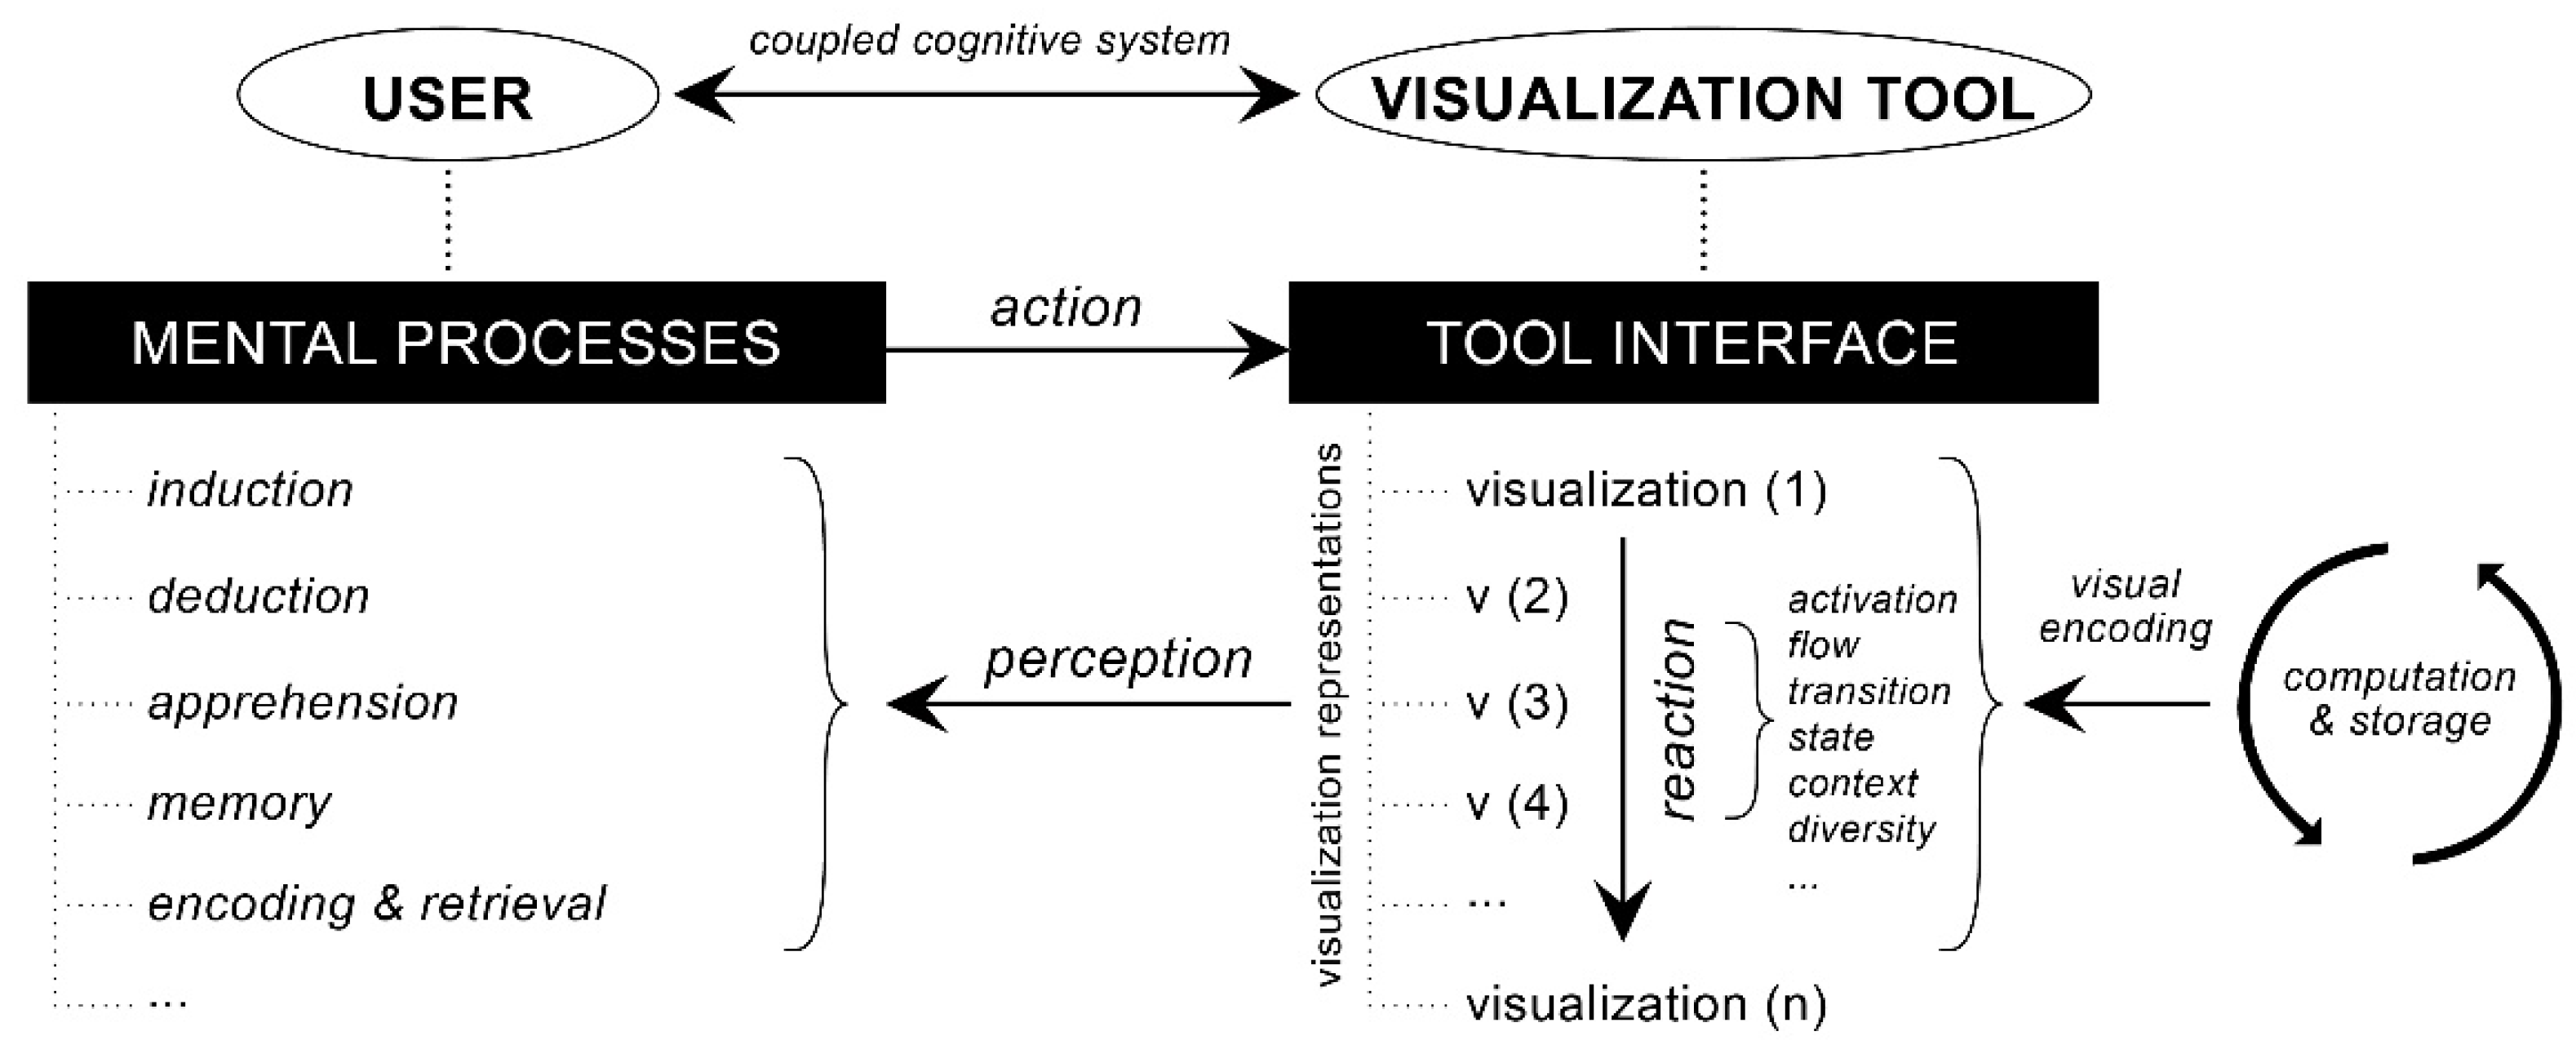
Figure 1. A schematic representation of a dynamic coupled cognitive system that is formed between a user and a visualization tool (adapted from Sedig et al. [14]).
Analytics 01 00008 g001
Figure 2. A schematic representation of an extended dynamic coupled cognitive system, where the formation of mental models is triggered.
Analytics 01 00008 g002
Figure 3. A schematic representation of observed correlations and overlapping aspects between discussed theoretical theories regarding sense making and knowledge generation [35,36].
Analytics 01 00008 g003
Figure 4. Illustration of a predefined (i.e., fixed) analytical dashboard structure with embedded interlinked analytical visual modules (e.g., horizon graphs, a line chart, a heatmap) as given in the selected scientific VA system. Black rectangle marks the available analytical cockpits attentively tailored to support diverse analytical tasks (e.g., trend analysis, pattern search, quality check).
Analytics 01 00008 g004
Figure 5. Illustration of a “blank canvas” dashboard structure as given in the selected commercial VA system. Black rectangles mark the available visualizations that users may drag and drop onto the canvas, along their suggested placement on the canvas. On the far right, we may see the list of available data items stemming from the imported dataset, which can be assigned to the selected visualization (i.e., a chart, a graph).
Analytics 01 00008 g005
Figure 6. Illustration of a notebook style environment where an example of a narrative approach to data visualization and analysis may be observed: importing the desired libraries, a Python code for loading a dataset, along an inline visualization for plotting a time series data.
Analytics 01 00008 g006
Figure 7. A schematic representation of the adopted approach to conceptualization of mental models towards sense making and knowledge generation [22,33].
Analytics 01 00008 g007
Figure 8. Illustration of the analytical cockpit for data structure and quality check as given in the scientific system: upper panel illustrates the conditions for which potential problem detections are carried out; lower panel provides a time series view with highlighted missing data (red stripes) and outliers (purple points) recognized in the data. Other conditions can be selected from the upper panel (e.g., duplicate entries, trends, value changes), which would then be visualized in the time series view.
Analytics 01 00008 g008
Figure 9. Illustration of the custom dashboard built in a commercial system with data visualizations that portray data structure (e.g., temporal distribution, frequency of values) and quality features (e.g., missing values).
Analytics 01 00008 g009
Figure 10. A schematic representation of higher and refined levels of categorization for data discovery and data integration stages, following the established theories in sense making, related research, and the need for amendments [33,35].
Analytics 01 00008 g010
Figure 11. A schematic representation of higher and refined levels of categorization for the data profiling stage, following the established theories in sense making, related research, and the need for amendments. In the case of the refined levels of categorization, the phases marked in bold in the commercial system and notebooks pertain to additional mental models that are triggered by the organizational structure and features of these systems [33,35].
Analytics 01 00008 g011
Figure 12. A schematic representation of higher and refined levels of categorization for data modeling stage, following the established theories in sense making, related research, and the need for amendments. In case of the refined levels of categorization, we can observe different approaches to sense making and knowledge discovery as triggered by individual visuals representations (v(1)…(n)), entire interactive dashboards, or a narrative, given the distinct visualization system used and its inherent organizational structure [33,35].
Analytics 01 00008 g012
Publisher’s Note: MDPI stays neutral with regard to jurisdictional claims in published maps and institutional affiliations.