1. Introduction
Virtual reality (VR) is the computer-generated simulation of a three-dimensional image or environment that can be interacted with in a seemingly real or physical way. Over the past century, technology and the way it is used by consumers has rapidly evolved and has become more prevalent as technology advances. The first widely known experiments using head-mounted displays were conducted by Ivan Sutherland and showed participants different software based on the direction of the gaze [
1]. Now, VR has adapted to the fast-growing world to bring forth modern innovations, including more portable forms of VR and augmented reality glasses that allow for interfacing the digital and physical worlds. Studies have demonstrated a correlation between visual stimuli and related audio cues to enhance learning [
2,
3]. Utilizing VR in the classroom provides both visual and auditory cues to potentially provide enhanced value for learning [
4,
5].
Aside from the vast uses of VR in the entertainment and gaming industry, the development of VR has proven efficient in education and occupational training [
4,
5,
6,
7]. The once novel concept of flight simulation is now standard in aviation training globally, with increased safety and decreased costs [
8]. VR has also been implemented in military stress management training programs to decrease levels of perceived stress among soldiers [
9]. Healthcare has also played a key role in demonstrating the benefits of integrating VR with teaching and practicing. Orthopedic surgeons can improve their technical skills, and medical students can improve their anatomy interest and test scores [
10,
11]. The benefits of VR in an educational setting stretch beyond performance and exam scores. University students using immersive versus desktop VR had significantly higher scores in terms of presence and motivation, which fall outside of strictly objective measurements [
12,
13,
14]. VR usage in the classroom has been associated with increased student engagement. While there is still work to be done in terms of the exact mechanisms behind this finding, the engagement model includes cognitive, behavioral, and affective means, all of which previous studies have demonstrated are impacted when VR is used in education [
15,
16,
17,
18]. Universities in multiple countries have started implementing VR in education, including 46% of universities in the USA and 96% in the UK [
15,
19,
20]. Multiple fields, including science, have shifted to using VR experiences in education, and even distance learning has been using VR for years [
17,
18].
Positive student outcomes rely heavily on the amount and quality of participation in the classroom setting. Few concepts are as emphasized as student engagement in discussions surrounding improving student test scores and classroom experiences [
19,
20,
21]. Recent studies surrounding electronic learning demonstrate the direct correlation between test grades and the amount of interaction that a student has with the class [
21]. As more studies demonstrate the importance of student engagement, it is necessary to investigate not only the quantity of engagement but also how the quality of engagement affects test scores [
11]. Students learn in a variety of ways, and the quality of learning can be a subjective measure. Education specialists debate how to universally measure this value, but there are several models becoming more accepted. Generally, educational practices that involve more senses produce longer-lasting and higher-quality working memories [
12]. VR has great potential to increase the quality of student education and improve test scores through multi-sensory immersive experience without leaving the classroom [
2,
3]. The sustainability of the VR experiences is greater than field trips, in addition to being more equitable, as not all students have the resources for extensive excursions that some field trips require.
One learning theory proposes four stages, altogether known as the learning cycle, where multisensory learning has been beneficial in the initial phase. These stages include gathering, reflection, creation, and active testing [
2,
3]. The gathering phase of learning was the focus of this study, using VR to increase the amount of stimulation through multisensory processing. Multisensory processing involves simultaneous signals from various sensory receptors [
2,
3]. These signals can be processed and interpreted into a signal event or combined in various ways to function as a single signal in a process known as multisensory integration [
2,
3]. The digital age has led to a significant increase in how people consume multisensory data, especially in the case of adolescents and young adults accustomed to constant multisensory processing [
2,
7,
22,
23]. The rise in the digital age and the consistent ability to access the internet has impacted these individuals by inundating them with stimuli. Although this instantaneous information available at their disposal has allowed for the formation of unique neural connections, it can lead to people of this age group being uninterested when experiences are under-stimulating [
2,
23,
24].
One valuable consideration is the pedagogical style used to help students learn, as well as its connection to VR. Previous studies have associated constructivist approaches with VR to further enhance learning [
24,
25,
26,
27]. Constructivist approaches lean heavily on the ability of students to make connections with the material they are learning and, through their experiences, integrate this new knowledge/material into their ever-growing body of knowledge. Luckily, in the present study, our approaches are constructivist in nature and lend themselves easily to VR use in higher education.
In the present study, we implemented VR experiences in a large introductory biology laboratory course at a public institution of higher education in the United States. We hypothesized that with VR experiences, students will be more engaged and perform better on assessments, partly through engaging multisensory learning. Our VR experiences used prepared materials that were freely available on the social media site YouTube (please see the
Section 2 Materials and Methods for additional information). We used 360-degree video, a form of virtual reality; many of the videos utilized were professionally produced (for example, by Discovery and National Geographic). Overall, 360-degree videos are shot with a special camera that immerses the viewer completely in a specific scene. The camera captures footage from all around, below, above, and from all angles. When the viewer consumes the 360-degree video, they typically wear a headset. When the viewer’s head is pointed in a specific direction, they are able to look around in various directions for an immersive experience. While 360-degree videos have limitations, specifically low interactivity, financial and logistical considerations of the course limited their use. This study introduces a cost-effective, low-risk means of using virtual experiences in education. Overall, by implementing VR experiences, we aim to enhance students’ attitudes, engagement, and performance in foundational biological sciences material.
2. Materials and Methods
2.1. School Details and Demographics
The University of South Carolina (UofSC) is a state-funded, public, four-year institution. The institution offers over 300 areas of study, including majors, minors, and areas of emphasis covering a plethora of humanities, sciences (life and social), math, and art-related fields; various certificate programs; and associate degrees, Bachelor of Arts, and Bachelor of Science degrees for numerous subjects for undergraduates. The school also features a thriving graduate program in many of the aforementioned subjects, offering various degrees, including master’s degrees and doctorate degrees. The UofSC system includes several professional schools, such as medical schools (including the School of Medicine, Columbia, SC, USA, and the School of Medicine, Greenville, SC, USA), law school (the UofSC School of Law), and a College of Pharmacy. The main campus is home to 35,364 total students, of which 26,753 are undergraduates (
Table 1). The largest major on campus is biological sciences, with 1801 students. The course that was analyzed is not only a part of the biological sciences curriculum for the degree but also an optional part of the Carolina Core (general education) component. Demographics of the university can be found at the following link, along with more details regarding the university as a whole:
https://sc.edu/about/offices_and_divisions/institutional_research_assessment_and_analytics/documents/institutional_effectiveness/ipeds_data_feedback_reports/columbia/2021.pdf (accessed on 1 April 2025).
2.2. Class Structure
Virtual reality (VR) was implemented in an introductory biology laboratory course (BIOL 102L) at the University of South Carolina. These labs typically meet once every week for two and a half hours, and the maximum capacity of each lab is 24 students. Covering a wide variety of topics, the course is taken by students ranging from first-year students to seniors (although most of the students are classified as first-year). Students must either be currently enrolled or have already completed the associated BIOL 102 lecture course to enroll in BIOL 102L. Students’ previous experience in biology varies widely, from high-achieving advanced placement students to students who may not have taken any biology courses in their secondary school career. Each year, we offer roughly 60 sections of BIOL 102L that are taught by the graduate students of the Department of Biological Sciences with a faculty member lab coordinator who trains the graduate student instructors, orders supplies, updates the curriculum, and handles all logistics of the implementation of the lab. For the semesters used in our study, Fall 2018 comprised 20 sections with a total of 471 students, Spring 2019 comprised 39 sections with a total of 900 students, Fall 2019 comprised 24 sections with a total of 540 students, and Spring 2020 comprised 39 sections with a total of 866 students.
2.3. Class Curriculum and Format
BIOL 102L includes a wide variety of biological topics. The program breaks up BIOL 101 and BIOL 102, the general principles of biological sciences, into two courses based on topics. BIOL 101 is typically based on cellular and molecular biology, while BIOL 102 focuses on evolutionary, ecological, organismal, basic anatomy, and physiological biology. BIOL 102L is not directly linked to the course (the material covered is up to the instructor for BIOL 102 and with a wide variety of instructors) but generally covers the same topics. We also include topics such as experimental design and science communication to ensure our students have a firm foundation of how science operates. Our lab is delivered as a flipped course, meaning that students are responsible for consuming and digesting material outside the lab (and take a low-stakes quiz before the lab session starts). Typically, each lab session begins with a short formative in-lab assessment to test students on the previous lab’s material, followed by a short lecture and discussion by the graduate student instructor. Finally, the students engage in the lab activities for the day (from designing and conducting various experiments to performing gallery walks of student work).
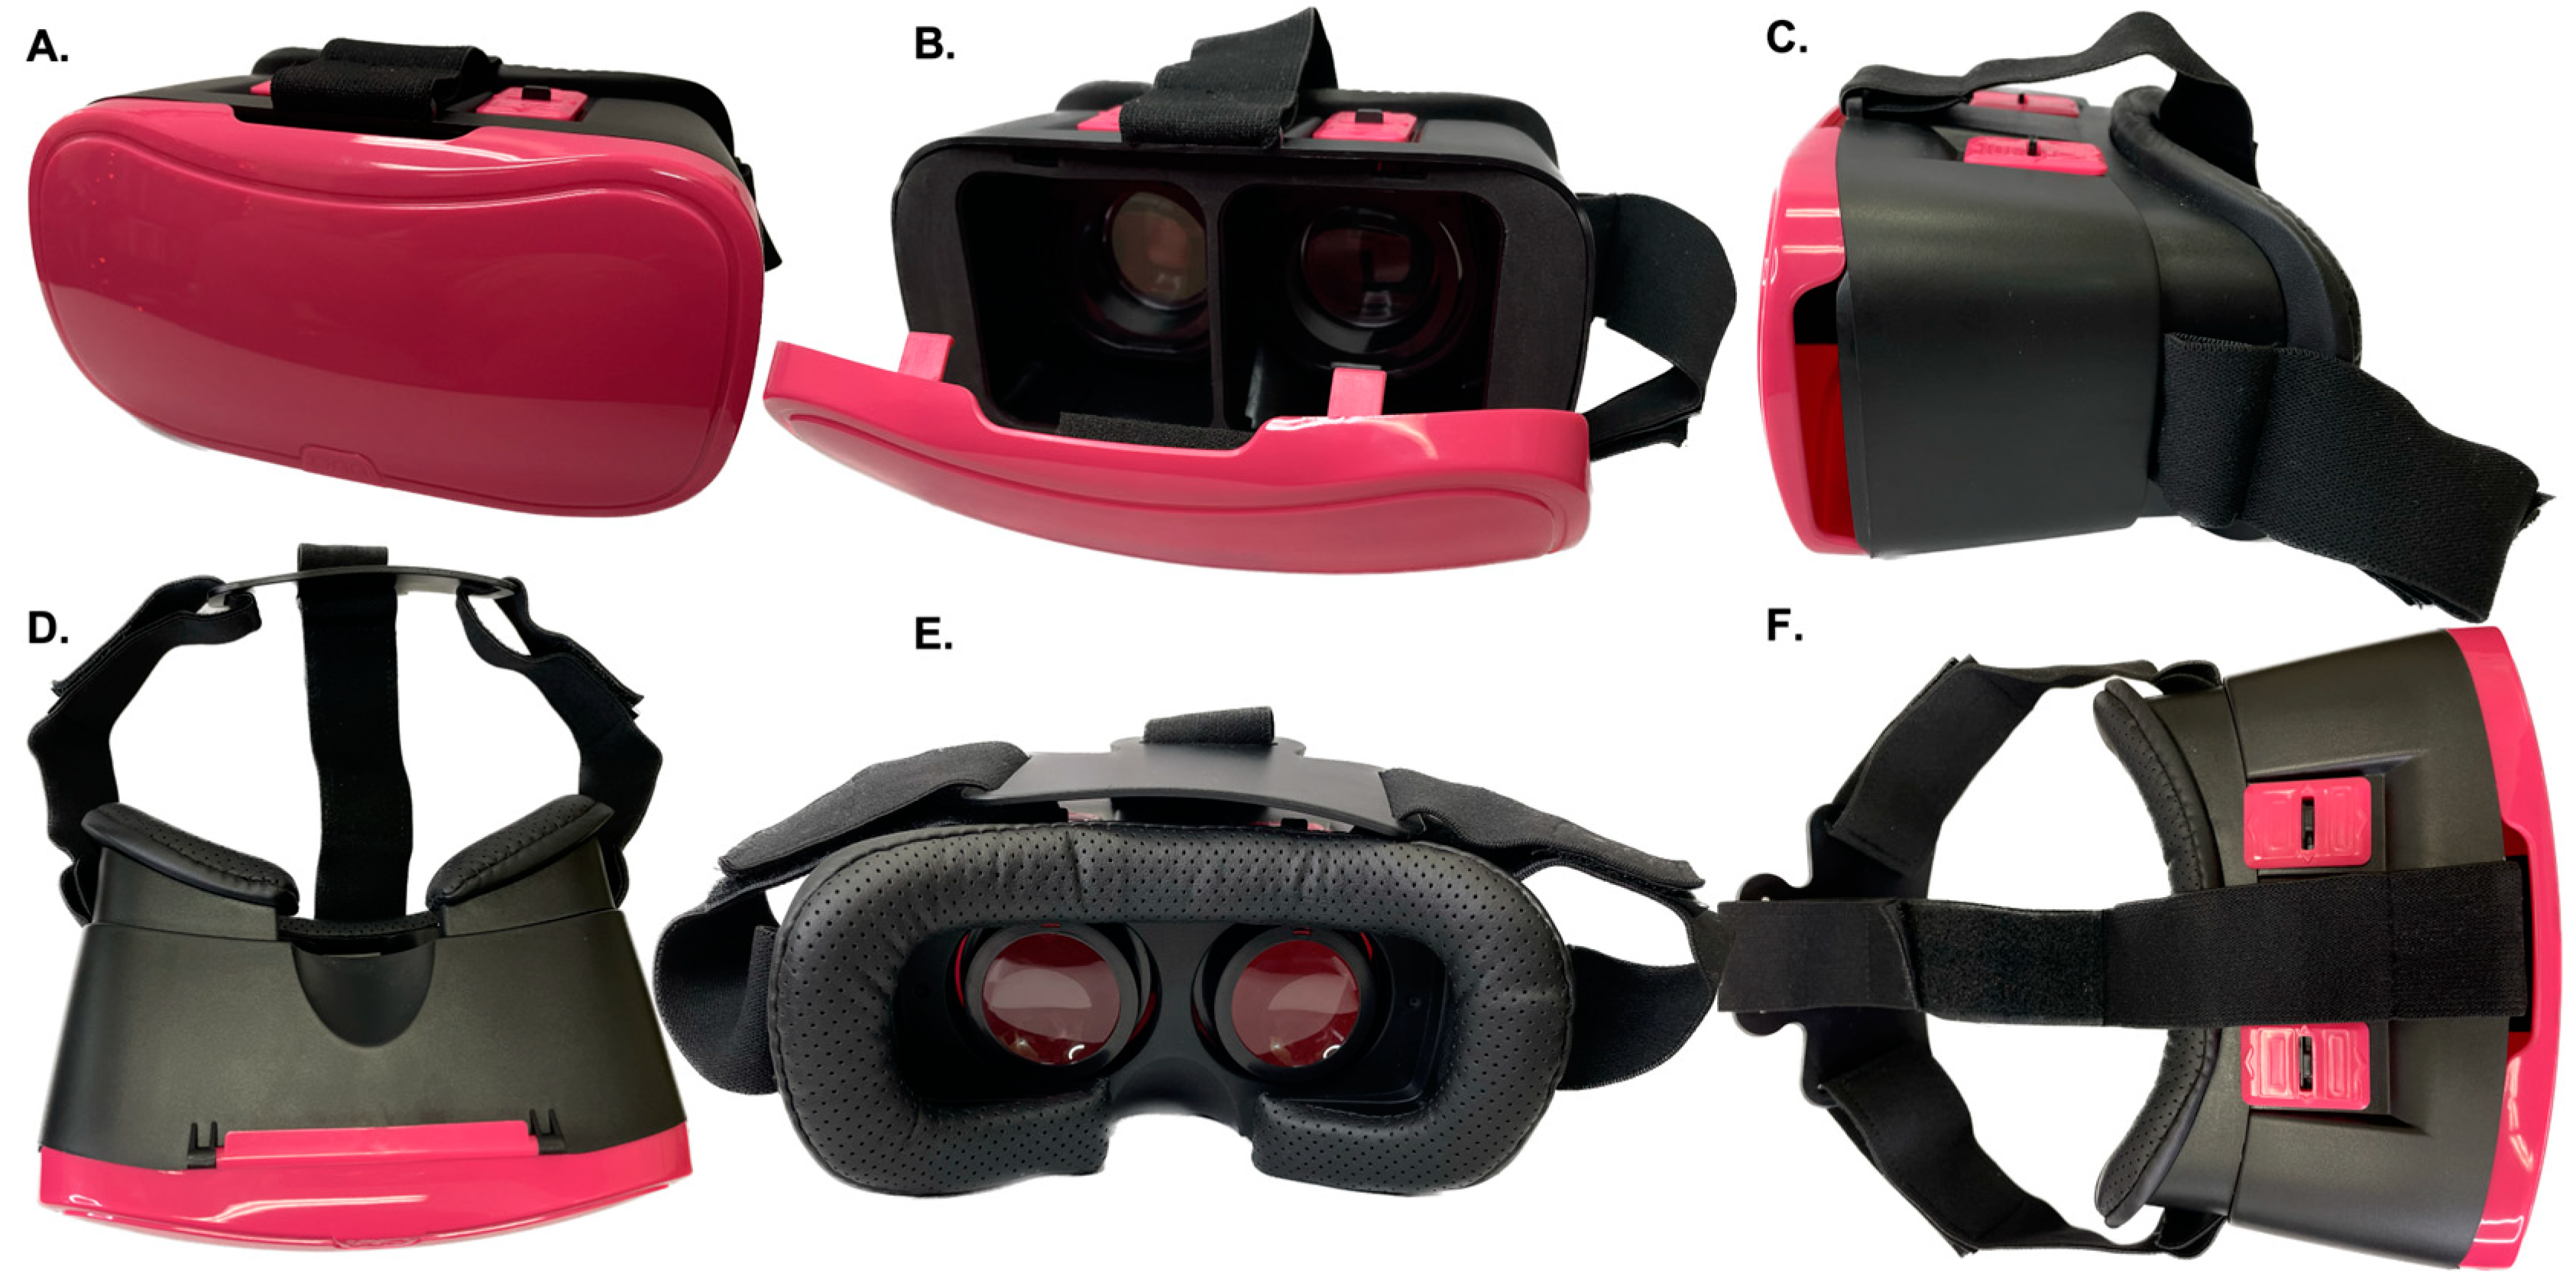
2.4. VR Headsets
Each student in the lab used a plastic VR headset in which they could insert their phone to view the VR experience (
Figure 1). We purchased and used the Onn Virtual Reality Smartphone headset. The headsets were purchased at a local store, transported, and distributed in a face-to-face physical lab on UofSC’s campus. A smartphone with the YouTube application installed was needed to be fully immersed in the VR experience. We also offered laptops to students who may not have had a smartphone. While the experience would not be as immersive, they could still consume the material in a 2D format like any regular video. During our test semesters with VR (Fall 2019 and Spring 2020), out of 1406 students, all students had or used a smartphone for VR. While the control semesters and study design could have split students into a test vs. control, we instead implemented them over entire semesters. While there may have been variation in students from semester to semester, the assessments and curriculum were exactly the same except for the implementation of 360-degree videos in the lab. Safety is another important aspect of using these headsets, and students were given a safety demonstration and required to remain seated while using the headsets. Students were spaced out at least 6 feet from one another and instructed to spend roughly 10 min per experience in the virtual realm. We instructed the participants to place the headsets on their heads and look forward first and, slowly, once they were comfortable, look around the 360-degree video. Motion sickness and issues surrounding VR were also mentioned before the experiences, and if students did not feel well while participating, they were instructed to remove the headset. After the experience, students talked with their peers regarding their 360-degree experiences.
2.5. VR Experiences
We selected specific 360-degree videos to be viewed by students in the lab with the Onn VR headsets. These were pre-made, often extremely high-quality videos available for free through YouTube. These videos were selected to supplement our curriculum and reinforce the topics we covered in lab that week. We selected videos focusing on topics that students had previously had issues engaging with, including biodiversity, evolutionary biology, and plants. It is important to note that each graduate student instructor was trained on how to use the Onn VR headsets and the amount of time allotted in each lab session for viewing VR experiences. Each session would introduce the topic, and before beginning the lab activities of the day, students would spend roughly 15 min with the VR experience while engaging with students physically close to them in the lab (so they are not just viewing the videos in isolation, but collaboratively with their peers). Below are the specific links to the 360-degree videos used in the lab:
2.6. Optional Survey
To assess student views and engagement with the VR experiences, we conducted an optional survey for each section. Using a standard Likert scale, we generated a Microsoft Form and encouraged students to complete the survey once per semester. As shown in the
Section 3 Results, we compiled these results to analyze the implementation of VR in BIOL 102L for the Fall 2019 and Spring 2020 semesters.
2.7. Student Performance and Statistical Analysis
To analyze student performance in the lab, we compared grades from four different semesters: Fall 2018 and Spring 2019 with no VR experience and Fall 2019 and Spring 2020 with VR experiences. Course grades, along with withdrawal data, were obtained through the publicly available data provided by the University of South Carolina Registrar’s office at the following link:
https://sc.edu/about/offices_and_divisions/registrar/toolbox/grade_processing/grade_spreads/index.php (accessed on 9 September 2021).
Student formative assessments were completed through the learning management system at the beginning of each lab session. These short quizzes were 10 questions long and covered main ideas from the previous lab session. All quizzes included a combination of multiple choice, short answer, true/false, and matching questions.
We also analyzed each individual assessment that was linked directly with VR experiences to assess if VR enhanced student engagement. Graphs and tables were constructed using R version 4.2.1 (“Funny-Looking Kid”), distributed under the terms of the GNU General Public License. R software is provided for free at
www.R-project.org (accessed on 1 April 2025). R-studio was used to create the plots, along with the ggplot2 and the ggprism theme [
28]. We conducted a Mann–Whitney U statistical analysis to determine if the differences from our VR and non-VR groups were statistically significant. R software was used to run these statistical analyses (accessed 1 April 2025).
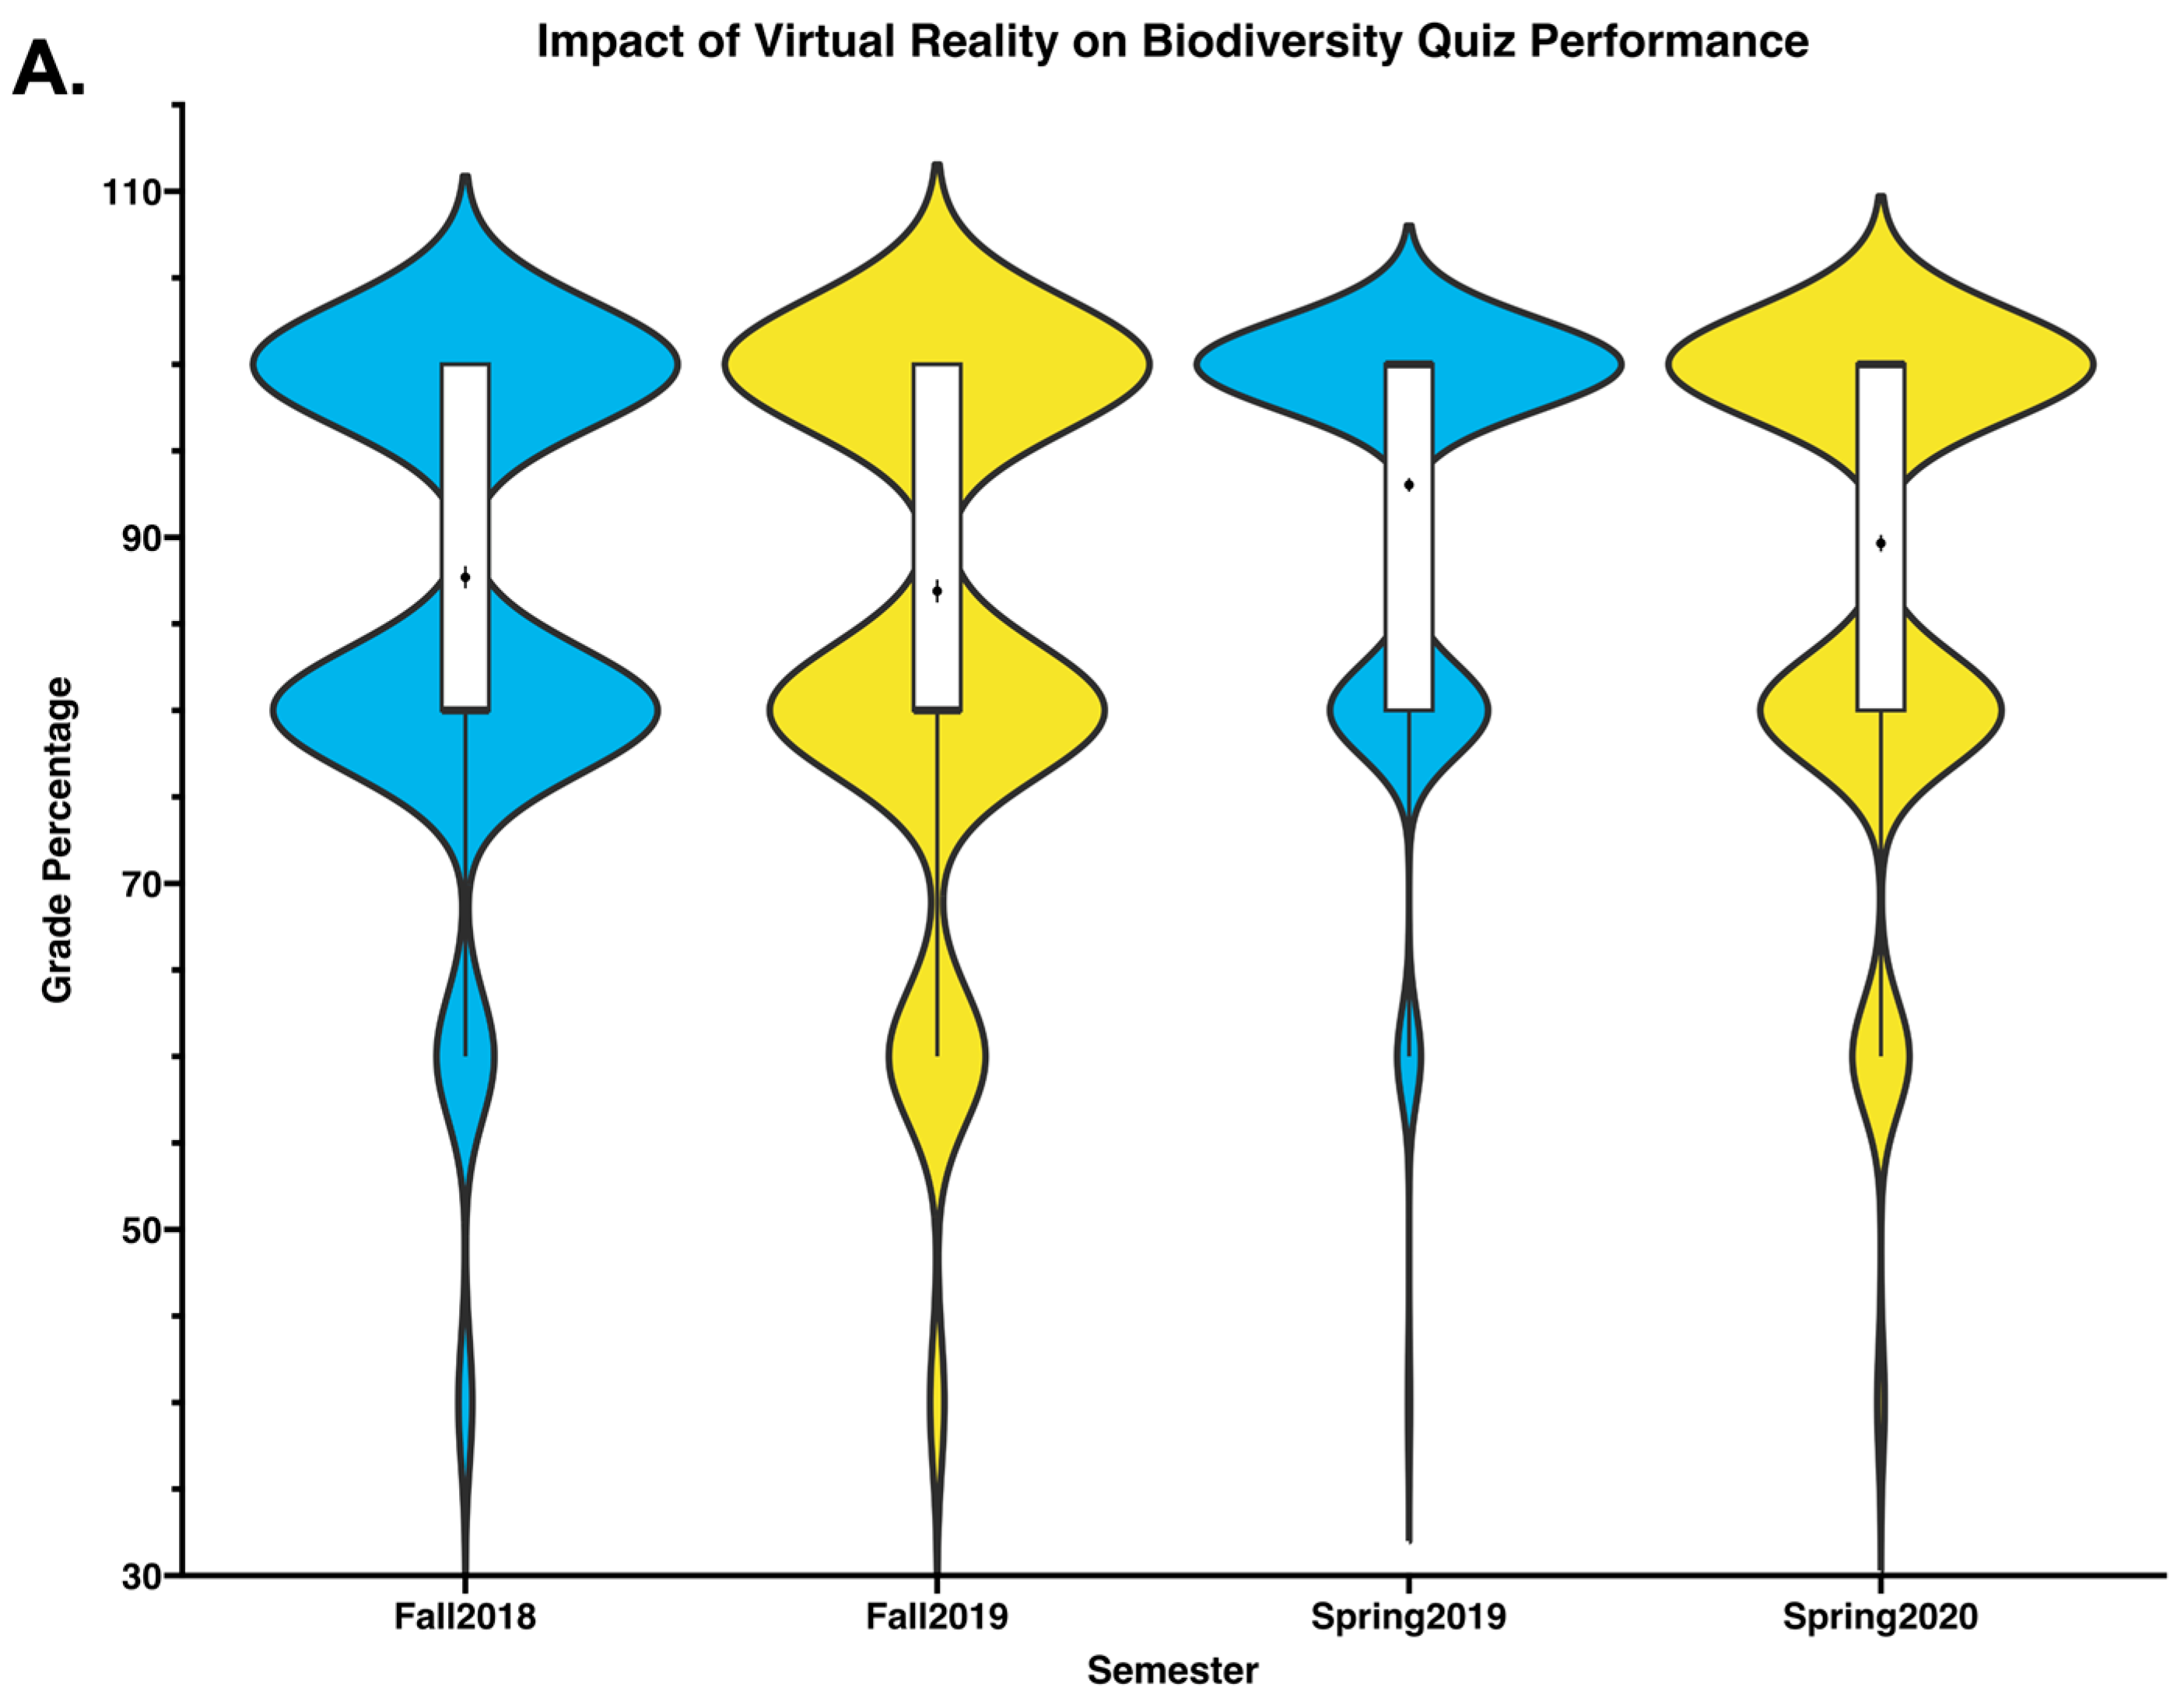
One plot type used to visualize the data of our study was the violin plot. This plot is useful for visualizing simple descriptive statistics (such as average and standard deviation) and includes a density plot to better see the data distribution. Violin plots can be interpreted as follows: the wider the area of the geometric shape at a specific y-axis value, the higher the probability of data being located at that specific value. For example, a plot with wide geometric shapes at 70% and 80% y-axis values indicates a higher probability of data being located at those values. We included a boxplot in our violin plots to provide further distribution details (and a familiar plot). There is also a point with error bars representing the mean and standard error of the mean (error bars).
3. Results
3.1. Students Were Enthusiastic About Using Virtual Reality per an Optional Survey
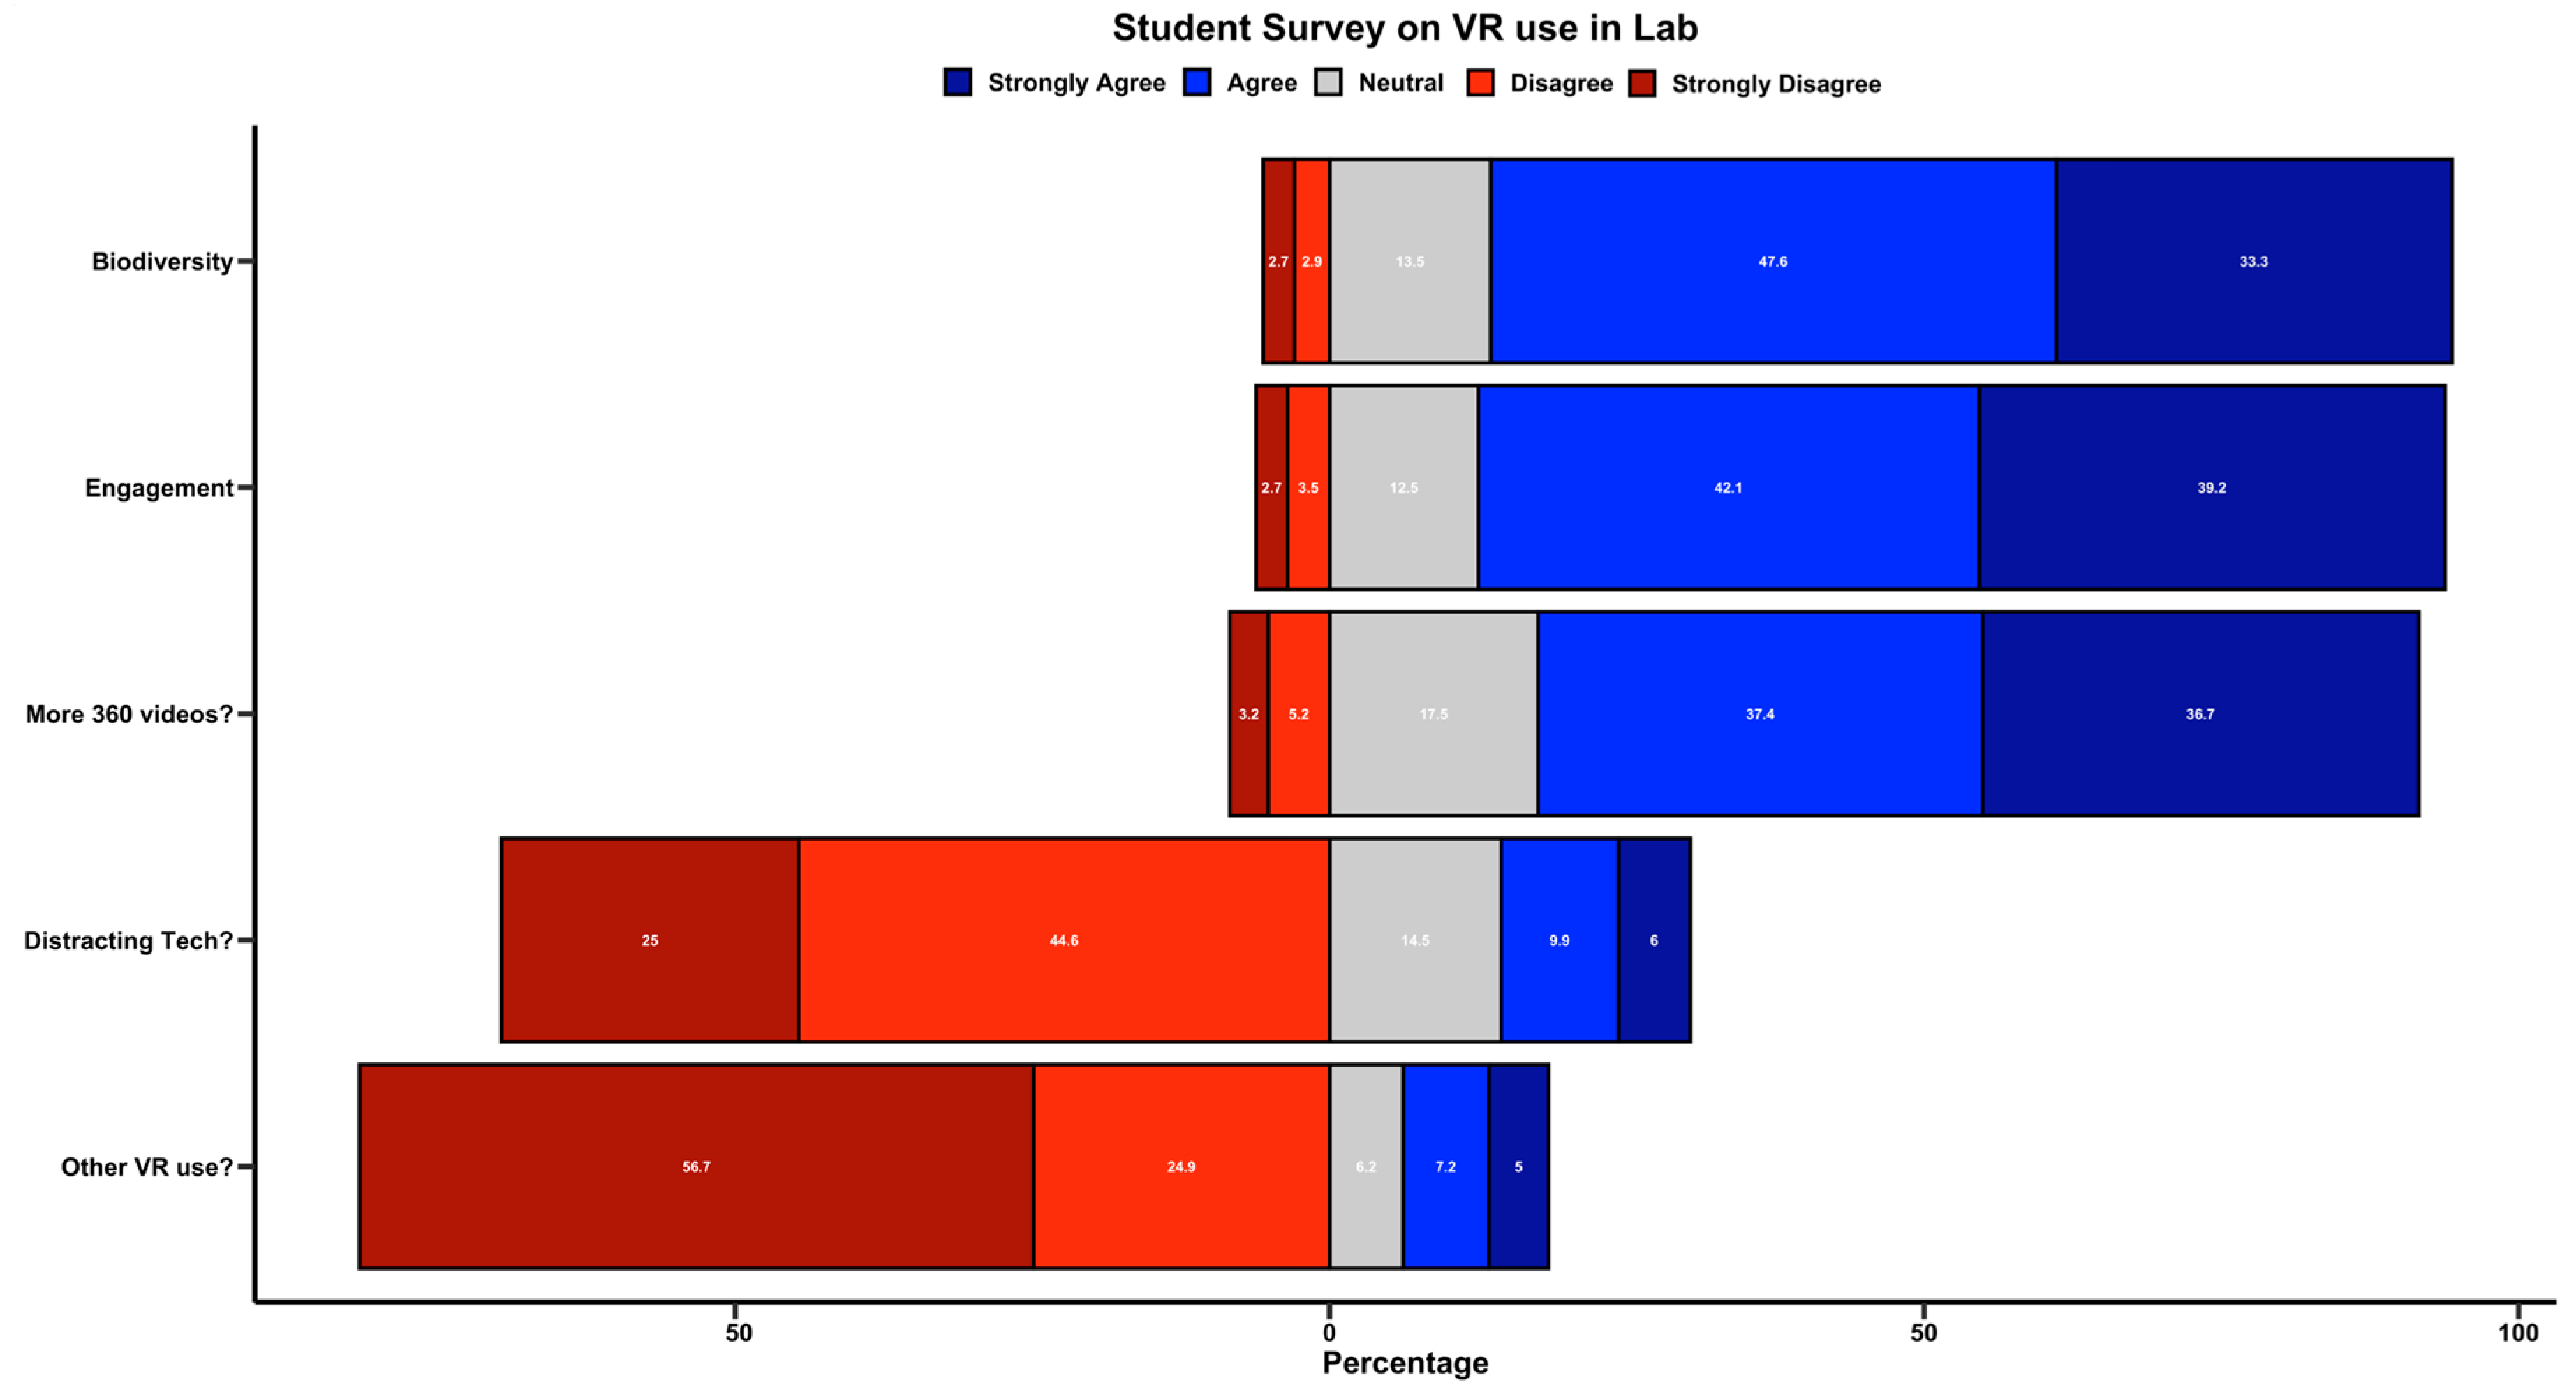
Using 360-degree video in BIOL 102L at UofSC was an optional but encouraged experience. At several points during the semester, after completing a virtual reality experience, students were allowed to complete a survey. A total of 679 students responded to the survey in Fall 2019 and Spring 2020, with a participation rate just under 50% (49.7%, n = 679, survey participants). Students were provided several Likert scale statements and asked to select the response they most agreed with. Overall, students viewed the VR experience positively (as visualized in
Figure 2 below). One of the statements was “I can better visualize some global biodiversity through this activity” to which 33.3% strongly agreed (n = 226), 47.6% agreed (n = 323), 13.5% were neutral (n = 92), 2.9% disagreed (n = 20), and 2.7% strongly disagreed (n = 18). Our next statement was “This activity helped me engage with the topic” to which 39.2% strongly agreed (n = 266), 42.1% agreed (n = 286), 12.5% were neutral (n = 85), 3.5% disagreed (n = 24), and 2.7% strongly disagreed (n = 18).
We asked for statements about the usage of VR in our lab and other courses to assess if the technology was being utilized broadly. We stated “I would like to see more 360 videos in lab” to which 36.7% strongly agreed (n = 249), 37.4% agreed (n = 254), 17.5% were neutral (n = 119), 3.2% disagreed (n = 35), and 5.2% strongly disagreed (n = 22). Next, we wanted to assess whether the equipment/technology we were implementing caused students to have negative experiences. We stated “Technology distracted me from the topic at hand” to which 6% strongly agreed (n = 41), 9.9% agreed (n = 67), 14.5% were neutral (n = 98), 44.6% disagreed (n = 303), and 25% strongly disagreed (n = 170). Our final statement was to determine the broad usage of VR in courses. We stated “I have used 360-degree videos/virtual reality in other courses” to which 5% strongly agreed (n = 34), 7.2% agreed (n = 49), 6.2% were neutral (n = 42), 24.9% disagreed (n = 169), and 56.7% strongly disagreed (n = 385).
3.2. Assessment Performance and Differing Semesters
To assess the true impacts of virtual reality use, we analyzed several different regular assessments. Altogether, we analyzed formative quizzes (given at the beginning of the lab to determine how students are interpreting material from the previous lab), a summative lab practical (serving as a final exam in some respects), and overall course grades. The formative quizzes were administered in the lab section after the virtual reality experience, and we only analyzed attempted quizzes (in other words, students who did not complete the quiz were not included in the analysis). Specifically, we analyzed the biodiversity quiz, evolution quiz, and the plant quiz as they all had direct virtual reality experiences associated with the topic. The summative lab practical was selected to determine if virtual reality experience had impacts on material retention throughout the semester. Final course grades and DFW rates were also analyzed for semesters with and without virtual reality experiences.
Fall and spring semesters were analyzed specifically (and distinctly) because there is a traditional difference in course grades and performance overall. The major curriculum for biological sciences requires BIOL 101 (and BIOL 101L) and BIOL 102 (and BIOL 102L), but there is no specific order in which they must be taken. Our advising model suggests that students not placed into calculus (via a placement assessment) should take BIOL 102 and BIOL 102L in their first semester to keep pace with the major’s curriculum. Due to these suggestions, grades are typically significantly different from fall to spring semesters, with spring semesters usually having higher course averages. These differences are also why we analyzed both fall and spring semesters with and without VR experiences.
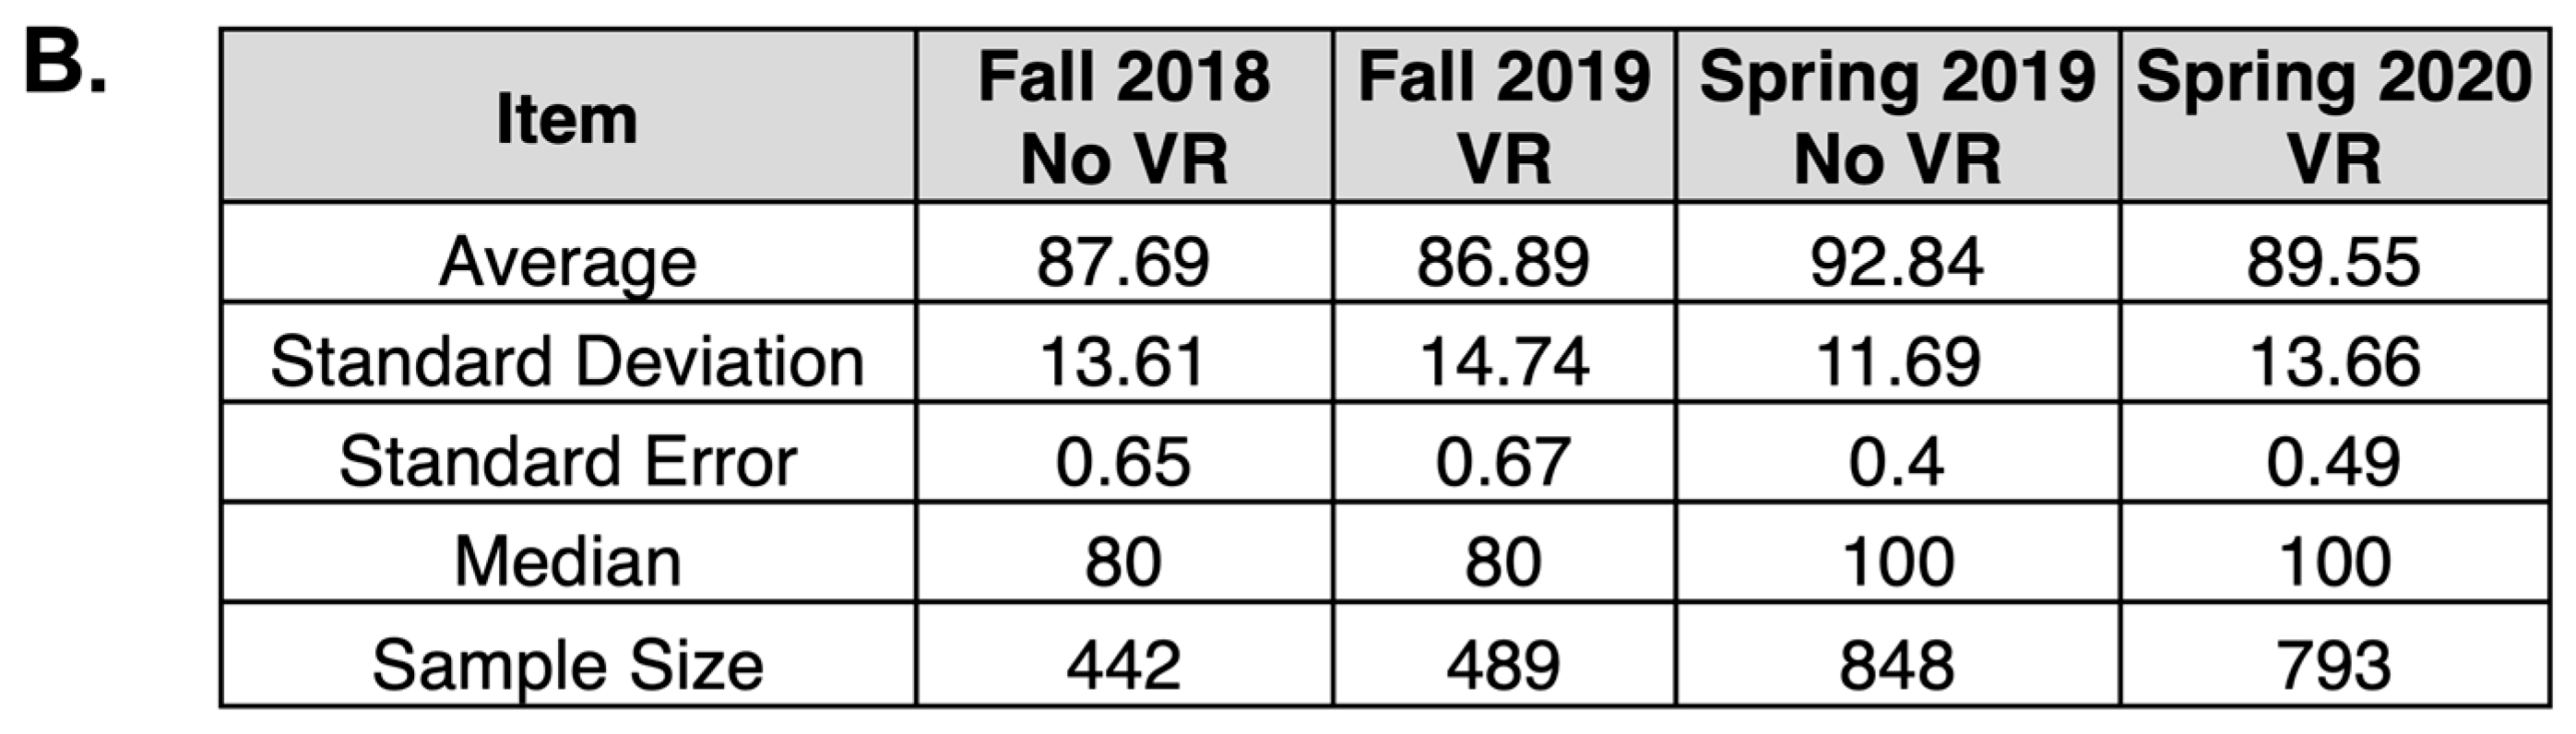
3.3. Virtual Reality Had Minimal Impact on Biodiversity Quiz Performance
We first examined the quiz performance on the topic of diversity. Students had the opportunity to view several videos regarding biodiversity, mainly by showcasing specific exotic organisms (arguably one of most visually impactful aspects of biodiversity). As shown in
Figure 3, the quiz averages were very similar across all semesters examined: 87.69 for Fall 2018, 86.89 for Fall 2019, 92.84 for Spring 2019, and 89.55 for Spring 2020 (units: percentage). The overall distribution of the quiz grades demonstrated minimal changes between the four semesters. Note that the general shape of
Figure 3 comes from the fact that each quiz contained a low number of questions with no partial credit given (therefore, grade distributions were clumped at distinct locations).
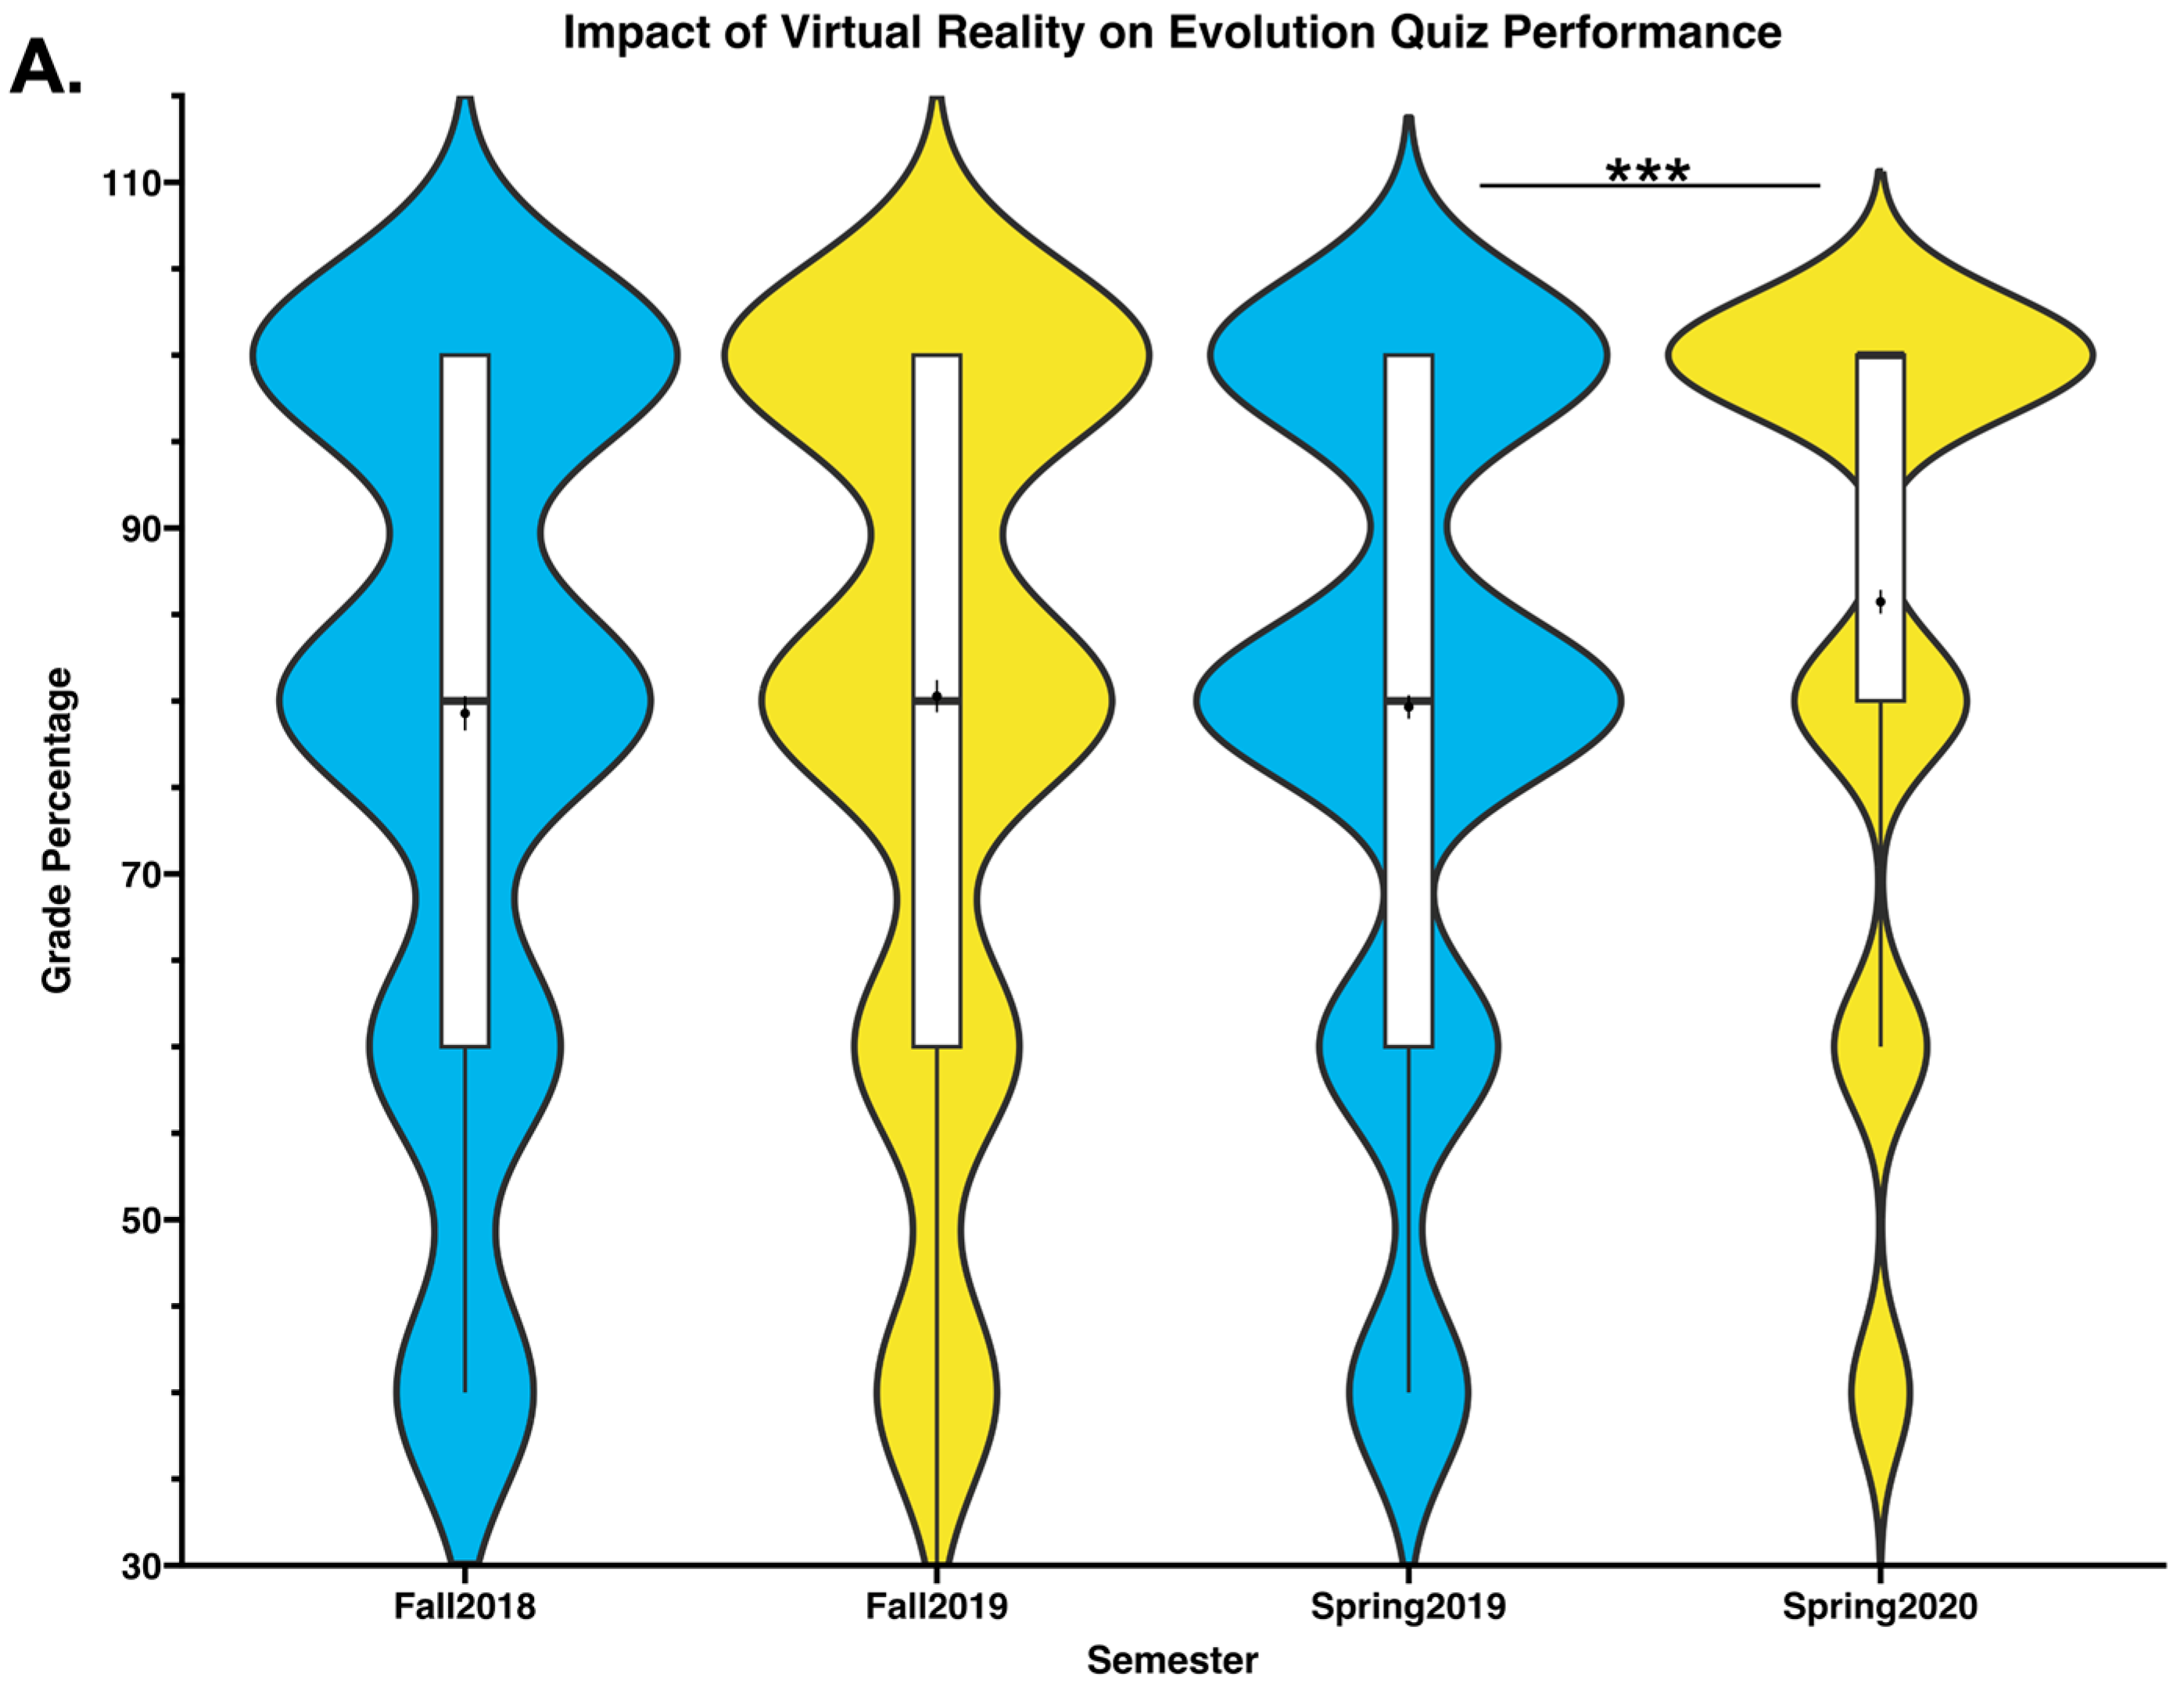
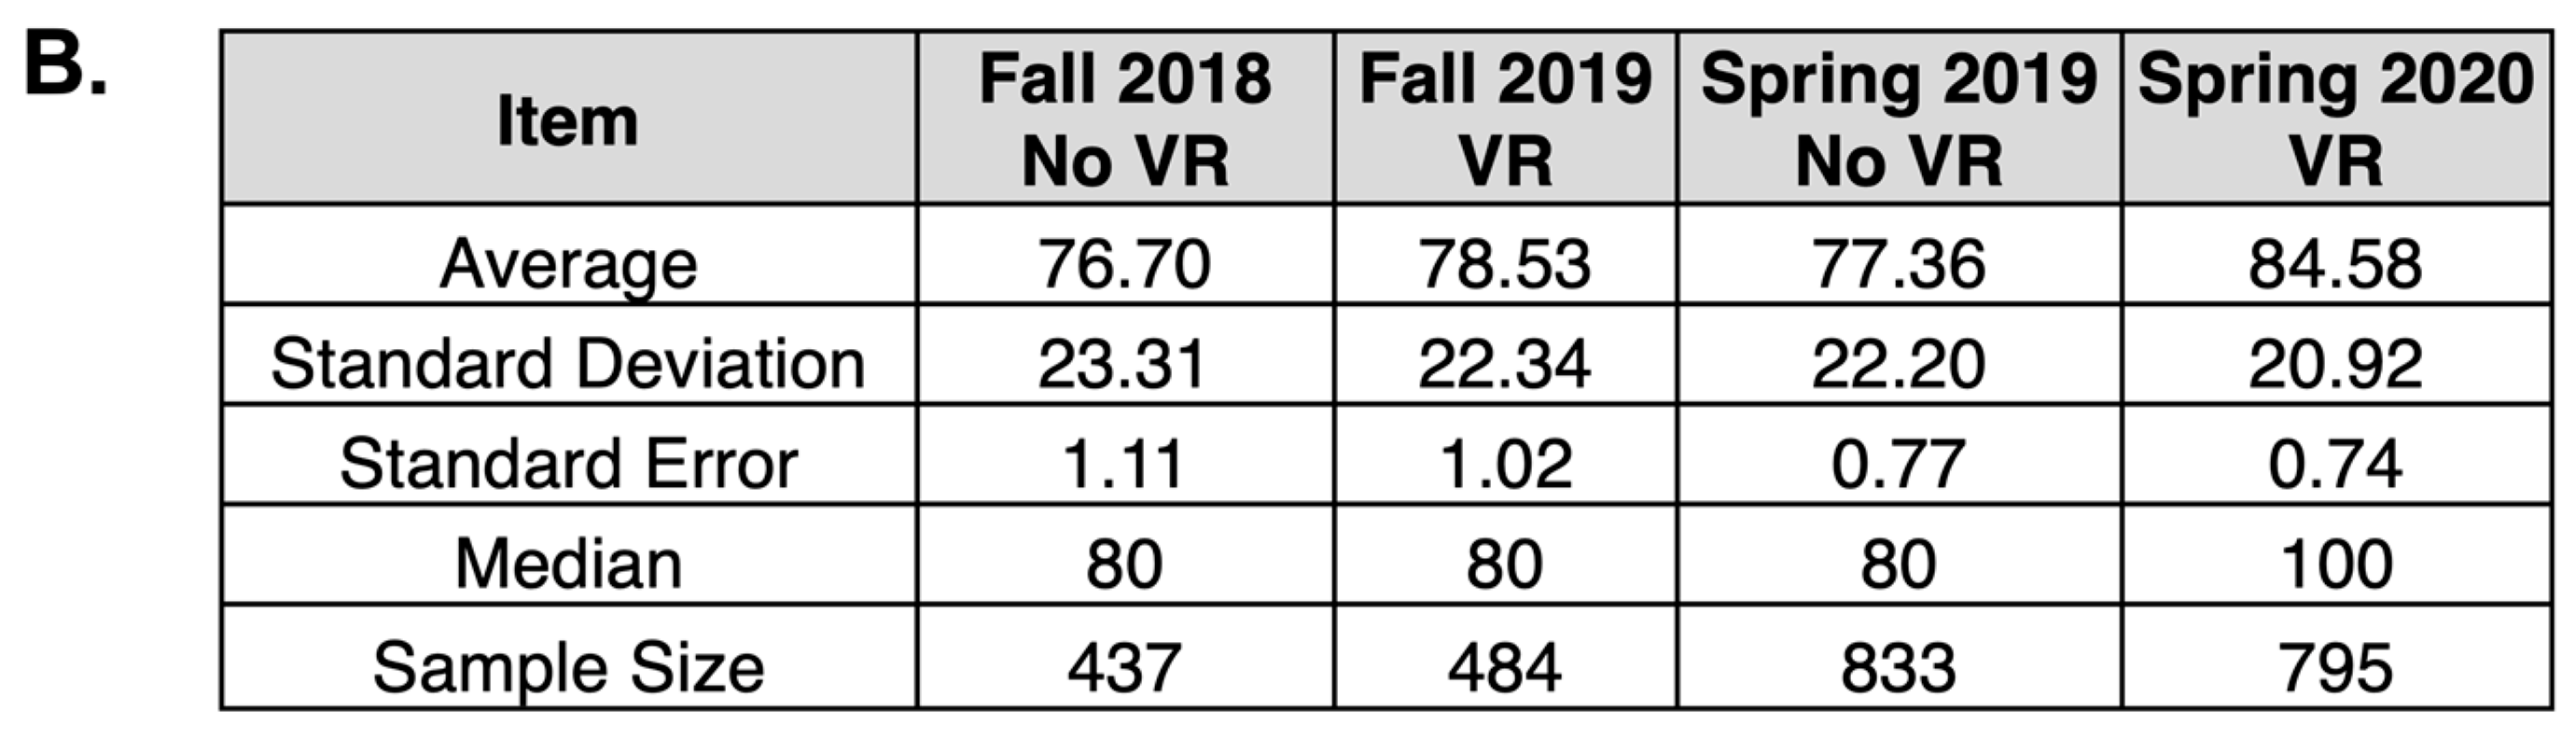
3.4. Virtual Reality Experiences Were Associated with Enhanced Evolution Quiz Performance for the Spring Semester
The formative quiz regarding evolution was analyzed to determine if VR experiences may influence performance. As visualized in
Figure 4, VR experiences in the fall semester demonstrated no significant impact on the quiz performance (Fall 2018: 76.7%; Fall 2019: 78.53%) while the VR experience was associated with enhanced quiz performance in the spring semester (Spring 2019: 77.86%; Spring 2020: 84.58%). Statistical analysis of the grades using a Mann–Whitney U Test found a statistically significant increase in grades from Spring 2019 to Spring 2020 (
p-value: 1.09 × 10
−14; Z test statistic: −7.73, U: 262,336.5).
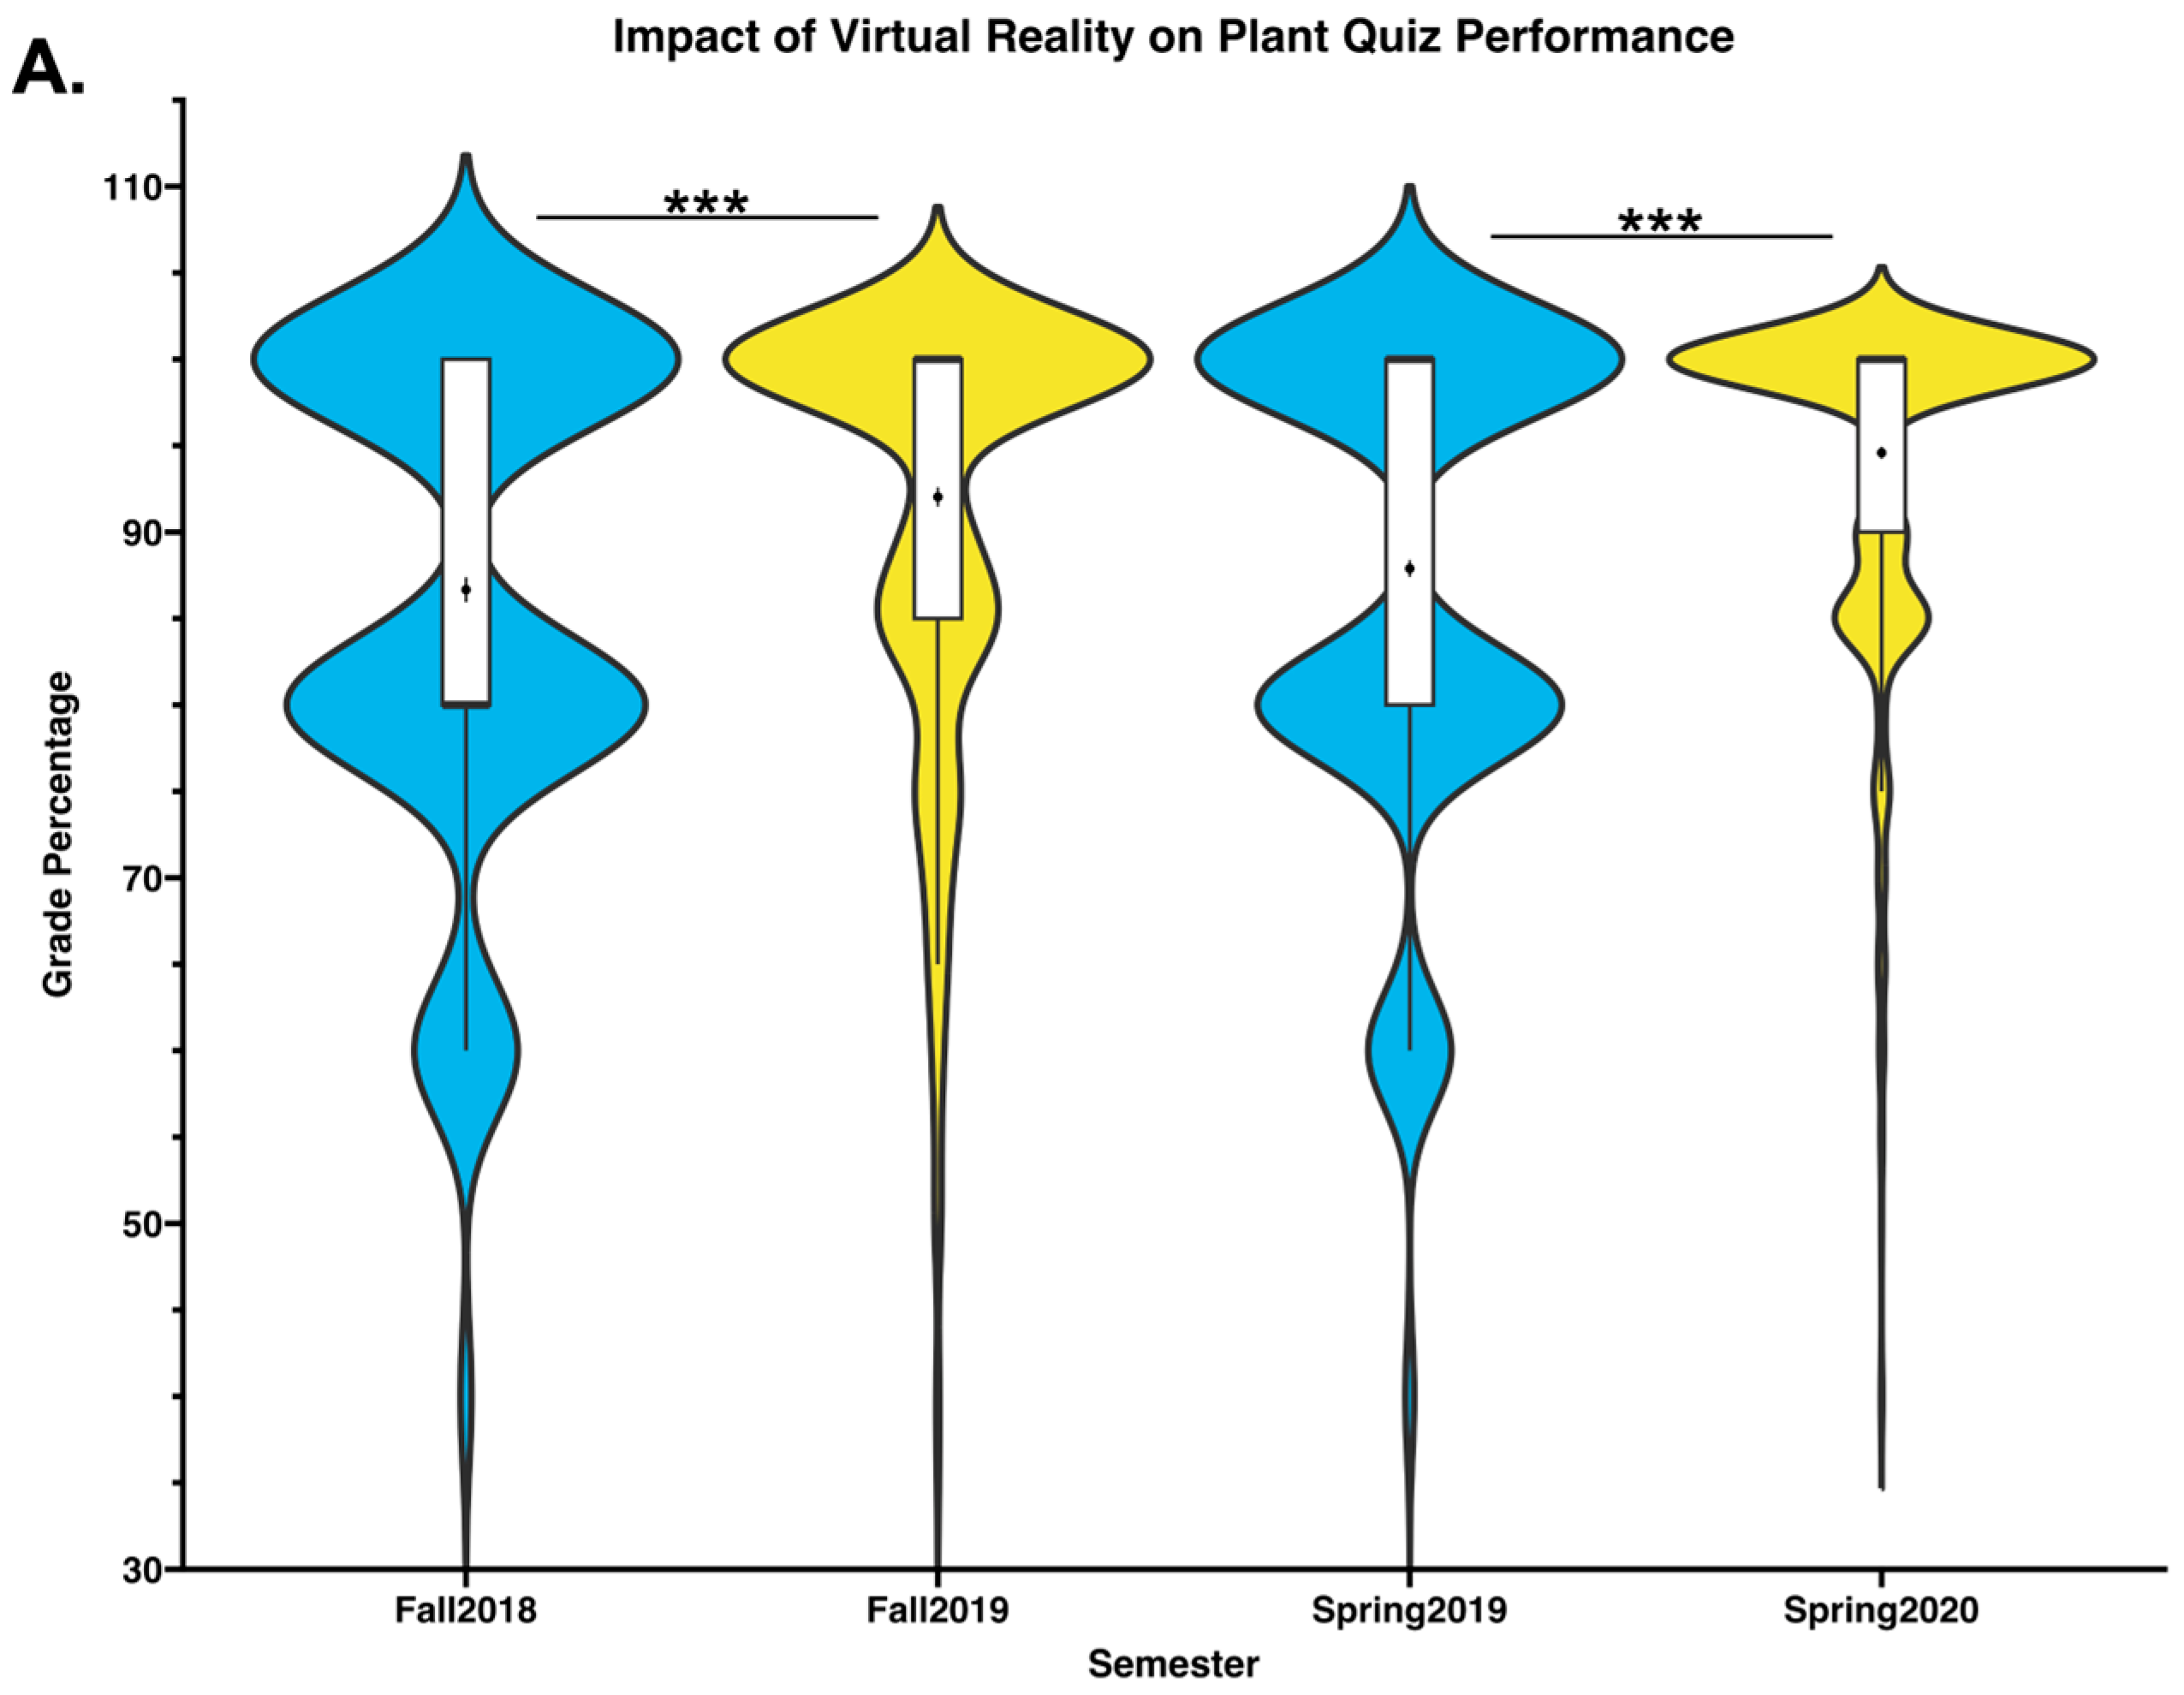
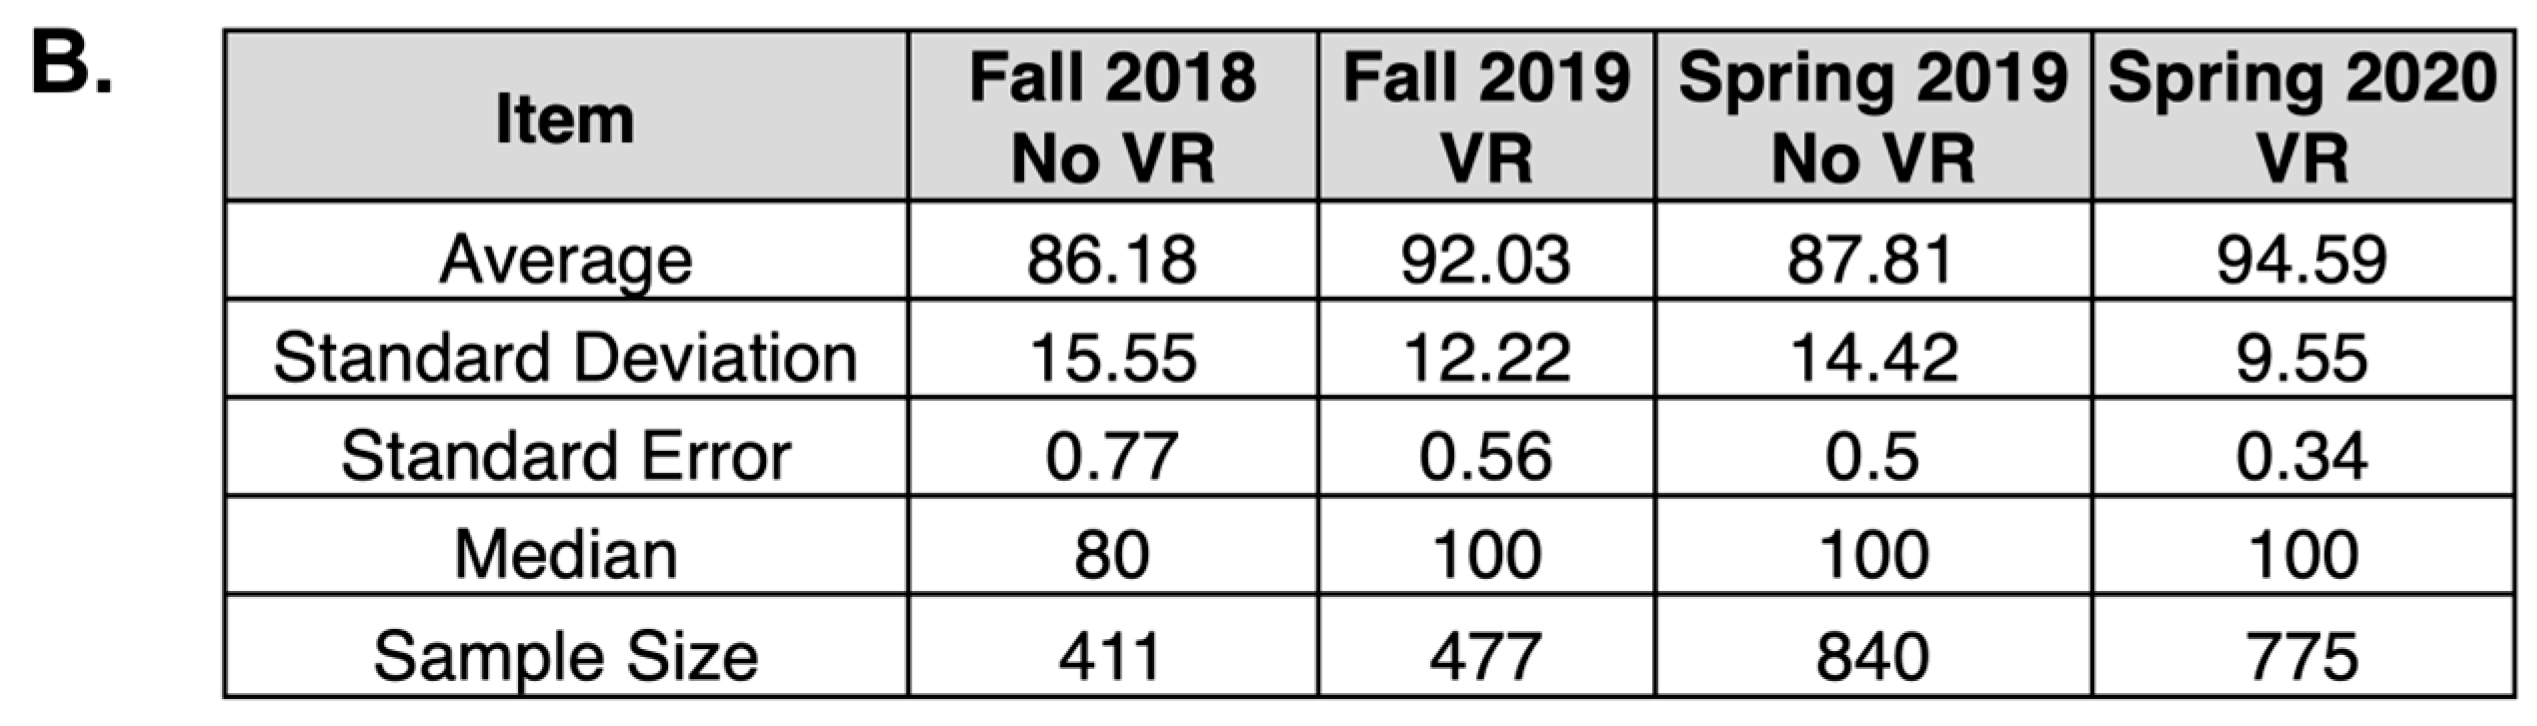
3.5. Virtual Reality Experiences Were Associated with Improved Plant Quiz Performance in Each Semester Implemented
We also analyzed student performance on a formative quiz focused on the topic of plant biology. Traditionally, students have found the plant material of the course to be unengaging. As shown in
Figure 5, we analyzed the plant quiz performance in semesters with and without VR experiences. VR experiences were associated with a significant increase in quiz performance (averages for quizzes: Fall 2018: 86.18%, Fall 2019: 92.03%, Spring 2019: 87.81%, and Spring 2020: 94.59%). The distribution of the quiz grades was different between semesters with and without the use of VR, with an increase in grade percentage (
Figure 5A). Statistical significance was determined by performing a Mann–Whitney U Test, with a significant increase found in grades from Fall 2018 to Fall 2019 and from Spring 2019 to Spring 2020 (fall data:
p-value: 1.43 × 10
−10, Z-test statistic: −6.43, U: 75,802.5; spring data:
p-value: 1.4 × 10
−30, Z test statistic: −10.6, U: 237,917).
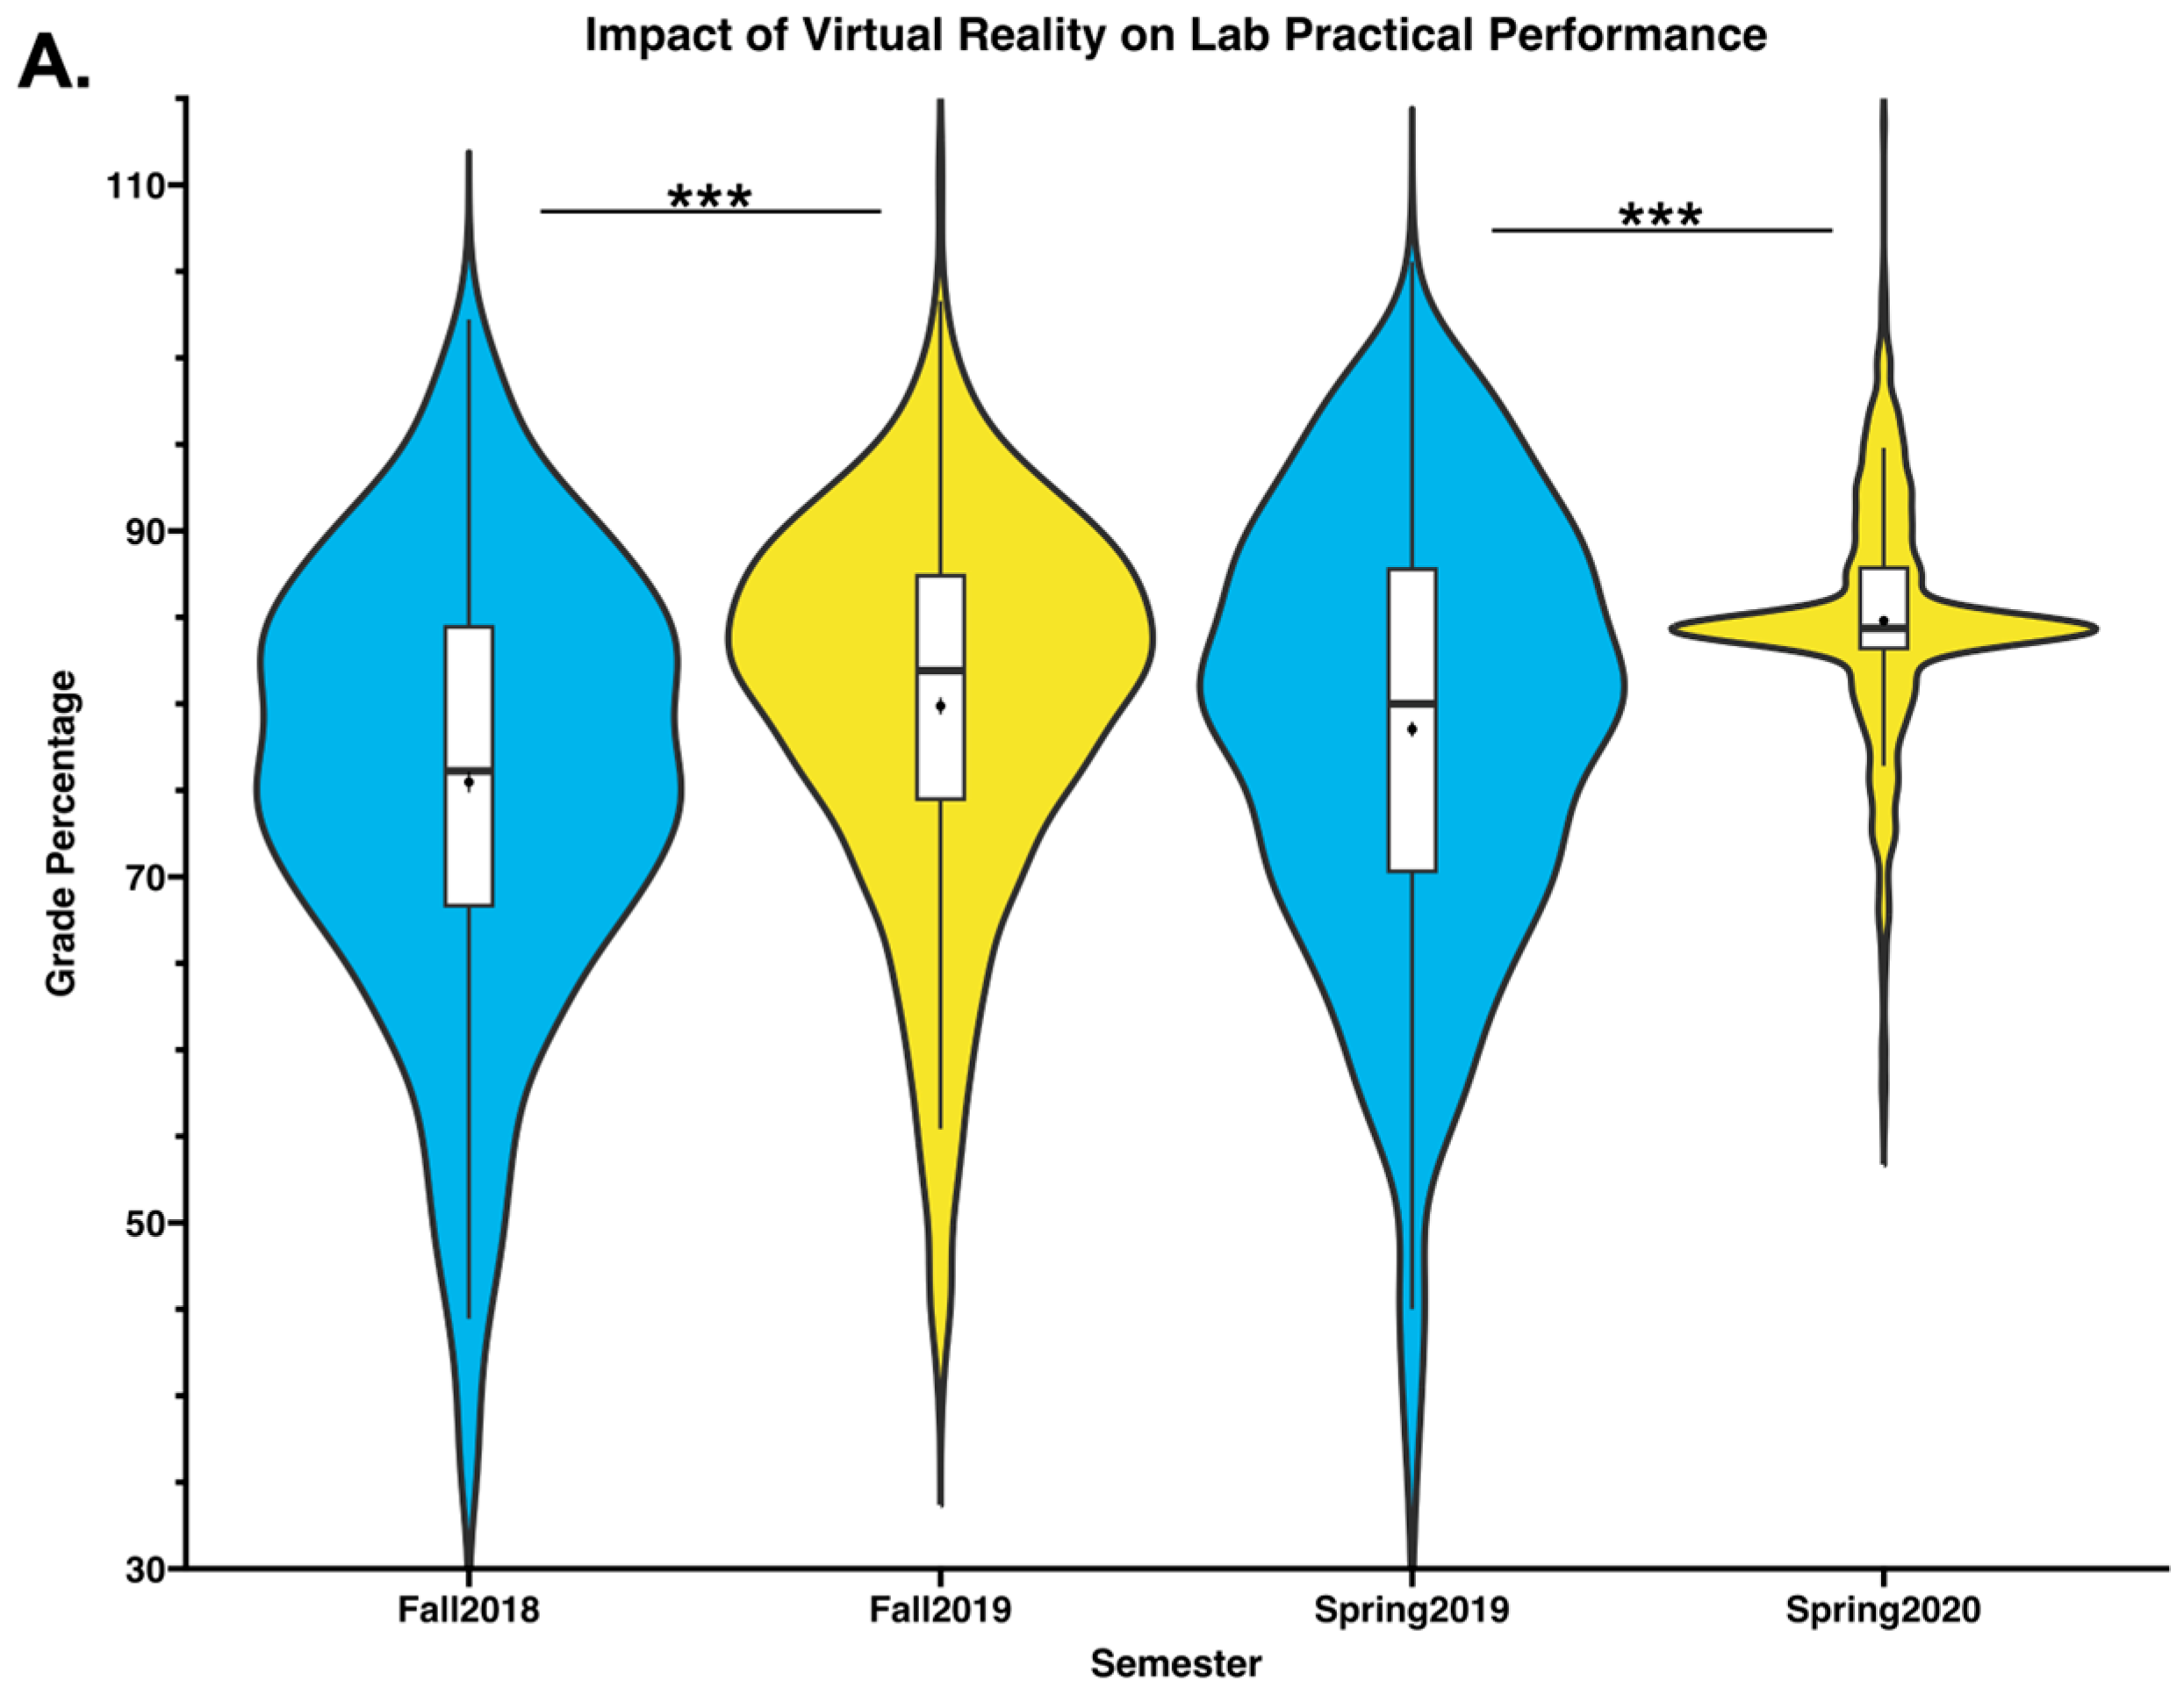
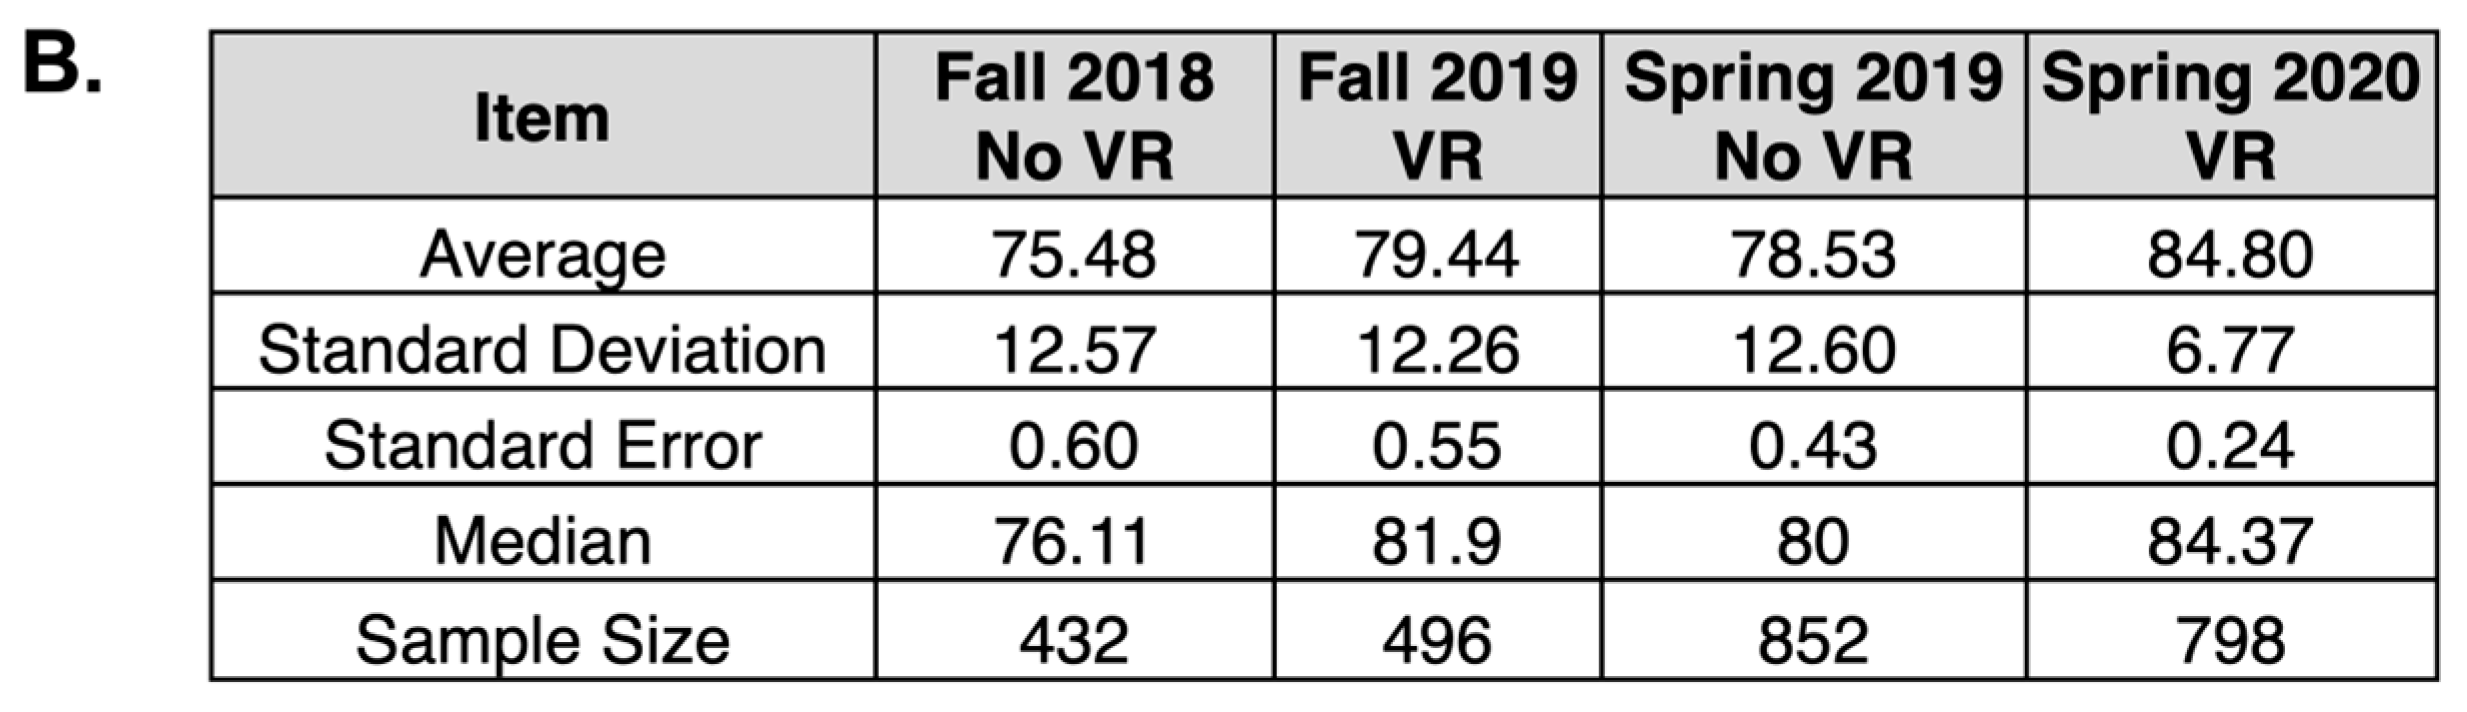
3.6. Summative Assessment (Lab Practical) Performance Was Enhanced in Semesters with Virtual Reality Experiences Implemented
To analyze the impact of VR experiences on a summative assessment, we collected and analyzed performance on the lab practical. This summative assessment is administered at the end of each semester to determine collective knowledge gains. As shown in
Figure 6, VR experiences in the lab were associated with improved assessment performance on the summative lab practical. For the fall semesters, the average grade on the practical was 75.48% for Fall 2018 with no VR experiences, which increased to 79.44% for Fall 2019 with VR experiences. Statistical significance was determined using a Mann–Whitney U Test (
p-value: 3.265 × 10
−8, Z-test statistic: −5.53, U: 84,627). For spring semesters, the average grade on the practical was 78.53% for Spring 2019 with no VR experience and 84.80% for Spring 2020 with VR experiences. Statistical significance was determined using a Mann–Whitney U Test (
p-value: 1.2 × 10
−11, Z-test statistic: −10.76, U: 235,840). One situation to note is that in Spring 2020, the lab was forced to move to an online setting due to the COVID-19 global pandemic. The lab practical was taken virtually that semester (along with the anatomy and physiology labs, which contained no VR experiences).
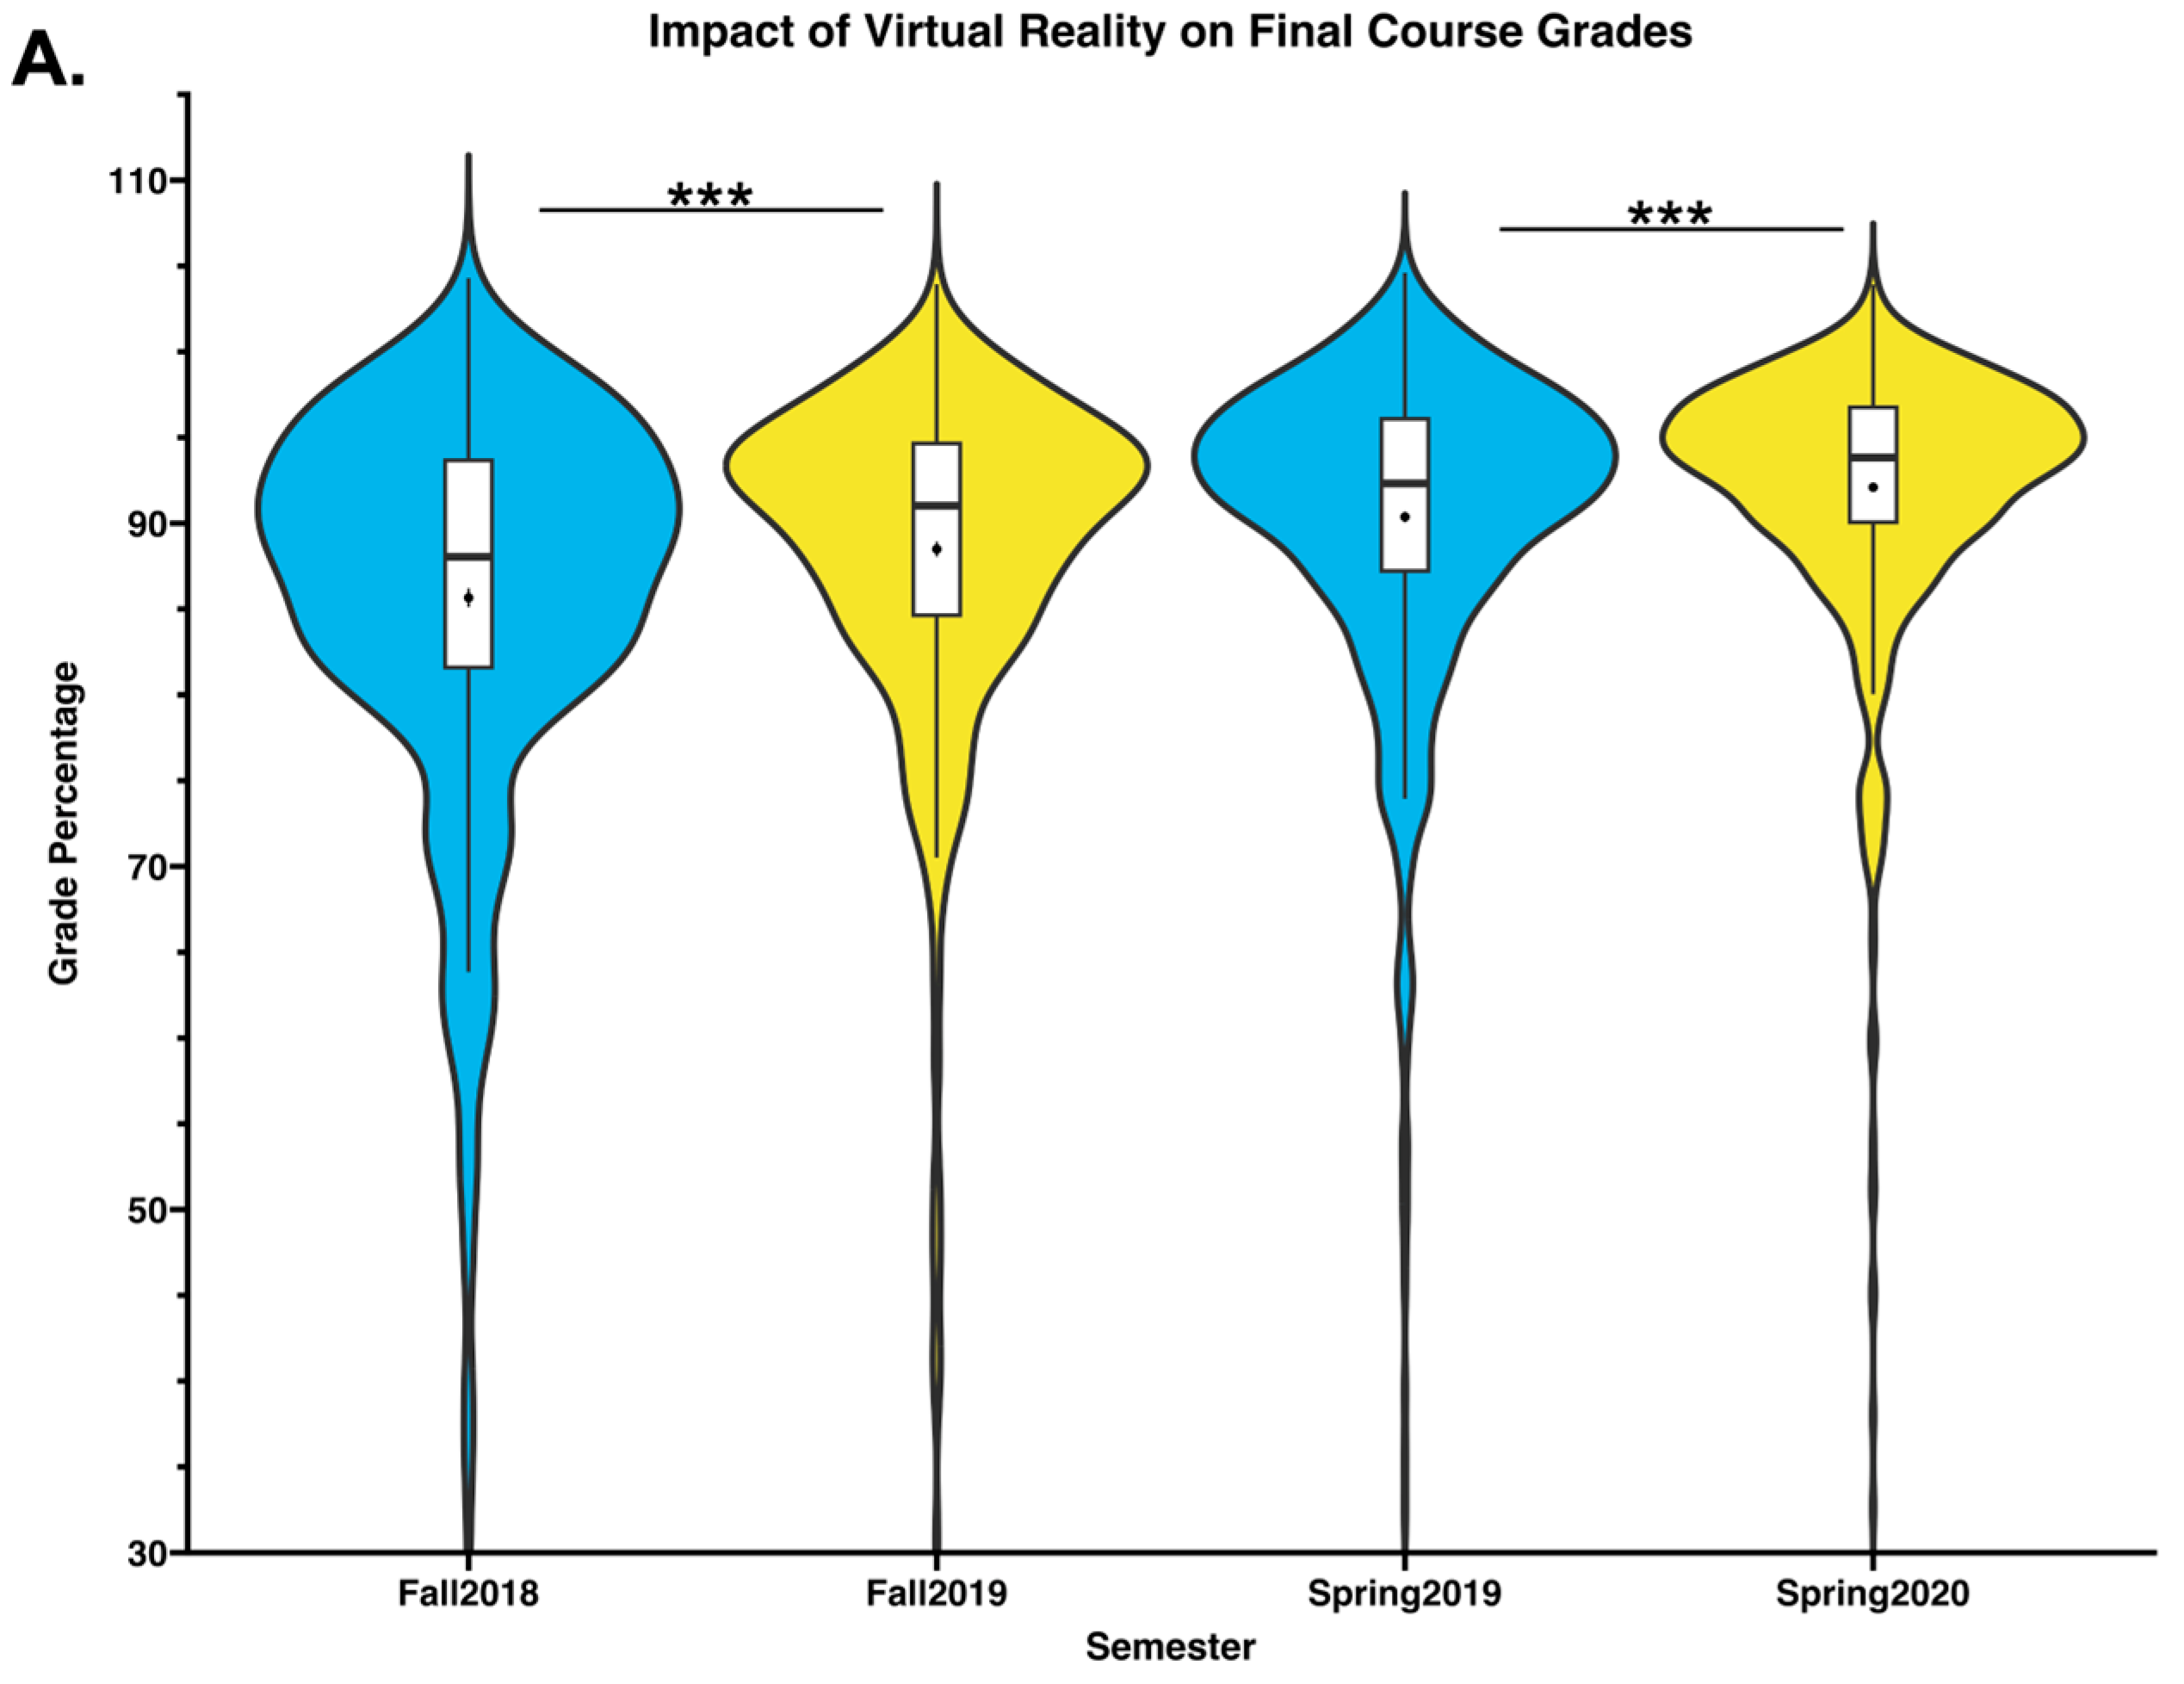
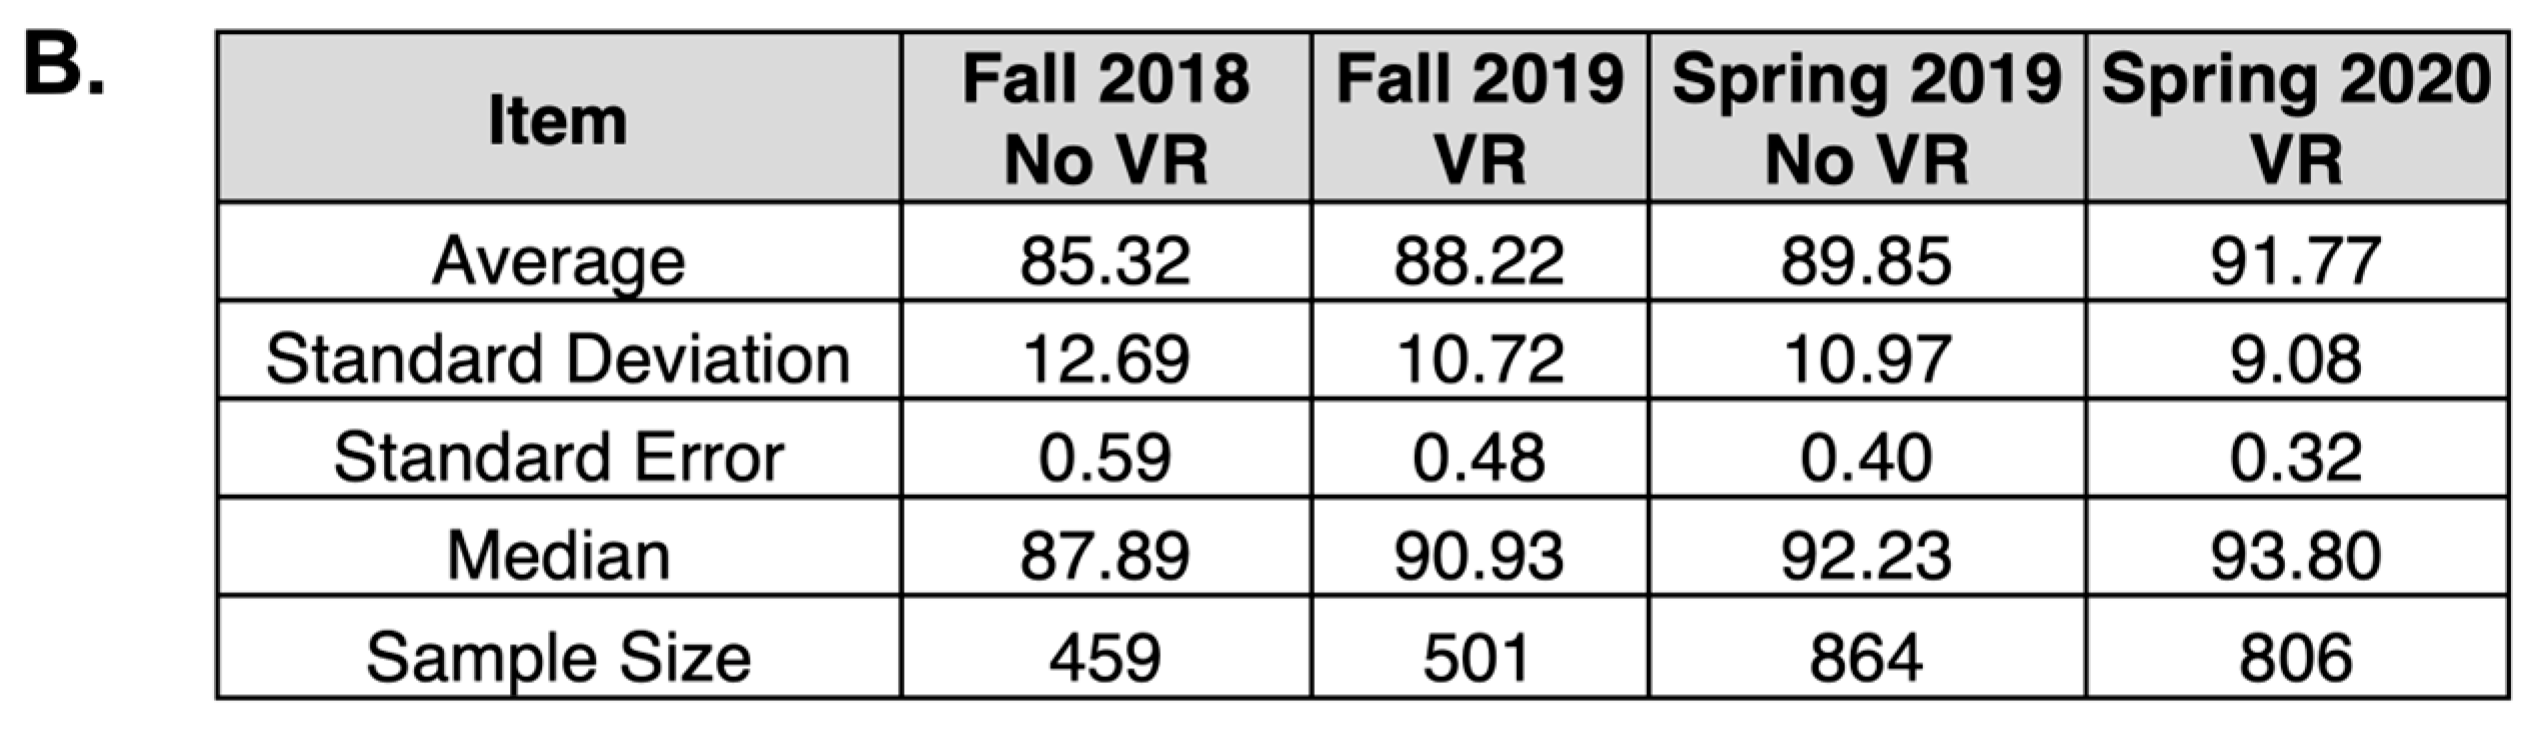
3.7. Virtual Reality Experiences Were Associated with Higher Final Course Grades
To assess the overall impact of VR experiences in our course, we analyzed final course grades. As shown in
Figure 7, VR experiences in the lab were associated with improved overall course grades for both semesters analyzed. For the fall semesters, the average course grade was 85.32% for Fall 2018 with no VR experiences, which increased to 88.22% for Fall 2019 with VR experiences. Statistical significance was determined using a Mann–Whitney U Test (
p-value: 2.96 × 10
−5, Z test statistic: −4.17, U: 97,059). For spring semesters, the average grade was 89.95% for Spring 2019 with no VR experience and 91.77% for Spring 2020 with VR experiences. Statistical significance was determined using a Mann–Whitney U Test (
p-value: 4.7 × 10
−6, Z test statistic: −4.58, U: 302,738).
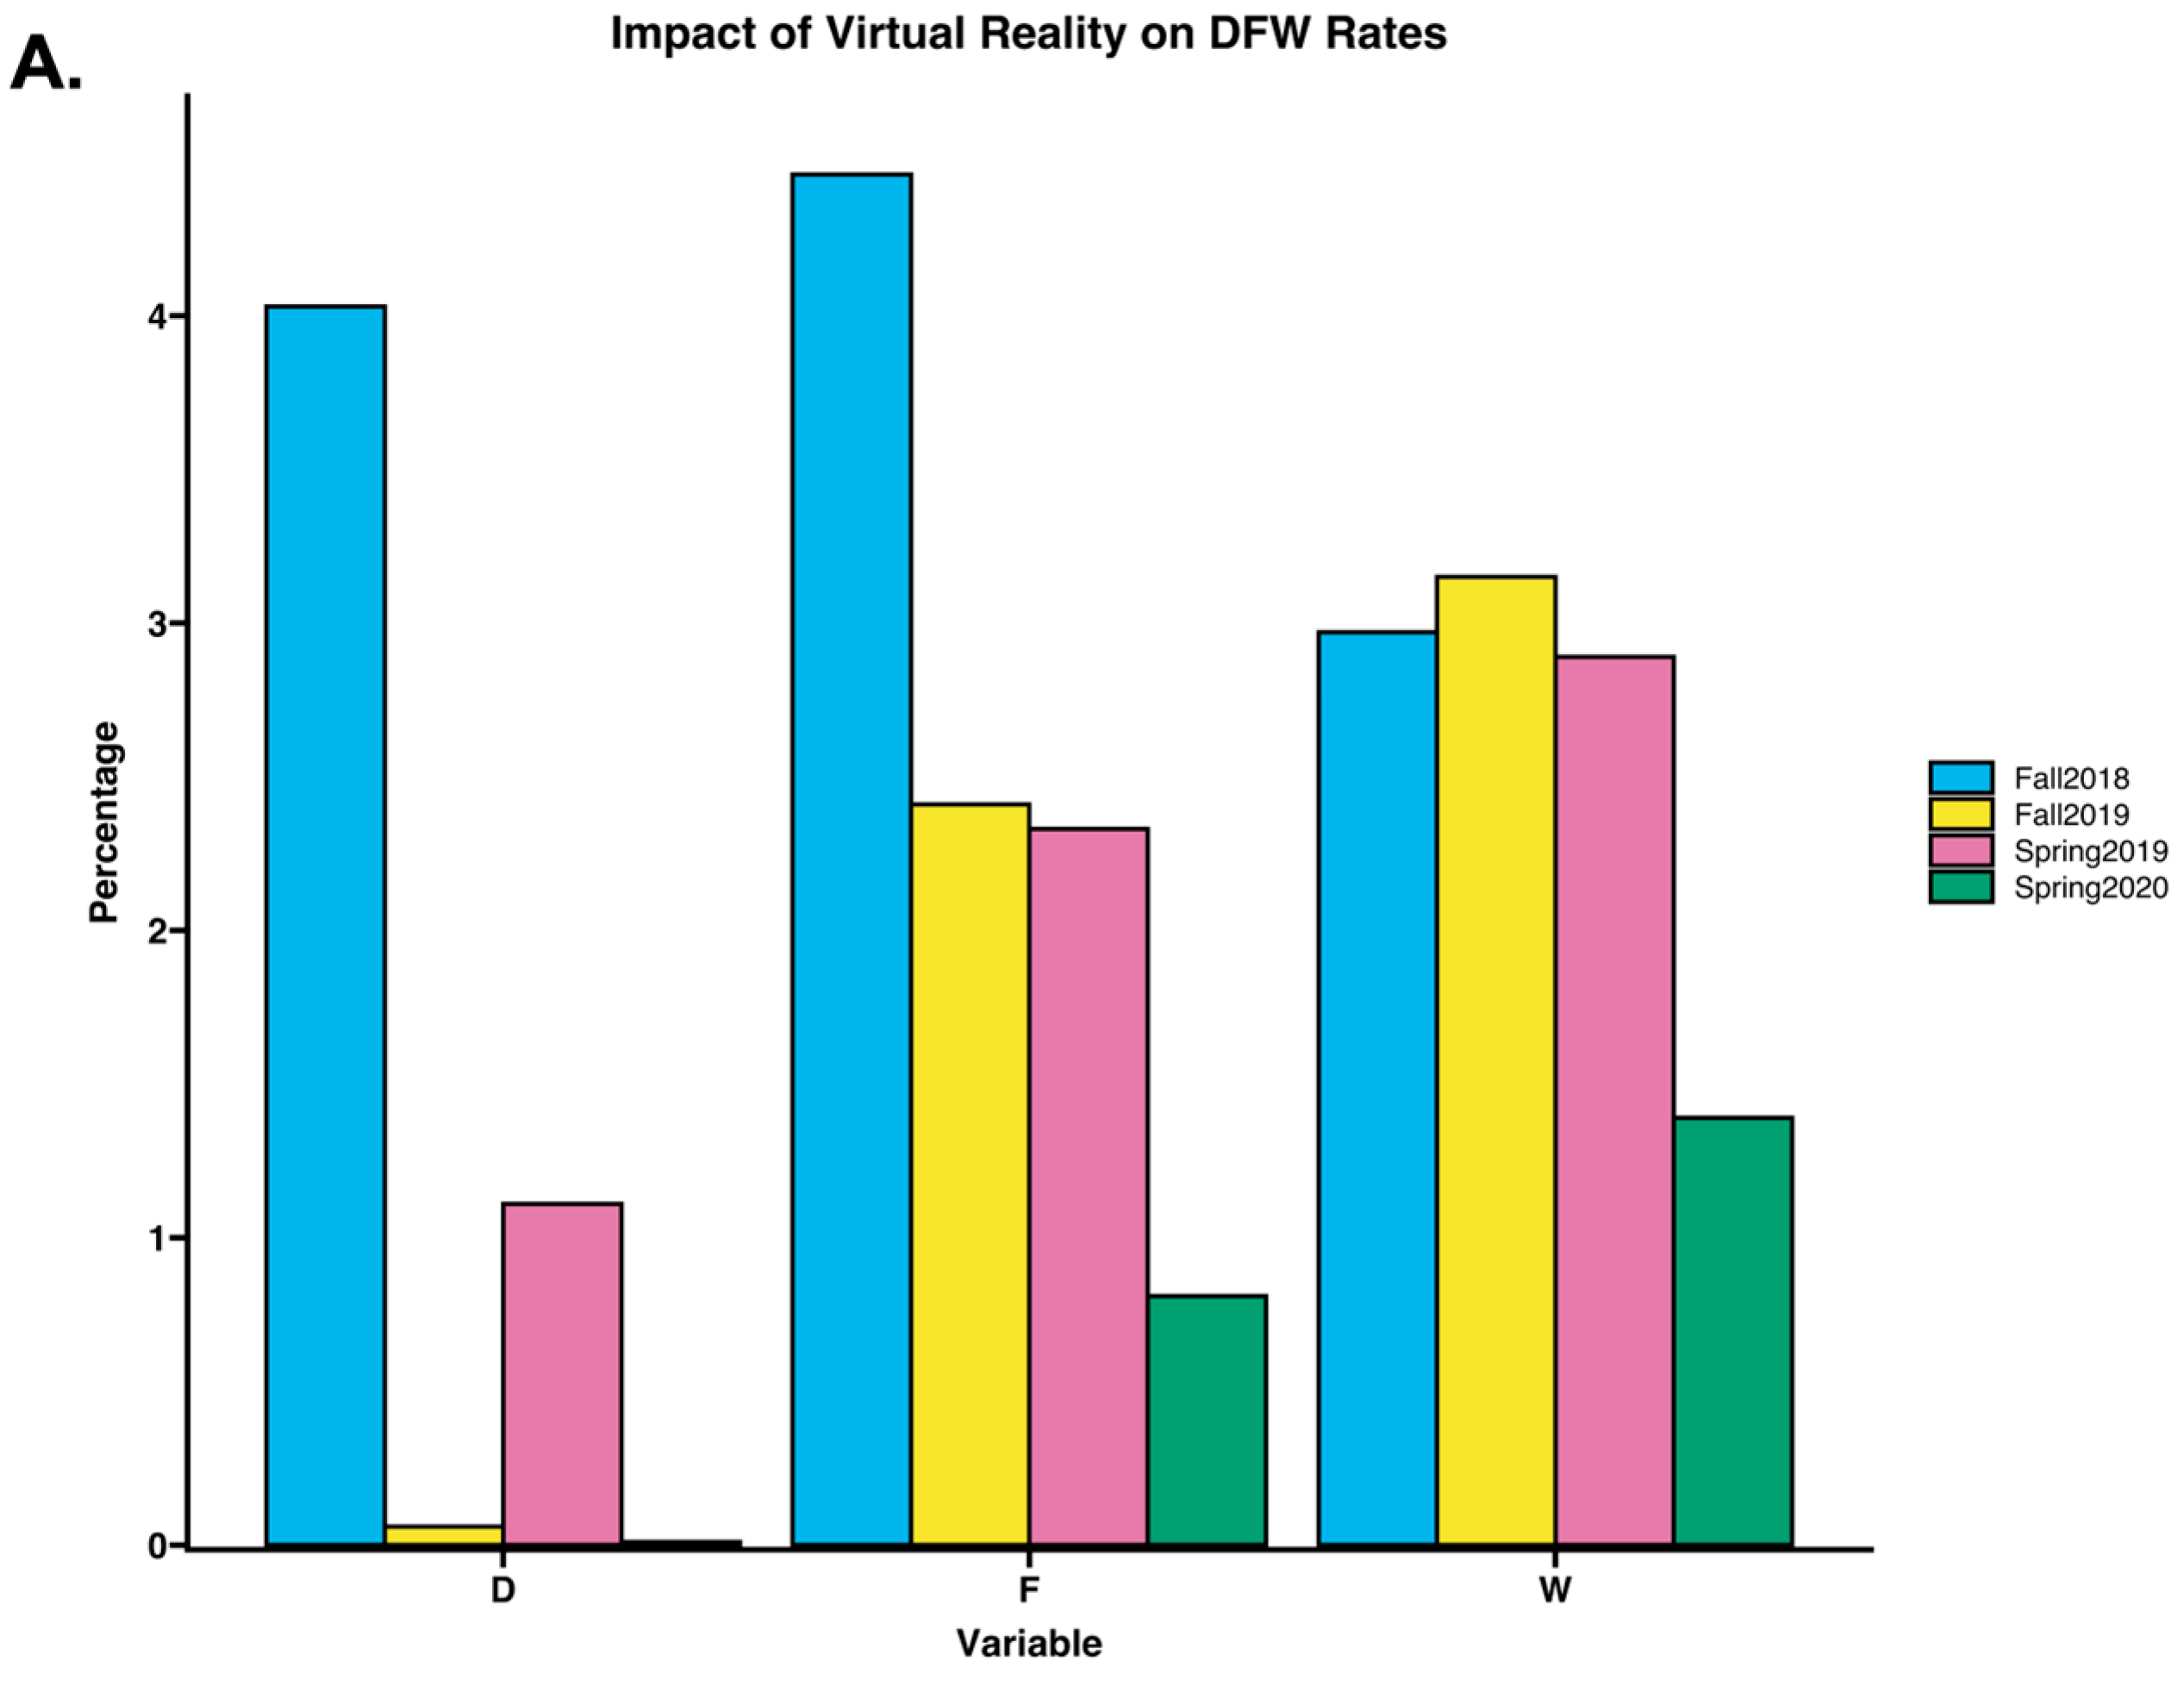
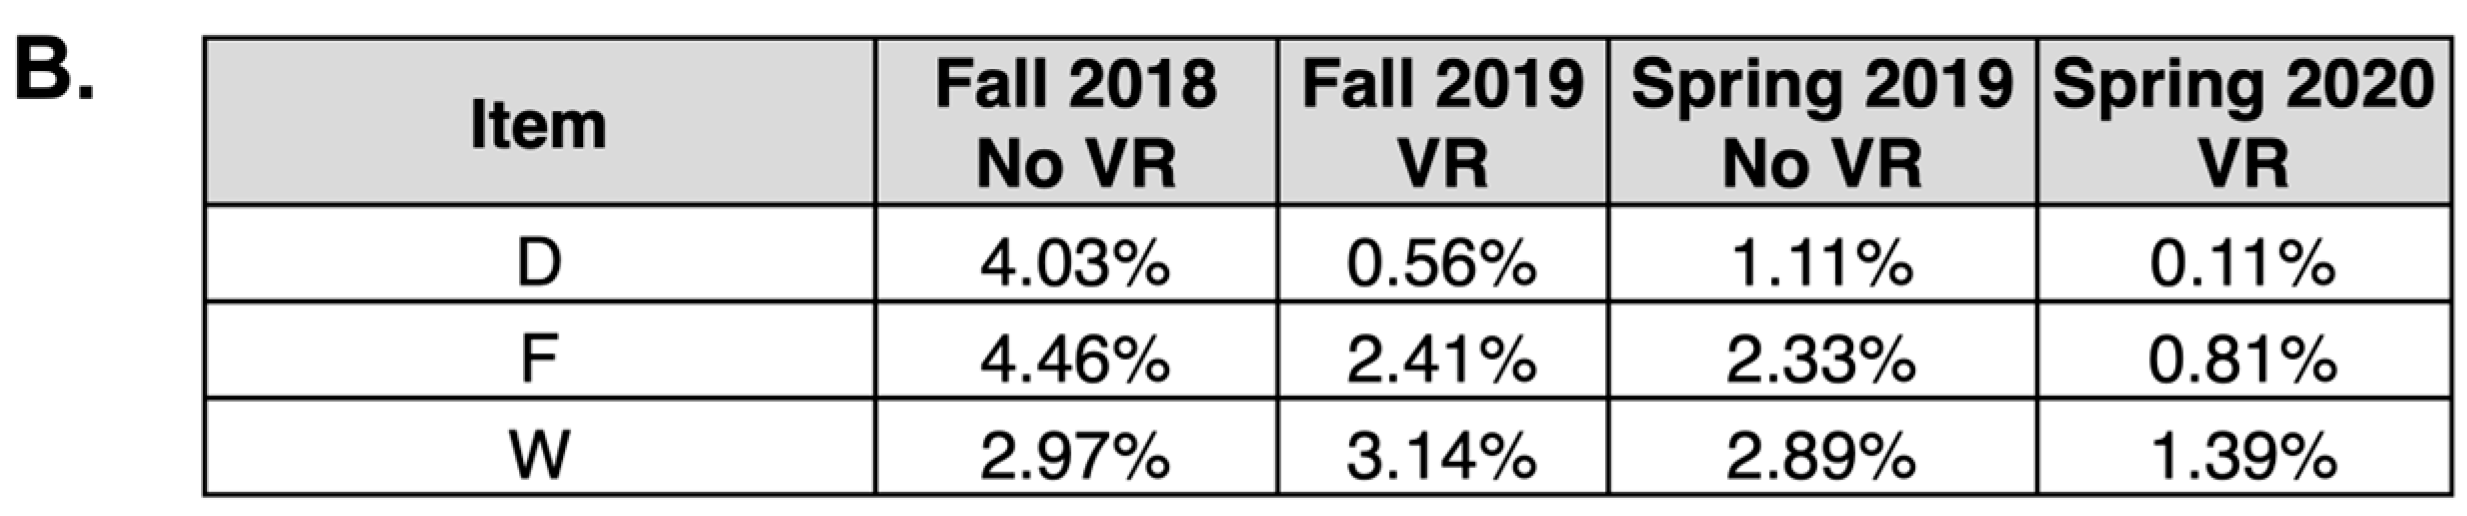
3.8. Semesters with Virtual Reality Experiences Exhibited Reduced Rates of D and F Grades
As demonstrated in
Figure 8, VR use was associated with significantly decreased rates of D and F grades, with minimal impact on withdrawal rates in the fall semester and a potential reduction for the spring semester (although midway through Spring 2020, the pandemic forced face-to-face education to move online, potentially impacting withdrawal rates). For Fall 2018, the rate of D grades was 4.03% with no VR experience and 0.56% for Fall 2019 with VR experiences, representing a decrease of 86.1%. For Spring 2019, the rate of D grades was 1.11% with no VR experience and 0.11% for Spring 2020 with VR experiences, representing a decrease of 90%. For Fall 2018, the rate of F grades was 4.46% with no VR experience and 2.41% for Fall 2019 with VR experiences, representing a decrease of 45.96%. For Spring 2019, the rate of F grades was 2.33% with no VR experience and 0.81% for Spring 2020 with VR experiences, representing a decrease of 65.23%. The withdrawal rate for Fall 2018 was 2.97% with no VR experience and 3.14% for Fall 2019 with VR experiences. The withdrawal rate for Spring 2018 was 2.89% with no VR experience and 1.39% for Fall 2019 with VR experiences.
4. Discussion
In this study, we assessed the impact of VR experiences on various formative assessments, a summative assessment, DFW rates, and overall course performance. Collected over four semesters and over a hundred lab sections, our data suggest that VR experiences in an introductory lab course are associated with enhanced student engagement, student attitudes, and overall course performance.
When analyzing the data from our survey, we found that students had a positive experience with VR in the lab. From enhancing engagement with specific topics to better visualizing global biodiversity, students agreed that the experience was beneficial (
Figure 2). We even assessed students’ views on implementing more VR experiences in the lab, and they were enthusiastically in favor, with 74.1% of students either strongly agreeing or agreeing (
Figure 2). Previous studies have shown that technology use and potential motion sickness may occur and result in undesirable VR experiences for students/users in general [
25]. To help address the technology aspects, we asked students if technology distracted them from the topic, and 69.6% of students either disagreed or strongly disagreed (
Figure 2). While students were enthusiastic about VR experiences in the lab, our survey results suggest that it is not something they have encountered in many other courses (81.6% either disagreed or strongly disagreed with the question “I have used 360-degree videos/virtual reality in other courses”). Overall, the reception of the VR experience by students was extremely positive and was praised by the instructor, which may have helped students engage fully (engagement helps students meet their academic goals) [
20,
29,
30].
Students saw the VR experiences positively. We then analyzed student performance on various assessments to determine if there were any associations with enhanced performance and VR usage. A few studies have been published that indicate student performance is enhanced by implementing virtual reality in higher education, although none specifically analyzed large numbers over multiple years in a biological sciences curriculum and/or included formative and summative assessment performance [
6,
11,
14,
31,
32]. The first VR experience used in the course was one focused on global biodiversity (
Figure 3). Interestingly, there was no associated impact on biodiversity quiz performance with VR usage. We speculate that this result may be simply because it was the first VR experience, so students may have spent more time trying to make the equipment function instead of focusing on the content. Alternatively, the 360-degree videos we selected were about large fauna found globally (and were relatively popular organisms, such as wolves, pandas, and lions). Due to this popularity, students may already have a sense of large-organism biodiversity, so the VR experience was not associated with any specific enhancement in quiz performance (
Figure 3).
The following assessment focused on the theory of evolution and Hardy–Weinberg equilibrium (a concept that challenges students). We found that the fall semesters experienced no impact on quiz performance with the implementation of VR, while the spring semester had a statistically significant increase in quiz grades associated with the use of VR (
Figure 4). The VR experience used focuses on places of historic importance; for example, we showed the students what life is like on the Galápagos Islands, the place credited for the inception of Darwin’s famous theory of evolution. While the setting may have been important for students in the spring semester, those in the fall may have needed additional information for the VR experience to potentially make a difference in performance. Another important consideration is the topic of Hardy–Weinberg equilibrium. Traditionally, the problems that are assigned require a solid foundation in math, and our fall students may not have that solid foundation (potentially resulting in a lack of significance regarding VR experiences).
Another subject that students traditionally struggle with is plant biology. We found a statistically significant increase in plant quiz performance associated with VR implementation in both the fall and spring semesters analyzed (
Figure 5). These experiences showcased the broad biodiversity of plants and helped students understand the importance of plants.
To analyze the potential impacts of VR on a summative assessment, we analyzed performance on the lab practical (
Figure 6). Again, we found a statistically significant increase in performance for both the fall and spring semesters. We analyzed the overall associated potential impacts of VR usage on overall course grades and found a statistically significant increase in semesters that implemented a VR experience.
Then, to analyze potential impacts on final course grades, we compared semesters with and without VR usage (
Figure 7). Here, we uncovered that both fall and spring semesters had a statistically significant increase in student grades in semesters that had a VR experience than in semesters without a VR experience. While several factors could potentially influence final course grades, including admission standard changes or advisement changes, VR experiences had a positive impact on student course grades and engagement, as has been found in other studies using VR in education [
11,
14,
28,
33].
Lastly, we assessed the D, F, and withdrawal rates (
Figure 8). Rates of D and F grades were significantly lower in semesters that implemented VR experiences. Fall semester withdrawal rates were not significantly altered, while there was an associated decrease in withdrawal rates for the spring semester. While these results are encouraging, it should be noted that, specifically for withdrawal rates, the spring semester did experience a shutdown due to the global pandemic and a shift to virtual learning.
Our study has several limitations that should be mentioned. First, we did not use a pre-existing survey to administer to students regarding their views on VR. We also did not measure the exposure students may have had coming into the lab with VR. Students who have already experienced VR could have different experiences with VR and the course content than those using it for the first time. The immersion levels for the experiences are also different. While we used professionally produced 360 videos, the different degrees of immersion may have vastly impacted students’ experiences (and may potentially explain in part some of the variation seen in which assessments were most significantly impacted by the use of 360-degree video). Another limitation of our study was the potential impact of virtual tests in Spring 2020 due to the COVID-19 shutdown. Only the lab practical was taken virtually, but this may have impacted the outcomes of our study. Another important consideration is student views on whether these virtual experiences can provide a substitute for real experiences. We did not assess this with students, and it would be an important part of future work. Our surveys also may suffer from students having bias toward these VR experiences in the surveys (especially since they were not validated pre-existing surveys and were instead self-reporting).
Overall, our results demonstrate a potentially significant impact of virtual reality experiences in an introductory college course. Our findings support our hypothesis that VR experiences will enhance student engagement, attitudes, and performance. While two formative assessments, the biodiversity quiz and fall semester evolution quiz, did not demonstrate enhanced performance with the use of VR, we speculate that a more refined experience could potentially lead to enhanced performance for these quizzes as well. Virtual reality has already been shown in various studies to enhance student engagement [
4,
5]; in the present study, we link student performance on assessment in a large sample size over multiple years of study to add even further value to implementing virtual reality in higher education. Once used primarily as a training technique for pilots and associated with next-level gaming, virtual reality has earned a place in higher education where it can help cement concepts for students. Multi-sensory processing and the four stages of learning are all enhanced through the engagement of sight and sound with the implementation of VR in the classroom [
2,
3]. In future work, we will investigate potential uses of augmented reality (potentially with the popular social media app Snapchat) and even the gamification of these virtual reality experiences in an active, social learning environment. We will also investigate potential qualitative components from our students, highlighting the real impacts of VR in education. We have demonstrated a cost-effective means of implementing a virtual reality experience in the classroom with minimal logistical buy-in from instructors and departments. This could be easily transferable to other disciplines with visual components, such as hospitality, sociology, and nursing. While VR experiences may not be useful for all students (i.e., due to motion sickness [
33]), they can serve critical roles in supplementing our curriculum to further enhance engagement and performance.


