1. Introduction
In recent years, technological advances and the proliferation of Virtual Reality (VR) devices have gained a massive amount of attention where eye tracking is integrated with head-mounted displays (HMD) (e.g., HTC Vive Pro Eye, Pico Neo 2 Eye, FOVE 0, or Varjo VR-3). These VR headsets can be used for various applications such as education [
1], training [
2,
3], business [
4] (e.g., analysis of shopping trends), or collaboration [
5]. Past research [
6] has shown that gaze data are unique to each individual and can reveal sensitive information (e.g., age, gender, race, and body mass index) about that individual. Thus, we can potentially identify a user from gaze data alone. This poses privacy issues when eye-gaze data are collected and stored by an application. However, on the positive side, the ability to identify users based on gaze data opens up new possibilities for interactions in virtual/augmented reality applications. For example. we can customize the user’s experience based on the detected user and also improve the security of the system by frequently authenticating the user by an automated implicit process, which does not distract the user from the actual VR task at hand. This paper explores machine learning and deep learning methods on eye gaze data to identify users with a reasonably good accuracy without any explicit authentication task.
There are various advantages of automatic biometric-based authentication or identification. This process eliminates the use of an explicit authentication step, such as entering a username and password. Additionally, an automatic authentication process can continuously detect if the original user is still logged in and lock the device if necessary to avoid unauthorized access. Furthermore, such a system would improve the usability of the system by adapting the UI based on the preferences of the detected user, thus allowing the seamless switching of users in a multi-user environment, such as a classroom where students need to share VR devices. The content can also be personalized based on the profile and preferences of the detected user. Thus, our work is a step towards this goal of developing an automated gaze-based authentication system.
VR applications can also benefit from the knowledge of the user’s identity, especially for a multi-user VR environment where the VR headset is shared. For example, in an VR educational application, the system can automatically detect the identity of the student and track his/her progress or activity for a teacher to monitor. In future, a metaverse [
7] can potentially be used for some of these applications and it would become very critical to detect the identity of the users in such multi-user social environments.
A traditional non-VR system generally requires a user ID and a password for user identification. However, such traditional approaches are not ideal for a VR system since they require typing characters using a virtual keyboard, which is inefficient [
8]. Thus, to avoid such traditional identification methods, AR/VR researchers focused on other methods for identifying or authenticating users. Microsoft HoloLens 2, an augmented reality device, has iris-based user authentication. However, it is limited to only 10 users [
9], thereby limiting its shared use for larger groups. Pfeuffer et al. [
10] designed a VR task that can track hand, head, and eye motion data to identify users. Liebers et al. [
11] developed games, applications, and 360-degree movies to collect gaze behavior and head-tracking data to identify users. Another research study [
12] shows that we can identify users without designing a specific VR task. Their machine-learning-based system collected motion data from 511 users, observing 360-degree videos within a single session, and it was able to identify users with 95% accuracy. However, the limitation of their experiment was that all data recorded from the participants were from a single session of around 10 min duration and from standing participants. Their method requires long periods of time and resources to collect user data and extract many features for training the machine learning models. Our proposed approach can identify users, with over 98% accuracy, even with minimal features from multiple session from a small set of users (34 to be precise) without any explicit identification tasks.
In this paper, we propose a machine learning- and deep learning-based system that can identify users using minimal eye-gaze-based features collected from multiple sessions from 34 participants, and it can achieve an accuracy of over 98%. The minimal set of features helps reduce the computation cost and was identified using the recursive feature elimination algorithm [
13]. Additionally, our system does not have any specific task designed to identify users. We collected the eye-gaze data of users while attending an educational VR field trip where an avatar explains the objects in the scene (a solar field) using audio, animations, and text slides. We tested the accuracy of several machine learning and deep learning algorithms (such as RF, kNN, LSTM, and CNN). We discuss our designs and the implications of our results. We believe that this approach could be applied to similar VR applications for identifying users with minimal eye-gaze features.
2. Related Work
To identify users, the most important thing to consider is what type of features or behaviors are unique to each user. Previous researchers investigated different methods for identifying users. For example, in the last decade, user’s touch motion behaviors on a smartphone have been studied to identify users [
14,
15,
16]. Different user characteristics and the use for person identification from soft biometrics (such as hair, height, age, gender, skin tone, facial features, etc.) have been surveyed by previous researchers [
17]. Eberz et al. [
18] used body motions as behavioral biometrics for security research. Jeges et al. [
19] measured height using cameras to identify users.
Eye movements such as saccadic vigor and acceleration cues have been used for user authentication [
20] with reasonably good accuracy. Gaze-based authentication could be either explicit or implicit. Explicit gaze-based authentication refers to the use of eye movements to explicitly verify identity. In this type of authentication, the user has to first define a password that involves consciously performing certain eye movements. The user then authenticates by recalling these eye movements and providing them as input. Examples of such systems include EyePass [
21], Eye gesture blink password [
22], and another work by De Luca et al. [
23], where the password consists of a series of gaze gestures. Implicit Gaze-based Authentication refers to the use of eye movements to implicitly verify identity; it does not require the user to remember a secret, but it is based on inherent unconscious gaze behavior and can occur actively throughout a session [
24,
25,
26]. Our proposed machine learning approach is a step towards designing an implicit eye-gaze based authentication system.
AR/VR researchers have explored a variety of bio-markers based on motion data (head motion, body motion, eye motion, etc.) for user authentication. Li et al. designed and implemented a VR task to identify users [
27] where the system asked users to nod their heads in response to an audio clip, and this head motion was then used to identify users. Lohr et al. [
28] designed a framework for an authentication system using 3D eye movement features. Mustafa et al. [
29] found that head pointing motion from Google cardboard sensors can be used to identify users. Motivated by swipe-based authentication pattern on mobile devices, Olade et al. [
30] introduced a SWIPE authentication system into VR applications. Their results showed that the SWIPE authentication was effective, although it was slower than the mobile version. Biometric identification systems in VR developed by Liebers et al. [
11] used gaze behavior and head orientation. Another system called Gaitlock [
31] can authenticate users using their gait signatures obtained from the on-board inertial measurement units (IMUs) built into AR/VR devices. Pfeuffer et al. [
10] discussed behavioral biometrics in VR to identify people using machine learning classifiers such as SVM and Random Forest with features obtained from head tracking, hand tracking, and gaze tracking data. However, the overall accuracy they achieved was 40% across sessions, which was very poor and impractical for real-world applications. Another study [
32] created a continuous biometric identification system for VR applications using kinesiological movements (head, eye, and hand movements). Their system had a VR task designed to collect kinesiological data for the machine learning model.
Liebers et al. [
33] identified users using biometrics data collected using two specific VR tasks (bowling and archery). They also explored if normalizing biometric data (arm length and height) could improve accuracy, and their results suggest that this normalization leads to a better accuracy (upto 38% in some cases). However, a specific VR task designed to identify users may not be always required. Miller et al. [
12] shows that we can identify users without designing a specific VR task. They collected motion data from the VR headset and the controllers while participants watched a 360-degree VR video. Their experiment design had no intention of identifying users. Their machine-learning-based system collected motion data from 511 users and were able to identify users with a 95% accuracy. Some of their features have straightforward spatial meaning. For example, the Y position of the VR headset was the most important features of their dataset. This feature corresponds to the user’s height and the classification accuracy decreases by about 10% if we drop this feature. A major drawback of such systems is that they collected data from a single session of around 10 min and the experiment required a lot of time and resources to collect user data for training machine learning models. Another research study [
34] addressed the limitations of this work [
12] and claimed that user identification may not be applicable by collecting data between two VR sessions from two different days. They found that the accuracy dropped over 50% when machine learning models were trained with single-session data and then tested it with another session’s data collected one week later. One possible reason for obtaining lower accuracies could be that they used only machine learning models and it is possible that machine learning models may not generalize well with the same but complex relation of features if collected one week later. Furthermore, eye-gaze data were also studied for its role in security-related applications [
35] such as user authentication, privacy protection, and gaze monitoring in security-critical tasks.
Reducing the feature set to a minimal set of important features is very critical for a classification system since it has a significant impact on the time and space cost of the classification algorithm. Feature selection (FS) is a widely used technique in pattern recognition applications. By removing irrelevant, noisy, and redundant features from the original feature space, FS alleviates the problem of overfitting and improves the performance of the model. There are three categories of FS algorithms: filters, wrappers, and embedded methods, based on how they interact with classifiers [
36,
37]. Support vector machine recursive feature elimination (SVM-RFE) is an embedded FS algorithm proposed by Guyon et al. [
13]. It uses criteria derived from the coefficients in SVM models to assess features and recursively removes features that have small criteria. SVM-RFE does not use the cross-validation accuracy on the training data as the selection criterion; thus, it is (1) less prone to overfitting; (2) able to make full use of the training data; and (3) much faster, especially when there are a lot of candidate features. As a result, it has been successfully applied in many problems, particularly in gene selection [
13,
38,
39,
40,
41]. Our proposed approach uses this SVM-based recursive feature elimination algorithm to identify a minimal set of features that are important for user identification.
Most of the prior research used eye tracking, hand tracking, head tracking, body normalization, and many combinations of feature sets to identify users. Based on this previous research, our initial research question was “do we need to have multi-modal tracking data (from head, hand and eye gaze etc.) to identify users and which features are more sensitive for identification?” Very little research has been conducted to find optimal set of features and the possibility of avoiding multi-modal tracking data for user identification in VR. This prior study motivated us to see if we can identify users based on eye-gaze data alone with reasonable accuracies without designing any specific VR task for user identification. In our experiment, we designed an educational VR environment mimicking a solar field trip to collect eye gaze data. This task is an example of a real world classroom scenario requiring no additional tasks for the authentication process itself. Our work seeks to find the answers to the following research questions:
RQ1: To what extent could we identify users without designing a specific VR task for authentication alone?
RQ2: To what extent can we identify users using minimal features obtained from eye gaze data in VR?
RQ3 Which machine learning model works best, in terms of classification accuracy, with eye-gaze data to identify users?
RQ4: To handle privacy issue, we need to find which eye-gaze features are more important for user identification so that sensitive features can be encoded while sharing gaze data?
4. Methodology
4.1. Experimental Design and Data Collection
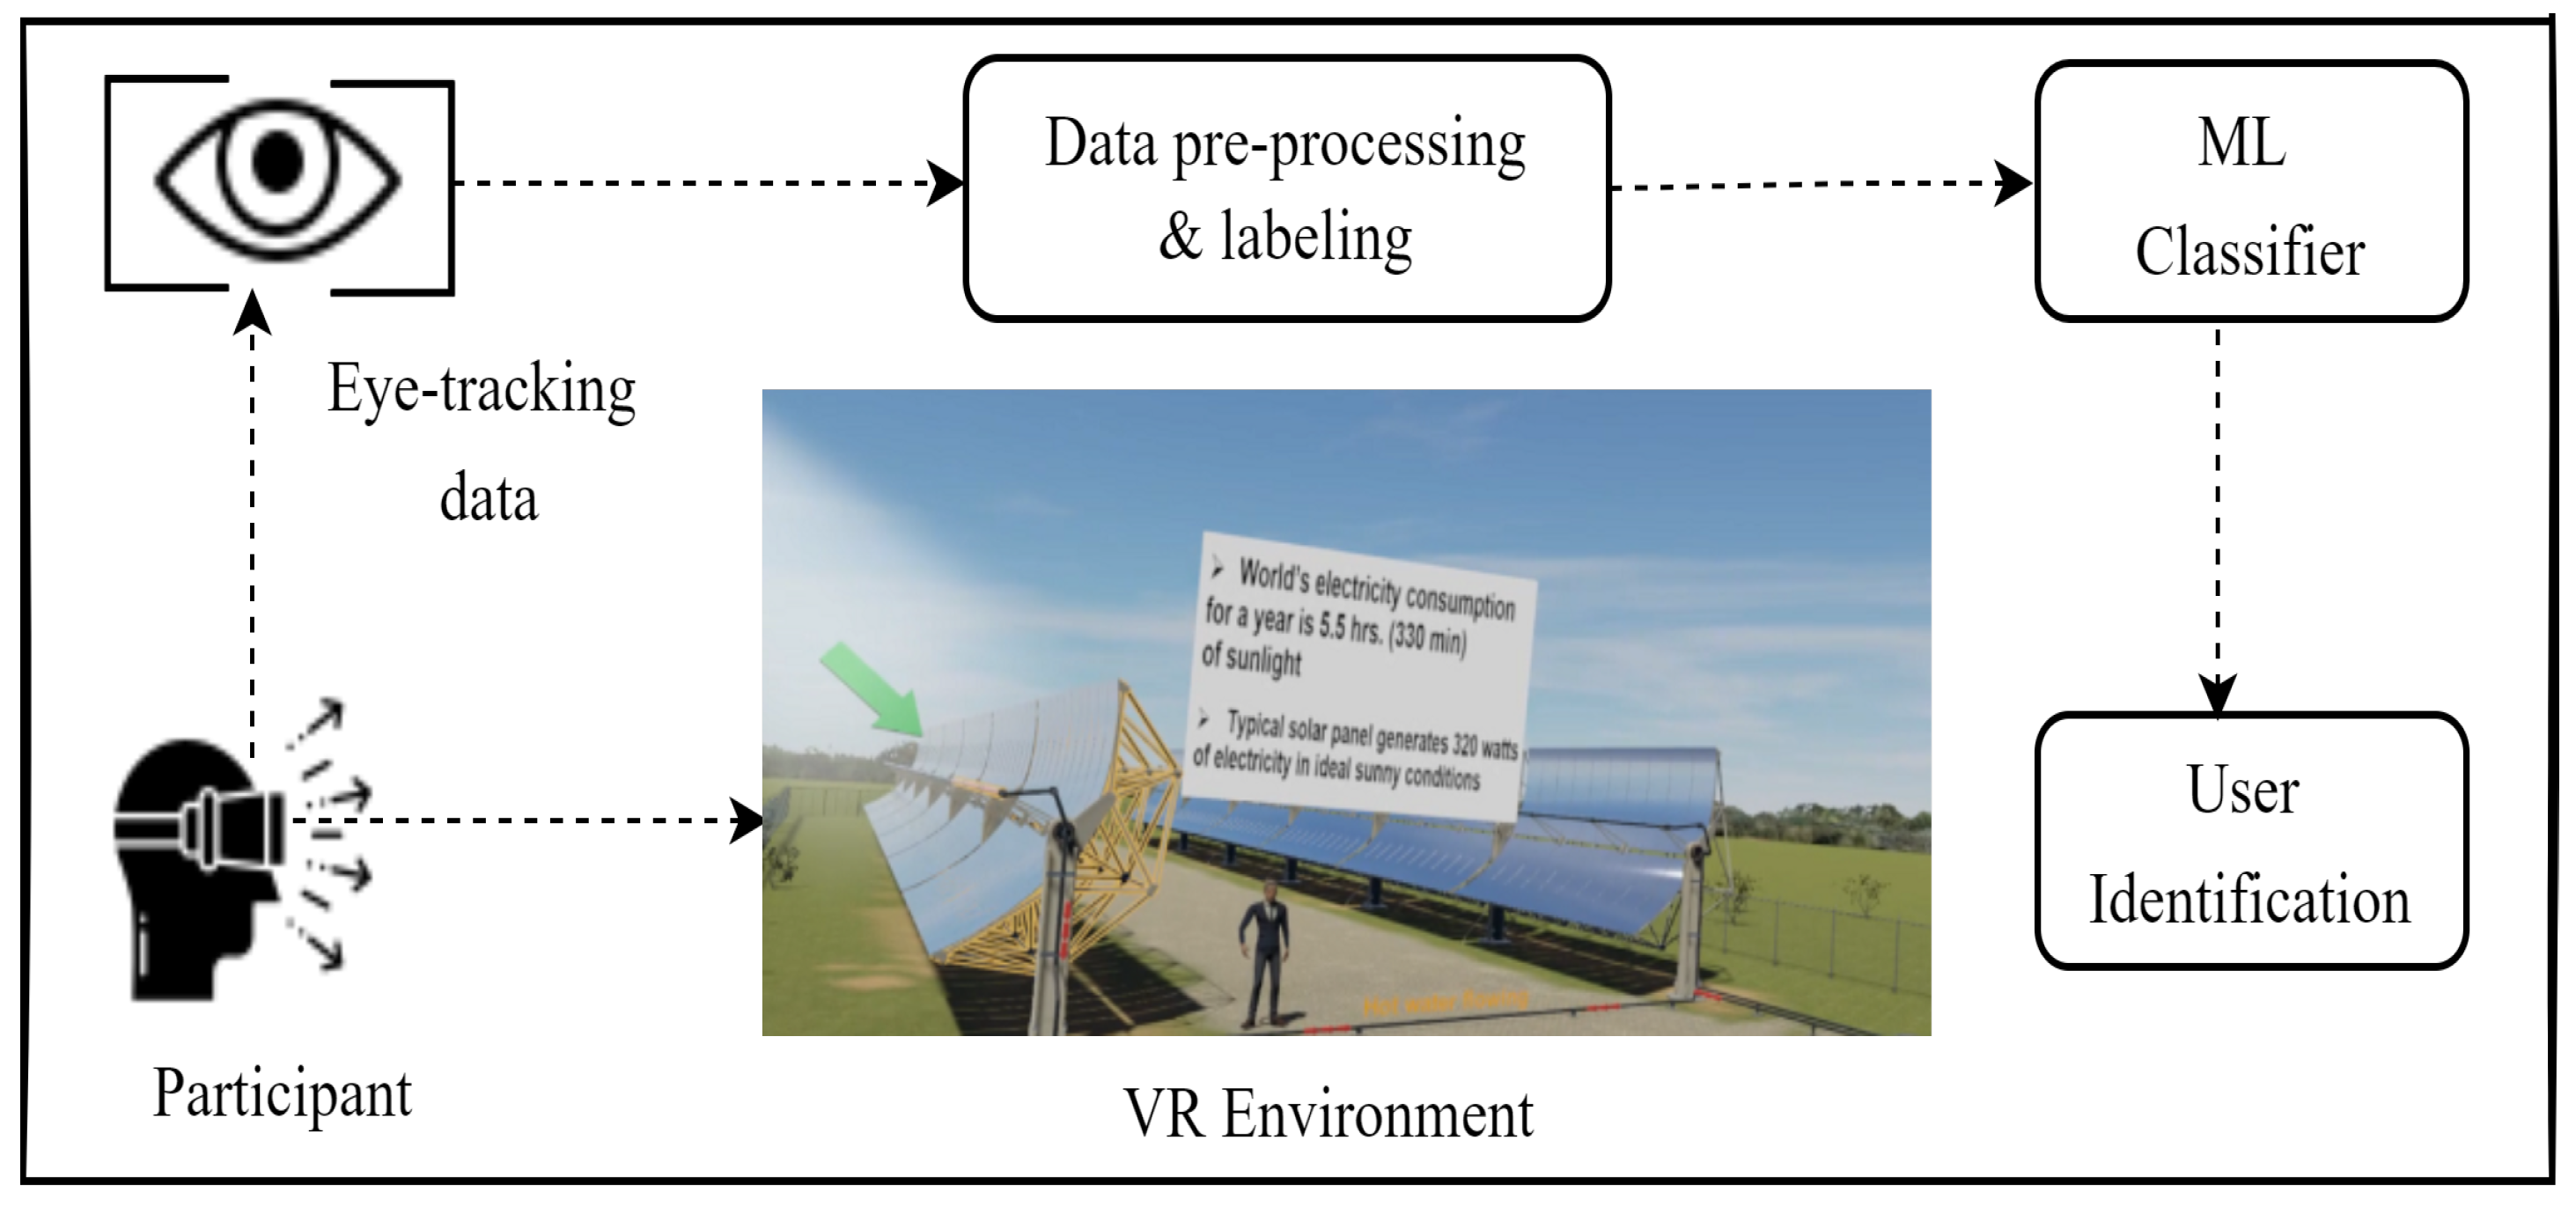
In our experiment, we designed an educational VR environment mimicking a solar field trip to collect eye-gaze data. This task is an example of a real-world classroom scenario requiring no addition tasks for the authentication process itself. The design of the environment is discussed in the previous section. We collected eye gaze data from our VR environment to train and test several machine learning models for identifying users. Four models were tested: random forest (RF), k-nearest-neighbors (kNN), long short-term memory (LSTM), and convolutional neural network (CNN). An overview of our experiment is shown in
Figure 2.
Due to COVID-19 risks, participants wore lower face masks in combination with disposable VR masks. Headsets were disinfected per participant. Participants were briefed about the study’s process, and they provided signed consent. Subsequently, the participant was seated at a station, 2 m away from the moderator. They then put on the VR headset (HTC Vive Pro Eye), and the integrated eye tracker was calibrated by software. Participants experienced the educational VR experience. The VR session was divided into 4 small sessions (ranging from 100 s to 282 s), each covering a concept. At the end, we also asked our participants if they have any feedback about our VR tutorial and which components of the presentation distracted them or helped them with learning.
Raw eye-gaze data were collected throughout the experiment and provided by the SRanipal API of Vive pro eye headset, including timestamps, eye diameter, eye openness, eye wideness, gaze position, gaze direction, and HTC Vive’s reported eye-gaze origin value (one 3d vector for each eye). The gaze sampling rate was 120 Hz. Each frame included a flag used to discard readings reported as invalid by the tracker. For example, closing the eyes results in invalid gaze direction. Invalid data points were discarded while training the machine learning model.
4.2. Participants and Apparatus
We recruited 34 study participants (25 male and 9 female) from the university. Their ages ranged from 19 to 35 years (mean 24.6) and 16 of them had prior experiences with a VR device. The experiment’s duration for four sessions was around 10 min and the total duration was about 20 to 25 min, including consent time, eye-tracker calibration, and a brief chat about their VR experience.
The experiment used a desktop computer (Core i7 6700K, Microsoft Windows 10 Pro, NVIDIA GeForce GTX 1080, 16 GB RAM ) and Unity 3D v2018.2.21f1 software to implement VR tasks. Eye gaze data were collected at 120 Hz using Vive Pro Eye. We used scikit-learn, Recursive Feature Elimination (RFE), TensorFlow, and keras libraries in Python (version 3.8.8) for machine learning scripts.
4.3. Data Pre-Processing
For features with three components (such as left eye gaze origin with X, Y, and Z components), we separated them as individual features. We also tested other scenarios such as taking average of X, Y, and Z components or averaging over two eyes, etc. However, they were discarded since they did not produce good classification accuracy. Thus, we ended up with 19 features: timestamp, left-eye diameter, right-eye diameter, left-eye openness, right-eye openness, left-eye wideness, right-eye wideness, left-gaze origin (X, Y, and Z), right-gaze origin (X, Y, and Z), left-eye gaze direction (X, Y, and Z), and right-eye gaze direction(X, Y, and Z).
Out of 34 participants, we noticed that 5 participant’s data for left- and right-eye gaze origins (X, Y, and Z) were missing (about 10% data for each participant). We filled these missing data values with the average of the available data values for that participant. After processing raw data, our overall dataset size was 268,0347. The number of data points for every users was close to each other. Since we had 34 participants, each participantwasis assigned a user ID from 0 to 33. Each data point in the dataset was labeled with the corresponding user ID. This labeling is required for supervised classification models.
Since our raw data are numerical with a different range for each feature, we used normalization with min–max normalization and standardization. Min–max normalizes the data range to [0, 1] as follows:
and data standardization is computed as follows.
We tried each technique separately for the entire dataset of all participants. We found that classifiers had improved accuracies with standardization. Thus, we chose standardization for our analysis.
4.4. Feature Selection
After pre-processing raw eye-gaze data, we stacked the data from all sessions of the VR experience and we applied a Recursive Feature Elimination (RFE) algorithm with default parameters to select a subset of the most relevant features among all features. We wanted to minimize our feature set since fewer features would allow machine learning models to run more efficiently in terms of time and space complexity. We found that X, Y, and Z features of left- and right-eye gaze origins were most important (rank from 1 to 6) and other features such as diameter, openness, and wideness features had lower ranks (7 to 12) (see
Table 1). Thus, we created two feature sets. The first set contains 12 features with ranks from 1 to 12, and the second set contains features with ranks from 1 to 6 only (as shown in
Table 1). We discarded other features as they had lower ranks.
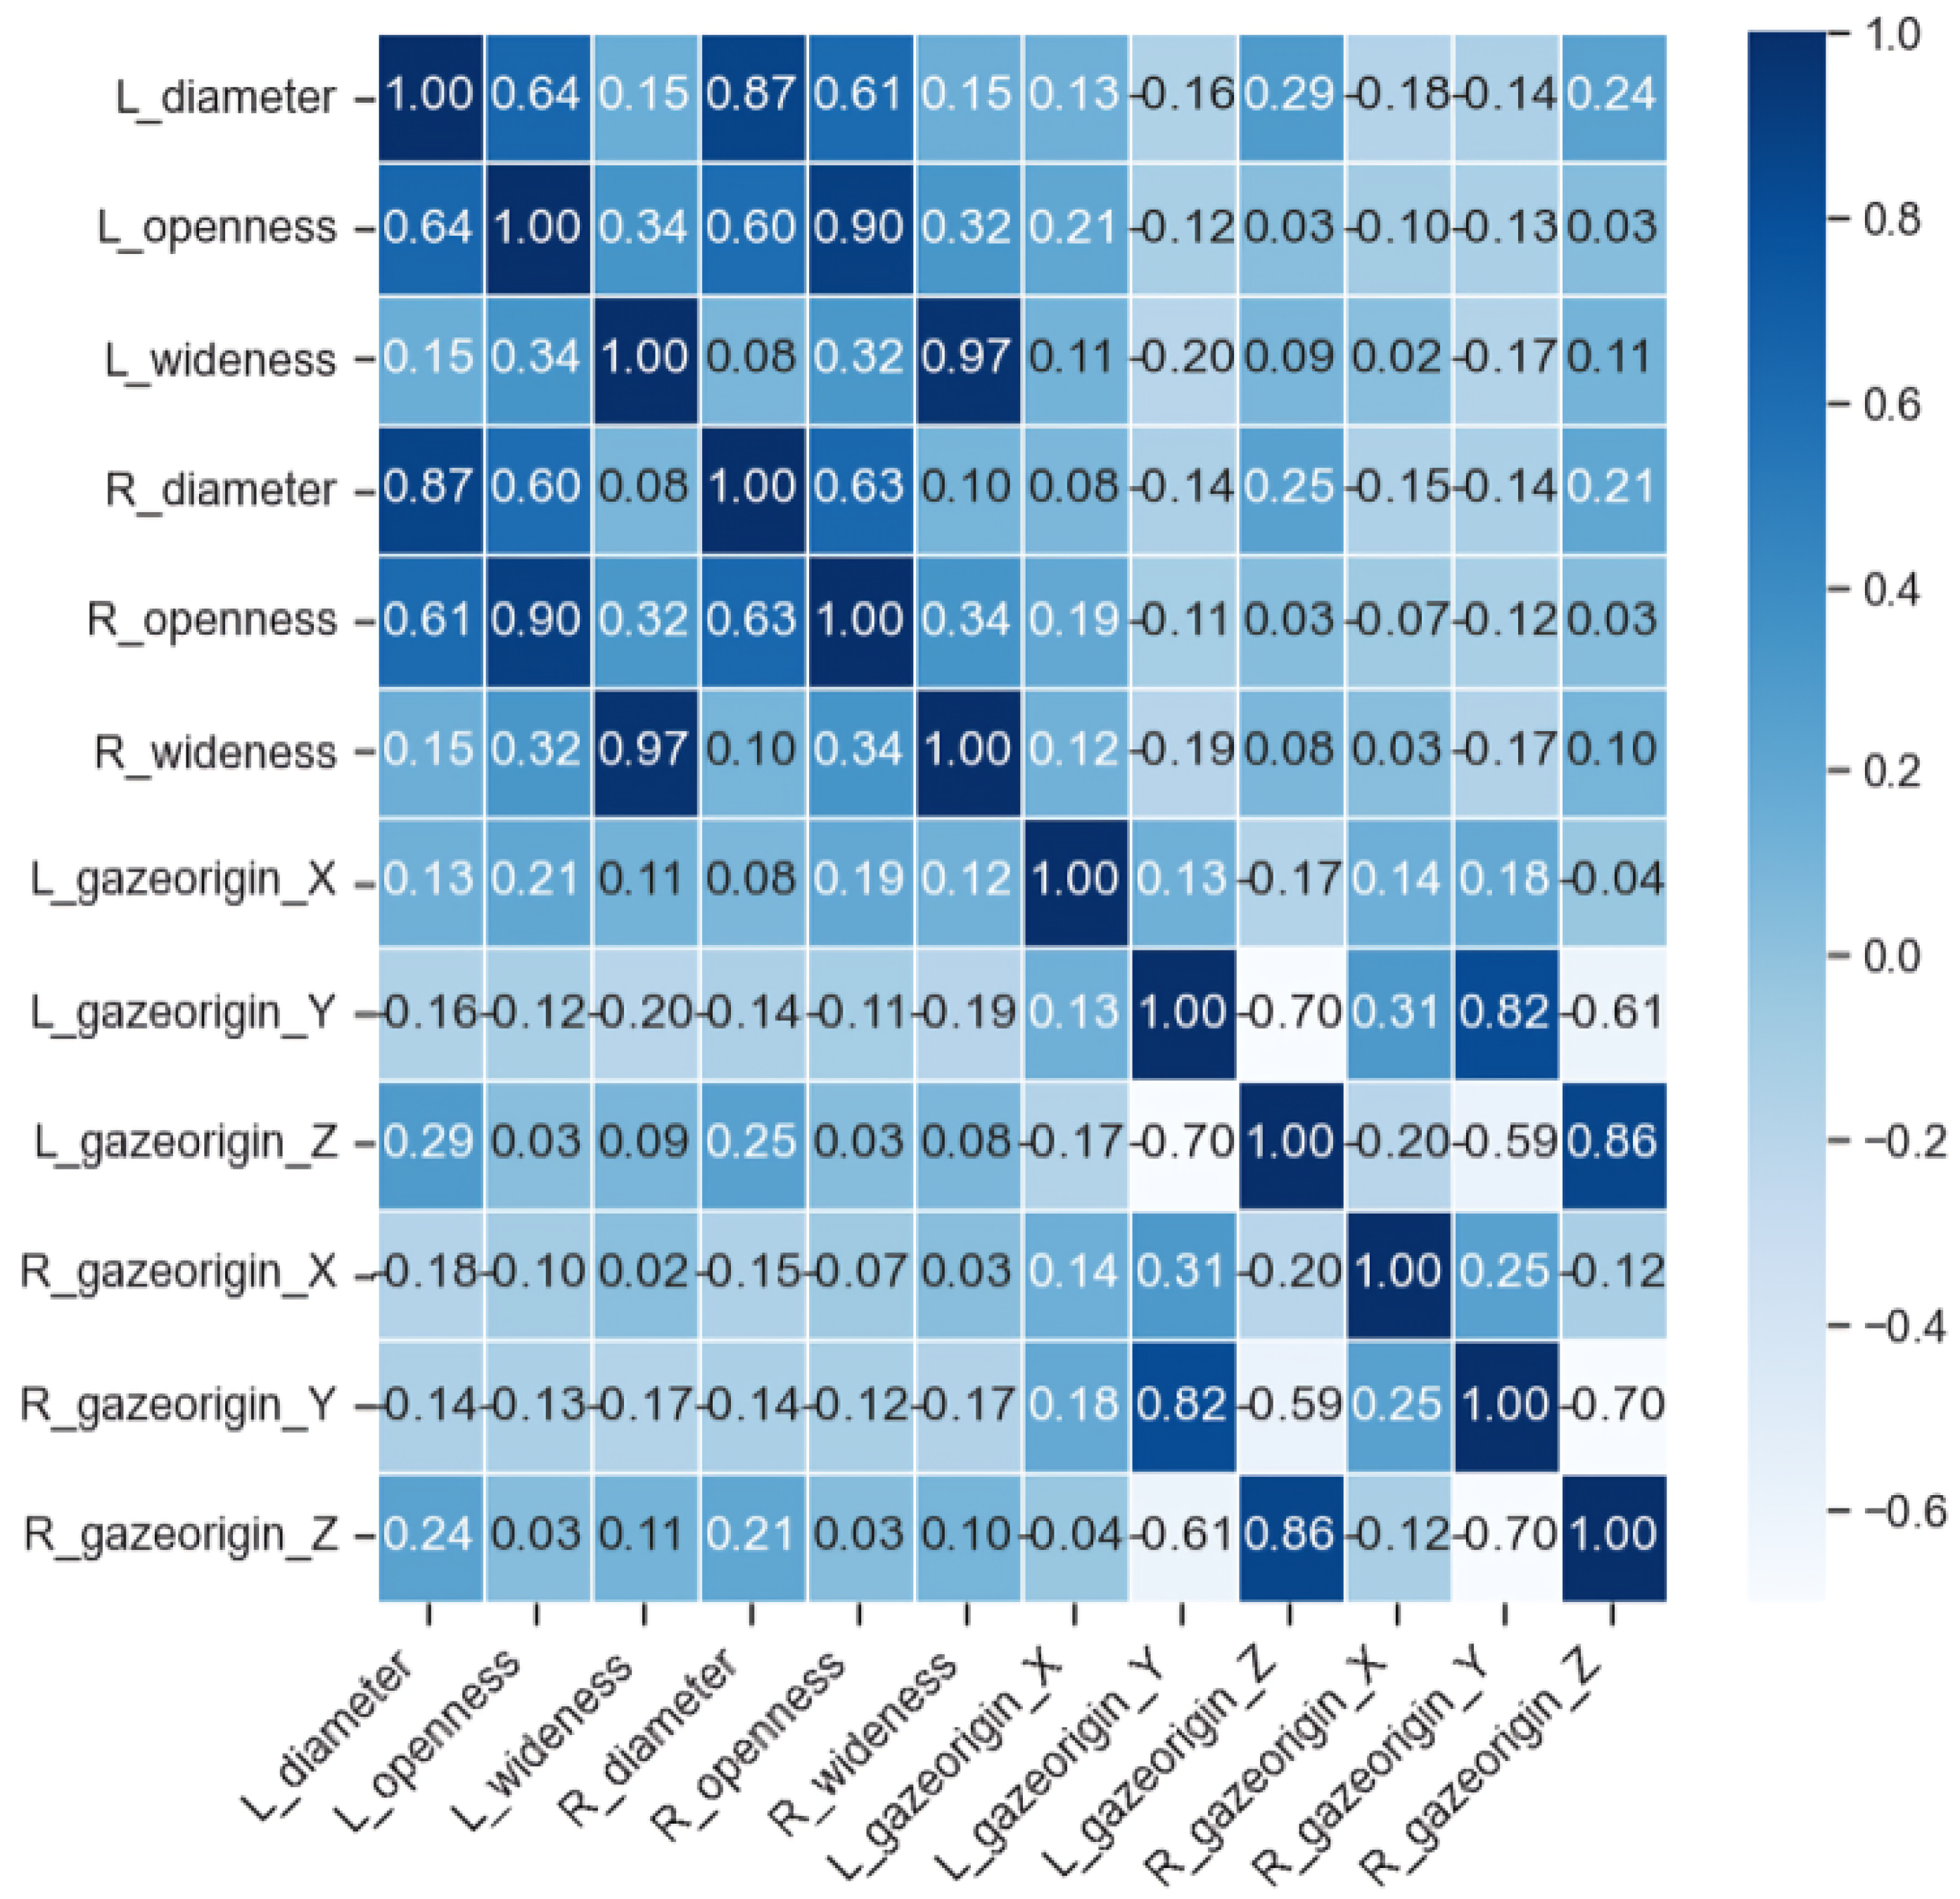
A correlation matrix of features is shown in
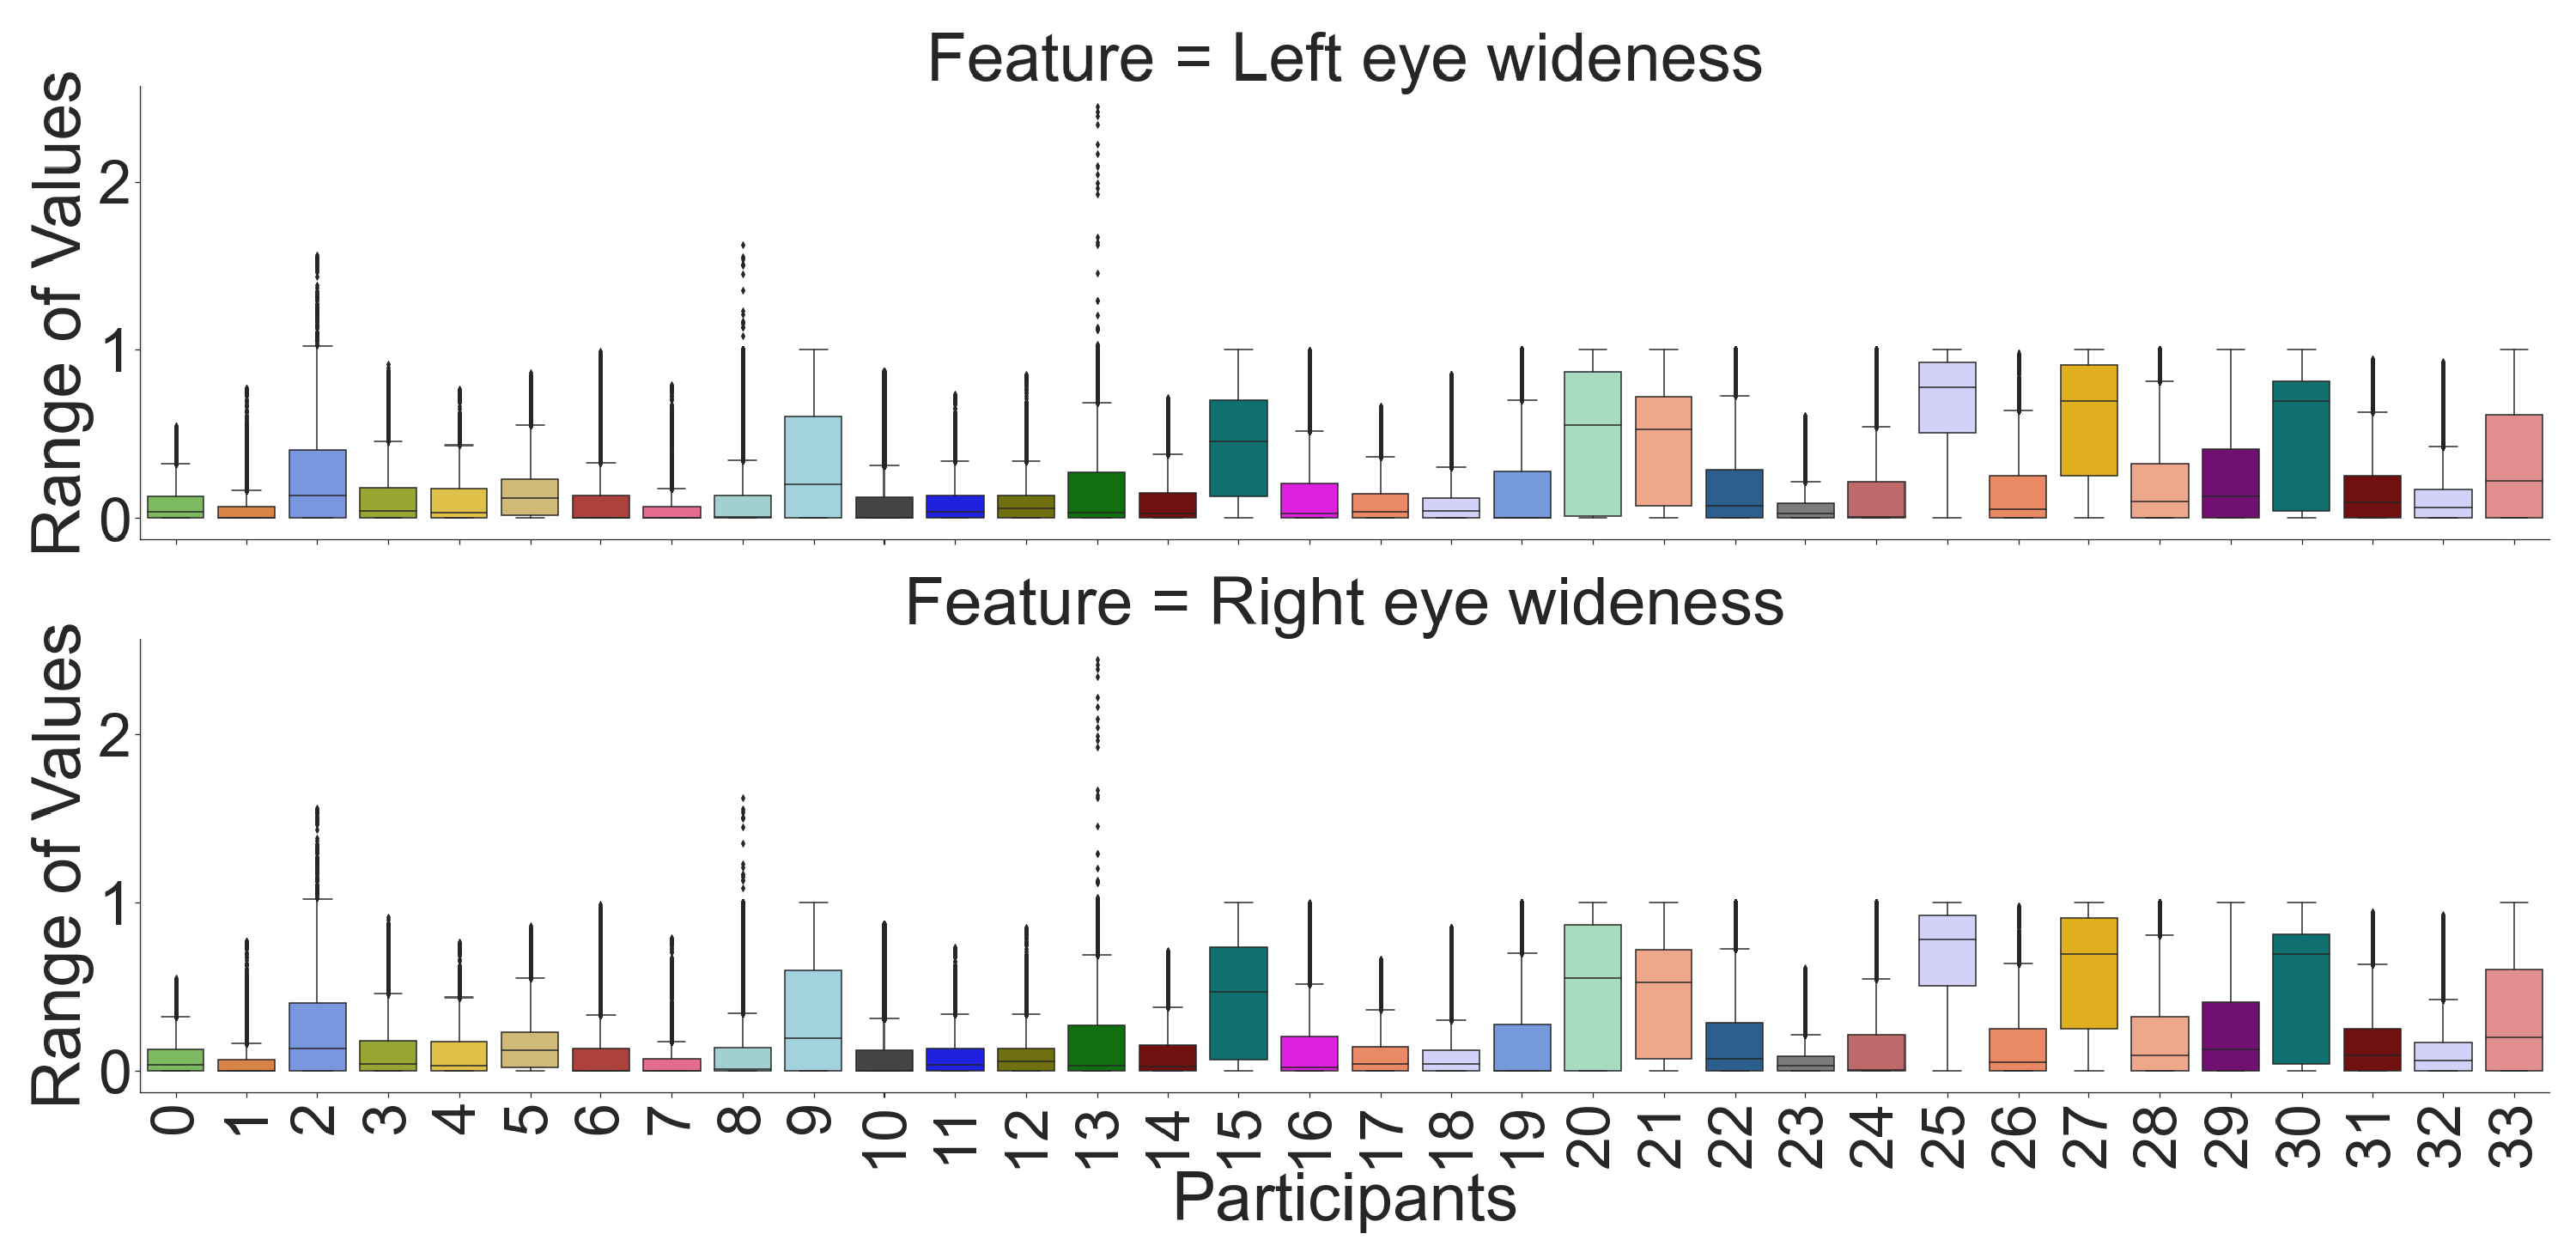
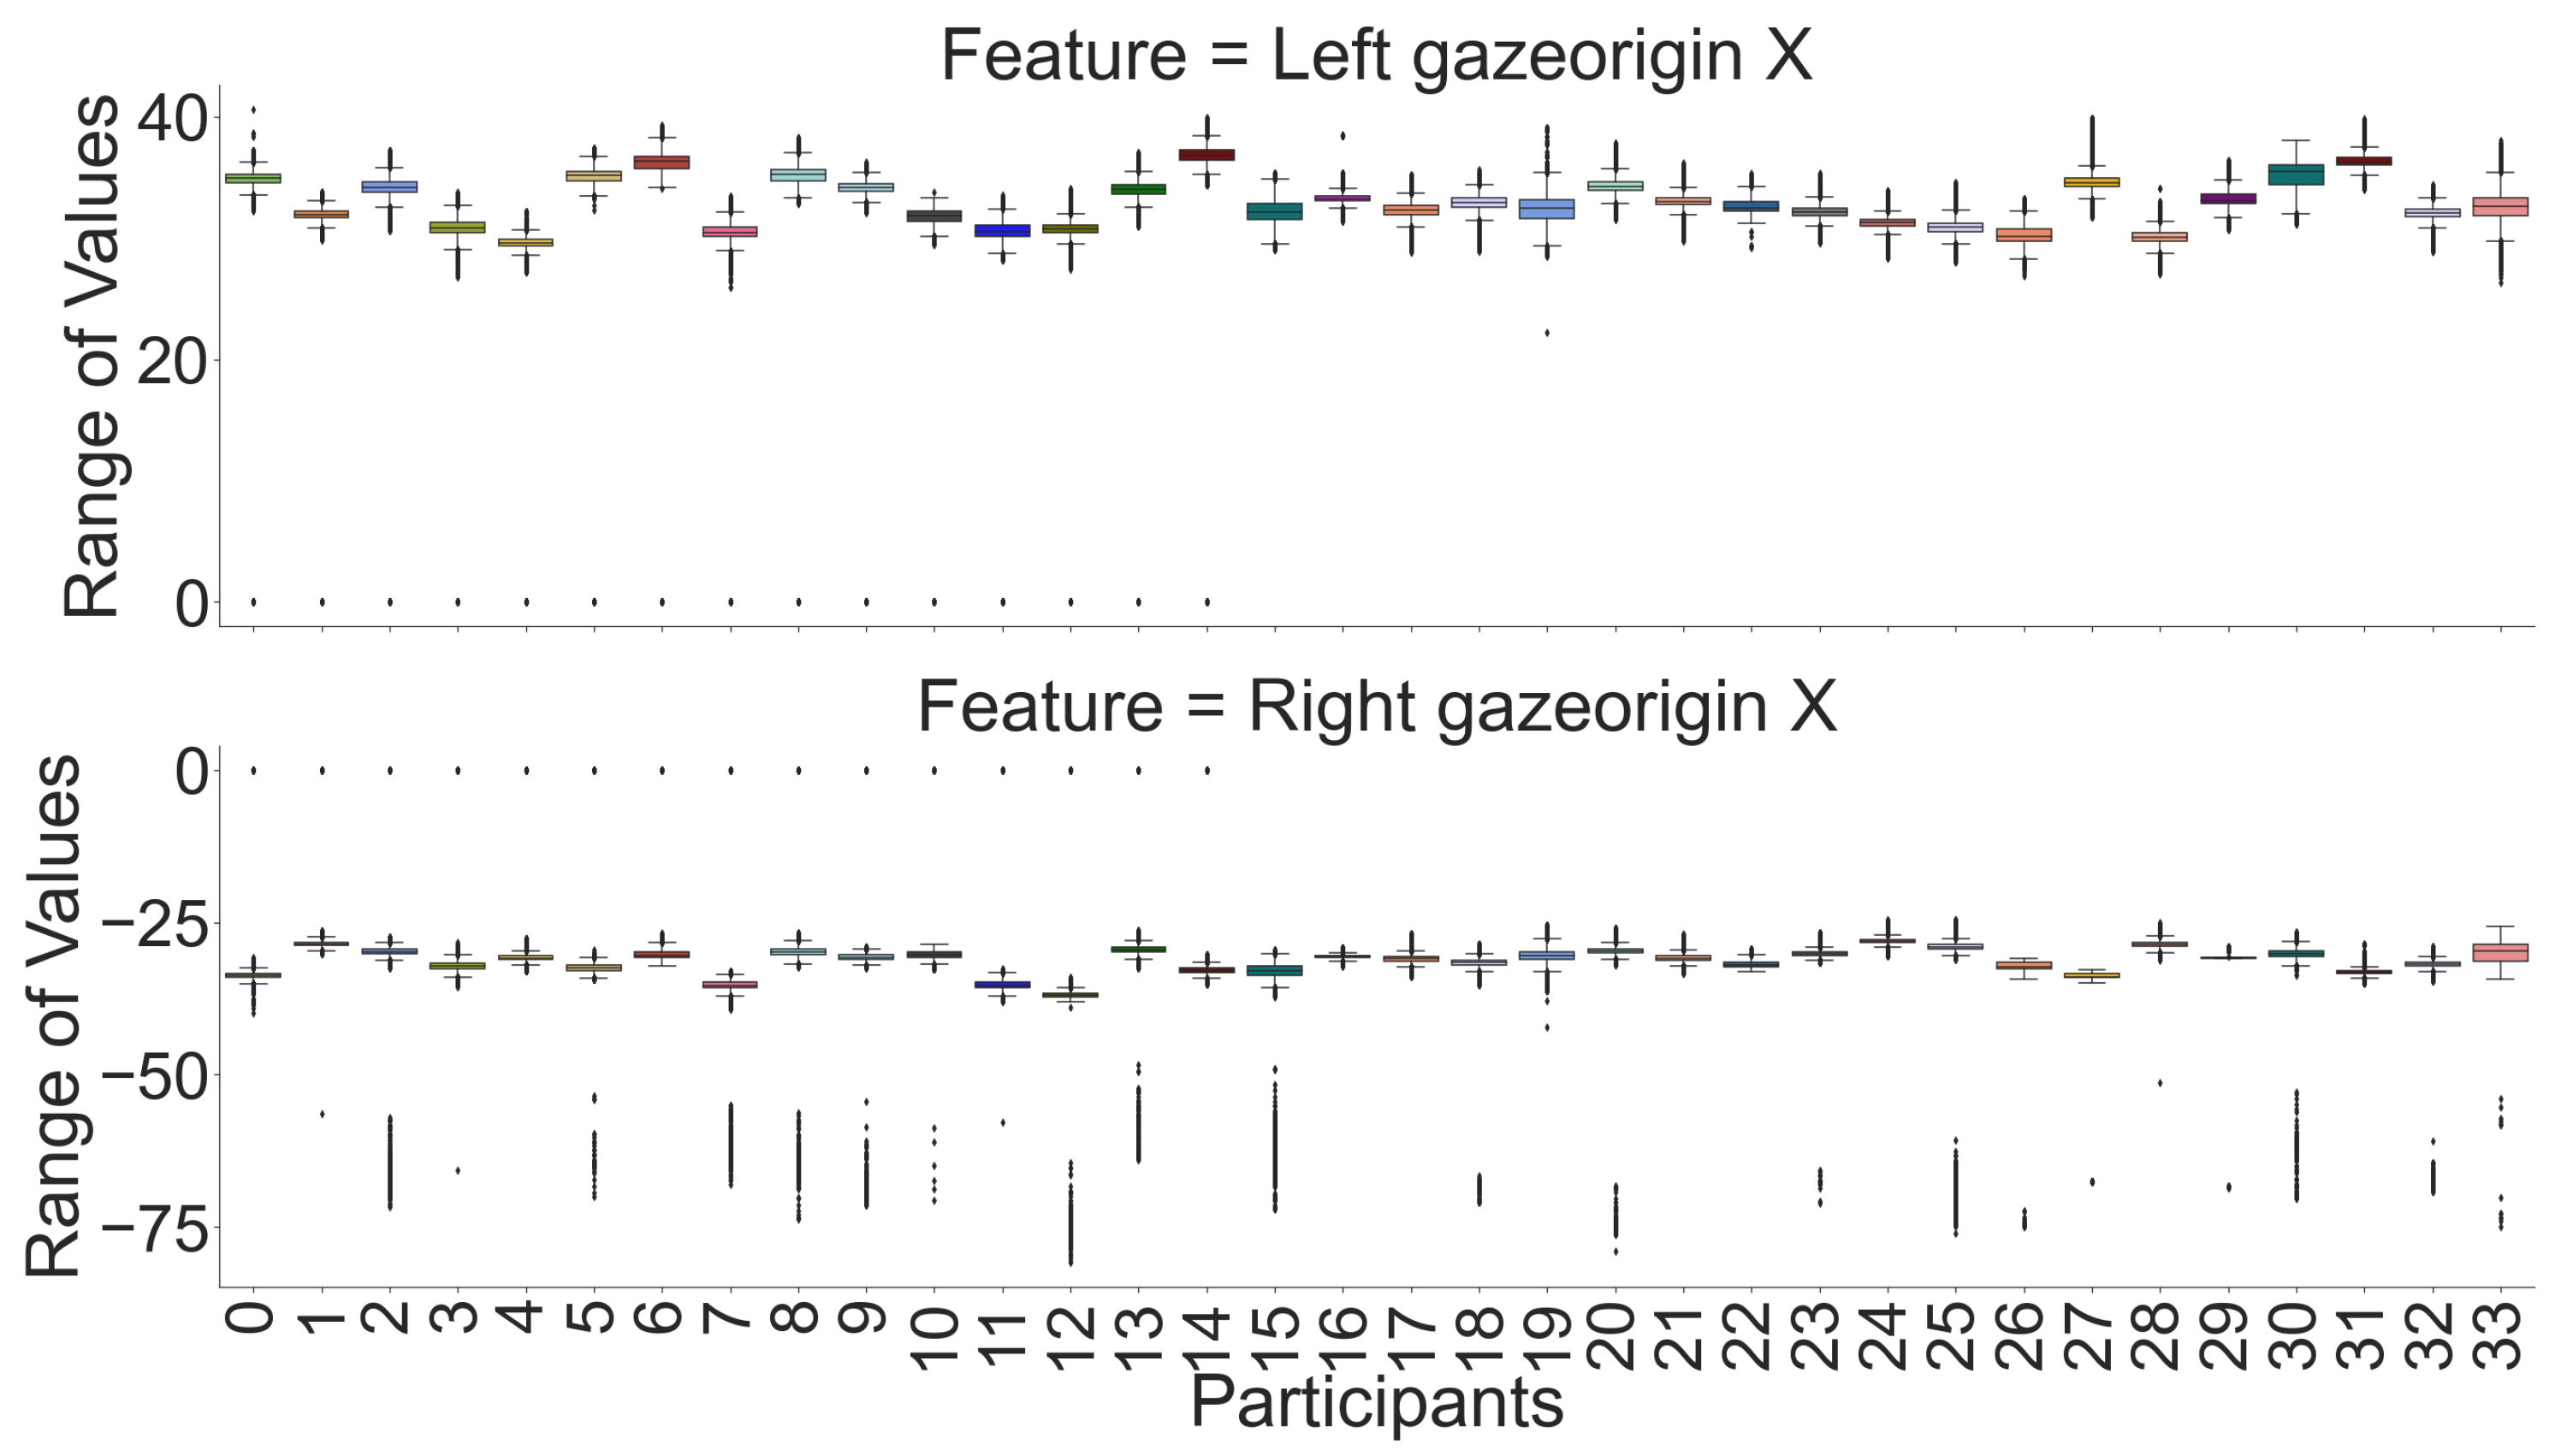
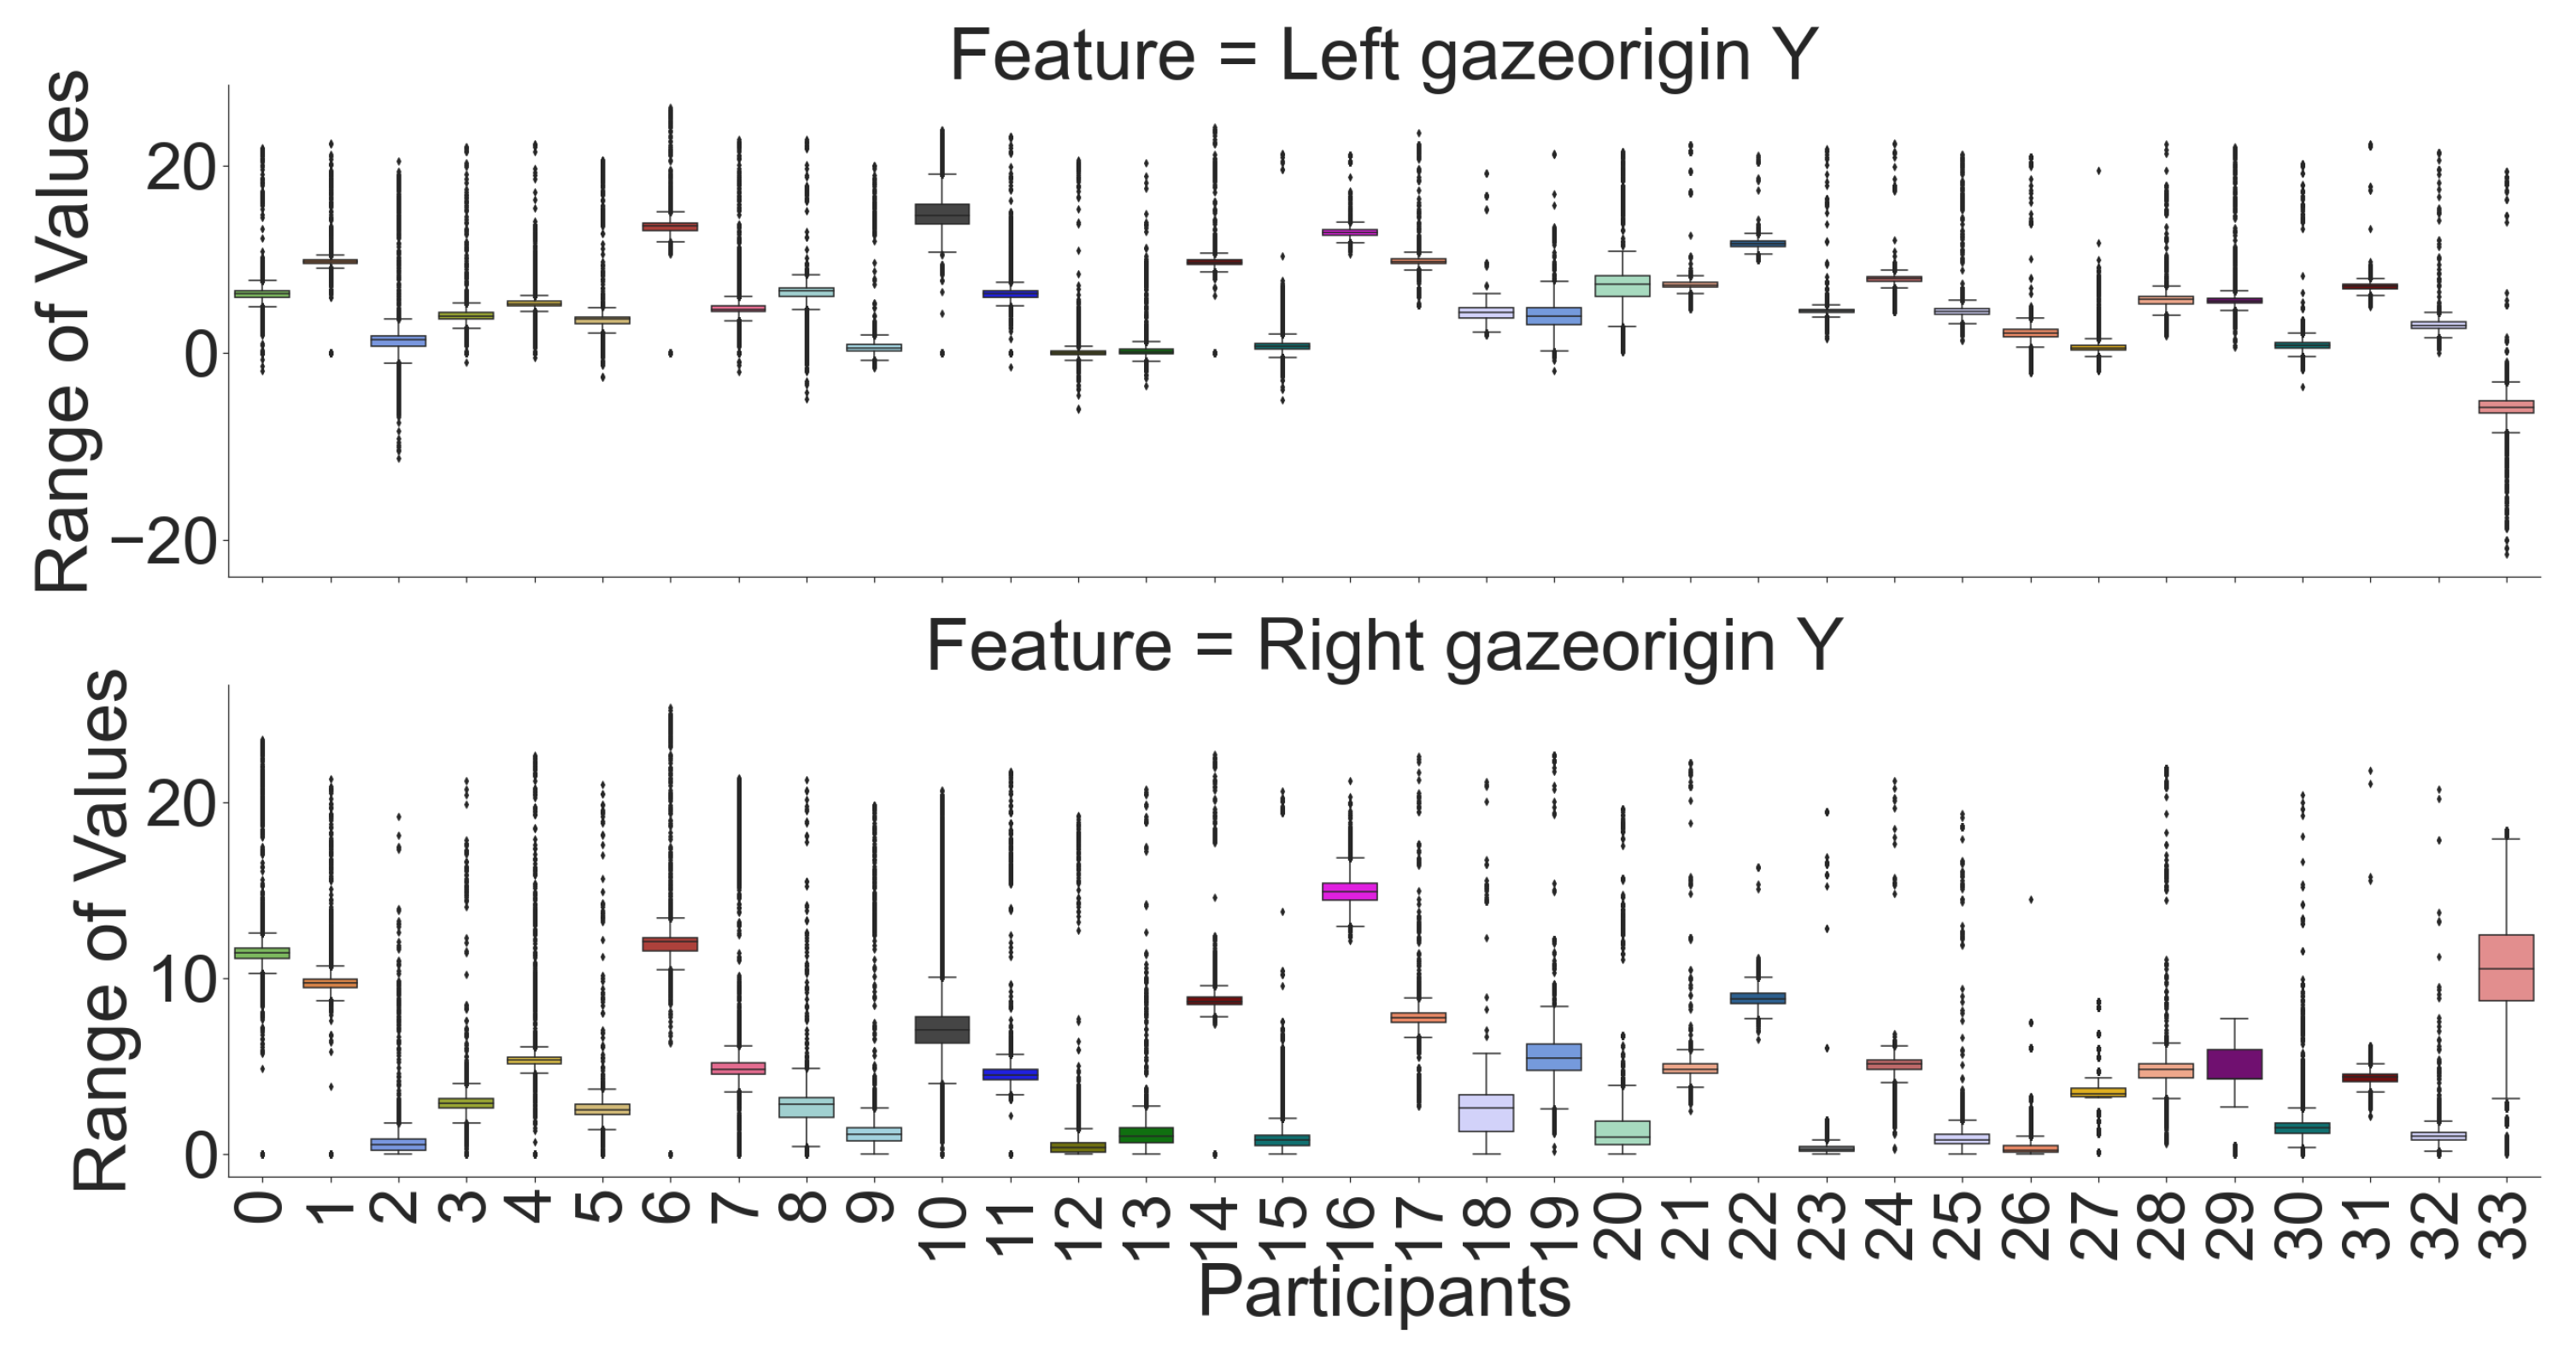
Figure 3) with a heatmap. We can see that for most features, there is a high correlation between the left and the right eye except for the X component of the gaze’s origin. However, Y and Z are negatively correlated with each other. Moreover, we used raw data for box plot visualizations (see
Figure 4,
Figure 5,
Figure 6,
Figure 7,
Figure 8 and
Figure 9) to see which features are unique for each participant, where each pair’s (left and right eye) features in the box plot indicates that the centers of the distribution (median value) for most of the participants are different. Although the centers of the distribution for some features (e.g., openness and wideness at
Figure 5 and
Figure 6) for a few participants were similar, the combination of our feature sets makes individual participants identifiable. According to recursive feature eliminations, heatmaps, and box-plot visualizations, the most important features are three-dimensional gaze origins among all features. In addition, we also evaluated which paired feature of the gaze origin contributed more to identifying users.
4.5. Classification Models
We considered two machine learning models, such as random forest (RF) and k-nearest-neighbors (kNN), and two deep learning models called convolutional neural network (CNN) and long short-term Memory (LSTM) for users identification. We chose to use RF and kNN based on previous research [
12] since they obtained very good results with these models for multi-class classification using gaze data. We also used two deep learning models, CNN and LSTM, since traditional machine learning models may not learn complex patterns of the data in a large dataset with many features and provide poor results. We chose the CNN model [
46,
47] since it can learn to extract features from a sequence of observations and can classify sequential data. Similarly, LSTM model can obtain the spatial and temporal features of eye-gaze data and provides powerful prediction capabilities [
47,
48].
Random Forest (RF): Random forest is an ensemble-learning method that construct multiple decision trees using subsets of data and votes on the results of multiple decision trees to obtain the prediction as an output of the model. We used the “RandomizedSearchCV” library from sklearn to optimize our hyperparameters for random forest, and we found the optimized parameter, where estimator = 200, max depth = 460, and max features = ’sqrt’. We plugged these into the model and reported the results.
k-Nearest-Neighbors (kNN): The kNN classifier implements learning based on the k nearest neighbors where the value of k is dependent on data. We adjusted k values to overcome overfitting (training error is low and test error is high) with respect to data variance. We evaluated from 1 to 10 to choose k value and we found that it works best for k = 5, and the Minkowski metric is the default parameter metric.
Convolutional Neural Network (CNN): We also applied CNN as a deep learning model, whereas the CNN layers (see
Table 2) are used for feature extraction from raw gaze data. The CNN model comprises two Conv1D layers with the ReLU [
49] activation function and two fully connected dense layers (
Table 2). The number of filters was 128 for the first two Conv1D layers, with a kernel size of 3. We used max pooling as the pooling operation with pool size 2. After the max pool operation, the output shape was reduced to (3, 128) and followed by a dropout layer of 40% to deal with overfitting. Then, the last dense layer was used for classification. We used the Adam optimizer [
50] with a learning rate of 10
and categorical cross-entropy as the loss function.
Long Short-Term Memory (LSTM): The long short-term memory (LSTM) network is a recurrent network that is capable of learning long-term dependencies in eye-gaze data. We used this LSTM model because it could capture both spatial and temporal features of eye-gaze data. We adjusted the hyper-parameter of the model where we used a dropout layer of 40% to deal with overfitting and ReLU as the activation function for the first LSTM layer and third dense layer. The last dense layer used a softmax activation function to classify 34 users as output. The model iterated over 50 epochs during training where the batch size, learning rate, and loss function were the same and taken from the above CNN model.
5. Results
We validated our models with both 12 and 6 feature sets. The highest overall accuracy for user identification is reported in
Table 3. We used a k-fold cross validation method to evaluate our classifiers as it is a well established and reduces data bias from the dataset [
51]. In our dataset, we used 5-fold cross validation in which the process is repeated five times, where out of five partitions, a single partition was used for validating/testing (20% of data) and the remaining partitions were used for training (80% of data). Then, we averaged this value over all five cross-validations to obtain a mean accuracy rating for our classifier. We also tested another scenario where we trained the model with 70% data and tested the models with the remaining 30% data. This scenario also produced very similar results. Thus, we have reported results from our 5-fold cross validation method. We also tested our classification method with new data where we used data from three sessions for training, and the remaining fourth session was used for testing. The 5-fold cross validation methods were not needed in this case since our test case is from a different VR session. We found that kNN performed over 99% accuracy, while other models performed similarly, with a best accuracy of over 98% with the 12 feature set and 6 feature set (see
Table 3). The learning history of our DL models on the validation samples show that both CNN and LSTM converge to higher accuracy and lower losses (see
Figure 10 for learning curve of CNN model).
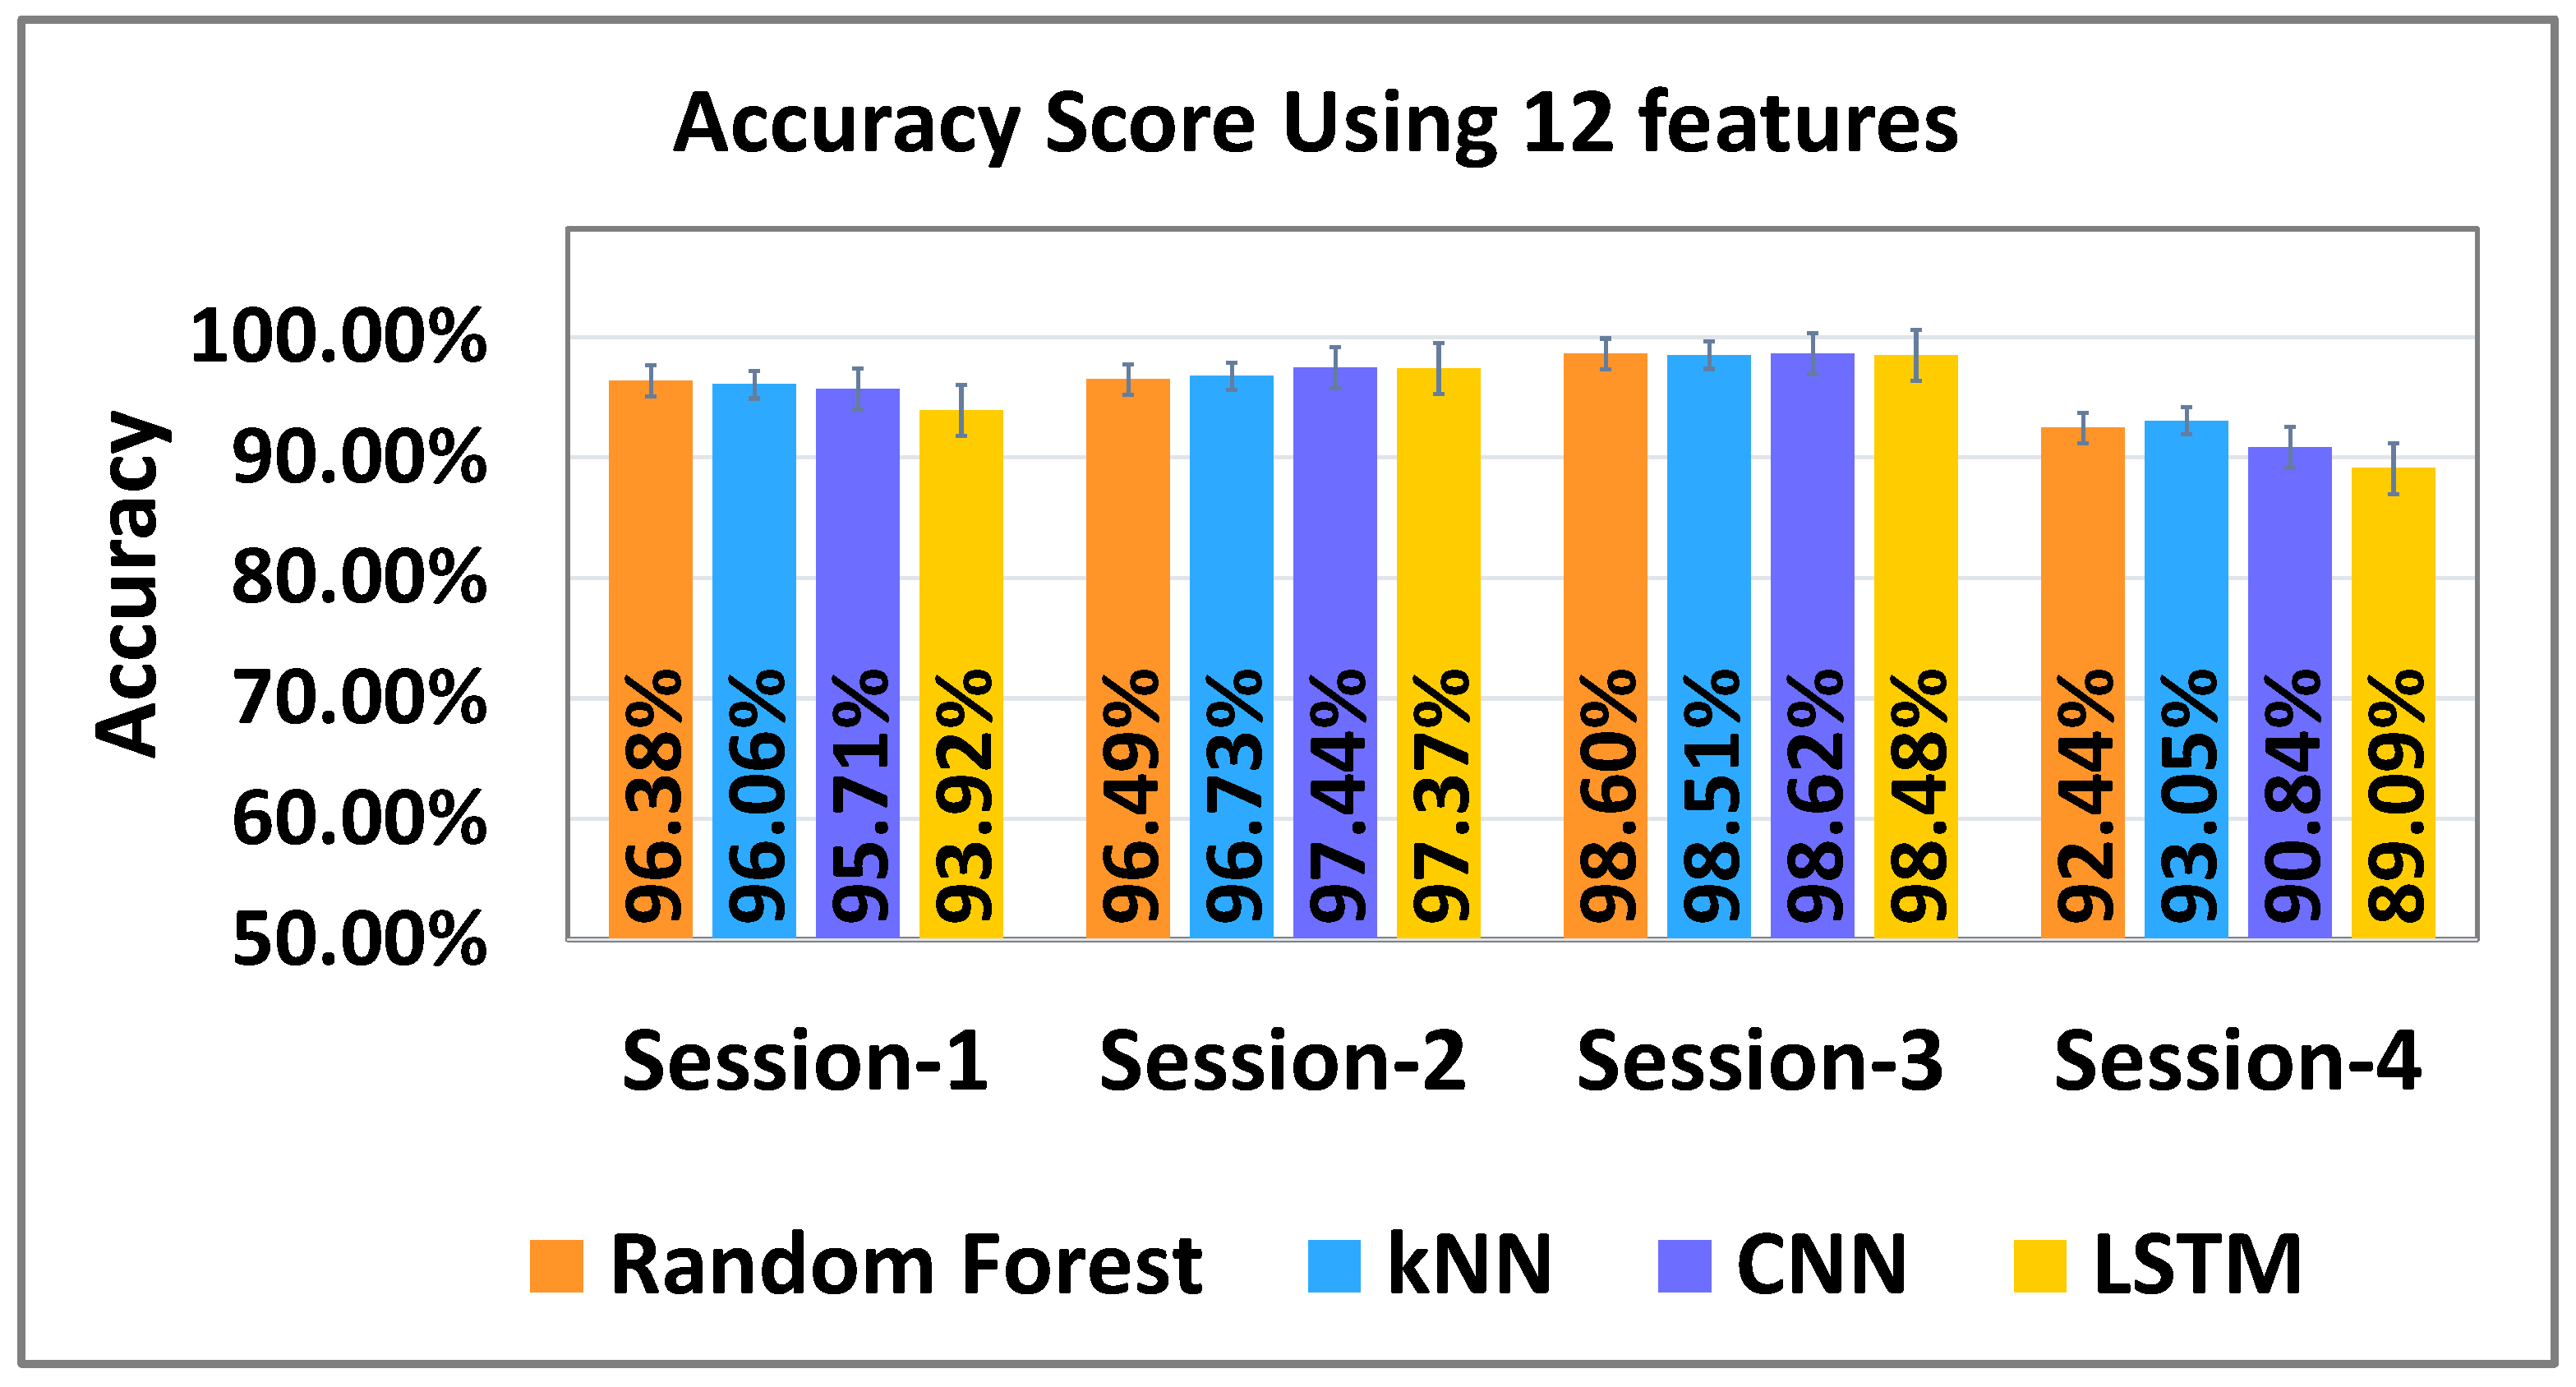
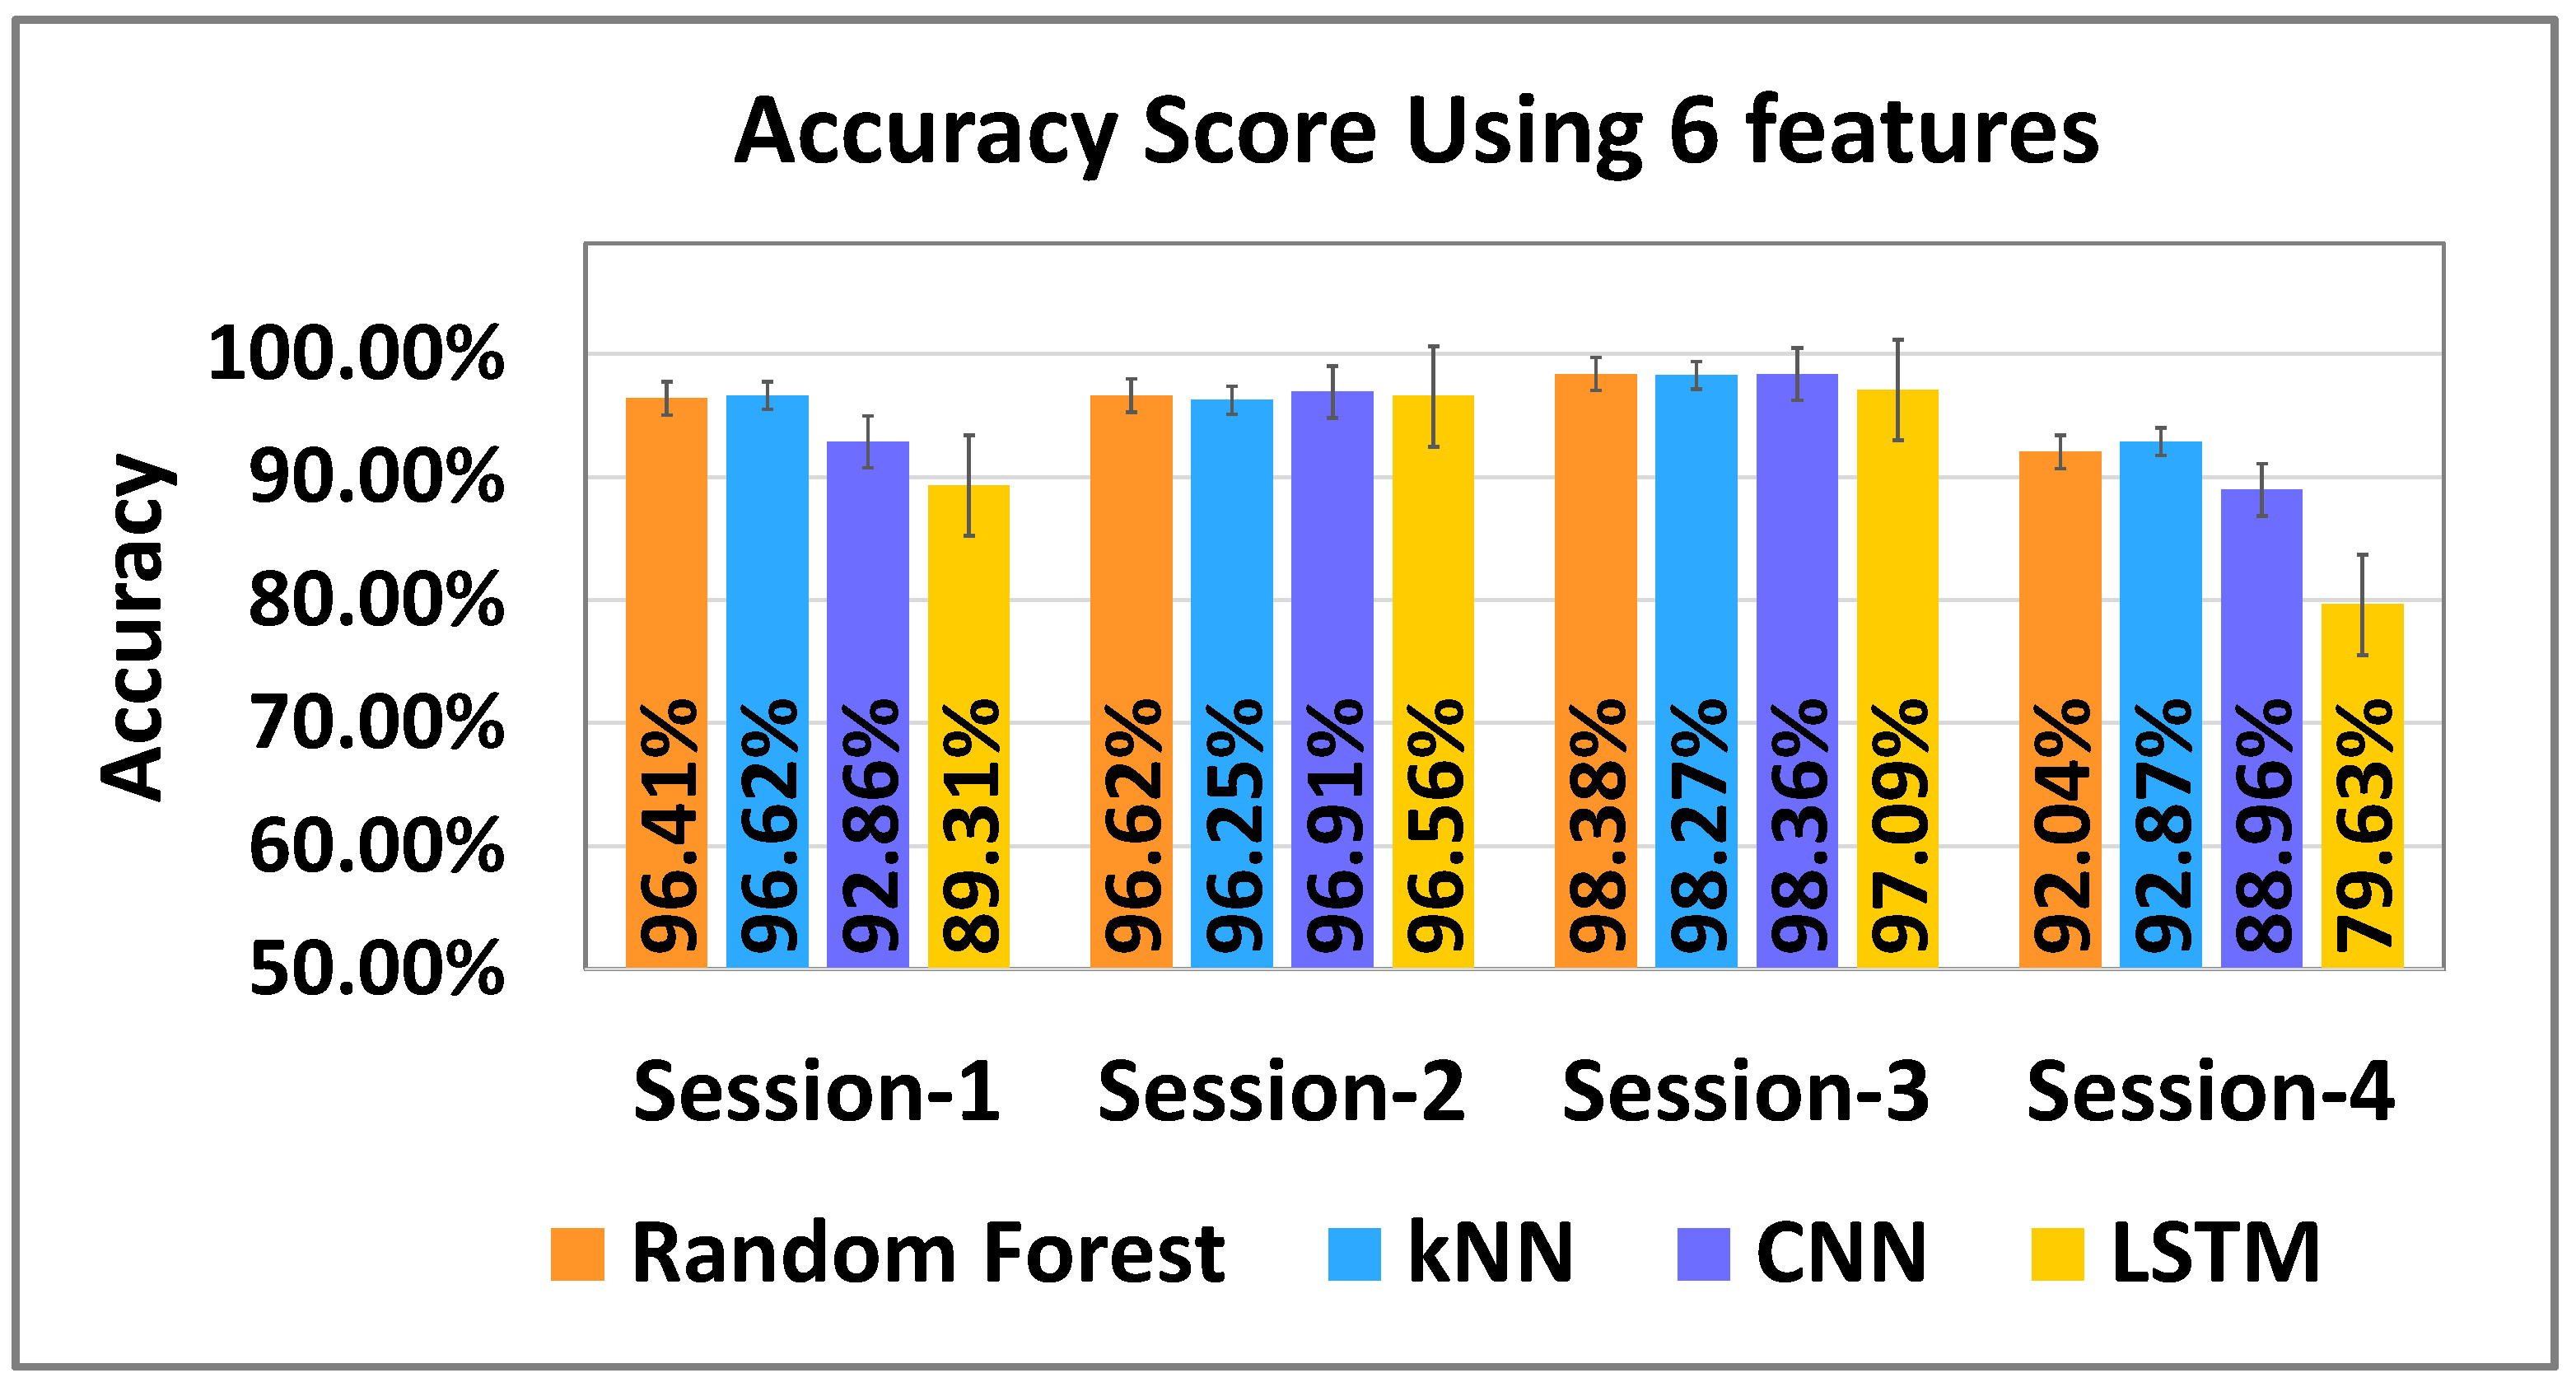
We also wanted to test the classifier on new data from different sessions for testing its generalizability. Thus, we stacked the data from three sessions for training and used the remaining fourth session data for testing. For both feature sets, the results were very similar and are shown in
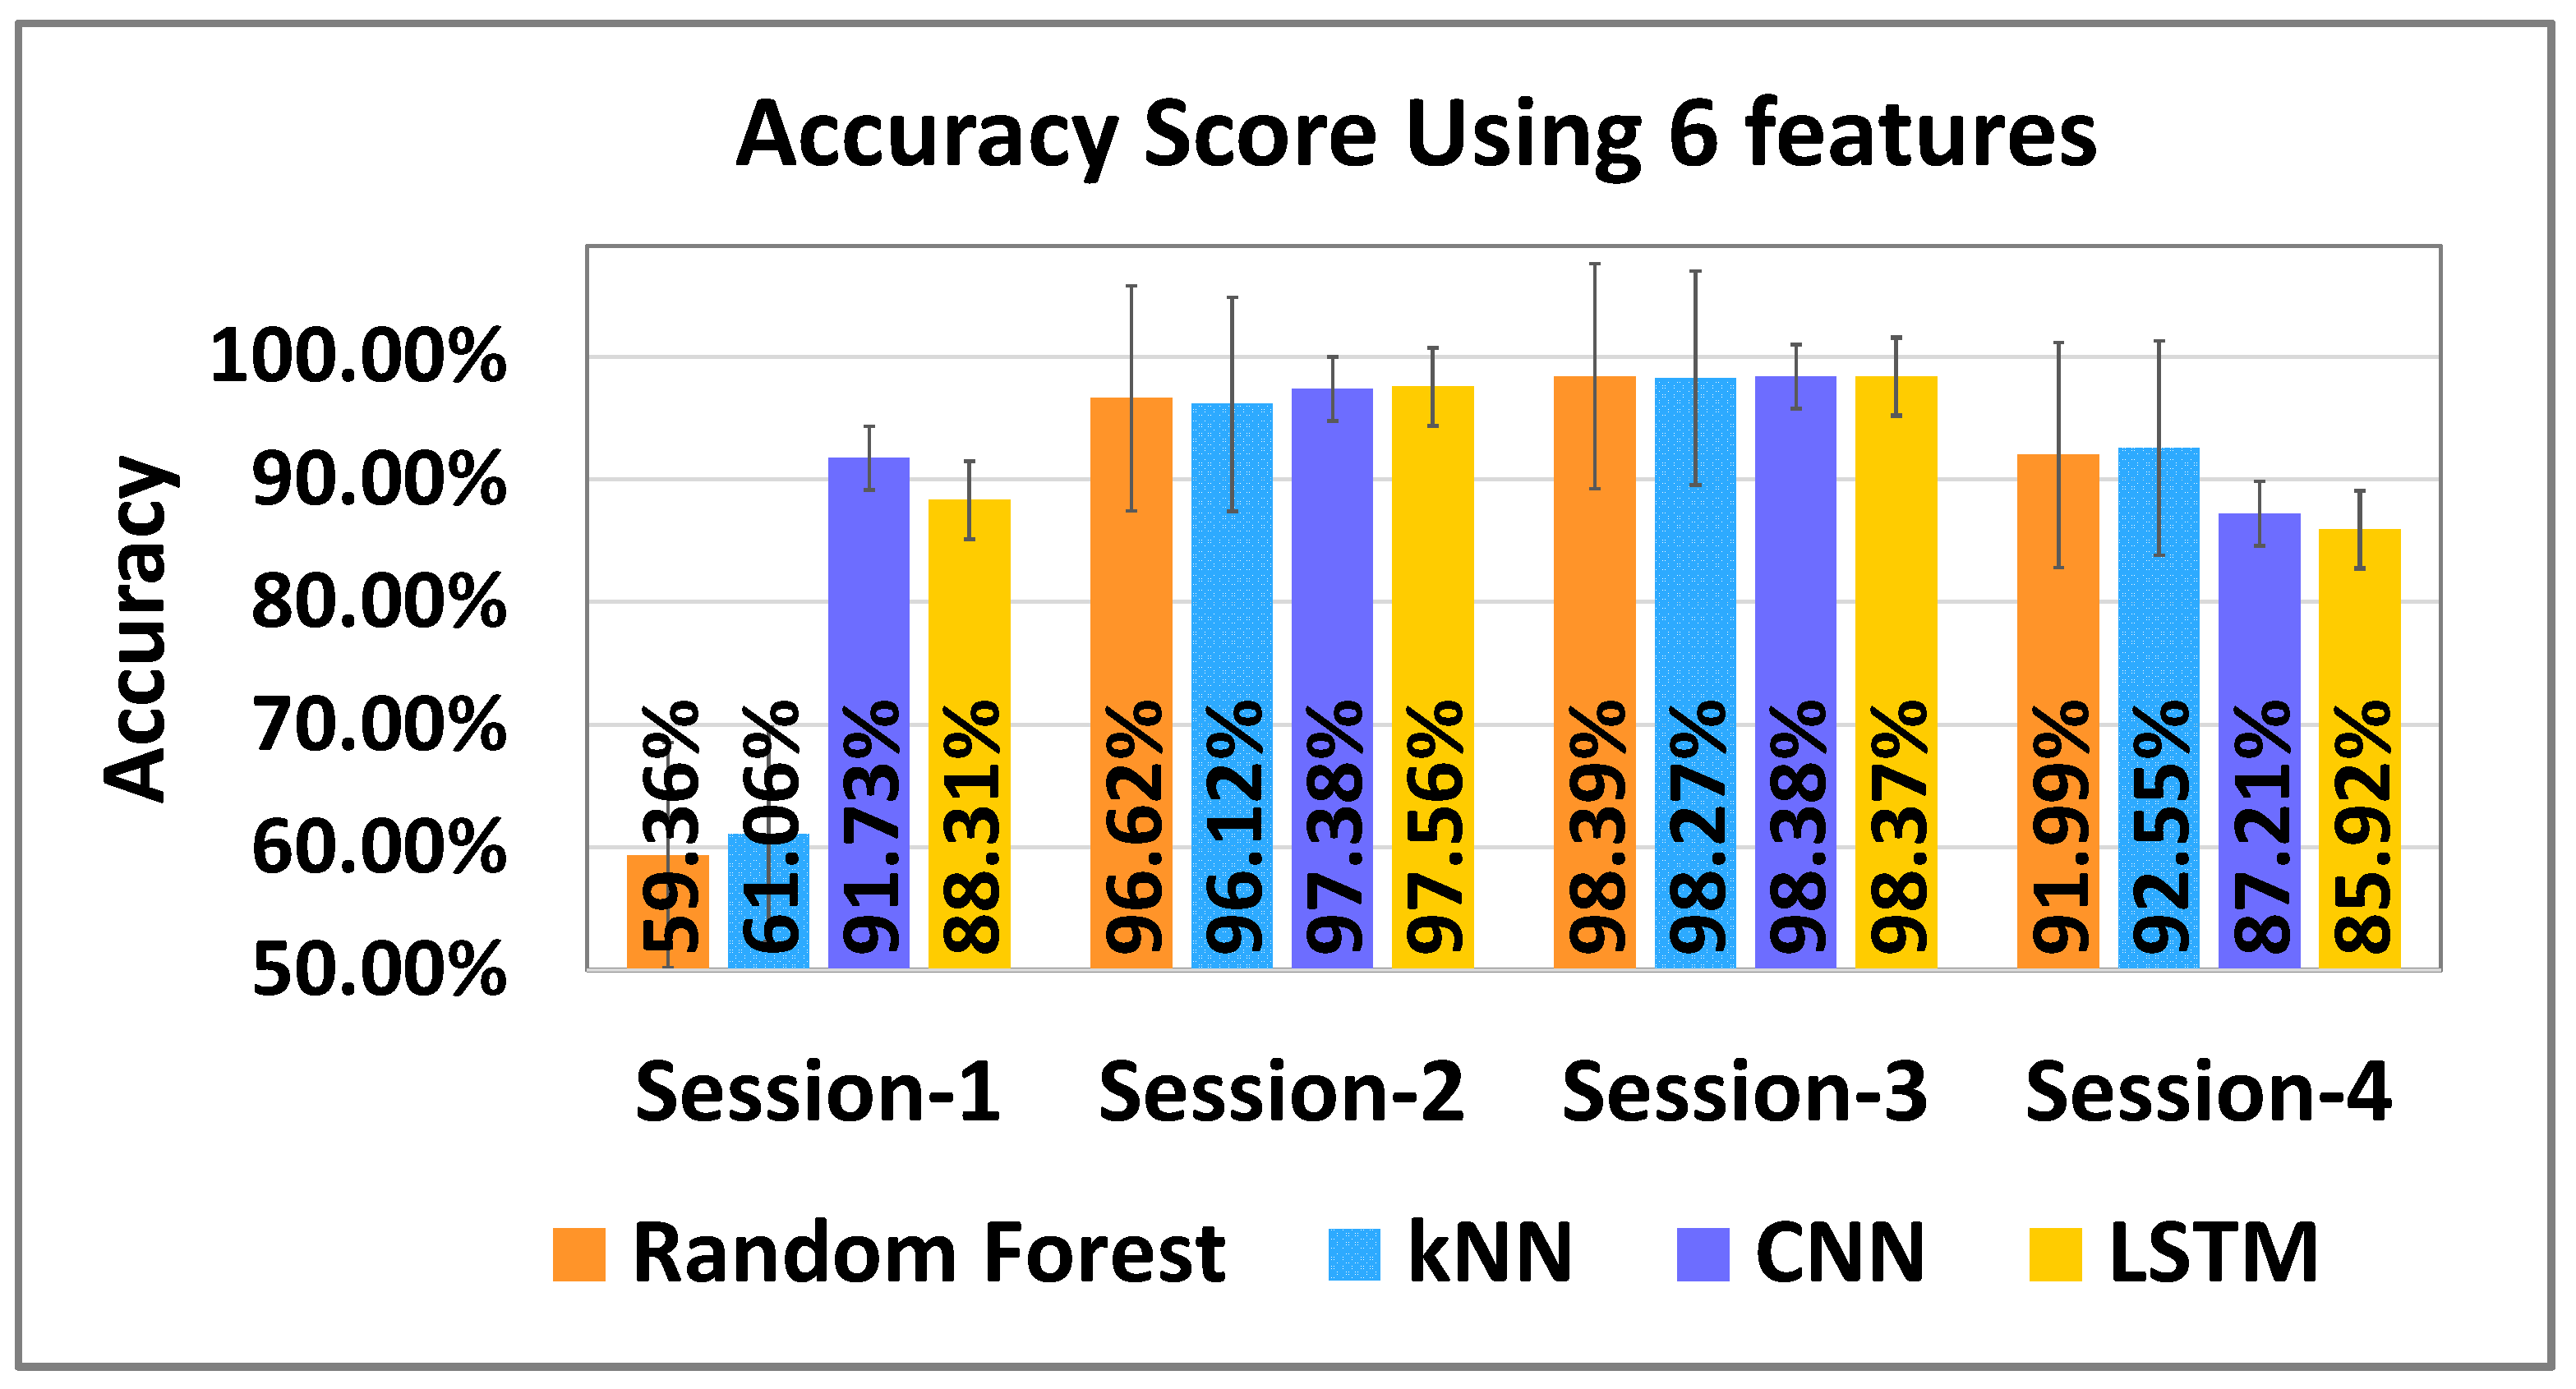
Figure 11 and
Figure 12. Overall, the best performance was achieved using RF, kNN, and CNN for all participants with six features for four different sessions (see
Figure 12), while LSTM provided slightly lower results for all sessions. Similarly with 12 features, the best performance was achieved using RF, kNN, and CNN for each session while LSTM had slightly lower accuracies than other models (see
Figure 11).
Accuracy is not the only evaluation metric for classification, as accuracy cannot show the individual class’s performance. Therefore, we also evaluated the precision, recall, and F1-score to test for generalizability using 12 features and 6 features separately for each participant. By applying the ML and DL models with two different feature sets, testing on four different sessions would produce a large table. Therefore, we reported the results for the first sessions (see
Table 4) only. The results for session II, session III, and session IV also have similar trends when compared between the 12 feature set and the 6 feature set. From the
Table 4, we can see that the precision, recall, and F1-scores for our model had similar values with both feature sets for most users, except for a few cases. Participants 2, 12, 13, 15, and 27 had lower precision/recall with six features for a few models. We noticed that these were the same participants for whom the missing gaze data were replaced with their average values. For some participants (second-last row of
Table 4), only the LSTM model had lower precision/recall with six features. Thus, we can use the other models only using six features to obtain a reasonably good precision/recall.
We performed a further analysis of the features in our six feature sets to see which features are more important for classification. We performed several tests by using a subset of six features for classification using RF and kNN Models with a 5-fold cross validation, and we avoided DL models because those models may not generalize well with two/three features. The results are summarized in
Table 5. From these results, we can see that using only X, Y, or Z values alone (from both eyes) does not produce good accuracies (below 77%). An accuracy of over 94% is achievable with only four features. However, using all six features produces over 98% accuracy.
In addition, we also wanted to see how accurately our models can identify users from a single session. We considered our smallest session (around 1 min 40 s) to identify users where we split the dataset into a 70:30 ratio, and we achieved an accuracy around (94 ± 5)% with different models. Moreover, if we take a single session and evaluate it with 5-fold cross validation, our models provide similar accuracies (see
Table 6).
Furthermore, we tested our models with some extracted features as well to see if they improve the model’s accuracy. We chose some simple features extracted from gaze origin, diameter, openness, and wideness of the left and the right eye. For gaze origin values (X, Y, and Z), we subtracted the X, Y, and Z values from the mean values of X, Y and Z, respectively. For example, the left-eye gaze origin’s X value was calculated as the user’s mean value of the left-eye gaze origin’s x-coordinate minus the left-eye gaze origin’s x-coordinate. A similar approach was used for all other values for the left- and right-gaze origin values (X, Y, and Z). For the diameter, openness, and wideness of left and right eye, we used a percentage value, which is the percentage of user’s mean value. For example, for the left-eye diameter, it was calculated as the user’s left-eye diameter value divided by user’s mean value of the left-eye diameter. All other values for openness, diameter, and wideness features, for both the left and the right eye, were calculated similarly. Similarly to our approach discussed previously, we evaluated our models using 12 and 6 feature sets. The mean accuracy of each model is shown in
Table 7. We also tested how well it works for the shorter session only (similar to results in
Table 6) with extracted features. We obtained very similar results (shown in
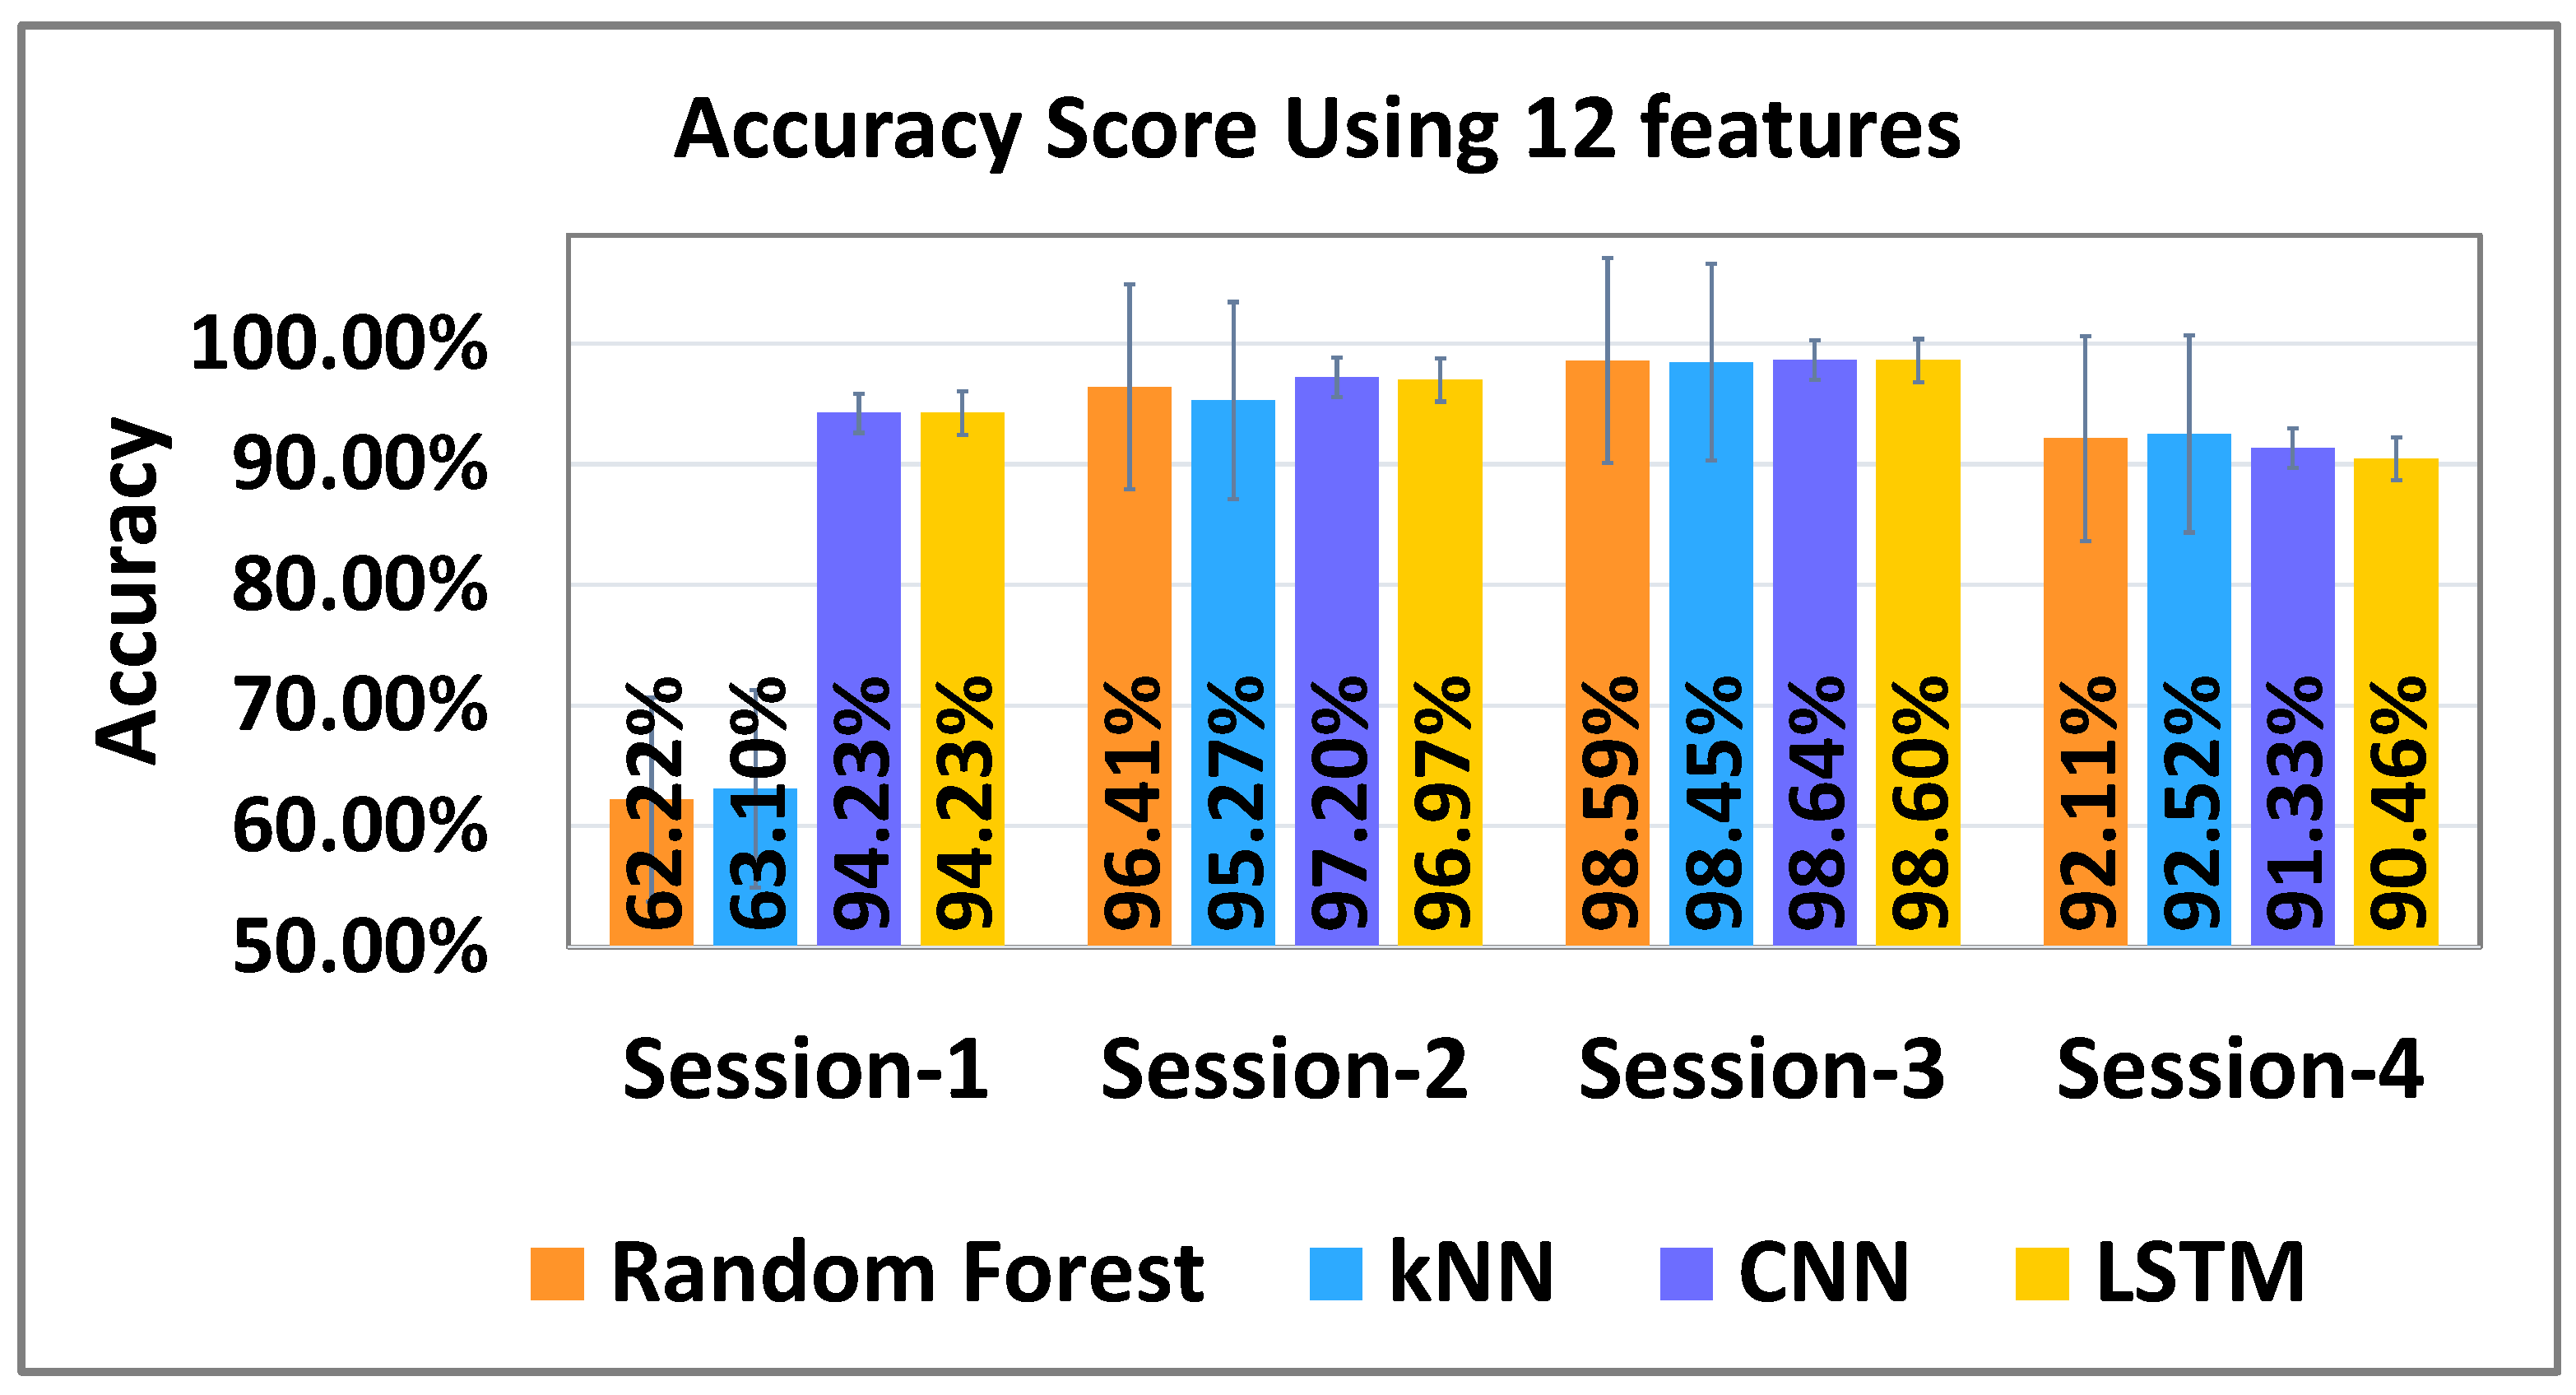
Table 8). Similarly to our past approach for testing the generalizability of our models with extracted features, we trained our model with the data from three sessions, and the remaining fourth session was used for testing. The results are reported in
Figure 13 and
Figure 14. We found that the accuracy dropped for both feature sets when session-1 was used for testing with our two machine-learning models (Random Forest and kNN). However, deep learning models still performed better for session-1. Overall, the best performance achieved was over 98% (for session-3) with both features sets.
6. Discussion
Our results show that our ML and DL models can identify users using both 12 and 6 feature sets (see
Table 3) with reasonably good classification accuracies (over 98%). Thus, for practical applications, we can use six features to classify since it will use less time and computing resources. This answers our first two research questions: RQ1 and RQ2 (see the Related Work Section), and we can use gaze data to identify users, using ML or DL models, with a good accuracy without using any tasks designed specifically for user authentication. Furthermore, we were able to achieve this with data from only 34 participants. This is an interesting result compared to prior research [
12,
29,
33,
35], since we obtained a similar accuracy with a much smaller sample size (N = 34) compared to these prior studies (N = 511 for [
12] and N = 60 for [
34]) although our VR tasks were different. We believe that both ML and DL models can provide a similar, if not better, performance for a larger sample size.
Our test results on two machine learning models and two deep learning models show that the classification accuracy was similar for all models. We tested the most promising models based on our survey of past work and our preliminary studies. However, they all performed reasonably well, making it difficult to identify a clear winner. Thus, we were not able to answer our third research question (RQ3) based on our results. We also evaluated our ML and DL models using shorter session data to see the performance, and we found that all of our models provided similar accuracies of around 95% (see
Table 6 and
Table 8). The session’s duration was 1 min 40 s, and we evaluated models using 5-fold cross validation for raw features and extracted features.
Out of 19 features, we identified a set of 12 ranked features using the recursive feature elimination algorithm (see
Table 1). We compared our results using these 12 features with a subset of features that only picks the top six features. Our results (see
Table 3) show that the accuracy was not significantly different between these two cases with raw features. However, our results with extracted features (see
Table 7) show that the system had significantly improved accuracies with 12 feature sets for the DL models (CNN and LSTM). The ML models (RF and kNN) had similar accuracies in both cases. We performed further tests with a subset of these six features (see
Table 5) and concluded that this is the minimal set. The accuracy drops significantly if we take away any more features. This answers our fourth research question (RQ4). Additionally, we noticed that the precision/recall was lower with six features for the user (see
Table 4, participants 2, 12, 13, 15, and 27) whose missing gaze-data values were replaced with their average values. Thus, replacing missing data with average values was not a great idea. Perhaps using interpolated values between the available data values would have improved this. However, we still need to test this theory.
The most important features (see
Table 1) were gaze origins for the left eye (X, Y, and Z) and the right eye (X, Y, and Z). This feature measures the point in each eye from which the gaze originates. In the conventions of Unity, the game engine with which the virtual reality experience was developed, the
Y axis is vertical, the
Z axis is forward–backward, and the
X axis is left–right. Some of these measures have straightforward spatial meanings, e.g., the
y-axis captures how high the tracked object (eye in our case) is from the ground, which is dependent on the height of the user. The
x and
z axis values will depend on the facial geometry of the user, which defines the distance between their eyes and how far the eye tracker sits from their eyes. Thus, these features are good bio-markers for identifying users. Furthermore, the gaze-origin values are not dependent on VR environment features. Thus, this approach would be applicable to any VR scenario requiring user identification.
According to precision, recall, and F1-score, we see that random forest, kNN, CNN, and LSTM models can identify users, even though a few participants had lower precision and recall score (see
Table 4). We further investigated their data to find the cause. We noticed that there were some individual features, such as gaze origin’s X, Y, and Z values, with similar values for a few participants. However, their combination did not match with the other participants. However, it is possible that the combination of a few participants may have matched with the other participants. This factor can lead to a lower precision and recall for those participants.
Our experiment had some limitations. Our results might be biased with respect to gender as we had gender imbalances in the participants [
52]. The age range of our participants was from 19 to 35. Further research is needed to test our system for younger kids (under 19) and older adults (over 35). Our participant pool was 34, and this could have a minor effect on our results. We still obtained over 98% accuracy, and we believe that adding more participants would not induce a significant impact for DL models. However, ML models may perform better with more data. Additionally, since eye-gaze origins depend on the height and facial geometry of the user, the system would fail to correctly identify users with similar height and facial geometry. We may not have encountered such a case in our experiment. Further research is needed to test this with a larger group of participants. Another limitation is that we did not test our approach with a variety of VR environments, such as a fast-paced VR game (e.g., a car racing game or a first-person shooter game). Our environment was a slow-paced educational experience with no abrupt changes. A fast-paced VR environment could lead to rapid eye movements and cause cybersickness [
53]. However, we believe that our approach would still work in these fast-paced environments if we train our machine learning models using data from this new environment, provided that the data possess the key features needed for identification (see
Table 1).
As privacy is an important concern when sharing VR systems or eye gaze data, in our study, eye-tracking data were collected from participants who provided permission for using their data within a standard informed consent model. The data were completely anonymized. However, given that demographic information may be discerned from gaze data [
6], great caution must be taken when handling it, especially if it has been gathered from minors (school students). If such a VR-based system is used for a real classroom, one must ensure that the students understand the meaning of eye tracking (perhaps by having them review example visualizations) and obtain permission from students (and their parents, for minors) to track or record their eye gaze. Miller et al. [
12] suggested that researchers and manufacturers follow some rules when sharing gaze data. Researchers should follow standard practices in releasing research datasets or sharing VR data by removing information that can identify participants. More et al. [
34] found that classification with user tracking can be reduced significantly by encoding positional data as velocity data. We believe that instead of encoding all features, only important or sensitive features should be encoded to reduce identifiability while retaining useful information for other research applications. Moreover, special care has to be taken for any longer-term storage to provide security, address legal requirements, and avoid any misuse of gaze data.

