Article

CNS Axon Regeneration in the Long Primary Afferent System in E15/E16 Hypoxic-Conditioned Fetal Rats: A Thrust-Driven Concept

by
Frits C. de Beer
* and
Harry W. M. Steinbusch
Department of Cellular and Translational Neuroscience, Faculty of Health, Medicine, and Life Sciences, Maastricht University, P.O. Box 616, 6211 Maastricht, The Netherlands
*
Author to whom correspondence should be addressed.
Anatomia 2025, 4(3), 12; https://doi.org/10.3390/anatomia4030012
Submission received: 7 April 2025 / Revised: 7 July 2025 / Accepted: 26 July 2025 / Published: 1 August 2025
(This article belongs to the Special Issue From Anatomy to Clinical Neurosciences)

Abstract

Background: Lower phylogenetic species are known to rebuild cut-off caudal parts with regeneration of the central nervous system (CNS). In contrast, CNS regeneration in higher vertebrates is often attributed to immaturity, although this has never been conclusively demonstrated. The emergence of stem cells and their effective medical applications has intensified research into spinal cord regeneration. However, despite these advances, the impact of clinical trials involving spinal cord-injured (SCI) patients remains disappointingly low. Long-distance regeneration has yet to be proven. Methods: Our study involved a microsurgical dorsal myelotomy in fetal rats. The development of pioneering long primary afferent axons during early gestation was examined long after birth. Results: A single cut triggered the intrinsic ability of the dorsal root ganglion (DRG) neurons to reprogram. Susceptibility to hypoxia caused the axons to stop developing. However, the residual axonal outgrowth sheds light on the intriguing temporal and spatial events that reveal long-distance CNS regeneration. The altered phenotypes displayed axons of varying lengths and different features, which remained visible throughout life. The previously designed developmental blueprint was crucial for interpreting these enigmatic features. Conclusions: This research into immaturity enabled the exploration of the previously impenetrable domain of early life and the identification of a potential missing link in CNS regeneration research. Central axon regeneration appeared to occur much faster than is generally believed. The paradigm provides a challenging approach for exhaustive intrauterine reprogramming. When the results demonstrate pre-clinical effectiveness in CNS regeneration research, the transformational impact may ultimately lead to improved outcomes for patients with spinal cord injuries.

1. Introduction

An increase in the incidence of severe spinal cord injury among older people is a worldwide trend. Older people with SCI are at risk of more complications. Data from more than a thousand clinical trials show that recovery characteristics have remained unchanged over the last twenty years [1,2,3]. The pattern of neurological and functional recovery of older people may have counterbalanced positive effects from approved care in acute and rehabilitation practices. Given the wealth of knowledge of the central nervous system that exists today, medical science falls short of reaping the benefits of SCI treatment. Major domains relevant to CNS repair and regeneration, like biochemistry and neurobiology, have enriched scientists’ armamentarium to tackle life’s intricate mechanisms inherited from phylogenetically lower species capable of cell and tissue regeneration [4,5,6]. The experienced incapability of the mature CNS has moved science from the lesion site after “a century of sterile endeavor” [7]. However, cell-based transplantation experiments in higher vertebrates have yielded promising results [8,9]. The first Phase I safety studies of human autologous Schwann cell transplantation in patients with SCI and human fetal neural stem cell transplants for chronic SCI were launched in 2012 and 2013 [8,10]. Since then, research papers on non-human or human-induced pluripotent stem cells have peaked. So far, various cell suspensions are delivered mostly by intrathecal injections and have reached Phase I/II clinical trials for SCI worldwide [11]. Small patient numbers and short follow-up periods hamper assessing the immediate effects of very early interventions, i.e., ≤2 weeks post-injury [1]. Pre-clinical studies demonstrate this incapacity of axon outgrowth that extends beyond the CNS lesion for a 10 mm length max and lasts for days or weeks.
We classify these features as sprouting like central axons, creating collaterals (colls) at their final stage of axon development [5,12]. The incapacity of CNS regeneration is ascribed to the mammalian dorsal root ganglia neuron’s lack of long-distance axon elongation across the white matter. Since the turn of the century, this notion has ranked as a law of nature in neuroscience [7,13]. The inhibitory environment of the lesioned adult spinal cord is thought to prevent the expression of an innate ability. The neuron with its pseudounipolar axon can regenerate its cut peripheral branch over a long distance. The acute primary and lasting secondary effects in experimental spinal cord transections ruin the tissue’s cytoarchitecture, preventing central axon regeneration. For decades, research into extrinsic factors like myelin and proteoglycans has challenged glial scar formation [14]. Meanwhile, the human-induced progenitor stem cell-based transplantation paradigm has been practiced [15]. Before that, the absence of a glial impediment in the injured immature spinal cord has been incidentally investigated [16,17]. Research into immature CNS tissue for conditions conducive to CNS regeneration has rendered conflicting results and hindered an expected breakthrough. Our conference report indicated an intrinsic factor precluding fetal spinal cord regeneration. In a small S-series of E17/E18.p42 rats, the glucose metabolism at the gracile nuclei was comparable to that of the control [18]. These experiments revealed that the fetal dorsal myelotomies failed to show expected signs of regeneration and were devoid of scar tissue. This initially observed baffling perspective prompted the endeavor to acquire more upstream targets. Facing financial constraints at the time ultimately postponed this contribution to neuroscience.
Standing at a crossroads, do we consider finding the maze’s way out while keeping the same track? A possibly negative impact of older people in the clinical trials may counterbalance a noticeable effect on recovery. However, it is valid to question whether applied translational science contributes to improved neurological and functional recovery from current clinical trials. Although many pre-clinical studies have claimed regeneration, this issue moves in circles regarding forming collaterals, i.e., sprouting. We suggest an addition to the affirmative criteria for CNS regeneration, which was stated twenty years ago [19] (Discussion). Our recent paper documented the long primary afferent system development, focusing on Clarke’s and gracile nuclei [12]. The dorsal myelotomies rendered the upstream cut axons with contributions to the primary afferent intermediate subdivision. They did not regenerate but terminated caudally from the lesion site at unequal distances. Here, we present intriguing features of long primary afferent axons that regenerate and elongate presumably quickly towards their medullary targets after a single cut during fetal development.

2. Materials and Methods

2.1. A Summary

The data presented in this paper were part of an excerpt of experimental work predating the European legislation on animal welfare and institutional ethics board approval. The animal facility and husbandry upheld exemplary ethical standards applicable at that time. The consistently high fetal survival rates and many long-surviving rats justify this statement (Table 1). The pregnant rats were housed solitarily in cages at a 12:12 light cycle, having unlimited access to food and water. We witnessed derangements in the daily routine when rats had moved the unweaned litter from one corner to another during construction work in the facility. Increased anxiety, especially among primiparous rats, prompted us to postpone scheduled experiments. Here, we summarize a short technical description. For more details, we may refer the reader to our recent papers. The microsurgical dorsal myelotomy at random cervical and thoracic levels was aimed at disrupting the fetal rat’s primary afferent system development. The dam’s conception day was scheduled fifteen to seventeen days before at E0, covering the long primary afferent system development in E15–E16 fetuses. The spontaneously breathing dam recovered within one or two minutes of quitting fluothane inhalation after the standardized procedure. The estimated mean duration would account for approximately half an hour, although it was never clocked. Applying the horseradish peroxidase (HRP) tracer only to the left sciatic nerve’s proximal stump was straightforward. The spinal cords had been sectioned sagittally for processing, except for the horizontal sections of the medulla. Enzyme histochemistry involved tetramethylbenzidine (TMB), according to Mesulam [20]. Focused on the DC, we valued the tracing with HRP for its competent histology, exhibiting the elongating axons in sagittal sections. This approach enabled us to describe the assemblage of the intermediate and long subdivisions beyond the critical period (CP) in the previous paper [12]. Here, we present six experiments demonstrating the CP from a subset of cases that have fulfilled all the sequential and hazardous processing steps. Given the bell-ringers’ position on the list, which demonstrates randomness, it highlights that data acquisition is fraught with flaws and mishaps (Table 1). The recently described hypoxia-adapted phenotypes yield a conclusive interpretation of the results aggregated for this paper. First, the next chapter recapitulates an update of the long primary afferent system’s blueprint 2.0 for the reader’s convenience [12].
Table 1. The dataset and the seven displayed bell ringer cases. The recruitment of the 45 experiments during the experimentation period reflects the scarcity of cases with proper M0s. Pinpointing the M0 is impossible upfront. Six bell-ringer cases display HRP feature stills, ranking the M0 on the upstream development within the critical period. The majority fulfills the criteria of downstream development, which are beyond the scope of this paper, for which the twin-case W2.p42 is a displayed exception. Column 1 includes the experiments performed during ten years of experimentation and is denoted by a threefold letter-and-number combination. The column shows the serial number first and the follow-up period third. The Tx day (M0) relates to the conception day noted in the middle, specified by the hour in a few. In column 2, the success ratios are shown (count of Txs: fetus count = litter size). Optimal ratios underscore the importance of standardization as a key factor for the paradigm’s applicability. Fewer-than-expected deaths resulted from three stillborn neonates, not yet cannibalized. The male-to-female ratio was 3:2 in 40 neonates, excluding the first five embryos of undetermined sex and ratio: N/A. Column 3 contains the cases displayed in Figure 3, Figure 4, Figure 5, Figure 6, Figure 7 and Figure 8.
123123
Case IDlitter-ratioFigureCase IDlitter-ratioFigure
(Tx: n = p0) (Tx: n = p0)
C39.E18.E20N/A T47.E16.p4(1:2 = 2)
C44.Sx.p4N/A T60.E16+12h.p135(1:10 = 10)
D14.D5.E21N/A T62.E16.5.p17(2:11 = 11)
D15.E17.E20N/A T65.E16.5.p48(1:10 = 10)
D20.D17.E18N/A T68.E16.5.p370(1:11 = 11)
N45.E17.p8(1:4 = 4) T77.E17.p35(1:12 = 12)
N46.E18.p10(2:15 = 15) T78.E16+2h.p40(1:8) = 7Figure 3
P1.E18.p48(2:15 = 14 + 1 ) V1.E16+6h.p600(1:10 = 9)Figure 5
P17.E17.p90(2:10 = 10) V2.E16-1h.p240(2:14 = 13)
P20.E18.p600(2:9 = 8) V3.E16-1h.p195(1:13 = 12 + 1 )
R9.s6.E17.p44(4:11 = 11) V31.E16-3h.p145(1:13 = 13)
T8.E17.p180(2:15 = 15) V38.E16-3h.p210(1:15 = 15)
T9.2.E18.p225(3:15 = 12) V51.E16-4h.p2(1:9 = 9)
T12.E17.p7(2:15 = 15) V63.E16-2h.p1.5(1:11 = 11)
T13.E17.p7(2:14 = 12) V67.E16+7h.p9(1:7 = 7)
T15.E17.p305(3:16 = 14) V72.E16+8h.p1.5(1:14 = 14)
T16.E17.p40(2:15 = 13) W2.E16-7h.p9(2:10 = 10)Figure 6A,D
T20.E17.p700(1:9 = 7) W2.E16-6.5h.p42(2:10 = 10)Figure 6E,H
T23.E16.p360(1:6 = 6) W6.E16.p32(2:14 = 14)
T34.E17.p100(1:8 = 8) W14.E16-8h.p14(2:15 = 15)Figure 8
T42.E16.p240(1:9 = 9)Figure 4W17.E16.p64(1:14 = 14)
T45.E16.p7(1:4 = 4) W20.E16-9h.p6(2:11 = 9)Figure 7
T46.E16.p3(1:13 = 12 + 1 )
: one stillborn present in the litter.

2.2. Preamble to the Long Primary Afferent System’s Development

Several ephemeral spots on the hypothetical assembly line condensed into random stills are displayed in this paper. Rearranged into a logical order, these stepstones create a comprehensible route that features the imaginary development of the long primary afferent system. Our recent paper outlined the development cascade of the rat’s long primary afferent system, equipped with four hypothetical transition hubs (TH.0–TH.3) as illustrated in Figure 1A. During a thirty-minute surgery on the intrauterine fetus, hypoxia triggered an adaptive response, resulting in new phenotypes that reflected a changed proteomic identity. This disruption of normal development was an unexpected outcome of our previous study [21]. Key features became evident in the severed axons as they elongated towards the medulla, before reaching their targets, and immediately after transitioning. This way, the Txs could render the TH.1 and Th.2 intrinsic front stops (i-FSs) if scheduled, by chance, at the proper M0s. The acquired bell-ringer cases relied on chance optimization through standardized techniques. The i-FS’s development down the cascade was permanently blocked, transforming the two axon mimicries into lasting features distinguishable from the parent axons. We described their plausible relationships in terms of waves, such as spring and high tides, and low and neap tides, connecting to their targets at gracile and Clarke’s nuclei. The i-FSs’ features were confounding, though, masking a biphasic temporospatial relationship with their remote targets along the assembly line. On the one hand, the bundled i-FSs in the neonates stood out as the abrupt front stop (a-FS) caudally abutting the lesion site, akin to the hypothetical high-tide fast elongation stop (f-ES) at the medulla. On the other hand, the adult age-morphed low-tide TH.1 mimicry helped identify low-tide fibers that neither reached nor penetrated Clarke’s nucleus, which might comply with the hypothetical slow elongation switch (s-ES) phenomenon. The i-FSs spread along the blueprint’s cascade enabled the acknowledgment of the temporospatial development by correlating estimated spots on the assembly line with imaginable lapses in clock time. Despite the similar i-FSs, the CP emphasized the biphasic nature, as evidenced by the remote levels of the rostral and caudal fiber terminations.
First, we describe the elongating high-tide i-FSs reaching the level of the medulla. Overall, this preamble supplants the detailed outline from our previous paper to include new insights. Primarily, the WM-facing TH.1 (*) i-FSs and the CG-facing TH.2 (**) i-FSs are connected in both time and space, illustrating the successive axon features of the intrinsic development plan, as outlined in the blueprint. Concisely, all the upstream highly dynamic pioneering TH.0 axons elongate in high-tide waves driven by lumbar DRG neurons. At the hypothetical f-ES phenomenon, the translatomic transition is instantaneous and occurs without a Tx. When severed during elongation, axons can regenerate to the medulla, transitioning into the permanent WM-facing TH.1 (*) i-FSs during spring tide. Presumably, the dynamics of the high-tide axons fuel this regeneration process, which might also continue briefly in the most upstream axons after the hypothetical TH.1 transition. Notably, after that transition at the medulla, the Tx produces CG-facing TH.2 (**) i-FSs. These medullary axons might terminate superficially into the CG of the medulla fringe. Presumably, their decline in dynamics might also involve a waiting period. Second, the low-tide pendants of those CG-facing TH.2 (**) i-FSs are best illustrated at the adult caudal lesion site. Monomorphic features of the downstream dynamics prevail and preclude the penetration of Clarke’s nucleus, occurring beyond the CP. In contrast, the high-tide axons at the medulla show the most dynamic kaleidoscopic axon configurations. The regenerated TH.2 (**) and TH.1 (*) i-FSs intermingle with TH.0 parent axons, which form TH.3 (***) colls that penetrate gracile nuclei. As mentioned, the i-FSs of both high and low tides demonstrate their biphasic nature, expressed through two hypothetical phenomena at play: the fast elongation stop (f-ES) and the slow elongation switch (s-ES). Their blocked development is illustrated by the consistently visible i-FSs, reflecting these two phenomena. Ultimately, their difference comes down to the variable lengths to which the axons regenerate after a Tx. We have proposed a superseeding factor that determines the available energy for driving the assembly of axon length. We observed a noticeable decline, aligning with the intrinsic developmental plan. Third, we place the TH.3 (***) coll formation at the most downstream level on the blueprint’s cascade. We suggest that the formation of TH.3 (***) colls downstream in the cascade might seamlessly connect temporally and spatially to the s-ES phenomenon in the cascade. We noted coll penetration in the CG at variable lengths, also demonstrated via parent fibers beyond caudal lesion sites. Such features at a variable spinal level illustrate energy decline, which is manipulable and affects both downstream and upstream axons. Moreover, such odd features demonstrate the adaptability of the translatomic identity, not to mention nature’s proneness to adapt.
The intrinsic development plan is illustrated in Figure 1A,B. Two informative duo-graphics showcase the actual development states before and after the myelotomy in Figure 1C–F. These examples are specifically related to cases 3 through 8, allowing for a quick understanding of the case’s current states.
Figure 1. Four panels depict the blueprint (A), the assembly line (B), and the high-tide DC contents before (C,E) and after a Tx (D,F). The graphics imply that the development of the DRG neuron governs the central long primary afferent pioneering axon and maturation in a high-tide wave to the gracile nucleus. The transganglionic transport of HRP is displayed in Figure 3, Figure 4, Figure 5, Figure 6, Figure 7 and Figure 8. (A) The consecutive stages in the assembly line are green, yellow, light brown, and dark brown, accomplished during embryonic day E15 to E18. The gray bars partition the assembly line and mask the complexity of unidentified networks of transcription factors, i.e., hypothetical transition hubs (THs). The i-FSs, in their quality as mimicking substitutes, are addressed in the Preamble and the Discussion. (B) The temporospatial elements of the assembly line involve a complex interplay. Above the axis, the red block represents the upstream critical period (CP) that delineates the waves of TH.0-and upstream TH.1 stage axons at spring tide targeting gracile nuclei. The curved line indicates an inferred decrease in total thrust for axon-tip propulsion and the energy expended for axon development along the assembly line. Displayed beneath the axis: The TH.0 stage of the pioneering axon is colored green; beyond the f-ES, the TH.1 axon stage turns yellow; the s-ES again turns the stage light brown and leads to the formation of TH.2 staged i-FSs; further downstream, the TH.3 stage of colls becomes darker brown, indicating the maturation continues. These successive stations on the assembly line hypothetically form the developmental cascade of the long primary afferent system. (C,E) The two bar graphics of the afferent system, placed horizontally, reflect two random M0s at E15 and E16 during the CP before performing the dorsal myelotomy Anatomia 04 00012 i001. The colored bars represent the current dorsal columns, harboring the dominant upstream-stage axons. The green line in the right panel delineates the critical period, i.e., the upstream time window at spring tide. (D,F) The two-line graphics reflect how the former stage of axons develops after the myelotomy. The lines serve as a pars pro toto for axons from the left DRG L4–L6 neurons. The high-tide axons target the gracile nuclei (g.nu), and the low-tide axons target Clarke’s nucleus (C.nu). t = time. d = axon length.
Anatomia 04 00012 g001

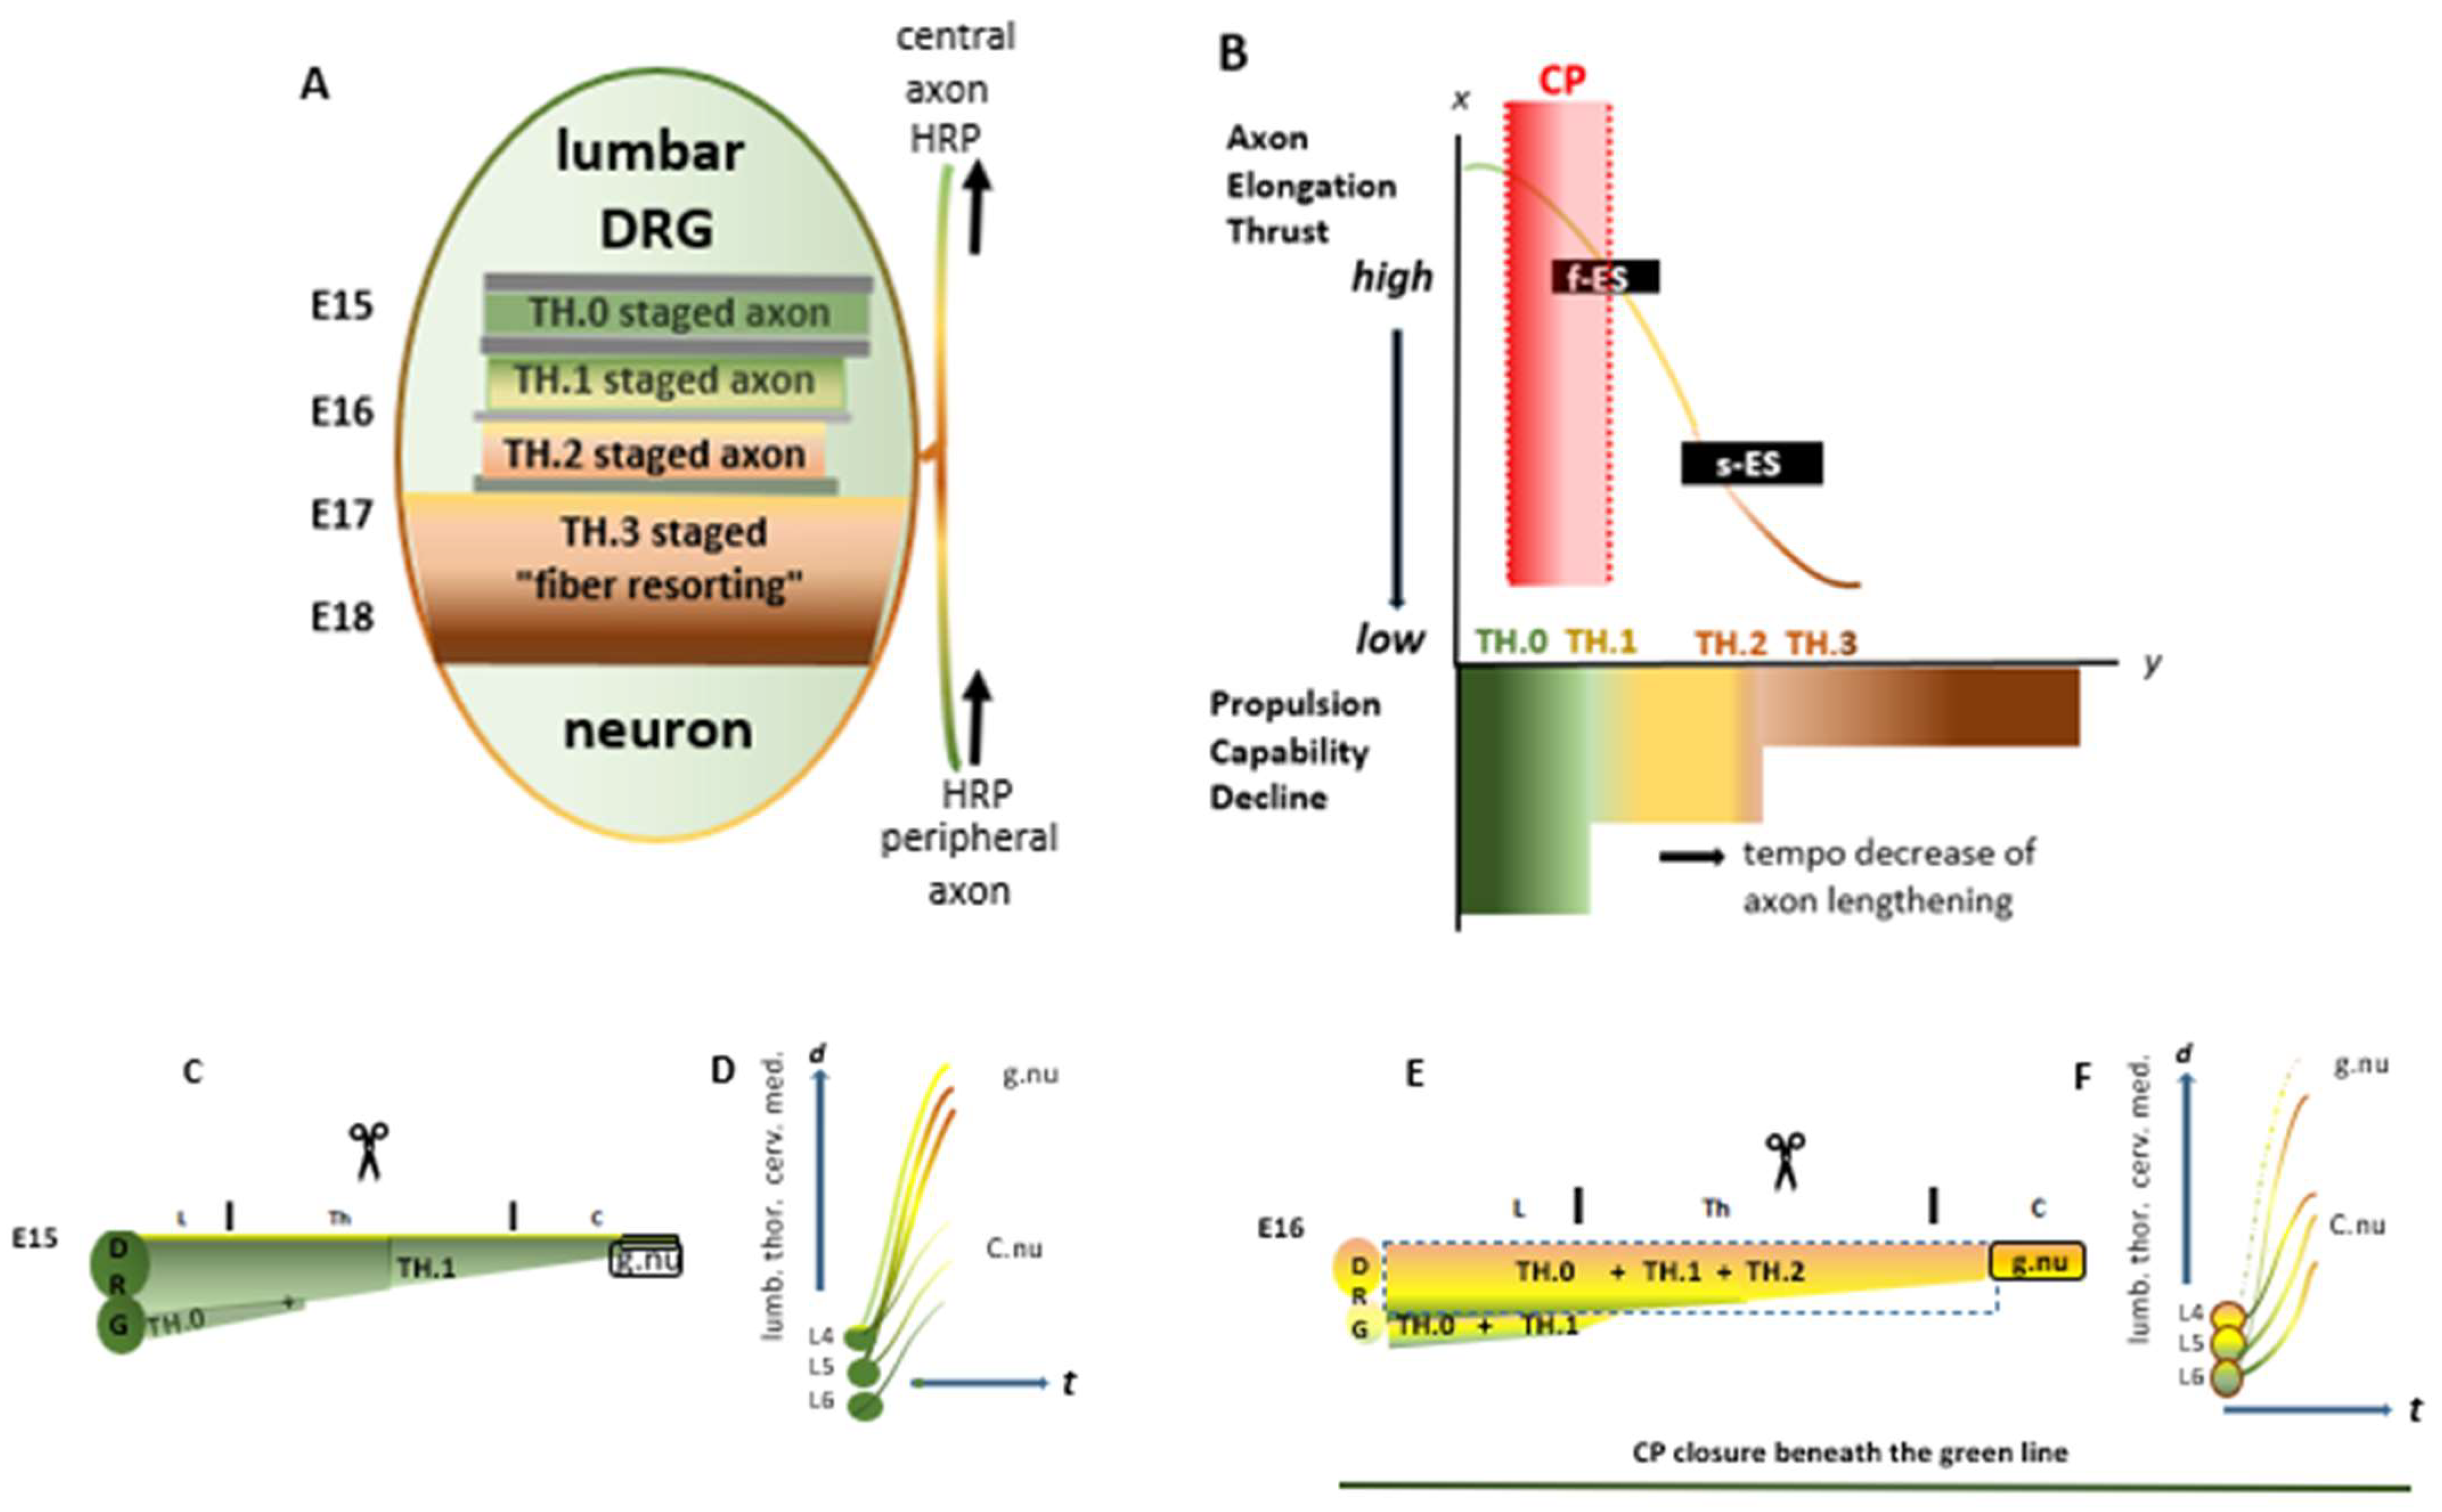
2.3. The Impact of Hypoxia During the Critical Period

The microsurgical dorsal myelotomy (Tx) was performed under compression of the placenta’s vasculature. If performed upstream at the proper M0, the ensuing fetal tissue hypoxia triggered reprogramming of DRG neurons. This susceptibility was restricted temporally and upstream stage-dependent. The Tx rendered the i-FSs showing the resulting perturbed phenotypes that mimicked the imaginable upstream TH.1 and TH.2 stages. In contrast to the naturally brief and invisible f-ES and s-ES phenomena, their mimicries remained a distinct feature under any circumstance. In neonates, these i-FSs contributed to the abrupt front stop (a-FS) of bundled axons. The bluntly tipped terminal club-like i-FSs supposedly terminated in white matter (WM). Our findings revealed that a half-hour of oxygen shortage reprogrammed DRG neurons. These alterations may link transcriptomic or translational perturbations documented in former research to HIF pathways, objectifying the pivotal impact of hypoxia [22,23,24]. The permanently visible i-FSs shed light on the naturally unstoppable primary afferent development cascade at various spots on the assembly line. The stills enabled us to distinguish between the high- and low-tide i-FSs and illustrated the dichotomous trajectory. Those high- and low-tide axons built the long and intermediate subdivisions during and after the CP.
The CP encompassed the time involved in the long primary afferent axon elongation process, which occurred in a rostrocaudal gradient of axon development. The smaller this window, the faster the growth, considering that halfway through the CP, 50% of the axons might have stopped pioneering (Figure 2A). The smaller the time window, the more likely a Tx might render the typically monomorphic a-FS configuration assigned to the second half of the pioneering axons, originating in the L5 and/or L6 DRG neurons. In contrast, the Txs during the first half might render the multimorphic features with parent axons. Our data, indicating high-speed growth, are in harmony with these considerations (Figure 2B). The CP closure might be scheduled halfway between high and low tide.
During spring tide, the lumbar TH.0 axons pioneered toward the medulla in high-tide waves [12]. Fortunately raised at an uncertain M0, by chance precisely within the appropriate CP’s narrow time window, seven bell-ringer cases showcased configurations exhibiting pertinent dynamic HRP features (Table 1). The feature mix determines an estimated spot on the development cascade and highlights the particular features of the assembly line (Figure 2B, red–blue diagonal). An inferred reduction in available energy might explain the imminent decrease in axon elongation assigned to thrust (Discussion).
Figure 2. (A) Halfway through the CP, a swift reduction of axon outgrowth into the medulla matches the CP’s short time window, reflecting a high axon elongation speed. The Tx rendered a-FSs might entail the second half of the pioneering axons. Their severed i-FSs terminate at the lesion site, marking a watershed. (B) On the red–blue diagonal line of temporospatial development, the Tx at M0(3) renders kaleidoscopic features exemplifying a combination of TH.1 and TH.2 i-FSs and TH.3 colls from parent axons. The upstream configurations with the highest numbers exhibit the most dynamic characteristics during development. After that, failing (re)growth beyond the lesion site quickly diminishes the number of labeled axons in the medulla. At M0(3), a peek of parent axons reaches the gracile nuclei unharmed. Further down at M0(6A) and (7), the number of the final i-FSs approaches zero. The last visible axons depend on the final regenerated TH.2 (**) i-FS, illustrated in Figure 7C. At M0(6E), TH.2 (**) i-FSs terminate caudally into the lesion site, shown in Figure 6G. In particular, an invisible commodity of thrust might be inferred from the high-tide TH.1 (*) and TH.2 (**) i-FSs. Between maximal and minimal thrust, noted as Anatomia 04 00012 i002 and Anatomia 04 00012 i003, respectively, the axon lengths may parallel the energy generated for elongation. The reprogrammed i-FS’s phenotypes are yellowish-tinted. Within the upstream CP (red-shaded area/line), the i-FSs regenerate up to the medulla, as depicted in the following figure Anatomia 04 00012 i004. The high-tide a-FS of joined TH.1 (*) i-FSs abuts the lesion site caudally. Beyond the a-FS (the red line changes color), severed axons gradually increase their distance to the rostral lesion site due to failing thrust. The numbers (3)–(8) represent seven cases, including twins, with Txs positioned at their estimated M0 spots on the assembly line. (*) and (**): single and tandem asterisks displayed in some figures indicate TH.1 and TH.2 i-FSs.
Anatomia 04 00012 g002

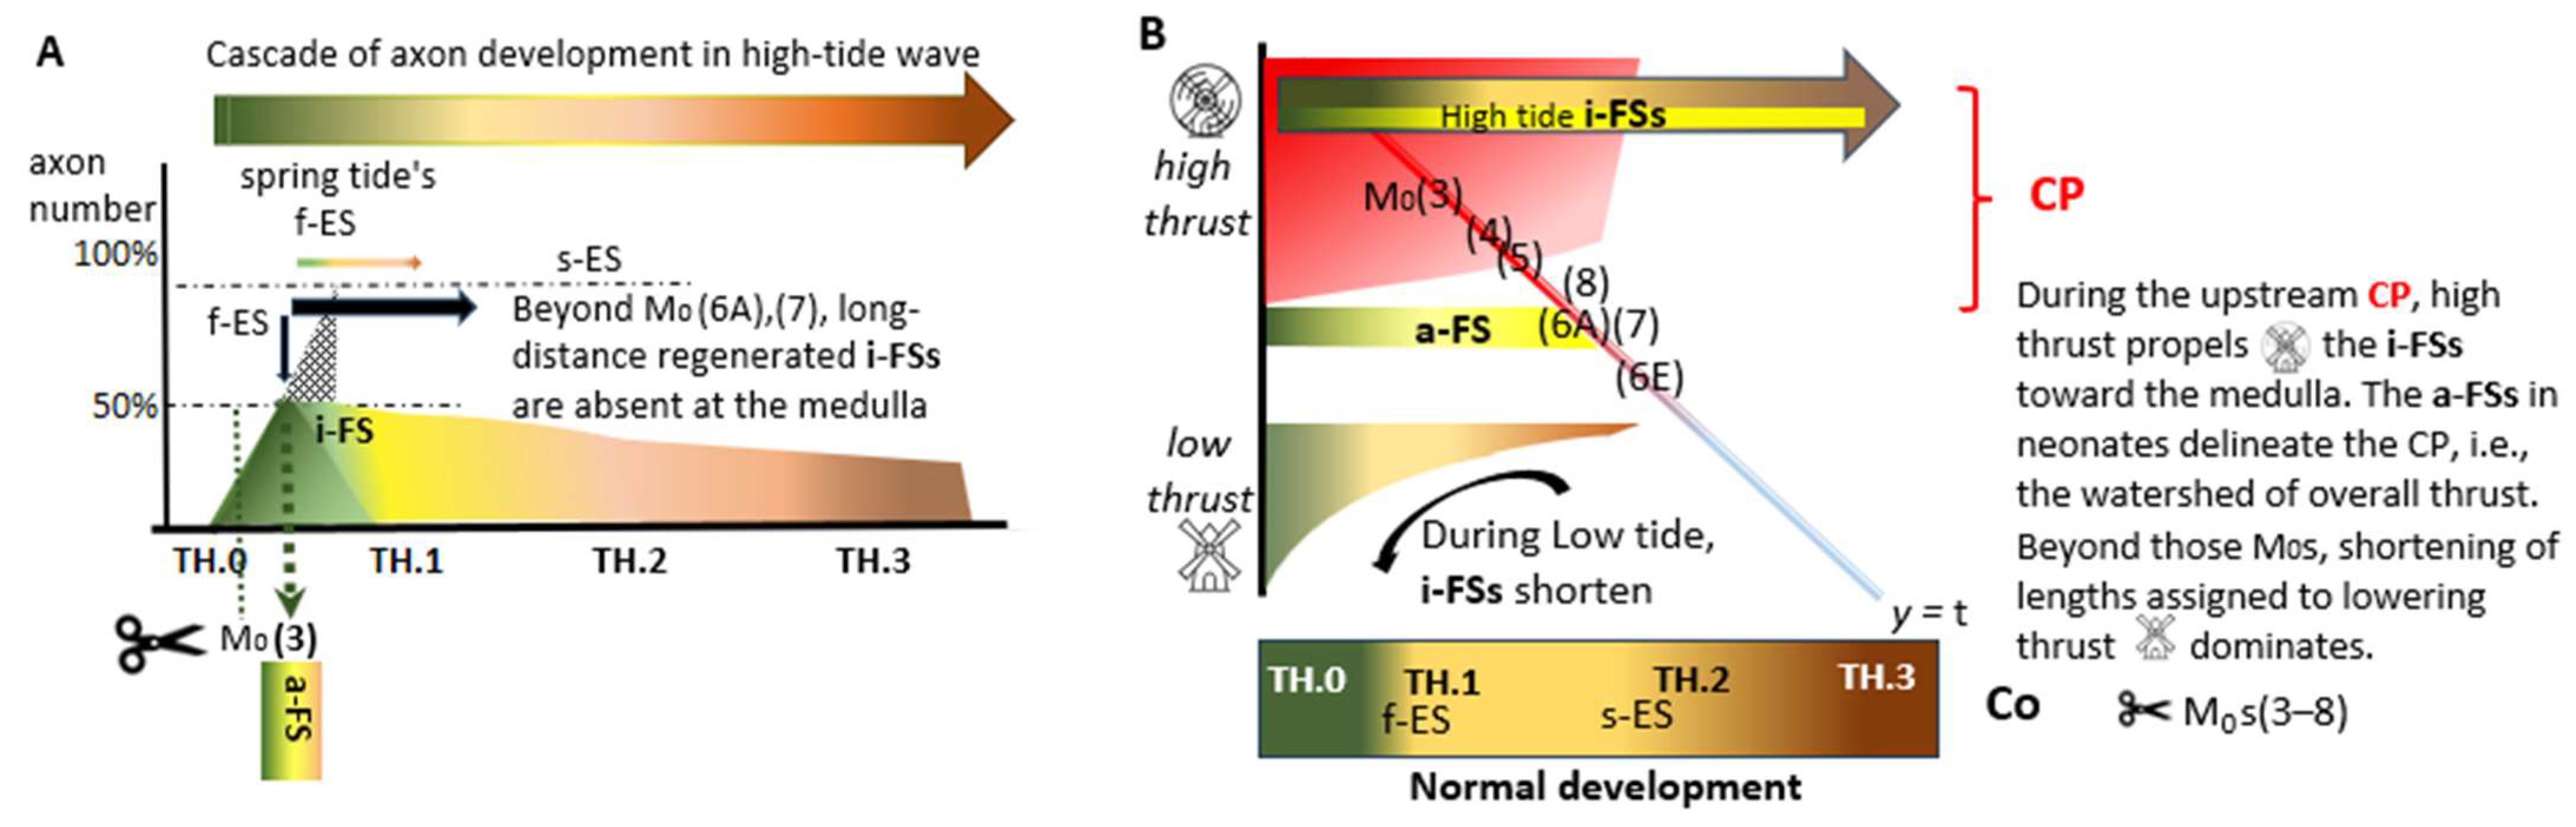
2.4. The Watershed: Axons Share the Critical Period Restricting Intrinsic Regeneration

The cutting of the pioneering TH.0 stage or the upstream transitioned TH.1 stage axons triggered the DRG neurons to adapt, creating the distinct WM-facing TH.1 (*) i-FS and CG-facing TH.2 (**) i-FS phenotypes, respectively. The TH.1 regenerated axon mimicry exhibited a permanent, WM-facing terminal club-like feature, substituting the hypothetical transient and ephemeral fast elongation stop (f-ES) phenomenon. The TH.2 reprogrammed axon mimics the slow elongation switch (s-ES) phenomenon. In contrast, the CG-facing axon termination is a conspicuous downstream feature. Notably, the hallmark TH.1 (*) i-FSs from the TH.0 pioneering axons share a biphasic nature with the TH.2 (**) i-FSs from the just transitioned TH.1 axons.
The development of the long primary afferent system’s bi-location is associated with both high-tide and low-tide axons. The connection between the TH.1 and TH.2 axon stages occurs regardless of their location within the spinal cord, resulting in similar developmental features. In contrast to these similarities, we observed regeneration only in the upstream-generated i-FSs. Their regenerative ability is clearly present in the high-tide axons. However, whether TH.2 (**) i-FSs regenerated into the medulla might be less apparent due to uncertainty about the exact tissue facing the i-FSs at the medulla. At least, the spotty label enhancement within gracile nuclei suggested the presence of TH.2 (**) i-FSs. Comparable to Clarke’s nucleus in caudal levels, the possible terminations of high-tide TH.2 (**) i-FSs might increase the label intensity in gracile nuclei. Notably, all the other severed up- and downstream axons passing by might also contribute to the enhancement. Nevertheless, at the caudal levels, the low-tide TH.2 (**) i-FSs terminated not only caudally from the lesion site but also grew beyond it. Considering the f-ES and the s-ES may exert slightly different translatomes in up- and downstream axons, sharing a similar i-FS feature raises the question of whether their translational profiles in high and low-tide axons would differ. We have linked this issue supposedly to a situational factor, specifically the thrust that governs each and every axon, rather than an intrinsic developmental program. The available thrust may explain why both the adapted high-tide TH.1 and TH.2 i-FS regenerate, while their low-tide counterparts do not. The reprogrammed dynamic features define the critical period (CP), exemplified by the characteristic a-FS formed with bundled TH.1 i-FSs. Ultimately, whether or not those i-FSs demonstrate regeneration is questionable, especially considering that they may already be located beyond the CP.

3. Results

3.1. Regeneration Comes to a Halt Before Neap Tide

The rostral i-FSs are classified as regenerated axons after Txs during the CP (Figure 2B). However, the reprogrammed phenotypes demonstrate a particular variability in the length of the rendered axons. At high tide, the TH.1 (*) and TH.2 (**) i-FSs regenerate across the lesion site as far as the level of the medulla. At low tide, the axons remain distant from the rostral lesion site. The phenotypes display a uniform axon feature, which can vary in length. The variability suggests a hidden factor that we assign speculatively to thrust, providing energy for axon elongation. When the overall amount of thrust peaks, severed fibers can regenerate beyond their cut-off level. This effect is linked to Txs of the pioneering axons still on their way to the medulla, just before and immediately after they had transitioned. Recovered from the impact of Tx, ample thrust propels these high-tide TH.1 i-FSs successfully into the medulla. The “upstream” unharmed TH.0-stage axons accompany them alongside and transition into colls in the gracile nuclei, as shown in Figure 2B at (4)–(6). At the caudal spinal level and downstream M0s, Txs might render more TH.1 (*) and TH.2 (**) i-FSs when severing high- and low-tide axons concomitantly without fiber regeneration (see Figure 6E–H). These findings suggest that fiber elongation may cease when energy is in short supply, specifically during neap tides. Noteworthy that the CP closes more upstream. The shorter lengths at neap tide may likely represent axons of the intermediate subdivision, of which the multilevel Clarke’s nucleus is their target [12]. The data show that low-tide axons exhibit a gradual length shortening. Graduality is hardly noticeable in high-tide axons, which exhibit dynamic features. Nevertheless, an occasional TH.2 (**) i-FS has been found in the rostral medulla.

3.2. Six Bell Ringer Cases Exhibiting All Dynamic Features

The paradigm induces a brief perturbation of the intrinsic development plan. In response to about half an hour of hypoxia, DRG neurons are reprogrammed. This susceptibility to hypoxia renders a distinctive feature of axons in the upstream cascade. In the next figures, two infographics (A and B) help us understand the development state in the blink of an eye, just like Figure 1C,E,D,F. The colored bars illustrate the imaginable development states of the long primary afferent system in the DC at M0, i.e., just before the Tx. The line graphic visualizes the artist’s impression of the Tx’s durable impact on the fiber system. The colors refer to the stages of the axon assembly line (Figure 1). The estimated number of parent axons and i-FSs at M0 determines the case order of Figure 3, Figure 4, Figure 5, Figure 6, Figure 7 and Figure 8 on the red-blue line (Figure 2B). Figure 3, Figure 4, Figure 5, Figure 6 and Figure 7 illustrate multi-stage axon configurations, often in conjunction with upstream parent axons. They accomplish the physiological development down the cascade, penetrating the gracile nuclei. Figure 7 shows the last TH.2 (**) i-FS at a sub-medullary level. Figure 8 shows an a-FS outlier exhibiting a single-stage monomorphic configuration at the level of the medulla (Discussion). Finally, Figure 5 shows low-tide axons with decreased axon lengths, reflecting the inferred minimal thrust. Figure 6E–H is a twin exhibiting downstream TH.2 (**) i-FS features only. The pertinent signs and abbreviations are listed in Table 2.
Table 2. Glossary for Figure 3, Figure 4, Figure 5, Figure 6, Figure 7 and Figure 8.
* asteriska single asterisk indicates a TH.1 i-FS
**asterisksa tandem asterisk indicates a TH.2 i-FS
***asterisksthree asterisks indicate downstream TH.3 colls
g.nugracile nucleus
4th Vfourth ventricle
L|Th|CLumbar|Thoracic|Cervical segment of the spinal cord
c <== ==> rcaudal <== ==> rostral direction of the spinal cord
d <== ==> v dorsal <== ==> ventral in a sagittal section of the spinal cord
L/Rleft side/right sideof the spinal cord in a horizontal section
Nfix pinholean artifact from tissue processing; a number identifies the spinal cord’s level derived from the gelatine block’s count
Anatomia 04 00012 i005spinal level of Tx
Anatomia 04 00012 i006depicted level in the Figure
In the medulla of the T78.p40 male (Figure 3C), the high-tide axons exhibited the multi-stage axon configuration. This finding indicated an upstream M0, likely occurring during the first half of the CP. The later developed axons reflected full thrust and transitioned into the TH.3 (***) colls developed from parent axons arrived after the Tx. They predominantly labeled the gracile nucleus on the left side. The amount of labeling indicated a reduction in the number of axons, consistent with the loss of upstream severed axons. On the right side, the TH.1 (*) and TH.2 (**) i-FSs might partially counterbalance the loss observed on the left side. These regenerated fibers were tipped with blunt terminal club-like features at the right and left gracile nuclei, underlining a fetal Tx. Caudally from the medulla (Figure 3D), one final TH.2 (**) i-FS was visible in the right DC, possibly originating from a neuron in the most caudal DRG at L6.
Figure 3. The T78.E16+2h.p40 male showcased the upstream state of high-tide pioneering axons. (A) This infographic illustrates the Tx level in the upper thoracic spinal cord (indicated by scissors), highlighting the most upstream pioneering long primary afferent axons, TH.0 (in green) and TH.1 (in yellow), during the first half of the CP. Anatomia 04 00012 i007 denotes the spinal levels at C and D (horizontal sections). (B) The lines (in yellow and ochre) represent the TH.1 (*) and TH.2 (**) i-FSs from within the CP’s first half and TH.3 (***) colls (in brown) originating from parent axons at the medulla from within the CP’s second half. (C) Anatomia 04 00012 i008 The p40 young adult exhibited a medulla with multi-stage axons in both gracile nuclei. The spotty TH.3 (***) colls in the left gracile nucleus indicated accomplished development due to presumably sustained high thrust levels. Phenotypically altered TH.1 (*) and TH.2 (**) i-FSs outnumbered others in the right DC. The increased labeling on the right side confirmed that many axons had regenerated across the damaged midline septum. (D) Anatomia 04 00012 i009 Caudally from the medulla, occasional TH.1 (*) and TH.2 (**) i-FSs were present in the DCs. t = time. N: iron fix pinhole. Bars: 100 µm.
Anatomia 04 00012 g003
After almost two years, the left gracile nucleus of the V1.p600 male (Figure 4C) exhibited numerous TH.2 (**) i-FSs, and a few Th.1 (*) i-FSs might be present too. The parent axons that could have grown mature might exhibit scanty TH.3 (***) colls. In contrast, the thoracic TH.1 (*) i-FSs of low-tide fibers distanced from the lesion site implied the inability to regenerate beyond the lesion site. However, these i-FSs contained labeling indicating that they had recovered. The shorter lengths were assigned to inferred insufficient thrust at M0, beyond the closure of the CP (Figure 4D). The TH.1 (*) i-FSs were distributed throughout the caudal DC. The reduction in lengths was paramount and permanent. After almost two years, those i-FSs, tipped with the typical blunt terminal clubs (tcs), had recovered from the Tx and were still distinguishable from the parent axons. Moreover, they were found on either side of the lesion site, i.e., at caudal and bilateral rostral levels.
Figure 4. The distinct features of the V1.E16+6h.p600 male remained visible after almost two years. (A) The Tx level was located at the upper thoracic level of the spinal cord. Anatomia 04 00012 i010 
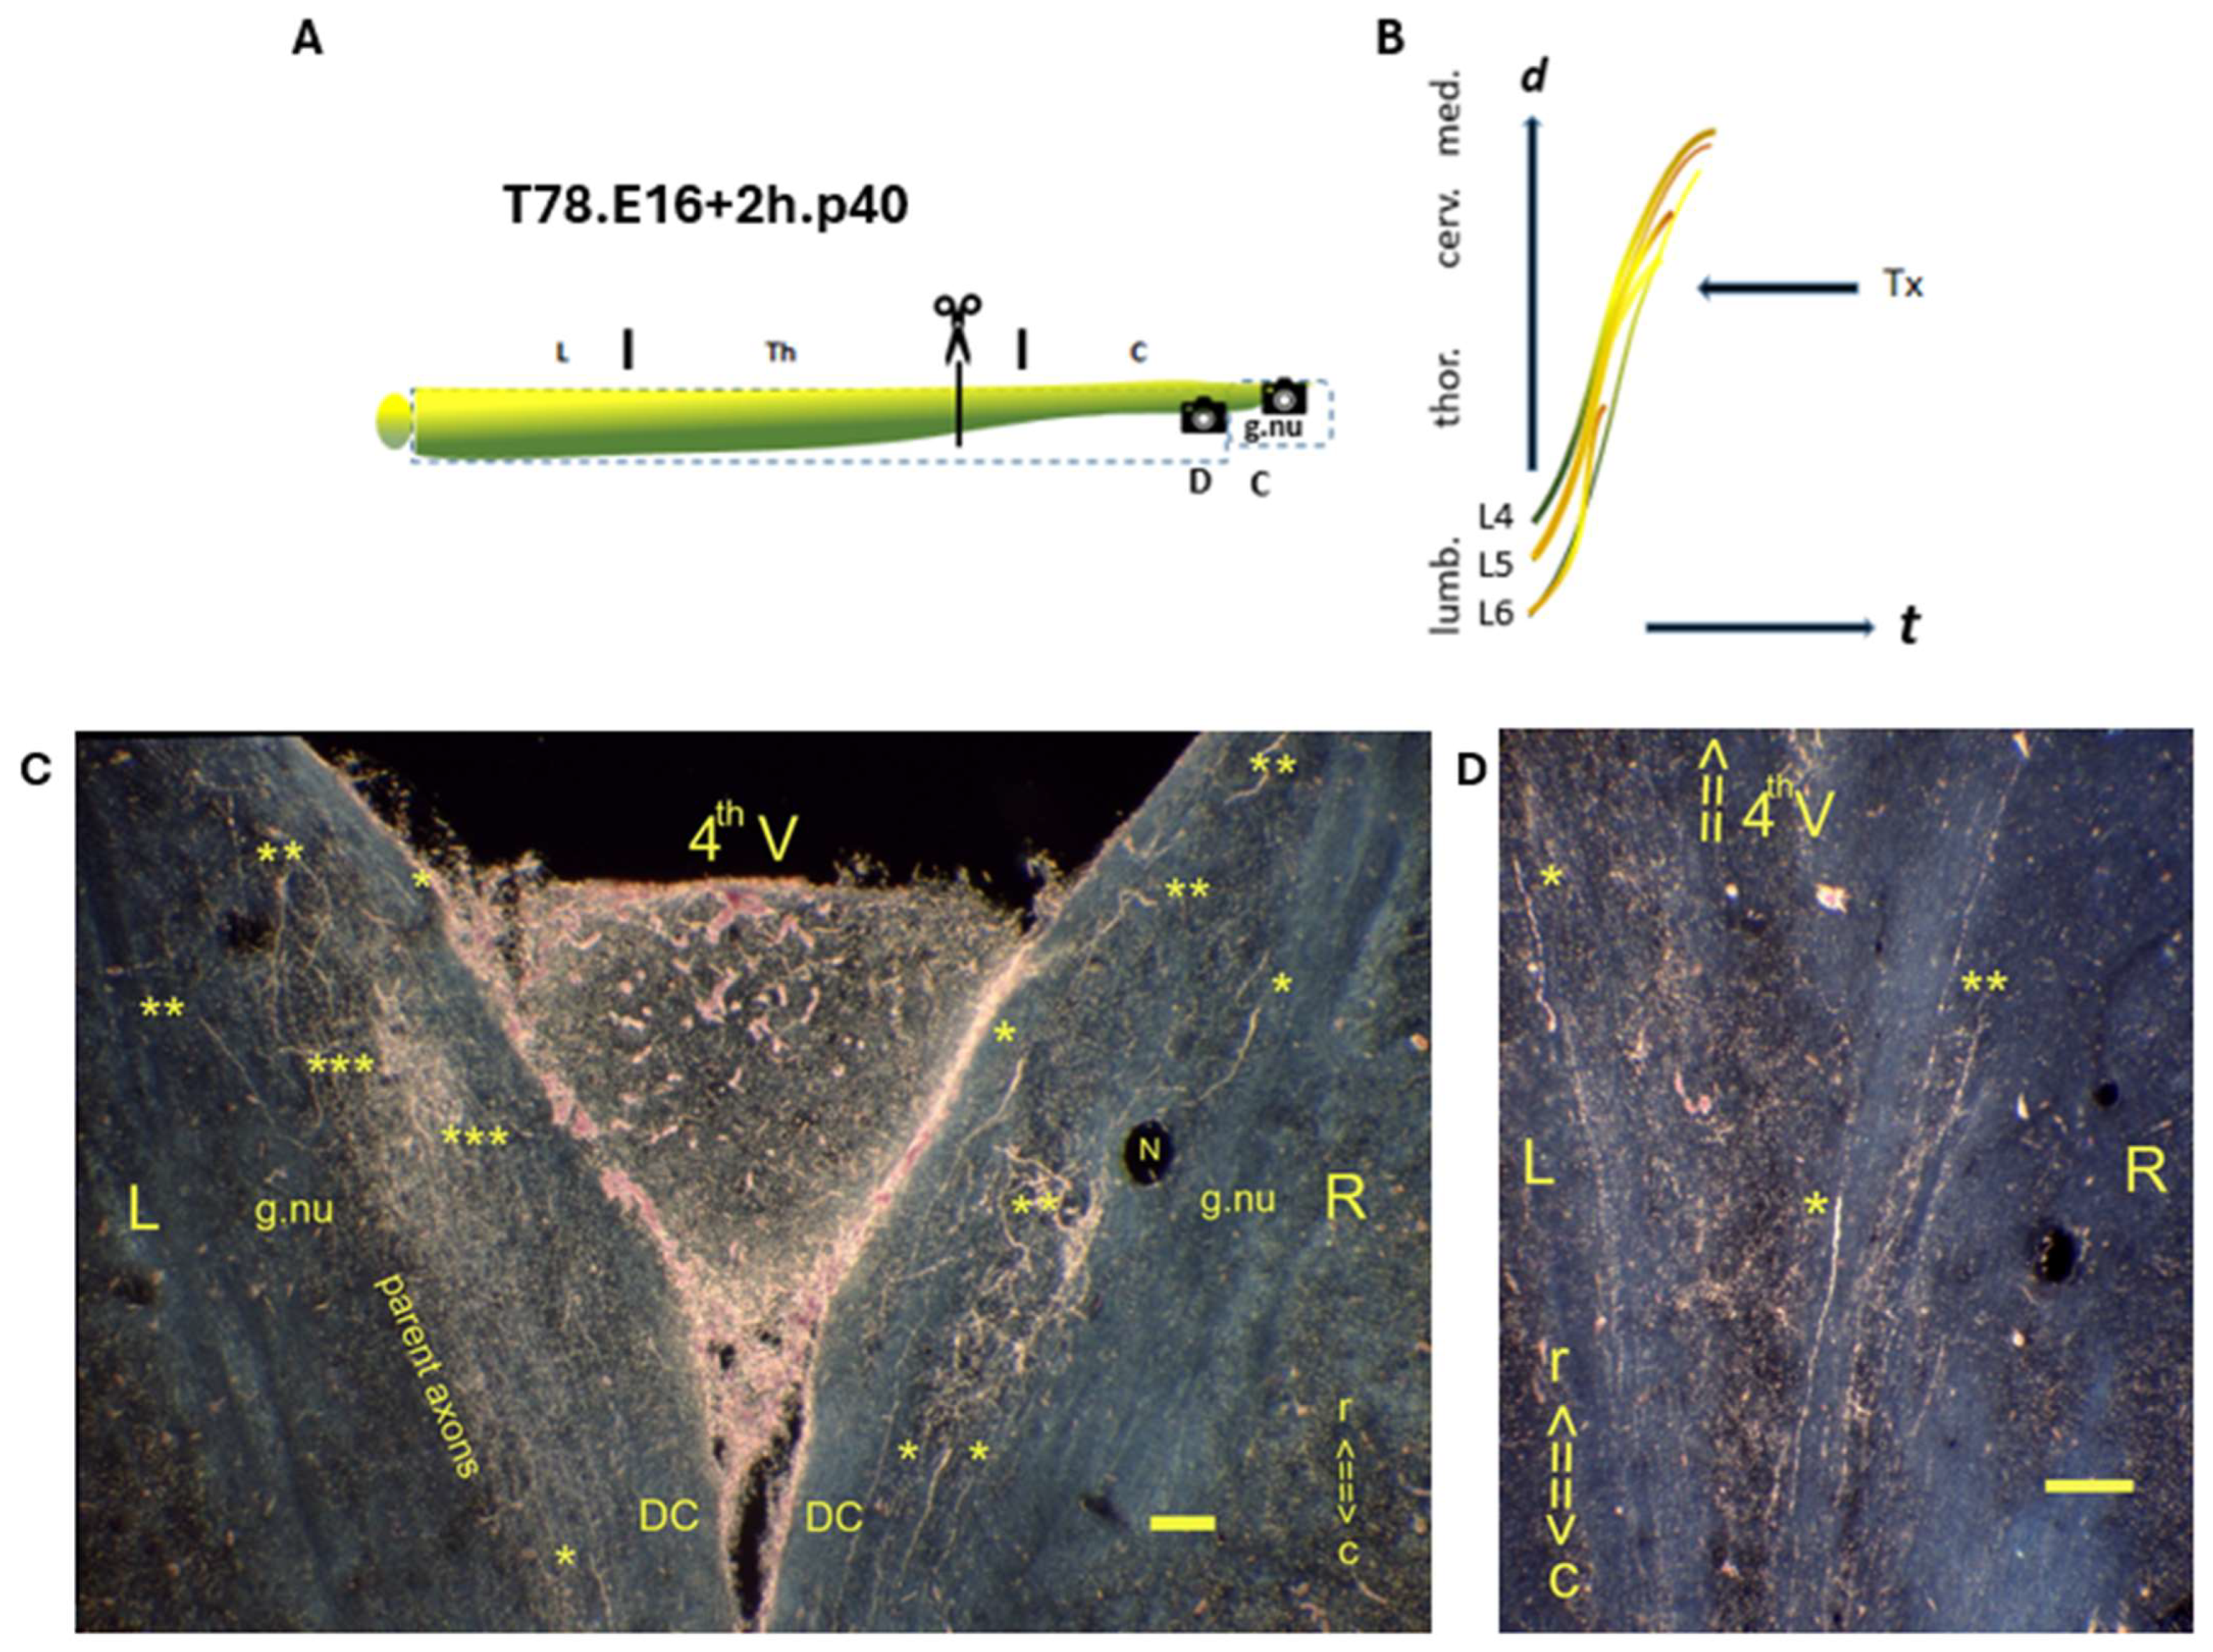
denotes the spinal levels at (C,D). (B) The axons in the medulla demonstrated that the CP had not been closed. (C) Anatomia 04 00012 i011 Horizontal section of gracile nuclei. The p600 male showed TH.1 (*) and TH.2 (**) i-FSs in the medulla. TH.3 (**) colls cannot be ruled out. (D) Anatomia 04 00012 i012 Sagittal section of the mid-thoracic spinal cord. The multilevel TH.1 (*) i-FSs elongated to caudal levels distant from the lesion site. Fading thrust was thought to determine their shortened lengths. t = time. N: iron fix pinhole. Bars: 100 µm.
Anatomia 04 00012 g004
In the left gracile nucleus of the T42.p240 female (Figure 5C), there are TH.2 (**) i-FSs, next to TH.1 (*) i-FSs. Considering the fewer axons in the left gracile nucleus from an estimated downstream M0 compared to the previous p600 male, TH.3 (***) colls from parent axons might be rather unlikely. At the lesion site, the a-FS was age-morphed and had lost its hallmark feature, exhibiting just a few TH.1 (*) i-FSs abutting the caudal lesion site. A dorsal surface tag marked the lesion site (Figure 5D). That might be formed by external scar tissue. This stigma covered the lesion site’s CG glia, different from the outmoded term glial scar [25].
Figure 5. In this T42.E16.p240 female, the long primary afferent axon development had progressed downstream near the CP’s closure, compared to the former p600 male. (A) The Tx level was located in the lower thoracic spinal cord. Anatomia 04 00012 i013 
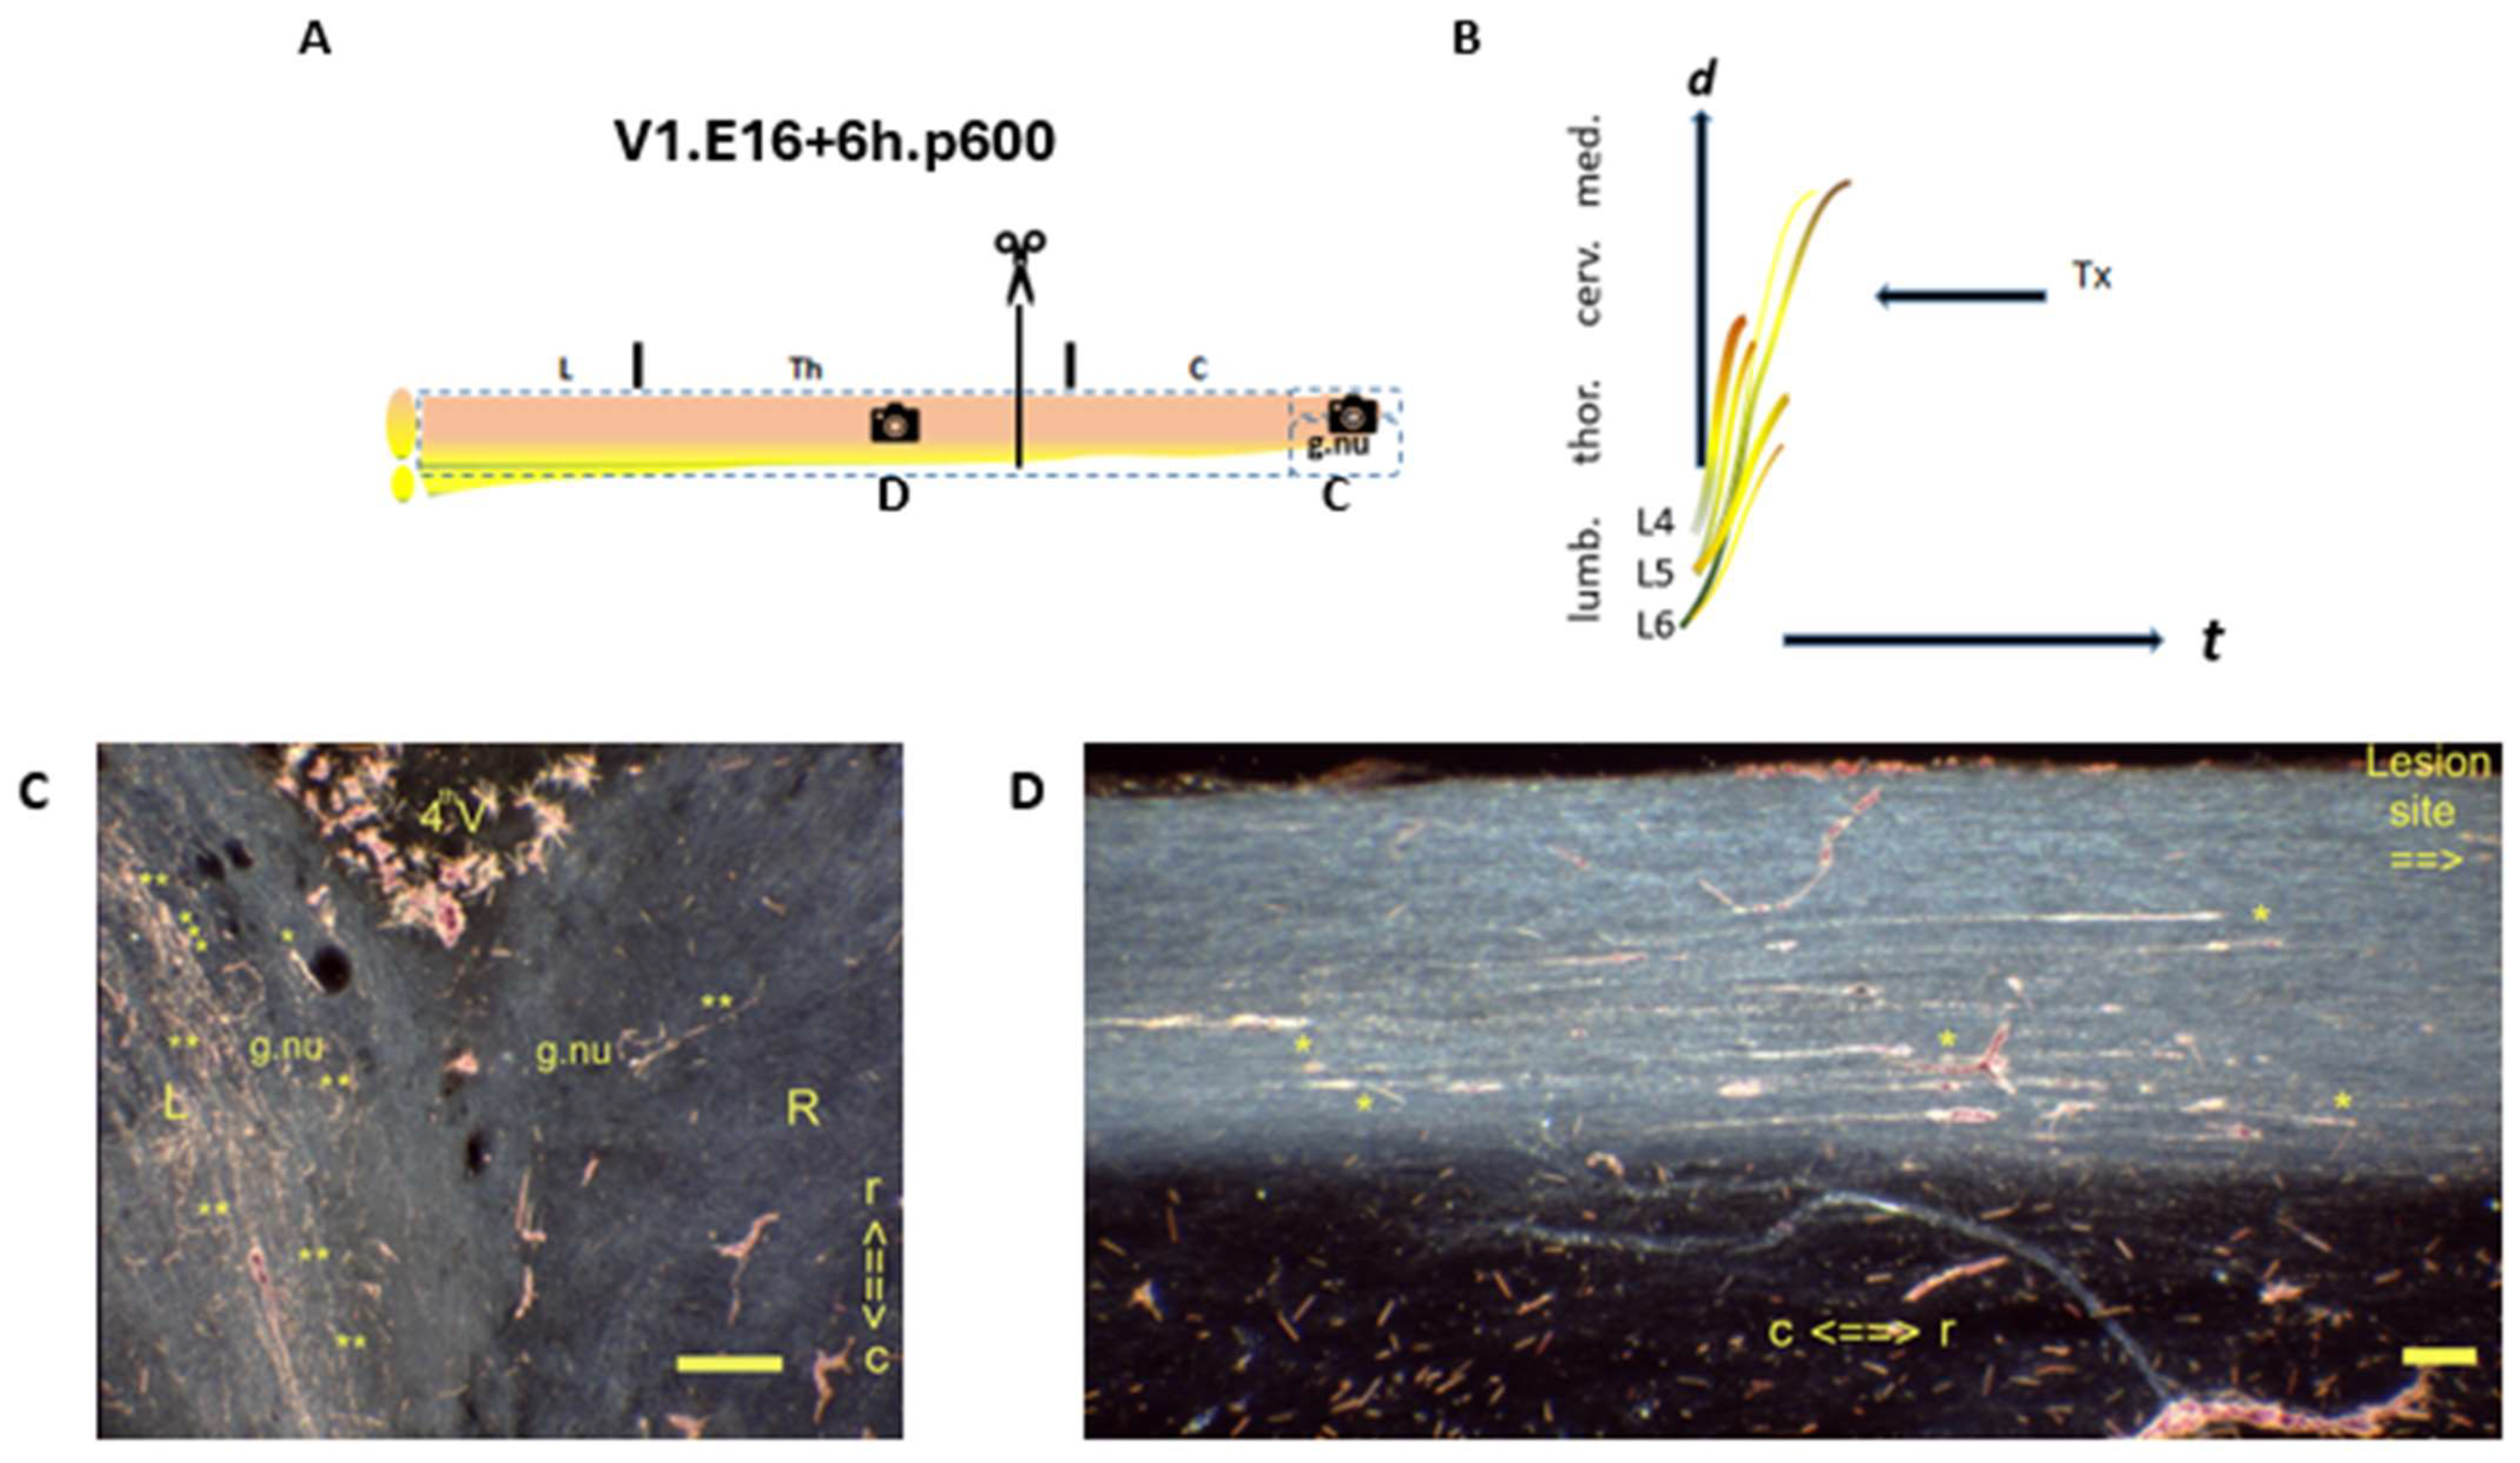
denotes the spinal levels at (C,D). (B) Various i-FSs had crossed the lesion site. (C) Anatomia 04 00012 i014Horizontal section of gracile nuclei. The p240 female exhibited the left gracile nucleus labeled possibly with a few TH.2 (**) i-FS. The presence of TH.3 colls would have required parent axons. That is questionable considering the estimated M0 downward on the cascade compared with the previous case. (D) Anatomia 04 00012 i015Sagittal section at the lesion site. A fibrous attachment marked the lesion site covering the CG. A few age-morphed TH.1 (*) i-FSs (*) abutted the lesion site caudally. The a-FS in the neonate had been morphed with age; these few dispersed i-FSs had remained, exemplifying the morphed feature into the adult state over time. These axons re-elongated close to the level of the Tx. Bypassing the lesion site ventrally, another few fibers were present. These TH.1 or TH.2 i-FSs might have labeled the left gracile nucleus. t = time. N: iron fix pinhole. Bars: 100 µm.
Anatomia 04 00012 g005
The Tx-rendered hallmark a-FS exhibiting the bundled TH.1 (*) i-FSs abutted the cervical lesion site in the neonatal W2.p9 male. A peculiar dorsal hump was also noticeable (Figure 6C). Moreover, lumbar axons of more caudal origins, presumably TH.2 (**) i-FSs, might have outrun those blocked upstream predecessors and regenerated into the fringe of the left gracile nucleus. This inverted i-FS combination might result from the situational availability of more thrust in axons at the s-ES. Whether this multimorphic lesion configuration could encompass TH.0 parent axons might be questionable, as the a-FS indicated a Tx during the CP’s second half. Furthermore, the configuration of the left gracile nucleus might show underdevelopment with a rather conspicuous label-free core. TH.0 parent axons would have created a mirror configuration from TH.3 (***) colls, which might have labeled the left gracile nucleus more uniformly (Figure 6D).
Figure 6. (AD) The W2.E16-7h.p9 male showcased the hallmark of fetal Txs: the neonatal a-FS built by joined TH.1 (*) i-FSs. (A) The Tx level was located at a low cervical segment. Anatomia 04 00012 i016 denotes the spinal levels at C (sagittal section) and D (transverse section). (B) A few TH.2 (**) i-FSs might have regenerated into the medulla. (C) The lesion site was marked with a dorsal hump. The hallmark a-FS abutted the caudal lesion site. Various TH.1 (*) and TH.2 (**) i-FS were visible in the neuropil. (D) The labeled left gracile nucleus might exhibit an empty core fringed with labeled TH.2 (**) i-FSs. (EH) In the W2.E16-6.5.p42 female, the configuration turned monomorphic, with decreased dynamic features. (E) The Tx level was located at an upper thoracic level. Anatomia 04 00012 i017 
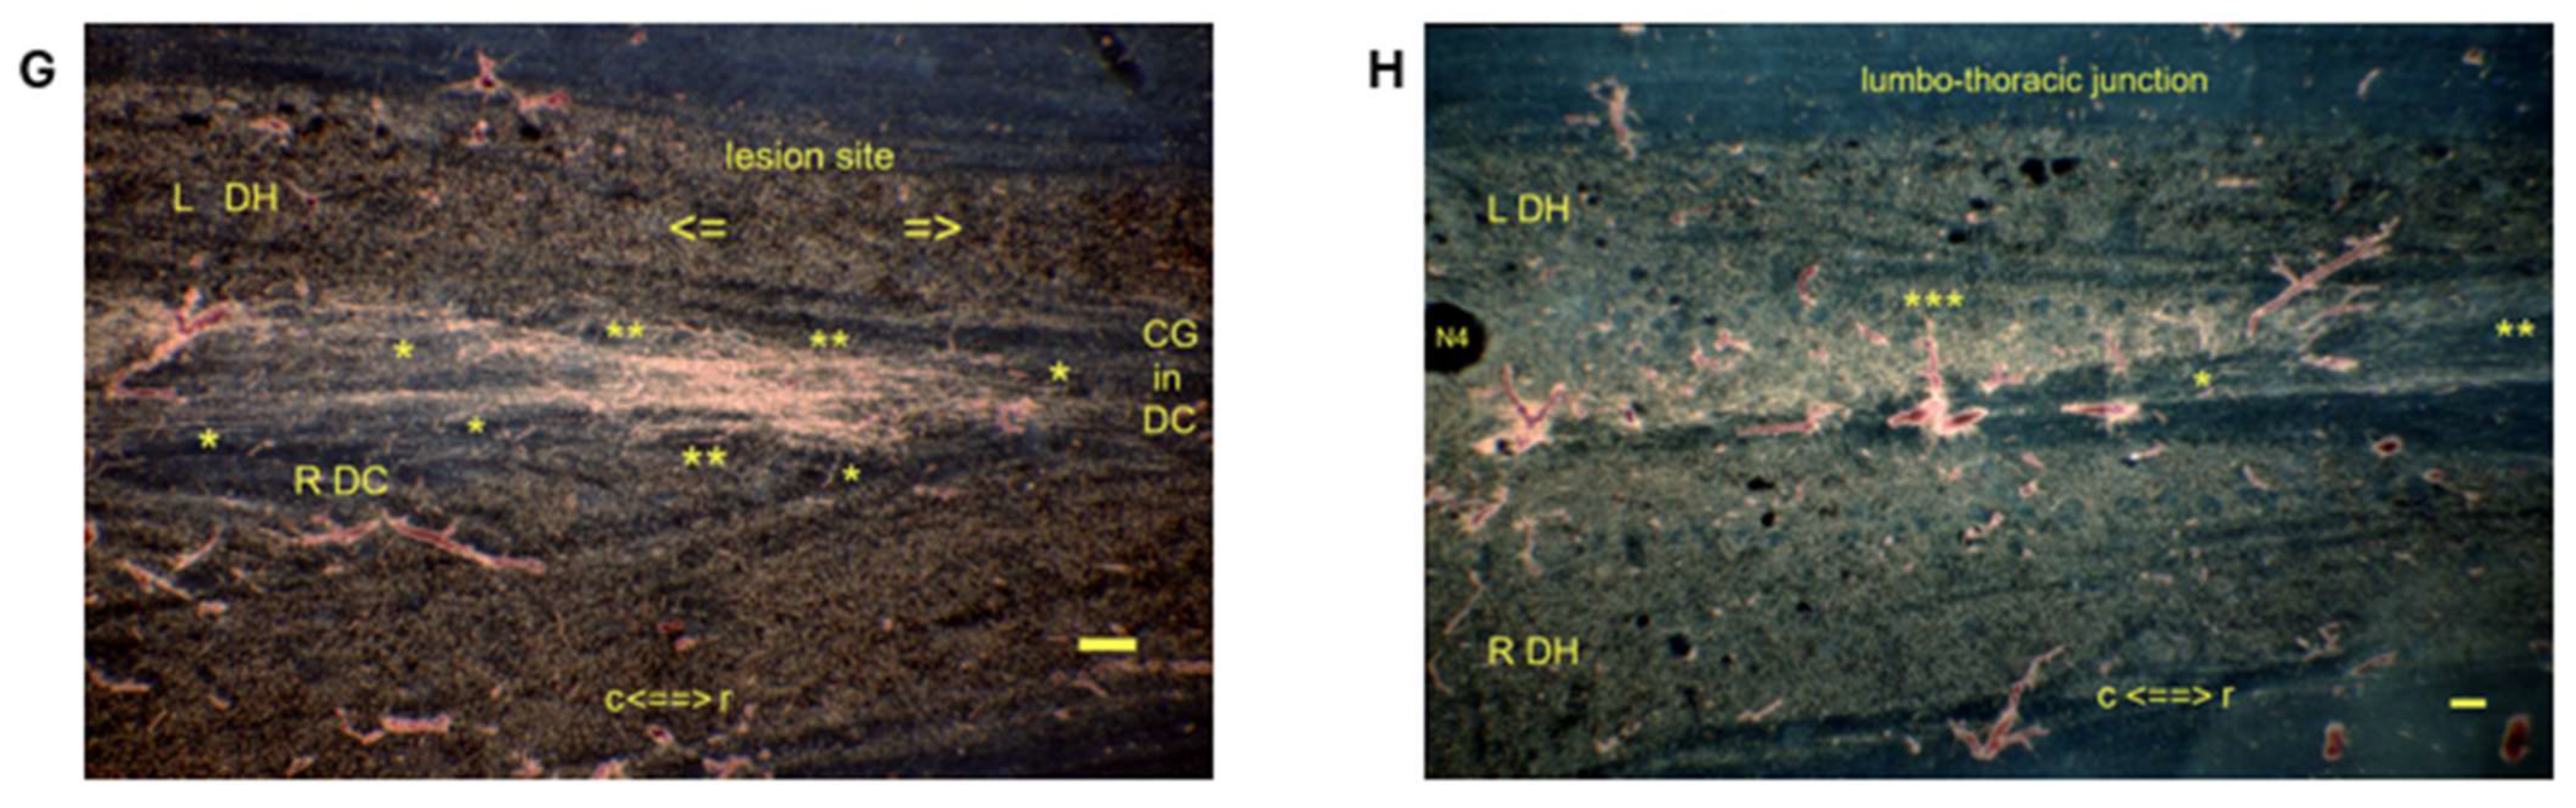
denotes the spinal levels at (G,H) (horizontal sections). (F) The probably low-tide severed TH.1 (*) and all the TH.2 (**) i-FSs terminated caudally into the lesion site. The severed high-tide axons could also have contributed to the enhancement, leaving the gracile nuclei without label. (G) The Tx rendered the CG in disarray. The left-sided TH.2 (**) i-FSs crossed the midline, exhibiting downstream dynamics in contrast to those that had lost dynamics and remained on the left side. (H) The impaired labeling of Clarke’s nucleus matches the current dissociation. The presence of TH.3 (***) colls of low-tide parent axons targeting Clarke’s nucleus is also considered possible. t = time. Bars: 100 µm.
Anatomia 04 00012 g006aAnatomia 04 00012 g006b
This young adult W2.p42 female with an upper thoracic Tx demonstrated that the system’s development could progress quickly, showing a monomorphic configuration beyond the CP. The Tx fell half an hour later than her twin neonate (Figure 6A–D). All the long primary axons had been cut, and the CG-facing TH.2 (**) i-FSs abutted the caudal lesion site. Possibly, low-tide TH.1 (*) i-FSs were among them (Figure 6G). No label was detected in the medulla, indicating that the capacity for regeneration had been eliminated. There was no identifiable microscopic structure suggesting the presence of a glial barrier typical of the rest of the fetal Txs. The area of the dorsal horns indicated the lesion site, where the axons crossed the disrupted midline septum. The midline crossing at the united DHs establishes a downstream dynamic feature on its own. Notably, the long primary axons were recuperated with the visible label near the fetal Tx. Based on data like these, it is still unclear whether retrograde degeneration was ongoing. Compared to her littermate, this configuration indicated a more downstream location on the assembly line, as shown in Figure 2B. The spinal development might have been delayed due to dissociation, given reduced labeling of Clarke’s nucleus (Figure 6H).
The W20.p6 male neonate was comparable to the former p9 with similar features (compare Figure 6A–D and Figure 7). The submedullar DC contained a final TH.2 (**) i-FS that had not reached its target at the level of the gracile nucleus, which was devoid of labeling. Again, the three axon development stages were mixed at the lesion site, marked by an intraspinal cyst. The obvious TH.3 (***) colls scattered throughout the neuropil had to be assigned to parent axons. This feature aligns with the dissociation of the upstream neuropil. As a result, these low-tide axons could not penetrate the CG, which exhibited a primordial state of Clarke’s nucleus [12] Due to the neuropil’s dissociation, high- and low-tide axons coalesced in the DC [12]. The paradigm’s impact elucidated the temporal and spatial separation of de facto upstream CNS axon regeneration features of the high-tide rostral TH.1 (*) and TH.2 (**) i-FS, together with the downstream coll formation of low-tide parent axons. Notably, we might qualify those short-range TH.3 (***) colls for abortive CNS regeneration at the downstream cascade.
Figure 7. The Tx’s M0 of this W20.E16-9h.p6 male neonate illustrated the features near the CP’ closure. (A) The Tx level is at the upper thoracic spinal cord. Anatomia 04 00012 i018 
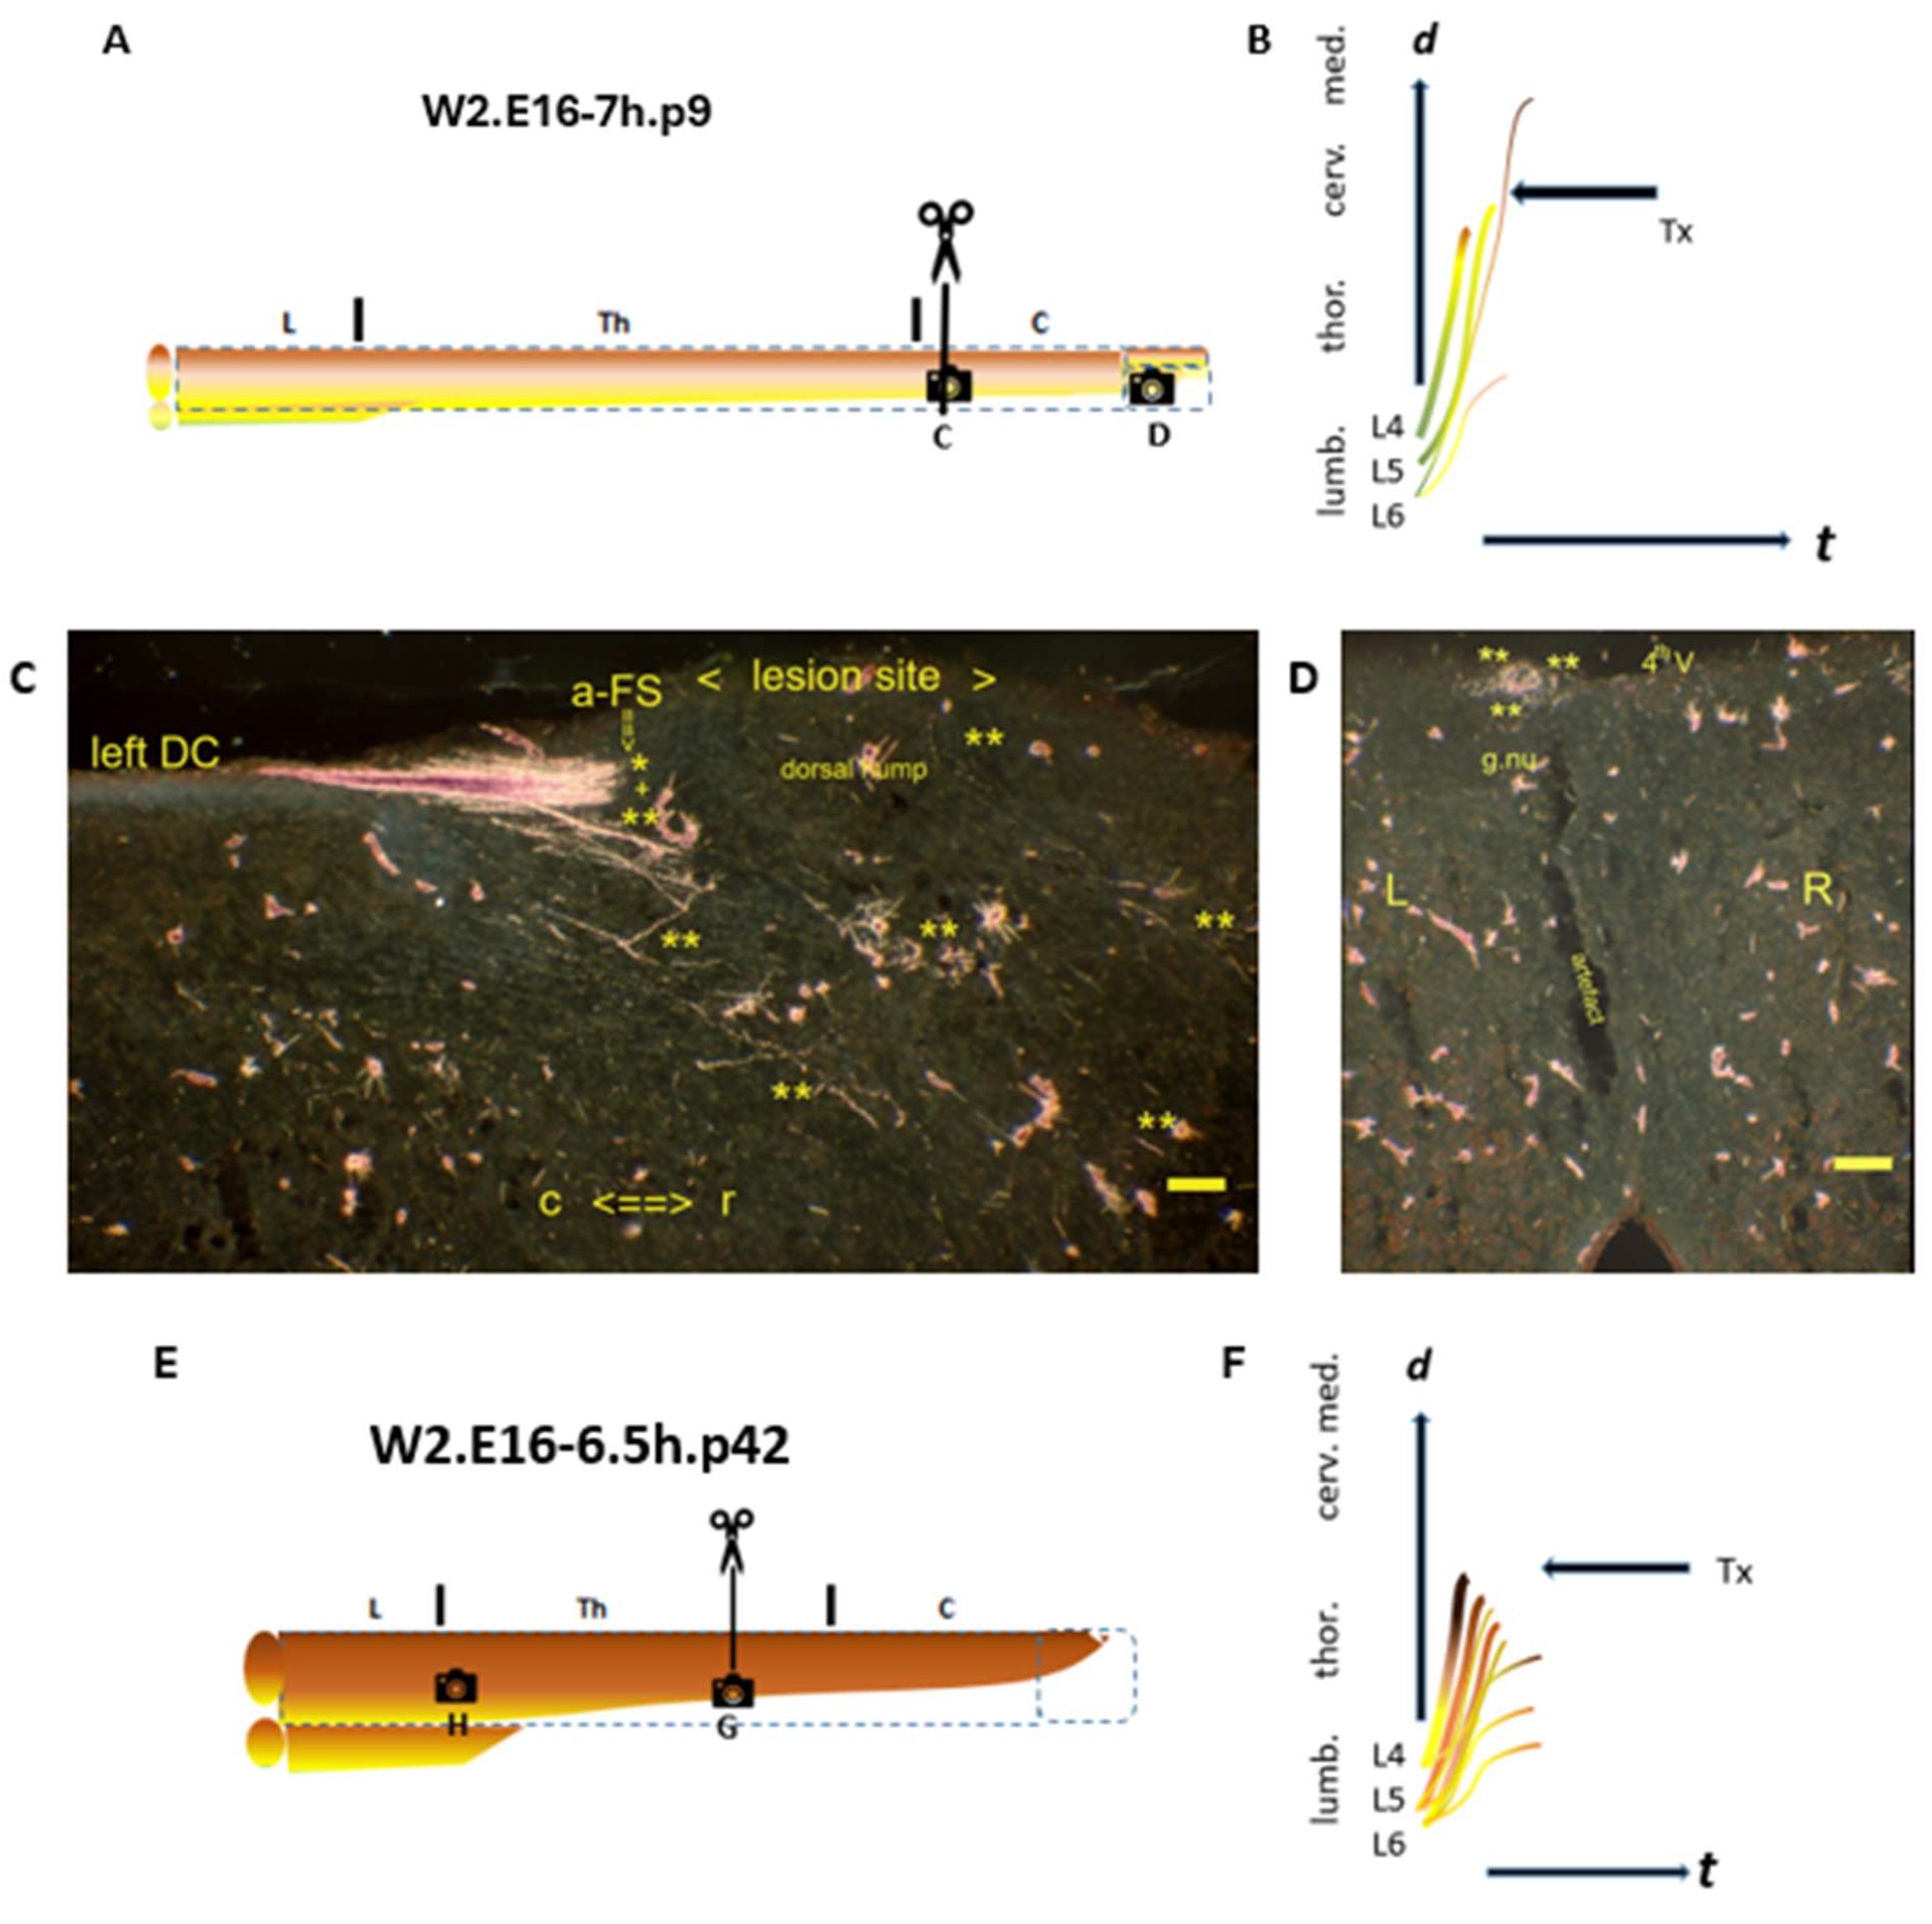
denotes the spinal levels at (C,D) (horizontal sections). (B) The closure of the CP is imminent. (C) Anatomia 04 00012 i019 In the left rostral DC, the final TH.2 (**) i-FS did not reach the medulla. (D) Anatomia 04 00012 i020 The lesion site’s level was first and foremost identifiable by the midline cyst. The a-FS showed a typical feature of bundled TH.1 (*) i-FSs in a neonate. Several TH.2 (**) i-FSs might have regenerated beyond the lesion site without reaching the medulla. The TH.3 (***) colls exhibited an unusual growth pattern of variable lengths throughout the CG. Their dystopic levels in the upper thoracic spinal cord might indicate they originated from low-tide parent axons, aligning with dissociation. t = time. Bars: 100 µm.
Anatomia 04 00012 g007
The medulla of the W14.p14 female (Figure 8C) showed a highly remarkable a-FS-like feature of superficial TH.1 (*) i-FSs that had bypassed the gracile nucleus. The continuity with the i-FSs present caudally in the DC was assumed. The configuration resembled the hallmark a-FS but had been slightly morphed with age. The i-FSs appeared to have grown far beyond their proper ventral target of the left gracile nucleus, which had remained completely blank. This peculiar, monomorphic configuration in the upper medulla raises questions about the mechanism responsible for this outlier feature (Discussion). The one-of-a-kind lesion site exhibited a multilevel diastematomyelia, which masked the exact Tx level. This pathology did not deter the i-FSs from bypassing the lesion site. The most upstream cut TH.1 and TH.2 axons during the first half of the CP (Figure 8A) had supposedly terminated caudally into the lesion site.
Figure 8. A peculiar a-FS-like feature at a too rostral level is captured in this W14.E16-8h.p14 female medulla. (A) The Tx level is at the upper thoracic spinal cord. Anatomia 04 00012 i021 denotes the spinal levels at (C,D) (horizontal sections). (B) The yellow WM-facing TH.1 (*) i-FSs regenerated into the medulla. (C) Anatomia 04 00012 i022 The left DC (open arrow) covering the gracile nucleus harbored likely the axons connected to the a-FS, which regenerated to a remarkable rostral medullary level. The axons had bypassed the left gracile nucleus. The elongating axons from L5 and/or L6 DRGs might have created this unusual a-FS when severed just before and/or just after the transition assigned to the f-ES phenomenon at the medulla. (D) Anatomia 04 00012 i023 The lesion site exhibited the traumatic origin of a diastematomyelia at the thoracic level. The left DC contained TH.1 (*) i-FSs regenerated into the medulla. t = time. Bar: 100 µm.
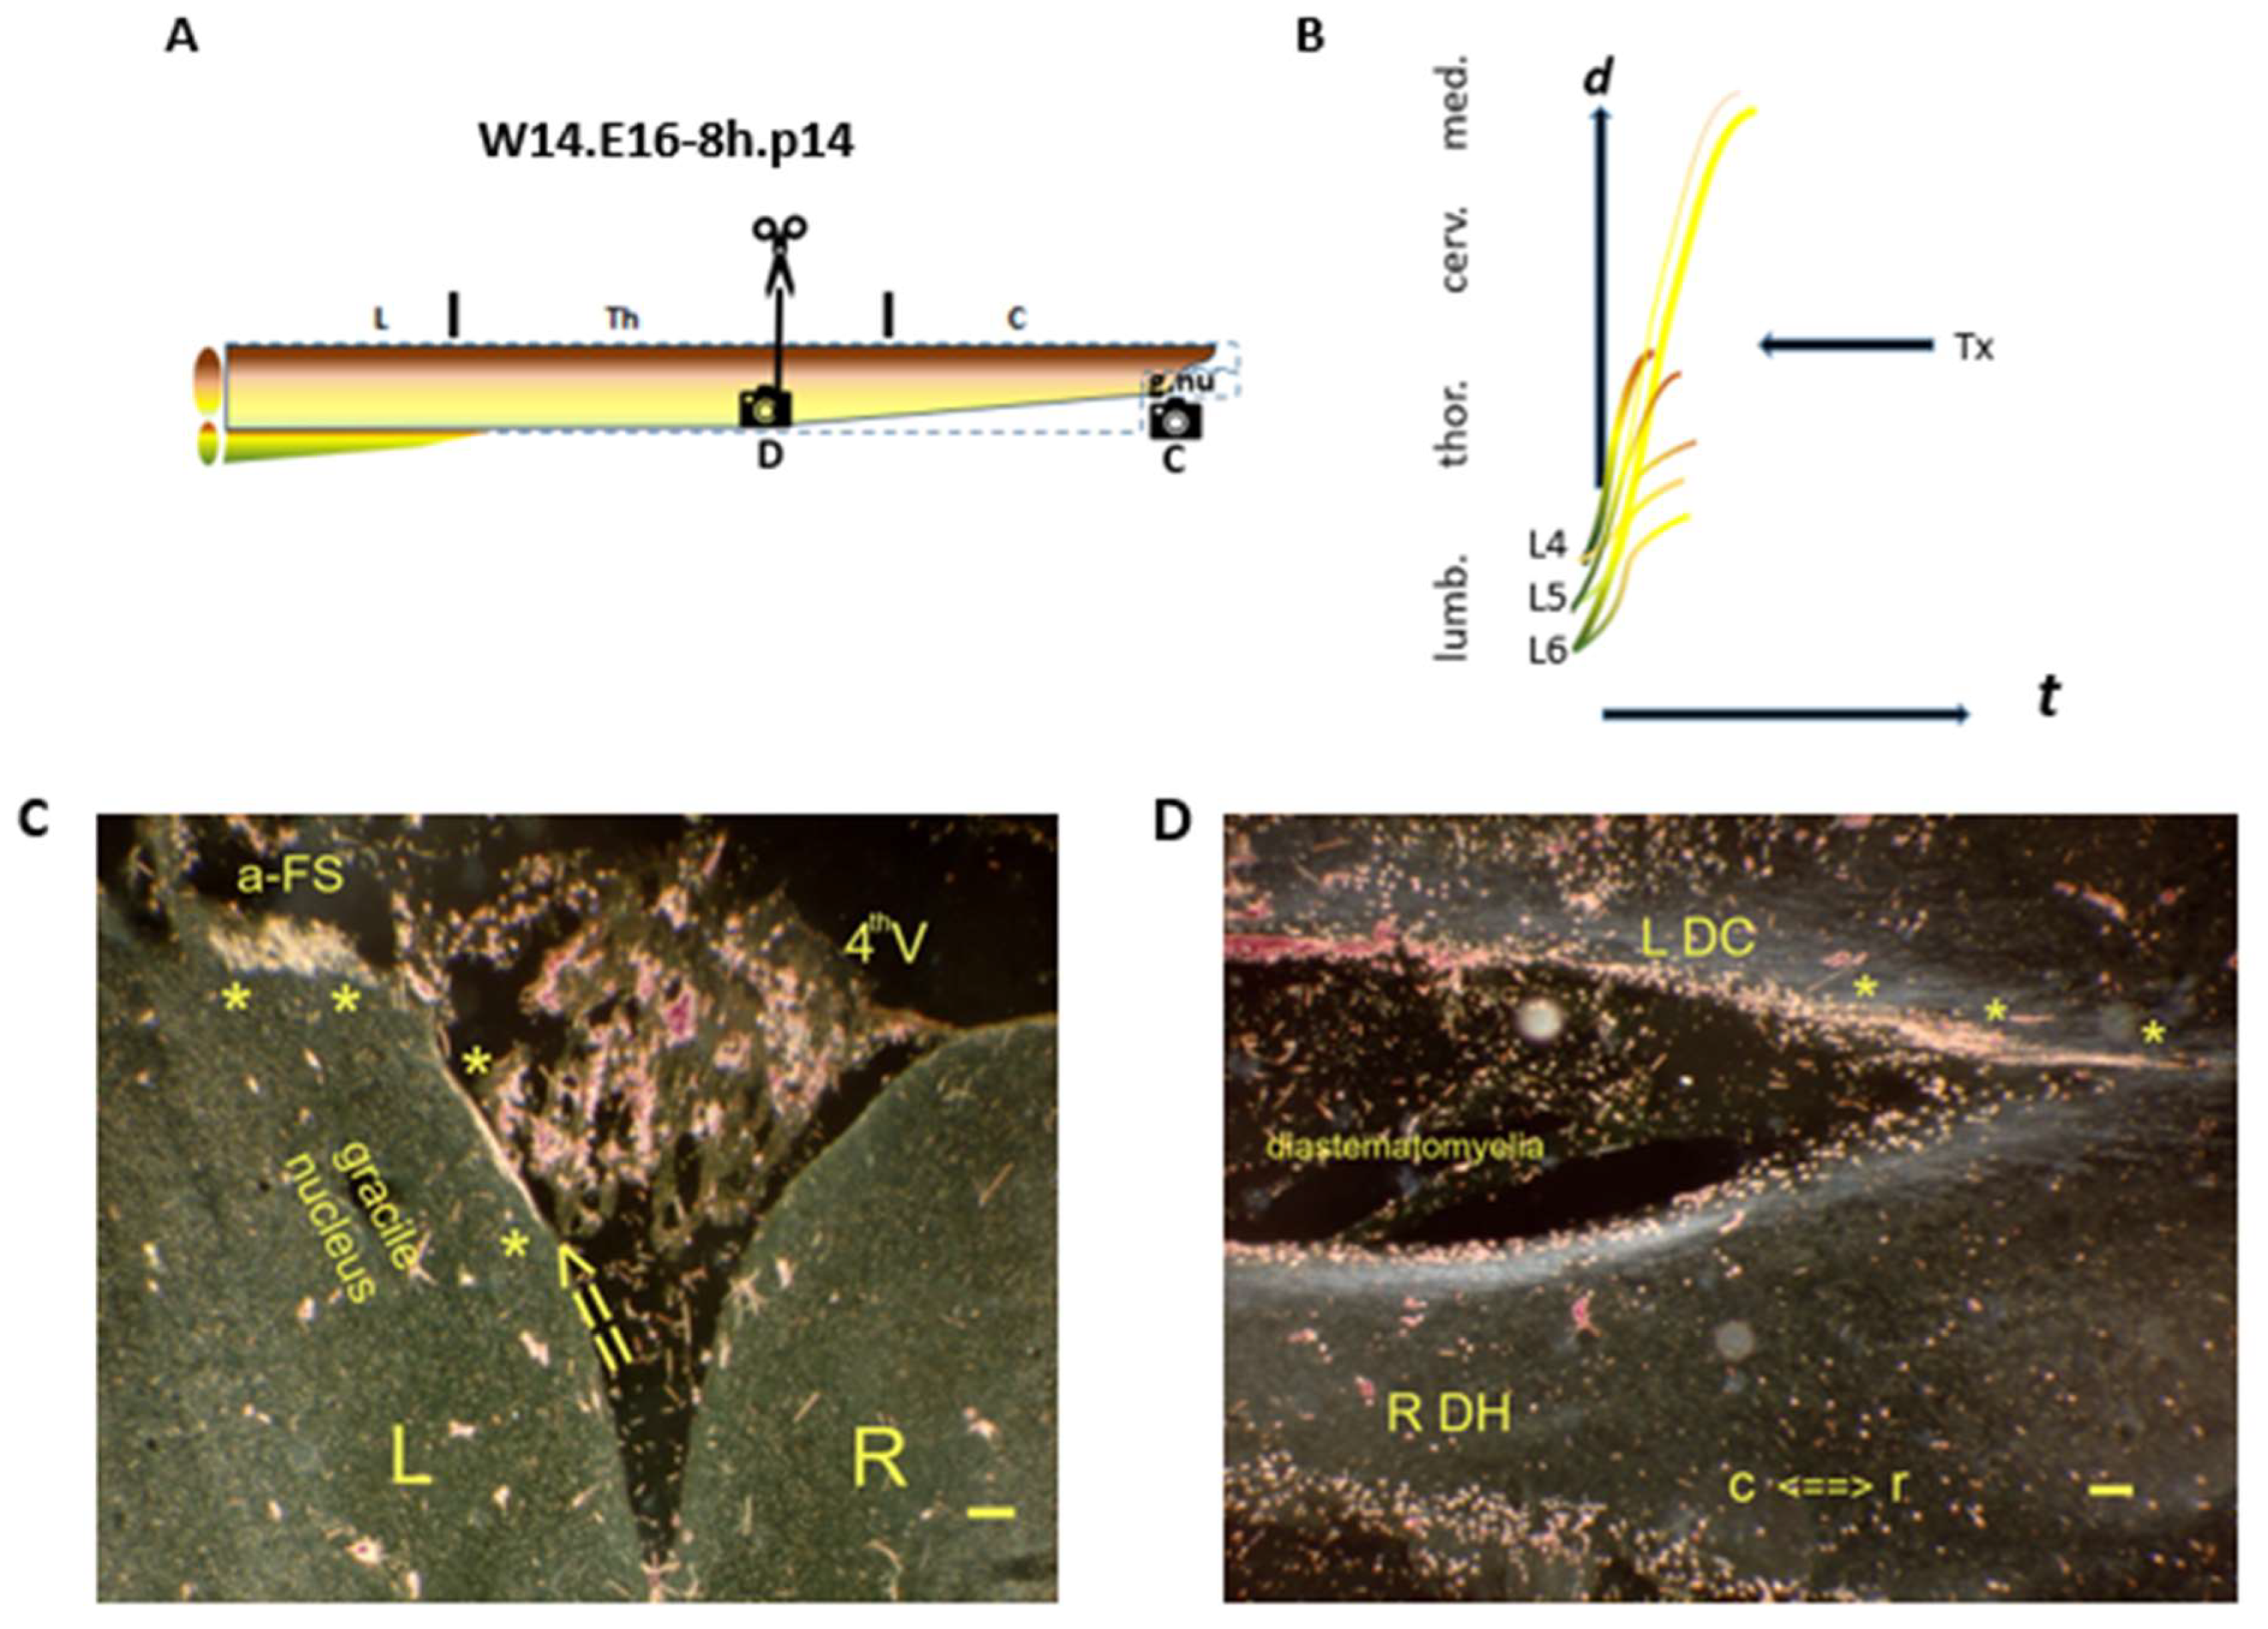
Anatomia 04 00012 g008

4. Discussion

Our paradigm produces two adapted phenotypes of cut long primary afferent axons that exhibit central nervous system (CNS) regenerative capacity. Thirty minutes of hypoxia reprograms the intrinsic developmental plan of susceptible, immature, dorsal root ganglion (DRG) neurons. The critical period (CP) delineates this Tx-induced perturbation of high-tide axon development. The results demonstrate the permanently identifiable intrinsic front stop (i-FS) axon features. The regenerative capacity is limited to high-tide wave axons. The permanently visible phenotypes reflect both the hypothetical fast elongation stop (f-ES) and the slow elongation switch (s-ES). These ephemeral phenomena correspond with the hypothetically designated transition hubs (THs) on the upstream assembly line. Nevertheless, they occur both within and beyond the CP [12]. In a brief time window during the upstream CP, positioned before and shortly after the TH.1 transit (f-ES) in the pioneering axons, is where the dynamically regenerating TH.1 (*) and TH.2 (**) i-FSs originate. Notably, the identical features raised in low-tide axon waves terminate caudally from the lesion site, exhibiting non-regenerative dynamics. The assumption that different phenotypes exhibit similar i-FS features in high-tide and low-tide axon development on the assembly line may raise doubts about the observations made in this retrospective study. Moreover, the identification of the TH.1 (*) and TH.2 (**) i-FS features as different is questionable due to interpretation bias. In hindsight, valid questions arise as to whether these drawbacks could have been prevented by conducting the study differently, including incorporating a scientific prerequisite, such as using sham operations. And will these data be reproducible?
Sham operations would have been of paramount significance to the data we presented. We now know that the data had been affected by Txs under hypoxic conditions, which were not monitored during the experiments. So, their impact remains unquantifiable. Nevertheless, we tried to account for their confounding impact throughout the data analysis as soon as we became aware of it [24]. Addressing this issue scientifically requires a study into the duration and depth of hypoxia exerted on fetuses of different gestational ages, without performing Txs. Researching the factors that cause relevant variability in fetal hypoxia warrants a sophisticated approach [26]. The seminal paper by the Swedish group introduced a cold-water fetus submersion protocol that was globally applied and remained in use for decades [27]. Our data on fetal immaturity clearly showed that hypoxia triggered the adaptive capacity with an impact on the translational sequelae, despite the Tx. In combination, this intervention shed light on previously invisible developmental events [12]. Remarkably, the mainstay i-FSs remain permanently visible and, no doubt, will be reproducible. Future research is necessary, and this task must be fulfilled. We mention another, more trivial reason why sham operations for controlling data had not been considered. First of all, it would have deterred our efforts from raising operated fetuses and their resulting tracing features at any age. Without the Tx intervention, the paradigm could not have revealed the unknown steps along the developmental cascade of the afferent system. The tracings would exhibit an ultimate state of development. Either a well-developed, full-blown, long and short primary afferent system, or incomprehensible signs of whatever result might have become from dissociation phenomena in the neuropil. The potential abnormal growth of the neuropil would have been harder, if not impossible, to understand without the interventional Tx [12]. Impaired development would be difficult to document, as it might only be uncovered as retardation, which is hard to confirm among littermates with known developmental swiftness and gestational variability [12]. Figure 6A–H exemplify this phenomenon. We had an abundance of controls, which served as substitutes for the ones that were supposed to be operated but turned out to be control littermates due to incorrect selection shortly after birth. The confirmatory tracing results were essential, except for a few that bore a dorsal stigma, which indicated the highest probability of accuracy.
Therefore, whether stratification can be properly applied considering the context mentioned above is doubtful. Selecting two fetuses that yielded the same result depended on the individual M0, which varied between littermates, as shown in Figure 6A–H. During the CP, the differing results were described as kaleidoscopic, dependent on the fetus’s dynamic gestational status. The swiftness of the primary afferent system’s development was sensed by appreciating the short time window of the CP, which could not be measured with a stopwatch. The conceptual blueprint enabled us to classify the results within the bounds of valid science, applying inductive reasoning independent of common statistics. This paper elaborates on a process centered on these captivating stills of sorted stepstones leading into the uncharted territory of upstream development. We delineated the CP as critically conditioning the CNS regeneration potential. The regenerative capacity is limited to the permanently identifiable TH.1 and TH.2 i-FSs, if they originate in the CP. However, to counter questionable interpretations clouded by bias, we relied on events at both ends of the cascade. Our blueprint indicates that the developing long primary afferent axons follow a single intrinsic developmental plan, regardless of whether a high-tide or low-tide wave occupies the axon. Keeping this principle in mind, classifying events at the medulla aids understanding of those at the caudal spinal levels and vice versa. Such support was provided by low-tide WM-facing TH.1 (*) i-FSs, which extended to various lengths and remained caudally from the lesion site. Their high-tide counterparts traveled into the medulla, originating from the lumbar DRG neurons that likely initiated the process. They may be responsible for spring tides and high-tide waves. The same events might hold for CG-facing TH.2 (**) i-FSs. The downstream feature is documented, as shown in Figure 6G. The mixture with TH.1 (*) i-FSs in the medulla, as seen in Figure 3C,D, is supportive, too. This blueprint 2.0 upgrade explains the variable impact of inferred thrust, postulated as the generator of crucial energy from intra- and/or extracellular energy compounds. This invisible commodity is available, controlled, and dispatched under unidentified and situational conditions, our analysis suggests. That might explain why TH.2 (**) i-FSs outran upstream TH.1 (*) i-FSs, joined in the pathognomonic cervical a-FS, as shown in Figure 6C. That might be a plausible predisposition of some dynamic TH.2 (**) i-FSs. Likewise, some WM-facing TH.1 (*) i-FSs terminating in the fringe might also be considered plausible. The TH.1 (*) i-FSs in Figure 8C might also explain the situational thrust that does not fit in the blueprint’s cascade of normal development.
Regarding the aforementioned examples, the question is whether our data provide a plausible explanation for the physiological translation of the hypothetical f-ES and its relation to the s-ES. Rephrasing the sentence, it is intriguing to consider that the TH.1 (*) i-FS and the TH.2 (**) i-FS might share translatomic profiles that are overridden by the invisible commodity, namely, thrust. The data show the temporal and spatial connection and, most importantly, that gradual shortening is a common feature in both types of i-FS. This paper describes the recovery and long-distance regeneration of cut high-tide i-FSs extending as far rostrally as the medulla at an inferred high speed. This capability was speculatively assigned to high thrust levels. The uptempo axon elongation may be due to the combination of Tx and hypoxia. Spinal cord transections and hypoxia are known conditions that can lead to elevated ATP levels [28,29]. These phenomena may even show synergy, called hypoxic conditioning. Regarding the paradigm’s physiological pathway, the Tx’s sequelae suggested situational conditions that determine where or when the f-ES and s-ES ultimately occur. Our previous paper addressed their primordial common trajectory and the likelihood of a non-prevailing intrinsic development plan regarding the wandering i-FSs’ whereabouts in the same DC [12]. Pertinent translatomic identities with similar chromatin 3D structures might facilitate future rejuvenation strategies in the upstream cascade [30,31]. A key question remains whether the mature state can rejuvenate and store upstream proteomics without halting development, thereby ensuring proper maturation.
Considering the downward events on the cascade, the data indicated that a lack of thrust might be accountable for the system’s failure to recapture. The abundance of negative results in the literature on CNS regeneration suggests a Catch-22. Low thrust might also limit the effectiveness of artificial tools, such as cell cultures. Additionally, cultured cell transplants do not meet the criteria for CNS regeneration. Axons without severance, albeit projecting long distances, are generated too slowly [32]. Speed is considered a crucial condition for regeneration. Based on our blueprint, we question the validity of equating TH.3 (***) coll formation or the time-consuming long-distance axonal projection with long-distance axon regeneration of TH.1 (*) i-FSs. The upstream i-FS with a bluntly tipped terminal club demonstrated regeneration beyond the lesion site, which was considered pathognomonic because it avoided the need for a total spinal cord transection [33]. The high-tide i-FSs’ lengths differed from those of low-tide i-FSs; they may all demonstrate thrust-driven effects rather than being primarily driven by the cell cycle [34]. In our previous paper, we postulated that the hypoxic conditions during spinal cord lesions might affect the inferred speed of axon growth [12]. Modulating mechanisms across cell types and through phylogeny strengthen the idea that growth speed is affected by the relationship between axon length and plausibly inferred thrust [35]. The growth slowed in low-tide axons but might also gear up in high-tide axons at spring tide. Purinergic signaling compound levels might multiply manifold compared to basic conditions [22,36].
This phenomenon suggests that thrust is a manipulable commodity, underscoring its potentially situational impact. Importantly, half an hour of hypoxia was an estimation of the procedure’s mean duration. Variations in the thirty-minute hypoxia may have a relevant yet undetermined impact on the i-FSs’ adapted phenotypes, as mentioned earlier. The susceptibility to hypoxia demonstrated the dynamics in the upstream CP. Beyond that short period, the development of the upstream unharmed axons along physiological pathways looked normal. Transient involvement of oxygen-sensing mechanisms may potentially point to HIF-alpha signaling pathways [21,22,23,37]. The mechanism permanently affected the TH.0 fibers, which were cut either before or immediately after the TH.1 transition. That might compromise profiling neighboring proteomic signatures.
Situational conditions can lead to unclear profiling results when upstream and downstream i-FSs are indiscriminate [38]. Reference validation for pioneering axons versus coll formation requires reliable profiling tools with development stage specificity. Our data strengthen the need to cast doubt on the assumed validity of proteomic profiles of cultured embryonic stem cells without proper assessment. The findings justified a critical appraisal of the current CNS regeneration research, which might be flawed due to the application of inappropriately validated tools. They might have been reprogrammed, exhibiting downstream profiles of differentiated TH.2-stage cells [39]. Inadvertently misjudged evaluation and validation of supposedly long-distance regeneration profiles might have impeded the effectiveness of translational experiments [40]. Qualifying parent axons and classifying colls as proof of CNS regeneration are comparable conundrums. Flawed profiling tools could lead to misinterpretations in CNS regeneration studies [19]. Moreover, the plausible excessive elongation tempo in upstream development might be pivotal in CNS regeneration. Effective research may benefit from incorporating the tempo topic into the CNS regeneration criteria established twenty years ago [19].
According to our data, the lumbar pioneering afferents are expected to reach the gracile nuclei at approximately 10 mm in one day or less between embryonic day 15 (E15) and embryonic day 16 (E16). This contrasts with the existing literature, which generally attributes a growth pace of 1 to 2 mm per day to both peripheral and central axons [41]. In vivo live-cell imaging has recorded a primary afferent axon growth rate of 1–2 mm/day [42]. Meanwhile, a recent observation in organoids noted a growth pace of 40 µm per hour, reflecting a neuronal phenotype with a similar proteomic identity [43]. However, our findings contradict the widely held dogma of axon outgrowth, which upholds a rate of 1 mm per day. This discrepancy has implications for the application of cell cultures and organoids. Profiled proteomics of neurons exhibiting the slow axon elongation tempo point at a downstream identity according to our axon development criteria, which have supposedly universal applicability. Profiles of transplanted cells, regardless of their source, and those forming colls demonstrate an abortive regeneration capacity, particularly when it takes days or weeks. Profiling the i-FS omics may help identify the physiological pathways involved.
Growth cone assembly and propulsion are the forefront features of pioneering axons that determine the elongation speed, revealing a manipulable tempo [5,44]. Our data strengthened the suggestion that excessive speed requires an extreme energy supply. If M0 fell in the right spot on the assembly line, the severed axons and the hypoxic conditions might have synergistically increased the availability of compounds for purinergic signaling [22,45]. Understanding ubiquitous purines and associated energy supply pathways reveals pertinent knowledge gaps, providing opportunities for future research [36]. We sincerely acknowledge the scientific contributions of Sir Geoffrey Burnstock (1929–2020), particularly his influential paper on purinergic nerves [46,47]. Purinergic signaling provides a potential mechanism for delivering significant amounts of adenosine compounds to the developing axon. It has taken twenty years to overcome skepticism about Burnstock’s purinergic hypothesis [36]. Today, it may be easier to characterize the compounds of the purinergic signaling system, assessing the oldest evolutionary preserved purine receptors required for CNS regeneration [48,49]. It will be necessary to determine when and where the proper amounts of pertinent molecules have an impact, supporting the view that the right molecule is present at the correct location at the right time [50]. Temporospatially pinpointed experimentation under controllable hypoxic conditions may reveal whether rejuvenation can alleviate preexisting development blocked after reprogramming.
Conclusions: Central axons of the long primary afferent system regenerate if severed when pioneering rostrally or right after they have reached their target in the medulla. This ability is confined to the upstream time window: the axons’ critical period. The paradigm can alter the phenotype in many ways, as hypoxia triggers the reprogramming of the DRG neuron. The resulting intrinsic fibers (i-FSs) are visible lifelong and distinct from parent axons, after just a single cut. At variance with upheld beliefs, the data suggest that the elongation speed of developing and regenerating axons is excessive and governed by an unknown mechanism. Purinergic signaling may account for a plausible source of energy. By inference, we assigned thrust as a suitable commodity for propelling the axon tips at variable speeds.
Limitations: The retrospective nature of this study prompted addressing relevant issues extensively following the first paragraph of the Discussion. Without the standardization of the techniques involved, this study would not have been possible. Current legislation imposes limitations that preclude researchers from acquiring the required skills to challenge another Catch-22: an inconvenient truth.
Recommendations: The reprogrammed i-FS’s translatome could offer an accurate physiological identity to start more effective research into CNS regeneration. A relevant step might involve its translational complex in recapturing an upstream transcriptomic signature, with the ability to regrow long-distance axons quickly and form colls during maturation [51]. Cracking these codes is crucial for engineering regenerative conditions in the adult spinal cord first, despite a repelling extracellular environment. Regarding the great scientific value of knockout mutants, their applicability must be cautiously weighed before being applied in CNS regeneration research. Relying on non-physiological phenotypes leads to misleading results [50,51,52]. Hopefully, the presented work will encourage the communities of the Purine and Pyrimidine Society to research these physiological pathways further, as they are shown here to be accessible.

Author Contributions

Conceptualization, F.C.d.B.; Investigation, F.C.d.B.; Resources, F.C.d.B.; Visualization, F.C.d.B.; Writing—Original Draft, F.C.d.B.; Supervision, H.W.M.S. All authors have read and agreed to the published version of the manuscript.

Funding

This research received no external funding.

Institutional Review Board Statement

Ethical review and approval were waived for this study due to its retrospective nature. The experimental work concluded in 1997, before the European legislation on animal welfare and institutional ethics board approval, which took effect on 2 December 2005. (https://wetten.overheid.nl/BWBV0002789/2005-12-02).

Informed Consent Statement

Not applicable.

Data Availability Statement

The figures in this study are digitized copies of original color slides from a valuable dataset. The author is eager to collaborate with researchers dedicated to exploring the paradigm’s challenges and is happy to share data upon request.

Conflicts of Interest

The authors declare no conflicts of interest.

Glossary

a-FSabrupt front stopA bundle of WM-facing i-FSs manifests in neonates. The a-FS abuts the rostral lesion site, and the phenotype demonstrates the blocked development [12]
CPcritical periodUpstream time slot(s) delineating elongation in each (and all) pioneering long primary afferent axon(s), as well as axon regeneration
CGcentral grayneuropil
collsTH.3-staged collaterals = collateral sprouting after the TH.3 transit. They confirm accomplished development, e.g., in gracile nuclei
DRGdorsal root ganglioninvolving the lumbar segments L4, L5, and L6 (HRP-tracing at the left side, only)
DCdorsal column
E16-8h15th day of gestationM0 is scheduled 15 days + 16 h after mating, restricted to 1 h
E16 day of conception without surveillance of mating time
f-ESfast elongation stopa hypothetical phenomenon of pioneering TH.0-staged axons arriving at the medulla and swiftly slowing down
fringeThe CG adjacent to the DC white matter
high tideIn the rostral DC, pioneering axons target the gracile nuclei in high-tide waves at spring tide
i-FSintrinsic front stopThe hypothetical TH.1- and TH.2-stage axon mimicries generate phenotypes, which demonstrate blocked development. At high tide, the i-FSs regenerate toward the medulla. At low tide, the TH.1 fiber tips remain caudally distanced from the lesion site, while the TH.2 i-FSs terminate caudally in the lesion site.
HRPHorseradish peroxidase
low tideIn the lower thoracic DC, pioneering axons target Clarke’s nucleus in low-tide waves at neap tide
Horseradish peroxidase
M0 The moment of Tx is referenced to the hour (or day) of conception and serves as the case ID in combination with survival time (Table 1). M0 has a temporospatial link with a location on the assembly line determined by the axon features, demonstrating variability. This underlines that the development of fetuses is prone to differ
neap tideSee low tide
s-ESslow elongation switchThe hypothetical phenomenon of TH.1 axons transitioning into the consecutive TH.2 stage
spring tideSee high tide
tc Terminal club: fiber termination with a configuration comparable to i-FS
THstransition hubsTH.0, TH.1, TH.2, and TH.3 are hypothetical transition hubs situated on the developmental cascade. TH.0 axons were reprogrammed into the TH.1 i-FS mimicry, and TH.1 into the TH.2 i-FS substitute
TH.0staged axonPioneering primary afferent axon in a high-tide, as well as a low-tide wave
Txdorsal myelotomyThe microsurgical procedure

References

  1. Bourguignon, L.; Tong, B.; Geisler, F.; Schubert, M.; Röhrich, F.; Sauer, M.; Weidner, N.; Rupp, R.; Kalke, Y.-B.B.; Abel, R.; et al. International surveillance study in acute spinal cord injury confirms viability of multinational clinical trials. BMC Med. 2022, 20, 225. [Google Scholar] [CrossRef] [PubMed]
  2. Dietz, V.A.; Roberts, N.; Knox, K.; Moore, S.; Pitonak, M.; Barr, C.; Centeno, J.; Leininger, S.; New, K.C.; Nowell, P.; et al. Fighting for recovery on multiple fronts: The past, present, and future of clinical trials for spinal cord injury. Front. Cell. Neurosci. 2022, 16, 977679. [Google Scholar] [CrossRef] [PubMed]
  3. Jagrit, V.; Koffler, J.; Dulin, J.N. Combinatorial strategies for cell transplantation in traumatic spinal cord injury. Front. Neurosci. 2024, 18, 1349446. [Google Scholar] [CrossRef] [PubMed]
  4. Ferretti, P.; Zhang, F.; O’Neill, P. Changes in spinal cord regenerative ability through phylogenesis and development: Lessons to be learned. Dev. Dyn. 2003, 226, 245–256. [Google Scholar] [CrossRef]
  5. Rodemer, W.; Hu, J.; Selzer, M.E.; Shifman, M.I. Heterogeneity in the regenerative abilities of central nervous system axons within species: Why do some neurons regenerate better than others? Neur Reg. Res. 2020, 15, 996–1005. [Google Scholar]
  6. Norris, V. Successive paradigm shifts in the bacterial cell cycle and related subjects. Life 2019, 9, 27. [Google Scholar] [CrossRef]
  7. Illis, L.S. Central nervous system regeneration does not occur. Spinal Cord 2012, 50, 259–263. [Google Scholar] [CrossRef]
  8. Mothe, A.J.; Tator, C.H. Review of transplantation of neural stem/progenitor cells for spinal cord injury. Int. J. Devl. Neurosci. 2013, 31, 701–713. [Google Scholar] [CrossRef]
  9. Olivero, R.S.; Bello, S.; Biering-Sørensen, F. Mesenchymal stem cells improve locomotor recovery in traumatic spinal cord injury: Systematic review with meta-analyses of rat models. Neurobiol. Dis. 2014, 62, 338–353. [Google Scholar] [CrossRef]
  10. Xu, X.-M. Breaking news in spinal cord injury research. Neur Reg. Res. 2012, 7, 1685–1687. [Google Scholar]
  11. Ahuja, C.S.; Mothe, A.; Khazaei, M.; Badhiwala, J.H.; Gilbert, E.A.; Kooy, D.; Morshead, C.M.; Tator, C.; Fehlings, M.G. The leading edge: Emerging neuroprotective cell-based therapies for spinal cord injury. Stem Cells Transl. Med. 2020, 9, 1509–1530. [Google Scholar] [CrossRef]
  12. De Beer, F.C.; Steinbusch, H.W. On the blueprint of the long primary afferent axons and the dichotomous axon trajectory of Clarke’s nucleus. A morphological tracing study on the effect of hypoxia during development. Anatomia 2023, 2, 414–449. [Google Scholar] [CrossRef]
  13. Schwab, M.E.; Bartholdi, D. Degeneration and regeneration of axons in the lesioned spinal cord. Physiol. Rev. 1996, 76, 319–370. [Google Scholar] [CrossRef] [PubMed]
  14. Quraishe, S.; Forbes, L.H.; Andrews, M.R. The extracellular environment of the CNS: Influence on plasticity, sprouting, and axonal regeneration after spinal cord injury. Neural Plast. 2018, 1–18. [Google Scholar] [CrossRef] [PubMed]
  15. Yamanaka, S. Induced pluripotent stem cells: Past, Present, and Future. Cell Stem Cell 2012, 10, 678–684. [Google Scholar] [CrossRef] [PubMed]
  16. Gearhart, J.; Oster-Granite, M.L.; Guth, L. Histological changes after transection of the spinal cord of fetal and neonatal mice. Exp. Neurol. 1979, 66, 1–15. [Google Scholar] [CrossRef]
  17. Buyan Dent, L.J.; McCasland, J.S.; Stelzner, D.J. Attempts to facilitate dorsal column axonal regeneration in a neonatal spinal environment. J. Comp. Neurol. 1996, 372, 435–456. [Google Scholar] [CrossRef]
  18. Wree, A.; Fiekas, D.; De Beer, F.C.; Beck, T. Lokale zerebrale Glukose-Utilisation des Riickenmarkes und der Hinterstrangkerne der Ratte nach pränataler dorsaler Myelotomie in Höhe Th12: Eine [14C]2-Desoxyglukose-Studie. Eur. J. Neurosci. 1998, 10, 62. [Google Scholar]
  19. Steward, O.; Zheng, B.; Tessier-Lavigne, M. False resurrections: Distinguishing regenerated from spared axons in the injured central nervous system. J. Comp. Neurol. 2003, 459, 1–8. [Google Scholar] [CrossRef]
  20. Mesulam, M.M.; Brushart, T.M. Transganglionic and anterograde transport of horseradish peroxidase across dorsal root ganglia: A tetramethylbenzidine method for tracing central sensory connections of muscles and peripheral nerves. Neuroscience 1979, 4, 1107–1117. [Google Scholar] [CrossRef]
  21. De Beer, F.C. Dorsal myelotomy in E15-E16 fetal rat: A promising paradigm in regeneration research with serendipitous transcriptomic effects on development of the long primary afferent system. J. Neurosci. Methods 2022, 366, 109402. [Google Scholar] [CrossRef]
  22. Cox-Limpens, K.; Strackx, E.; Van den Hove, D.L.A.; Van Ekkendonk, J.R.A.; De Jong, M.; Zimmermann, L.J.I.; Steinbusch, H.W.M.; Vles, J.S.H.; Gavilanes, A.W.D. Fetal asphyctic preconditioning protects against perinatal asphyxia-induced apoptosis and astrogliosis in neonatal brain. CNS Neurol. Disord. Drug Targets 2015, 14, 33–40. [Google Scholar] [CrossRef]
  23. Rivkees, S.A.; Wendler, C.C. Long-term consequences of disrupting adenosine signaling during embryonic development. Mol. Aspects Med. 2017, 55, 110–117. [Google Scholar] [CrossRef] [PubMed]
  24. Bustelo, M.; Barkhuizen, M.; Van den Hove, D.L.A.; Steinbusch, H.W.M.; Bruno, M.A.; Loidl, C.F.; Gavilanes, A.W.D. Clinical implications of epigenetic dysregulation in perinatal hypoxic-ischemic brain damage. Front. Neurol. 2020, 11, 483. [Google Scholar] [CrossRef] [PubMed]
  25. Sofroniew, M.V. Dissecting spinal cord regeneration. Nature 2018, 557, 344. [Google Scholar] [CrossRef] [PubMed]
  26. Stepien, B.K.; Wielockx, B. From vessels to neurons—The role of hypoxia pathway proteins in embryonic neurogenesis. Cells 2024, 13, 621–651. [Google Scholar] [CrossRef]
  27. Bjelke, B.; Andersson, K.; Ögren, S.O.; Bolme, P. Asphyctic lesion: Proliferation of tyrosine hydroxylase-immunoreactive nerve cell bodies in the rat substantia nigra and functional changes in dopamine neurotransmission. Brain Res. 1991, 543, 1–9. [Google Scholar] [CrossRef]
  28. Pires Monteiro, S.; Voogd, E.; Muzzi, L.; De Vecchis, G.; Mossink, B.; Levers, M.; Hassink, G.; Van Putten, M.; Le Feber, J.; Hofmeijer, J.; et al. Neuroprotective effect of hypoxic preconditioning and neuronal activation in an in vitro human model of the ischemic penumbra. J. Neural Eng. 2021, 18, 036016. [Google Scholar] [CrossRef]
  29. Stefanova, E.E.; Scott, A.L. Purinergic signaling systems across comparative models of spinal cord injury. Neural Regen. Res. 2022, 17, 2391–2398. [Google Scholar] [CrossRef]
  30. Lanfranchi, M.; Yandiev, S.; Meyer-Dilhet, G.; Ellouze, S.; Kerkhofs, M.; Dos Reis, R.; Garcia, A.; Blondet, C.; Amar, A.; Kneppers, A.; et al. The AMPK-related kinase NUAK1 controls cortical axon branching by locally modulating mitochondrial metabolic functions. Nat. Commun. 2024, 15, 2487–2504. [Google Scholar] [CrossRef]
  31. Silagi, E.S.; Nduka, E.; Pazyra-Murphy, M.F.; Paiz, J.Z.; Bhuiyan, S.; Segal, R.A. Profiling local translatomes and RNA binding proteins of somatosensory neurons reveals specializations of individual axons. bioRxiv 2025. [CrossRef]
  32. Lu, P.; Woodruff, G.; Wang, Y.; Graham, L.; Hunt, M.; Wu, D.; Boehle, E.; Ahmad, R.; Poplawski, G.; Brock, J.; et al. Long-distance axonal growth from human induced pluripotent stem cells after spinal cord injury. Neuron 2014, 83, 789–796. [Google Scholar] [CrossRef] [PubMed]
  33. Tuszynski, M.H.; Steward, O. Concepts and methods for the study of axonal regeneration in the CNS. Neuron 2012, 74, 777–791. [Google Scholar] [CrossRef] [PubMed]
  34. Liu, K.; Tedeschi, A.; Park, K.K.; He, Z. Neuronal intrinsic mechanisms of axon regeneration. Ann. Rev. Neurosci. 2011, 34, 131–152. [Google Scholar] [CrossRef] [PubMed]
  35. Lindhout, F.W.; Szafranska, H.M.; Imaz-Rosshandler, I.; Guglielmi, L.; Morefian, M.; Voitiuk, K.; Zernicka-Glover, N.K.; Boulanger, J.; Schulze, U.; Lloyd-Davies Sanchez, D.J.; et al. Calcium dynamics tune developmental tempo to generate evolutionary divergent tract lengths. bioRxiv 2024. [CrossRef]
  36. Jacobson, K.A.; Pradhan, B.; Wen, Z.; Pramanik, A. New paradigms in purinergic receptor ligand discovery. Neuropharmacology 2023, 230, 10950. [Google Scholar] [CrossRef]
  37. Vissers, C.; Sinha, A.; Ming, G.-L.; Song, H. The epitranscriptome in stem cell biology and neural development. Neurobiol. Dis. 2020, 146, 105139. [Google Scholar] [CrossRef]
  38. Coquand, L.; Avalos, C.B.; Macé, A.-S.; Farcy, S.; Di Cicco, A.; Lampic, M.; Wimmer, R.; Bessières, B.; Attie-Bitach, T.; Fraisier, V.; et al. A cell fate decision map reveals abundant direct neurogenesis bypassing intermediate progenitors in the human developing neocortex. Nat. Cell Biol. 2024, 26, 698–709. [Google Scholar] [CrossRef]
  39. Hartman, A.; Satija, R. Comparative analysis of multiplexed in situ gene expression profiling technologies. bioRxiv 2024. [Google Scholar] [CrossRef]
  40. He, Z.; Jin, Y. Intrinsic control of axon regeneration. Neuron 2016, 90, 437–451. [Google Scholar] [CrossRef]
  41. Tedeschi, A.; Dupraz, S.; Curcio, M.; Laskowski, C.J.; Schaffran, B.; Flynn, K.C.; Santos, T.E.; Stern, S.; Hilton, B.J.; Larson, M.J.E.; et al. ADF/Cofilin-mediated actin turnover promotes axon regeneration in the adult CNS. Neuron 2019, 103, 1073–1085. [Google Scholar] [CrossRef]
  42. Martins-Costa, C.; Wiegers, A.; Pham, V.A.; Sidhaye, J.; Doleschall, B.; Novatchkova, M.; Lendl, T.; Piber, M.; Peer, A.; Möseneder, P.; et al. ARID1B controls transcriptional programs of axon projection in an organoid model of the human corpus callosum. Cell Stem Cell 2024, 31, 866–885.e14. [Google Scholar] [CrossRef]
  43. Leite, S.C.; Pinto-Costa, R.; Sousa, M.M. Actin dynamics in the growth cone: A key player in axon regeneration. Curr. Opin. Neurobiol. 2021, 69, 11–18. [Google Scholar] [CrossRef] [PubMed]
  44. Marichal, N.; Fabbiani, G.; Trujillo-Cenóz, O.; Russo, R.E. Purinergic signaling in a latent stem cell niche of the rat spinal cord. Purinergic Signal 2016, 12, 331–341. [Google Scholar] [CrossRef] [PubMed]
  45. Burnstock, G. Purinergic nerves. Pharmacol. Rev. 1972, 24, 509–557. [Google Scholar] [CrossRef] [PubMed]
  46. Burnstock, G. Physiology and pathophysiology of purinergic neurotransmission. Physiol. Rev. 2007, 87, 659–797. [Google Scholar] [CrossRef] [PubMed]
  47. Sanchez-Arias, J.C.; Van der Slagt, E.; Vecchiarelli, H.A.; Candlish, R.C.; York, N.; Young, P.A.; Shevtsova, O.; Juma, A.; Tremblay, M.-E.; Swayne, L.A. Purinergic signaling in nervous system health and disease: Focus on pannexin 1. Pharmacol. Ther. 2021, 225, 107840. [Google Scholar] [CrossRef]
  48. Illes, P.; Di Virgilio, F.; Tang, Y. Purinergic Signaling: 50 years. Neuropharmacology 2024, 245, 109826. [Google Scholar] [CrossRef]
  49. Fawcett, J.W. Why has it been so difficult to make CNS axons regenerate? Neurochem. Res. 2020, 45, 144–158. [Google Scholar] [CrossRef]
  50. Colonna, M.; Konopka, G.; Liddelow, S.A.; Nowakowski, T.; Awatramani, R.; Bateup, H.S.; Cadwell, C.R.; Caglayan, E.; Chen, J.L.; Gillis, J.; et al. Implementation and validation of single-cell genomics experiments in neuroscience. Nat. Neurosci. 2024, 27, 2310–2325. [Google Scholar] [CrossRef]
  51. Blesch, A.; Lu, P.; Tsukada, S.; Alto, L.T.; Roet, K.; Coppola, G.; Geschwind, D.; Tuszynski, M.H. Conditioning lesions before or after spinal cord injury recruit broad genetic mechanisms that sustain axonal regeneration: Superiority to clamp-mediated effects. Exp. Neurol. 2012, 235, 162–173. [Google Scholar] [CrossRef]
  52. Griffin, J.M.; Bradke, F. Therapeutic repair for spinal cord injury: Combinatory approaches to address a multifaceted problem. EMBO Mol. Med. 2020, 12, e11505. [Google Scholar] [CrossRef]
Disclaimer/Publisher’s Note: The statements, opinions and data contained in all publications are solely those of the individual author(s) and contributor(s) and not of MDPI and/or the editor(s). MDPI and/or the editor(s) disclaim responsibility for any injury to people or property resulting from any ideas, methods, instructions or products referred to in the content.

