Article

In Silico Promoter Motif Analysis of Human Fertility-Related Genes

1
IVF Laboratory, Acibadem Sistina Hospital, 1000 Skopje, North Macedonia
2
Faculty of Computer Science, Goce Delcev University, 2000 Stip, North Macedonia
*
Authors to whom correspondence should be addressed.
Appl. Biosci. 2026, 5(1), 14; https://doi.org/10.3390/applbiosci5010014
Submission received: 16 October 2025 / Revised: 15 January 2026 / Accepted: 6 February 2026 / Published: 14 February 2026

Abstract

Complex transcriptional and epigenetic regulation, including variation in promoter-level cis-regulatory architecture, influences infertility. In this study, we performed a purely in silico analysis of the −1000 to −1 bp promoter regions (relative to the annotated TSS) of 13 human fertility-related genes using an integrated motif-discovery and annotation workflow (NNPP, MEME/STREME, Tomtom, FIMO/CentriMo, GOMo, and MethPrimer). Motif discovery identified multiple statistically supported de novo promoter motifs, and motif scanning mapped their occurrences across the analyzed promoters. Similarity searches against curated PWM databases did not yield significant matches under stringent criteria, consistent with divergent or under-represented motif patterns. Functional association analysis and CpG island profiling further highlighted promoter segments that merit prioritization for follow-up testing. As the analysis is purely in silico and restricted to a fixed promoter window, the identified motifs should be interpreted as candidate regulatory elements pending experimental validation.

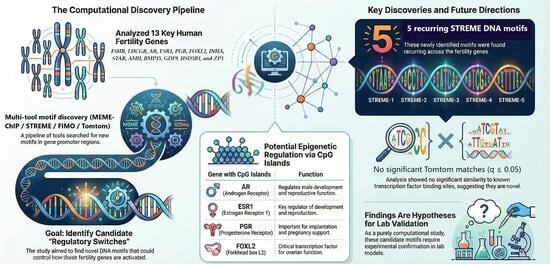
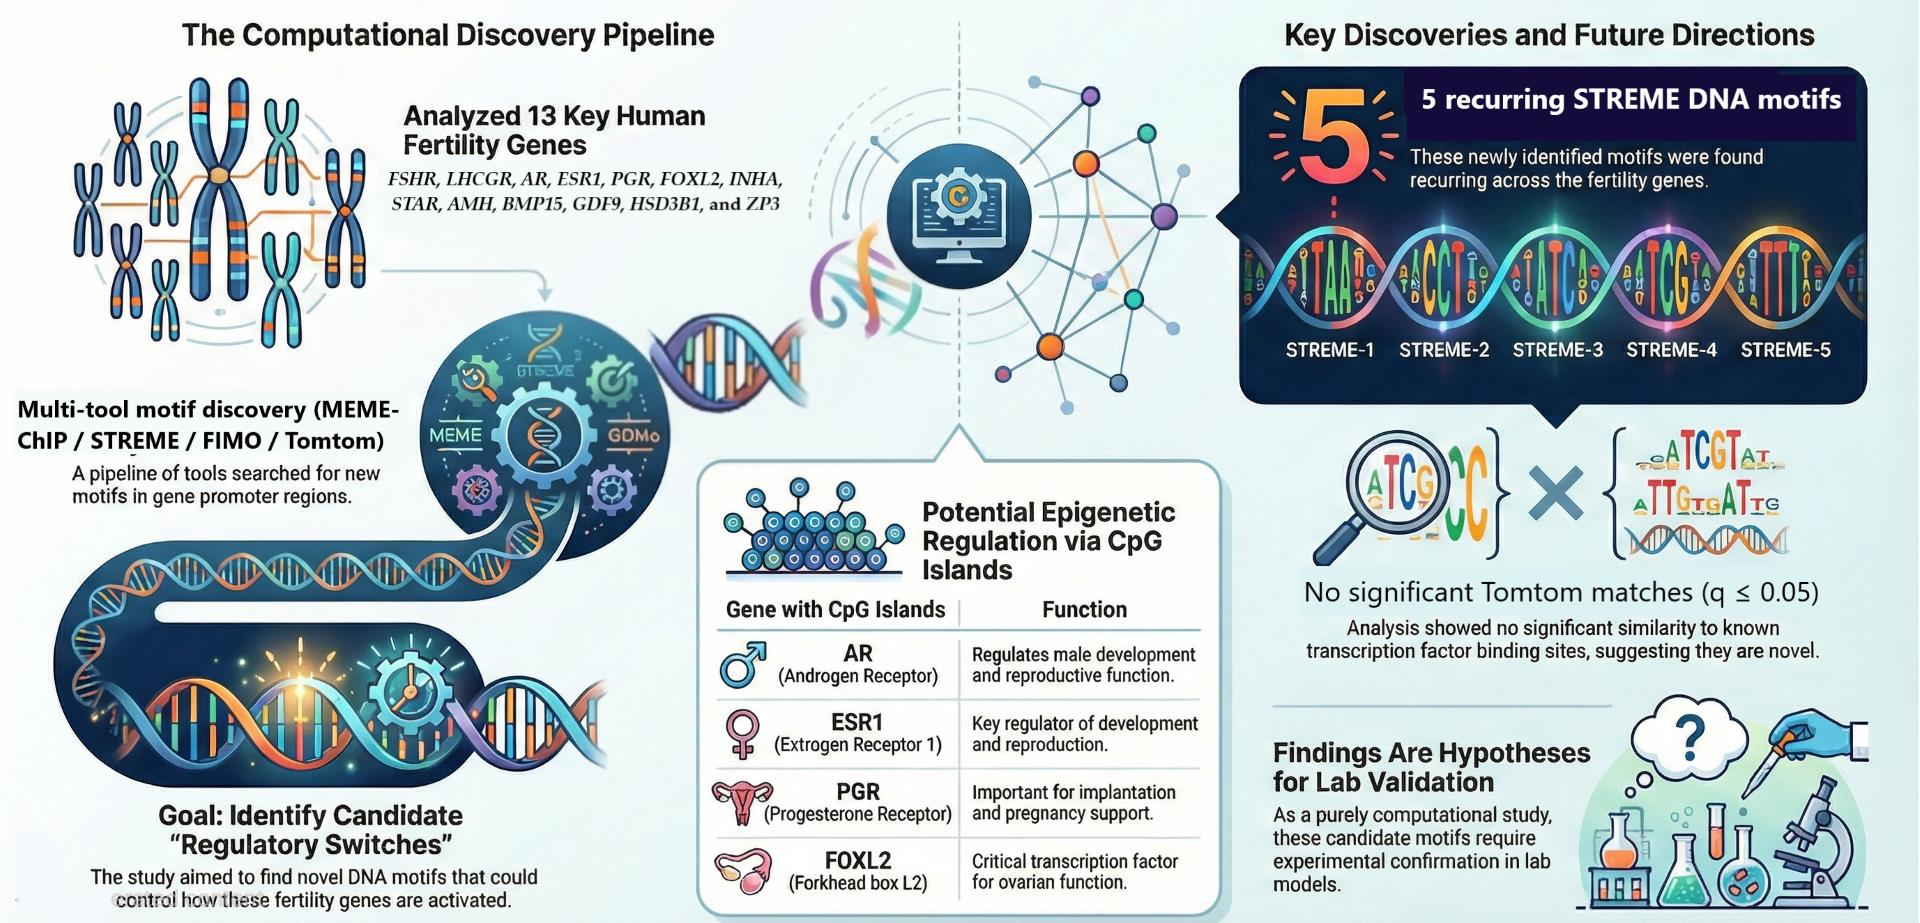
Graphical Abstract

1. Introduction

Infertility is a multifactorial condition affecting a substantial proportion of the global population, with estimates indicating that approximately one in six individuals experience infertility during their reproductive lifetime [1]. In parallel with this burden, the use of assisted reproductive technologies (ART) has expanded across regions, including a continued rise in ART activity reported in Europe [2]. Despite major advances in laboratory procedures and clinical protocols, outcomes remain variable, suggesting that routine clinical parameters alone do not fully capture the biological complexity underlying reproductive competence.
Female age is a key determinant of ART success, mainly reflecting declines in ovarian reserve and oocyte quality [3]. Ovarian response and live birth rates depend on both intrinsic biology and individual variability, including genetic factors affecting follicular development and oocyte yield [4,5]. Genetic variation—especially in the FSHR signaling axis—may influence ovarian response, highlighting the need to examine molecular determinants as well as clinical predictors [6,7].
Embryo developmental potential is commonly estimated through morphological grading and developmental kinetics, and these phenotypic assessments correlate with euploidy and clinical outcomes in selected settings [8]. However, embryo aneuploidy remains a major cause of implantation failure and pregnancy loss, and large clinical studies evaluating Preimplantation Genetic Testing for Aneuploidy (PGT-A) highlight that its benefit may depend strongly on patient selection, clinical indication, and study design [9]. Consistent with this, systematic reviews and meta-analyses have reported mixed effects of PGT-A on live birth, underscoring persistent uncertainty in how best to integrate genetic screening into routine practice [10,11]. Male factors may also contribute to unsuccessful outcomes; for example, increased sperm DNA fragmentation has been associated with adverse reproductive endpoints and may intersect with embryo chromosomal integrity in specific clinical contexts [12].
Beyond coding variation, growing evidence supports a role for transcriptional and epigenetic regulation in fertility-related phenotypes. Endometrial receptivity and implantation competence are shaped by complex molecular programs that extend beyond ultrasound-based clinical metrics, and “omics”-based perspectives emphasize regulatory control as a key layer in reproductive biology [13]. Moreover, epigenetic modulation of reproductive genes—such as partial methylation patterns reported in key hormone receptor pathways—illustrates how regulatory mechanisms can influence gene expression in fertility-relevant tissues [14]. At the genomic level, promoter regions integrate transcription factor binding and core promoter architecture to control transcription initiation, and promoter structure and conserved elements have been extensively described across eukaryotic systems [15,16]. Together, these observations motivate focused investigation of promoter cis-regulatory architecture as a potential source of inter-individual variability relevant to reproductive function.
In this study, we apply an in silico promoter-level approach to identify and characterize cis-regulatory motifs within the upstream regulatory regions of fertility-related genes, aiming to provide a regulatory framework that can guide future functional association and translational interpretation.
We hypothesize that fertility-related genes share recurrent promoter-proximal cis-regulatory motifs within the −1000 to −1 bp upstream window that can be detected by de novo motif discovery and supported by motif-scanning and enrichment analyses.

2. Materials and Methods

2.1. Gene Selection

In this study, we implemented a candidate-gene approach, focusing on a panel of 16 human genes that play central roles in human reproductive physiology. The selection was based on their biological relevance in key reproductive processes such as folliculogenesis, gametogenesis, steroidogenesis, hormonal feedback, oocyte competence, and fertilization (Table 1):
These genes extend across several functional domains—ranging from hormonal responsiveness (FSHR, LHCGR, AR) to oocyte maturation signals (BMP15, GDF9), granulosa cell regulation (FOXL2, ESR1), and zona pellucida formation (ZP3). However, to ensure high confidence in promoter region localization, only genes with a predicted promoter score 0.80 using the Neural Network Promoter Prediction (NNPP) tool were accepted for further analysis. This threshold is based on previous standards shown to balance sensitivity and specificity [31,32]. As a result, 13 genes were selected for full downstream analysis: FSHR, LHCGR, AR, ESR1, PGR, FOXL2, INHA, STAR, AMH, BMP15, GDF9, HSD3B1, and ZP3.

2.2. Research Objective at the Gene Level

The goal was to discover cis-regulatory elements—specifically promoter motifs—that regulate transcription initiation of the selected genes. By mapping and functionally annotating these motifs, we wanted to understand how upstream regulatory signals might influence gene expression in the ovarian context.
The objectives were as follows:
  • To define promoter regions and accurately localize transcription start sites (TSS) for each gene.
  • To discover conserved and novel cis-regulatory motifs using computational tools.
  • To identify assumed transcription factor binding sites through motif comparison with known databases.
  • To analyze motif distribution and enrichment patterns, especially in proximity to the TSS.
  • To assess potential functional associations of the motifs using Gene Ontology.
  • To evaluate CpG island density and distribution as indicators of epigenetic regulation within promoter sequences.
Together, these analyses aim to create a regulatory landscape map of genes essential for human fertility.

2.3. Data Retrieval and Sequence Preparation

Gene data from the NCBI Gene database (accessed on 10 January 2026, https://www.ncbi.nlm.nih.gov/gene). For each gene, we retrieved the full genomic sequence and extracted a 1000 base pair upstream region relative to the TSS, which was used as a presumed promoter region [16]. Promoter sequences (−1000 to −1 bp relative to the annotated transcription start site, TSS) were defined on GRCh38/hg38 using the NCBI RefSeq/MANE transcript annotation for each gene (Supplementary Table S1). For genes on the negative strand, the upstream interval corresponds to genomic coordinates TSS + 1 to TSS + 1000. GRCh38/hg38 was used strictly as a coordinate reference for promoter extraction and annotation; sex-specific haplotype variation and population polymorphisms were not modeled; therefore, the reported motif coordinates represent the reference–annotation framework rather than individualized promoter sequences. Promoter prediction was done using NNPP v2.2 (accessed on 10 January 2026, https://fruitfly.org/seq_tools/promoter.html). This tool uses a neural network algorithm trained to recognize features of eukaryotic RNA polymerase II promoters. Predictions with a confidence score ≥ 0.80 were accepted [15]. Genes for which no promoter met this threshold (ESR2, CYP19A1, NR5A1) were excluded. The remaining 13 genes formed the final dataset for in silico regulatory analysis.

2.4. Software Tools and Parameters Used

We implemented a pipeline of eight bioinformatic tools, each targeting a specific aspect of motif discovery, localization, and functional prediction. MEME-ChIP, STREME, Tomtom, FIMO, CentriMo, and GOMo were run using the MEME Suite web server (v5.5.9) (accessed on 10 January 2026, https://meme-suite.org/).
  • NNPP (Neural Network Promoter Prediction) [33]
Predicts core promoter sequences.
Web tool: https://fruitfly.org/seq_tools/promoter.html (accessed on 10 January 2026).
Score cutoff: ≥0.80.
  • MEME-ChIP (Motif discovery) [34]
Identifies statistically enriched motifs.
Parameters: ZOOPS model, max motifs = 5, motif width = 6–15 bp, E-value ≤ 0.05.
  • STREME (Sensitive motif finder) [35]
Detects short, specific motifs absent in background sequences.
  • Tomtom (Motif comparison tool) [36]
Matches de novo motifs to known transcription factor motifs from JASPAR and HOCOMOCO.
Motif databases (as used in this study): JASPAR 2024 (https://jaspar.elixir.no/; accessed on 10 January 2026) and HOCOMOCO (https://hocomoco14.autosome.org/; accessed on 10 January 2026).
Significance threshold: q-value ≤ 0.05.
  • FIMO (Find Individual Motif Occurrences) [37]
Scans promoter regions for exact positions of motif matches.
p-value cutoff: ≤1 × 10⁻⁴. Exact motif coordinates per gene (FIMO output summary) are provided in Table S2.
  • CentriMo (Motif centrality analysis) [38]
Assesses enrichment of motifs near TSS.
  • GOMo (Gene Ontology for Motifs) [39]
Links motifs to biological processes using GO terms.
GO term associations were reported with FDR-corrected q-values; specificity values were reported, and high-specificity terms are highlighted in the Results.
  • MethPrimer (CpG island prediction) [40]
Identifies CpG-rich regions likely to influence gene expression.
Web tool: https://methprimer.com/ (accessed on 10 January 2026).
Criteria: GC content ≥ 50%, CpG ratio ≥ 0.6.
These tools complement each other—MEME-ChIP and STREME provide a broad and sensitive motif discovery framework; Tomtom offers biological relevance; FIMO and CentriMo give precise positional context; GOMo links function; and MethPrimer evaluates epigenetic potential.

2.5. Data Analysis Strategy

To maximize accuracy, the analysis followed a step-by-step modular framework:
  • Promoter prediction using NNPP.
  • Motif discovery using MEME-ChIP and STREME.
  • Motif annotation using Tomtom (TF binding site inference).
  • Motif positioning via FIMO and CentriMo.
  • Functional annotation using GOMo.
  • CpG island identification using MethPrimer.
Motifs and associations were reported based on the applied statistical thresholds, and interpretations were kept conservative, given the purely in silico design. This comprehensive computational strategy enables deep insight into the regulatory architecture governing gene expression in fertility-related pathways.
A workflow schematic summarizing the analysis steps and thresholds is provided in Figure S1.

3. Results

3.1. Promoter Prediction Using NNPP

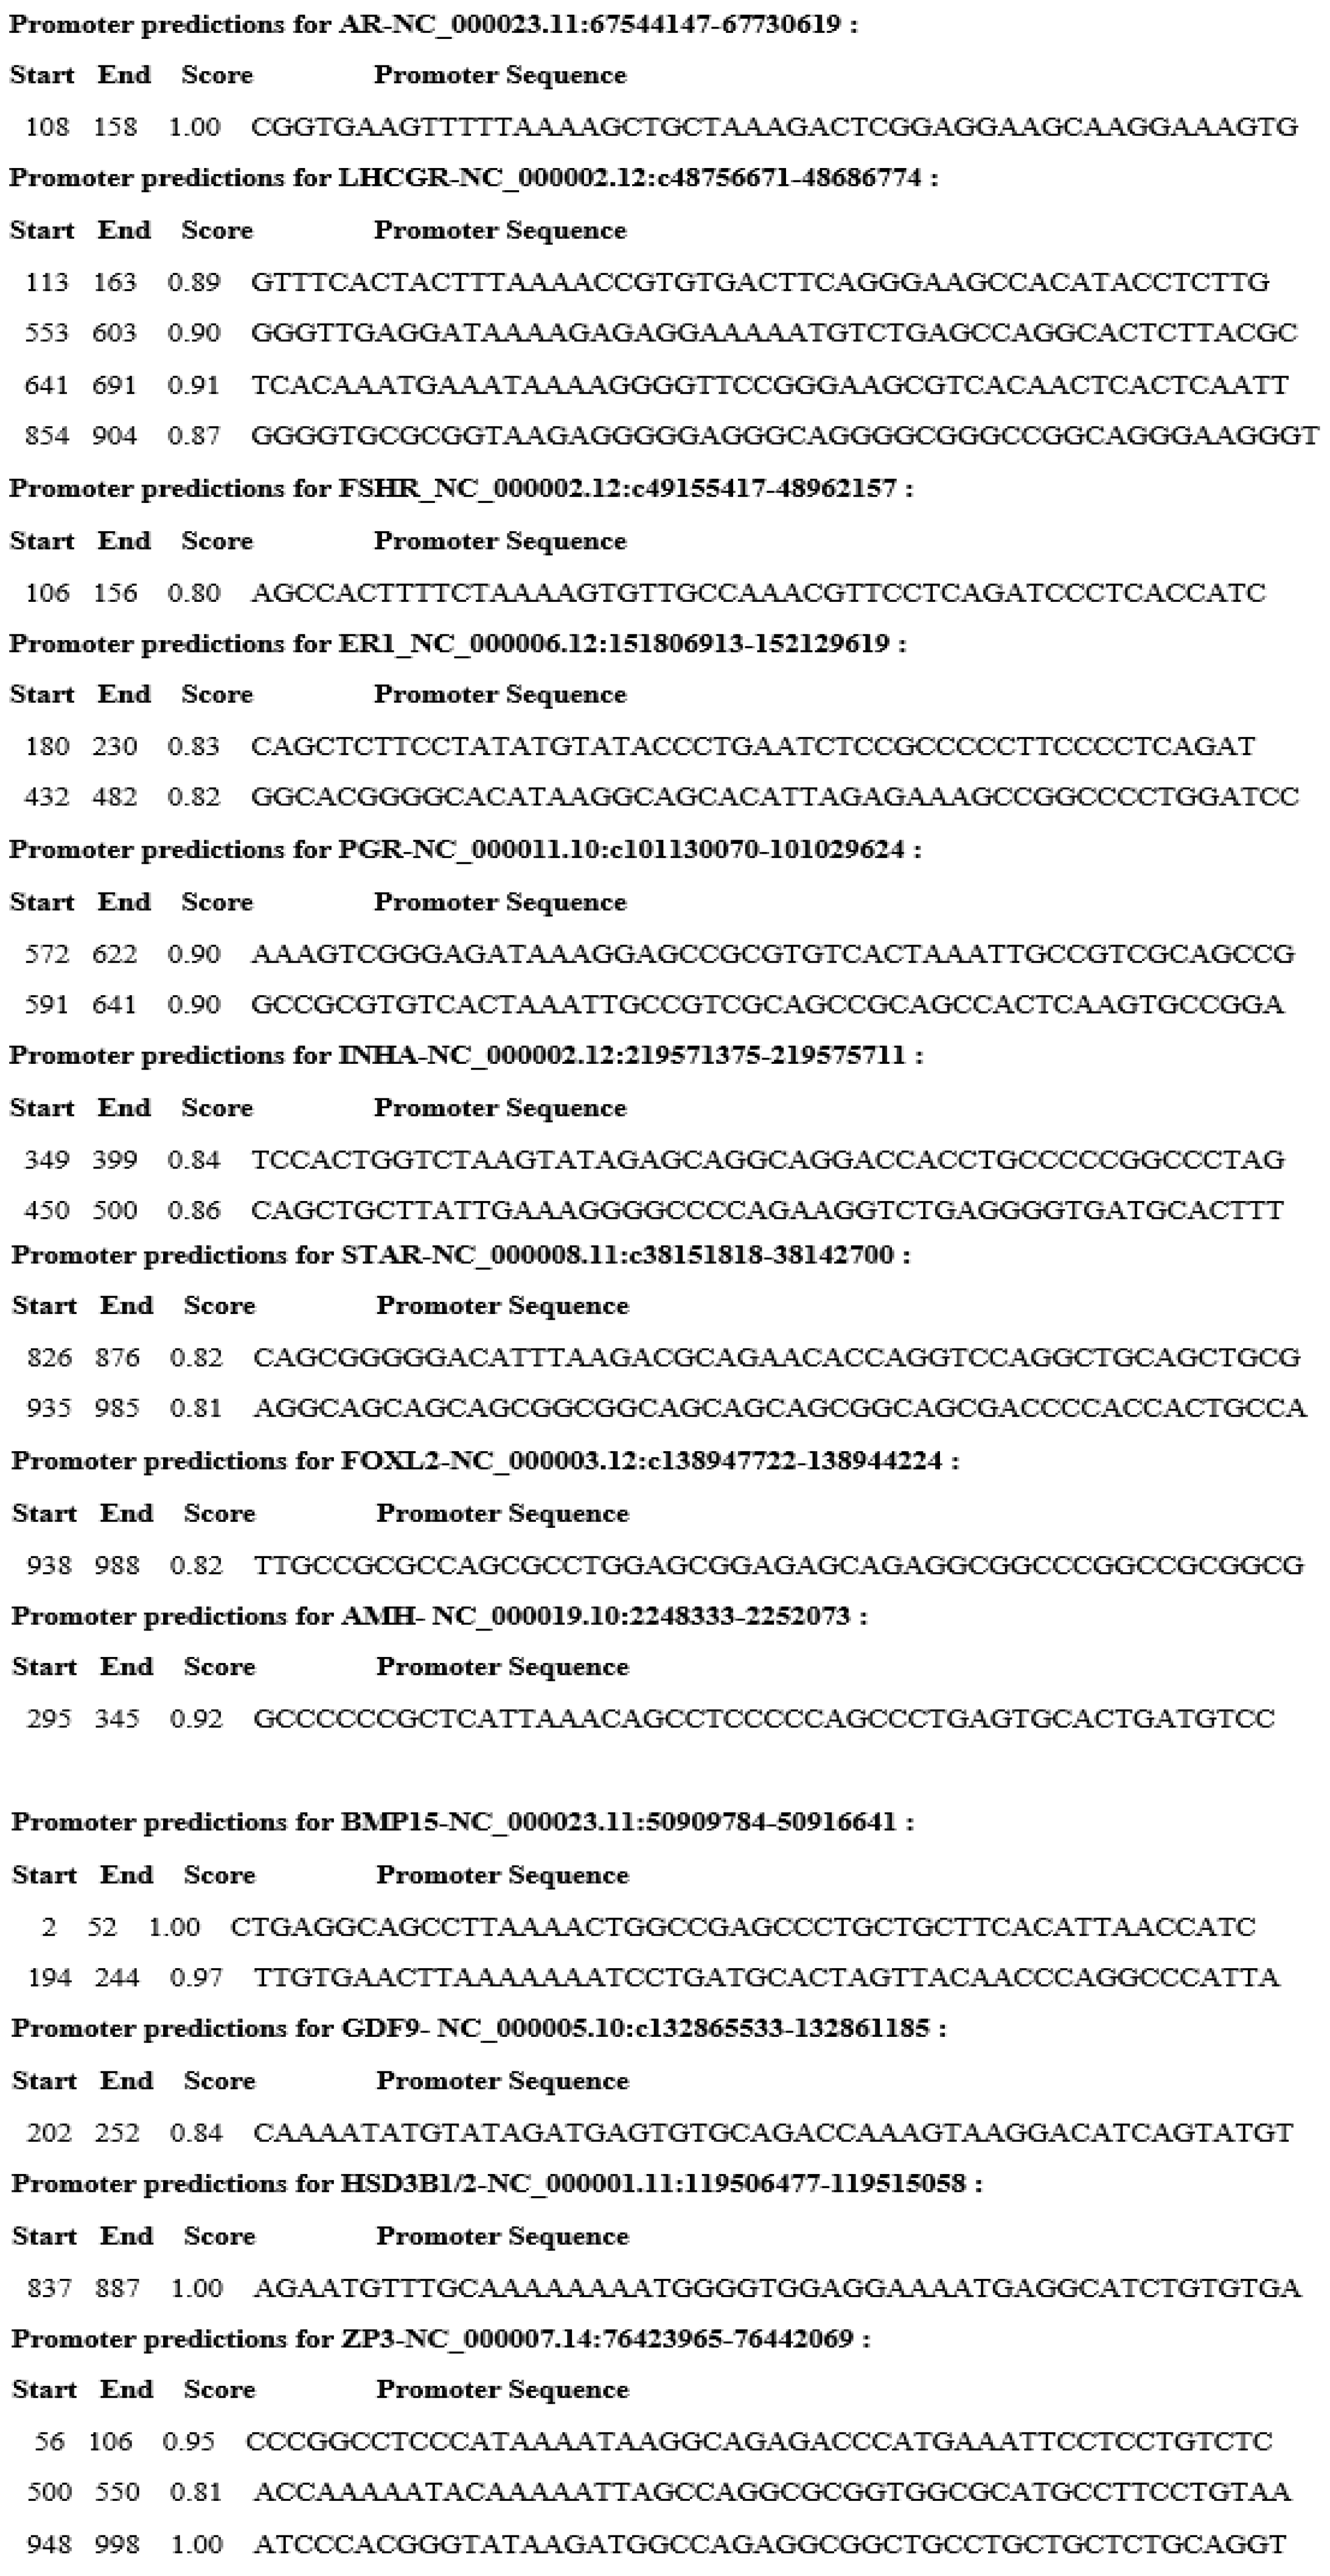
NNPP identified promoter predictions with scores ≥ 0.80 in all 13 analyzed promoter sequences (Figure 1). Figure 1 illustrates the NNPP predicted promoter locations within each 1 kb promoter sequence together with the corresponding confidence scores. The maximum score (1.00) was observed for AR, BMP15, HSD3B1, and ZP3. Multiple promoter predictions (score ≥ 0.80) were detected for several genes (LHCGR, ZP3, ESR1, PGR, INHA, STAR, and BMP15), whereas AR, FSHR, FOXL2, AMH, GDF9, and HSD3B1 showed a single high-scoring prediction.
The highest-scoring predicted promoter position for each gene within the 1 kb window is summarized in Table 2.

3.2. Identification of Significant Motifs—STREME Analysis

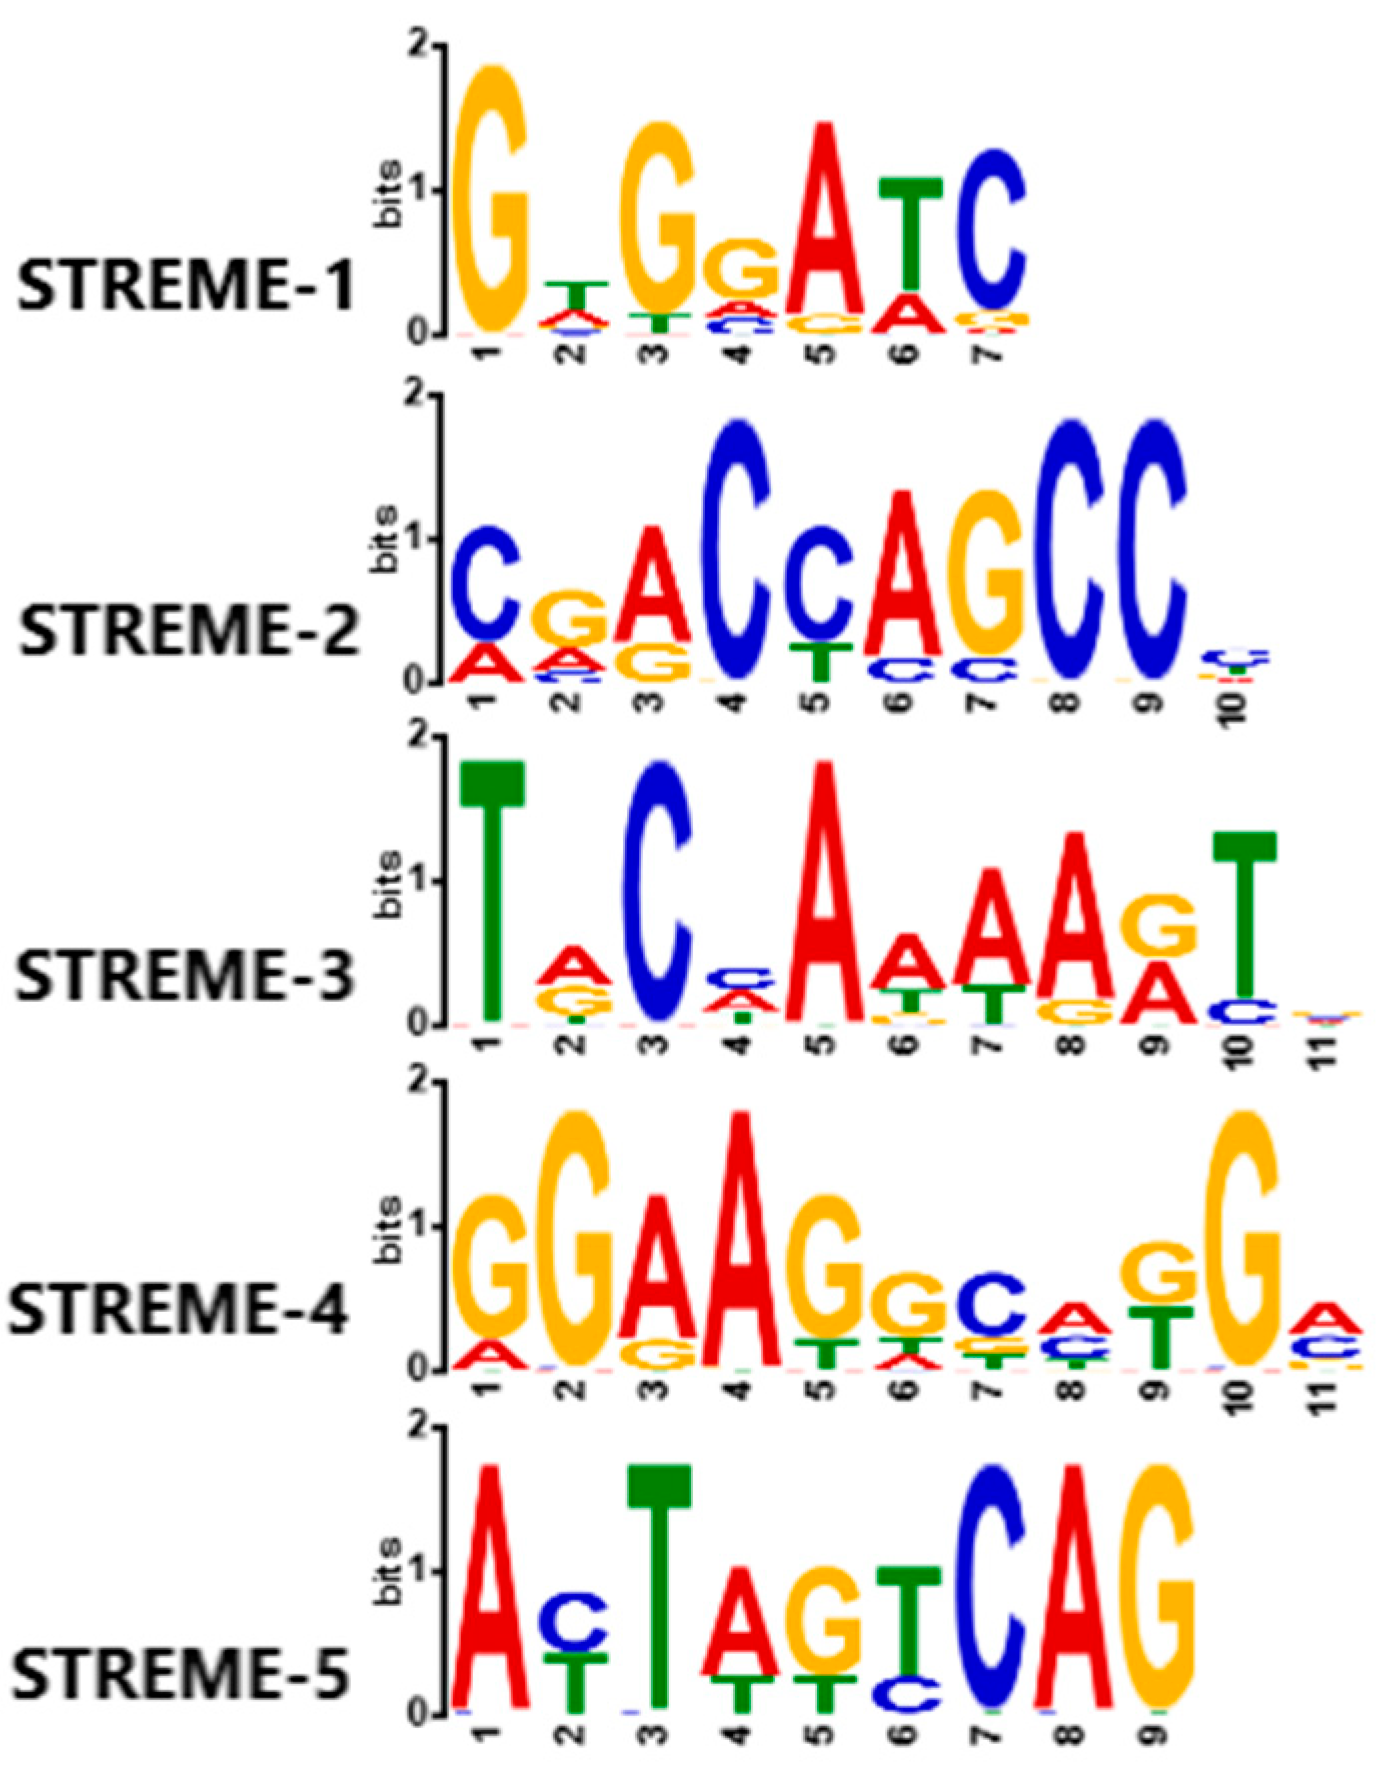
The STREME analysis identified five statistically significant DNA motifs within the promoter regions (−1000 to −1 bp relative to the annotated TSS) of 13 human genes associated with human fertility (Figure 2; Table 3).
STREME-1 (GWGGATC; width 7) was detected in 10/13 promoters (76.9%) with a training p-value of 5.40 × 10⁻⁵. STREME-2 (CGACCAGCCY; width 10) and STREME-3 (TRCHAAAARTV; width 11) were each detected in 8/13 promoters (61.5%) with training p-values of 8.20 × 10⁻⁴. STREME-4 (GGAAGGCMKGM; width 11) was detected in 6/13 promoters (46.2%) with a training p-value of 7.50 × 10⁻³. STREME-5 (AYTAGTCAG; width 9) was detected in 5/13 promoters (38.5%) with a training p-value of 2.00 × 10⁻².

3.3. Motif Validation with Tomtom: Projection onto Known Transcription Factors

Tomtom analysis of the discovered motifs against the JASPAR 2024 database returned no statistically significant matches at q ≤ 0.05 (Table 4). In total, 51 non-significant matches were reported, with the highest counts for STREME-5 (13 matches) and STREME-2 (11 matches). Among the closest-scoring comparisons, STREME-4 (GGAAGGCMKGM) showed similarity to the ETS-family transcription factor GABPA (E = 0.14; q = 0.28), STREME-2 (CGACCAGCCY) showed similarity to ZBT7A (E = 0.51; q = 0.71), and MEME-2 (MRCMCCAGNNWGTK) showed similarity to TCF4 (Table 4). For several motifs (STREME-3, STREME-5, and MEME-2), the best matches had high q-values (>0.87), consistent with a lack of significant similarity to known PWMs in the queried database.

3.4. Functional Annotation of Motifs Using GOMo

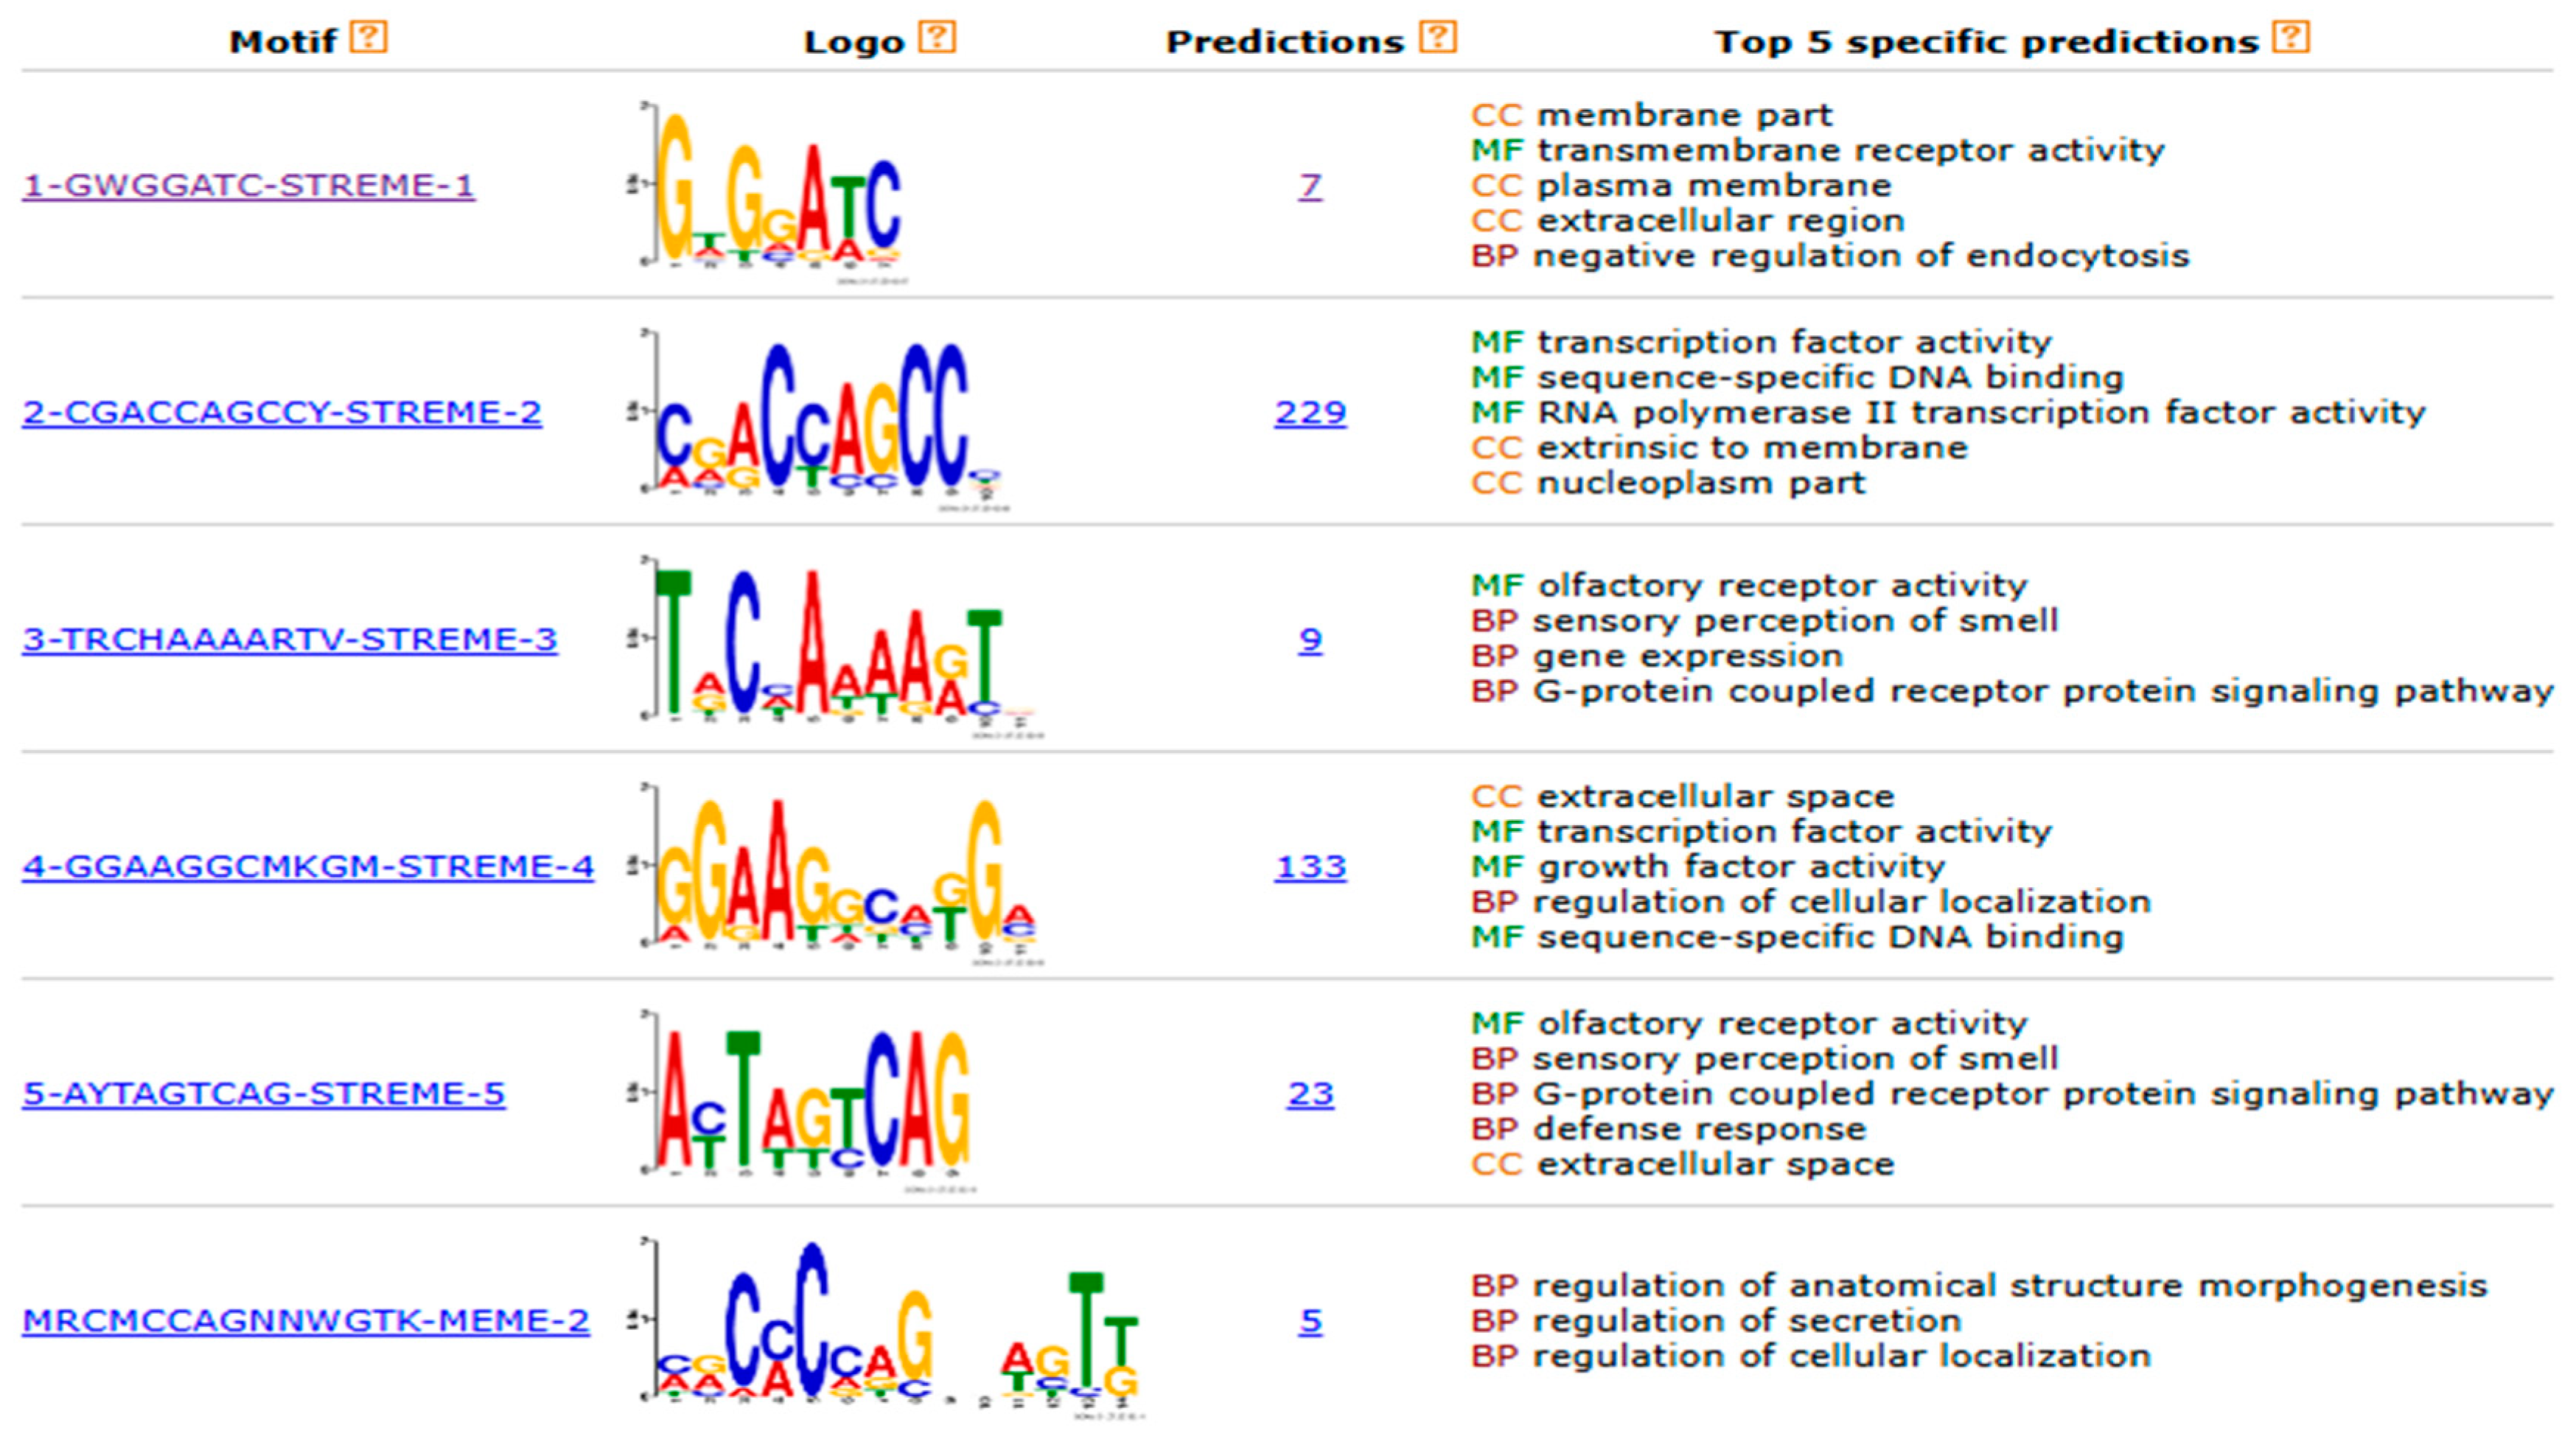
GOMo analysis was performed to associate the discovered motifs with enriched Gene Ontology (GO) terms (Figure 3; Table 5).
For STREME-3 (TRCHAAAARTV), GOMo returned nine GO terms, including six Biological Process (BP) and three Molecular Function (MF) terms. The motif showed an average GOMo score of 0.847 with p = 1.64 × 10⁻⁷ and q = 2.18 × 10⁻⁴. The top-ranked term was GO:0004984 (olfactory receptor activity) with p = 8.48 × 10⁻⁸, q = 1.99 × 10⁻⁴, and specificity 100%. Additional reported terms included GO:0007608 (sensory perception of smell; specificity 88%) and GO:0070606 (sensory perception of chemical stimulus; specificity 25%). Across the nine terms, specificity ranged from 1% to 100% (mean 26.11%).
For STREME-4 (GGAAGGCMKGM), GOMo returned 133 GO terms (98 BP, 21 MF, and 14 Cellular Component [CC]). The average score was 0.0181 with mean p = 1.82 × 10⁻⁴ and q = 0.0202. The highest-scoring term was GO:0022603 (regulation of anatomical structure morphogenesis; p = 6.07 × 10⁻⁴; q = 0.0493), whereas GO:0030154 (cell differentiation) was reported with p = 8.48 × 10⁻⁸ and q = 1.017 × 10⁻⁴. Specificity ranged from 0% to 100% (mean 15.66%).
For STREME-5 (AYTAGTCAG), GOMo returned 23 GO terms (11 BP, 9 MF, and 3 CC). The motif showed an average score of 0.00347 with p = 5.26 × 10⁻⁶ and q = 2.86 × 10⁻³. Reported terms included GO:0004984 (olfactory receptor activity; specificity 100%; p = 8.48 × 10⁻⁸), GO:0004867 (serine-type endopeptidase inhibitor activity; specificity 100%), GO:0007608 (sensory perception of smell; specificity 88%), GO:0007606 (perception of chemical stimulus; specificity 25%), and GO:0030414 (peptidase inhibitor activity; specificity 27%). Six terms were reported with 0% specificity; the overall mean specificity was 19.78%.
Finally, MEME-2 (MRCMCCAGNNWGTK) returned five GO terms, all within the BP category. The motif showed an average score of 0.00847 with p = 4.03 × 10⁻⁶ and q = 1.65 × 10⁻². Specificity values were low (mean 1.4%), with the maximum at 3% for GO:0051049 (regulation of transport) and the minimum at 0% for GO:0032879 (regulation of localization).

3.5. Motif Occurrence Scanning with FIMO

FIMO scanning of the 13 promoter sequences (−1000 to −1 bp relative to the annotated TSS) using the six PWM motifs identified a total of 325 motif occurrences across all promoters (Table S2). After FDR correction, 23 motif occurrences remained statistically significant (q ≤ 0.05), distributed across four motifs. STREME-2 (CGACCAGCCY) accounted for 10 significant hits across eight genes (AMH, AR, FOXL2, FSHR, INHA, LHCGR, PGR, and ZP3). STREME-4 (GGAAGGCMKGM) yielded nine significant hits across five genes (AMH, AR, FSHR, INHA, and ZP3). MEME-2 (MRCMCCAGNNWGTK) produced two significant hits (BMP15 and INHA), and STREME-3 (TRCHAAAARTV) produced two significant hits (FOXL2 and FSHR). No significant FIMO hits (q ≤ 0.05) were observed for STREME-1 (GWGGATC) or STREME-5 (AYTAGTCAG). Significant motif occurrences were located within −999 to −91 bp relative to the TSS (Table S2).

3.6. Epigenetic Context—MethPrimer CpG Analysis

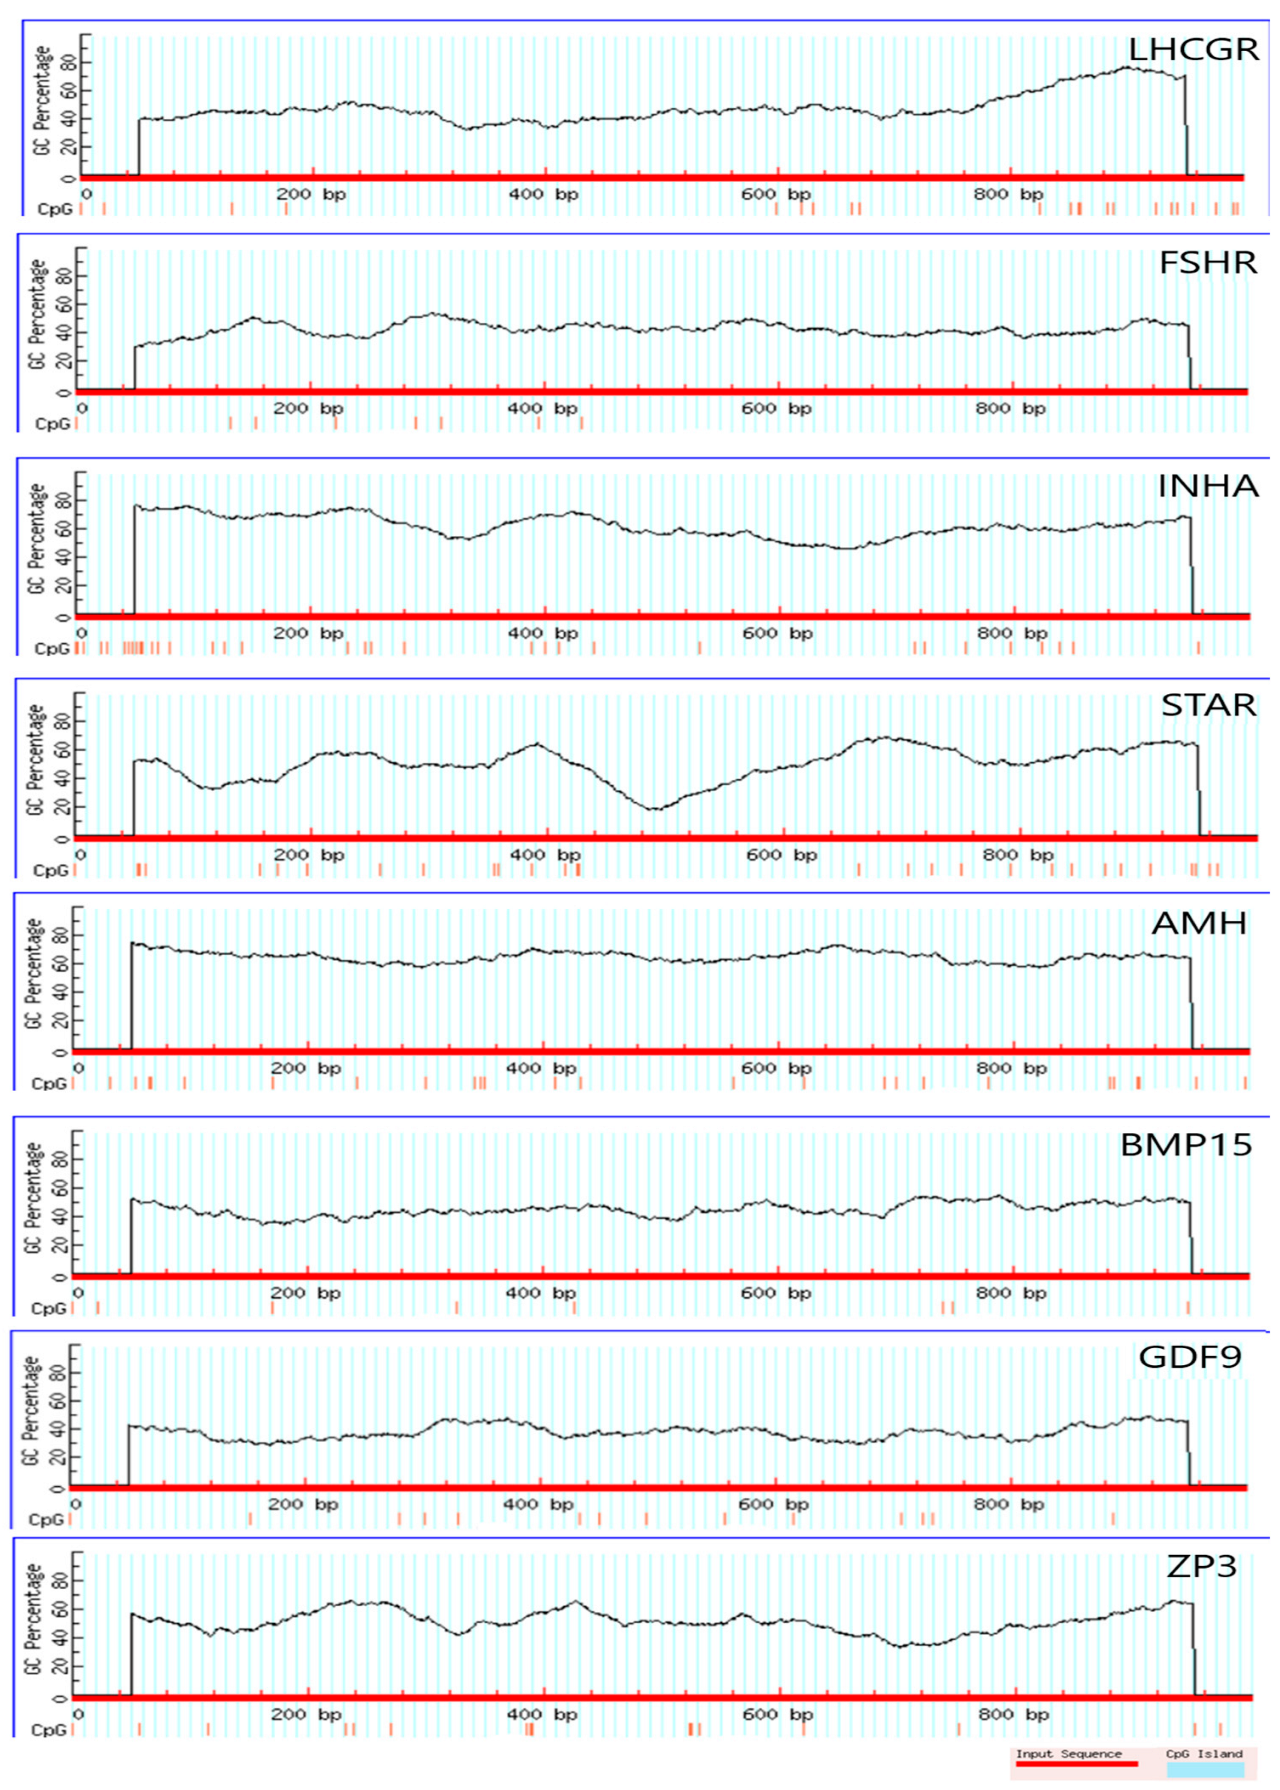
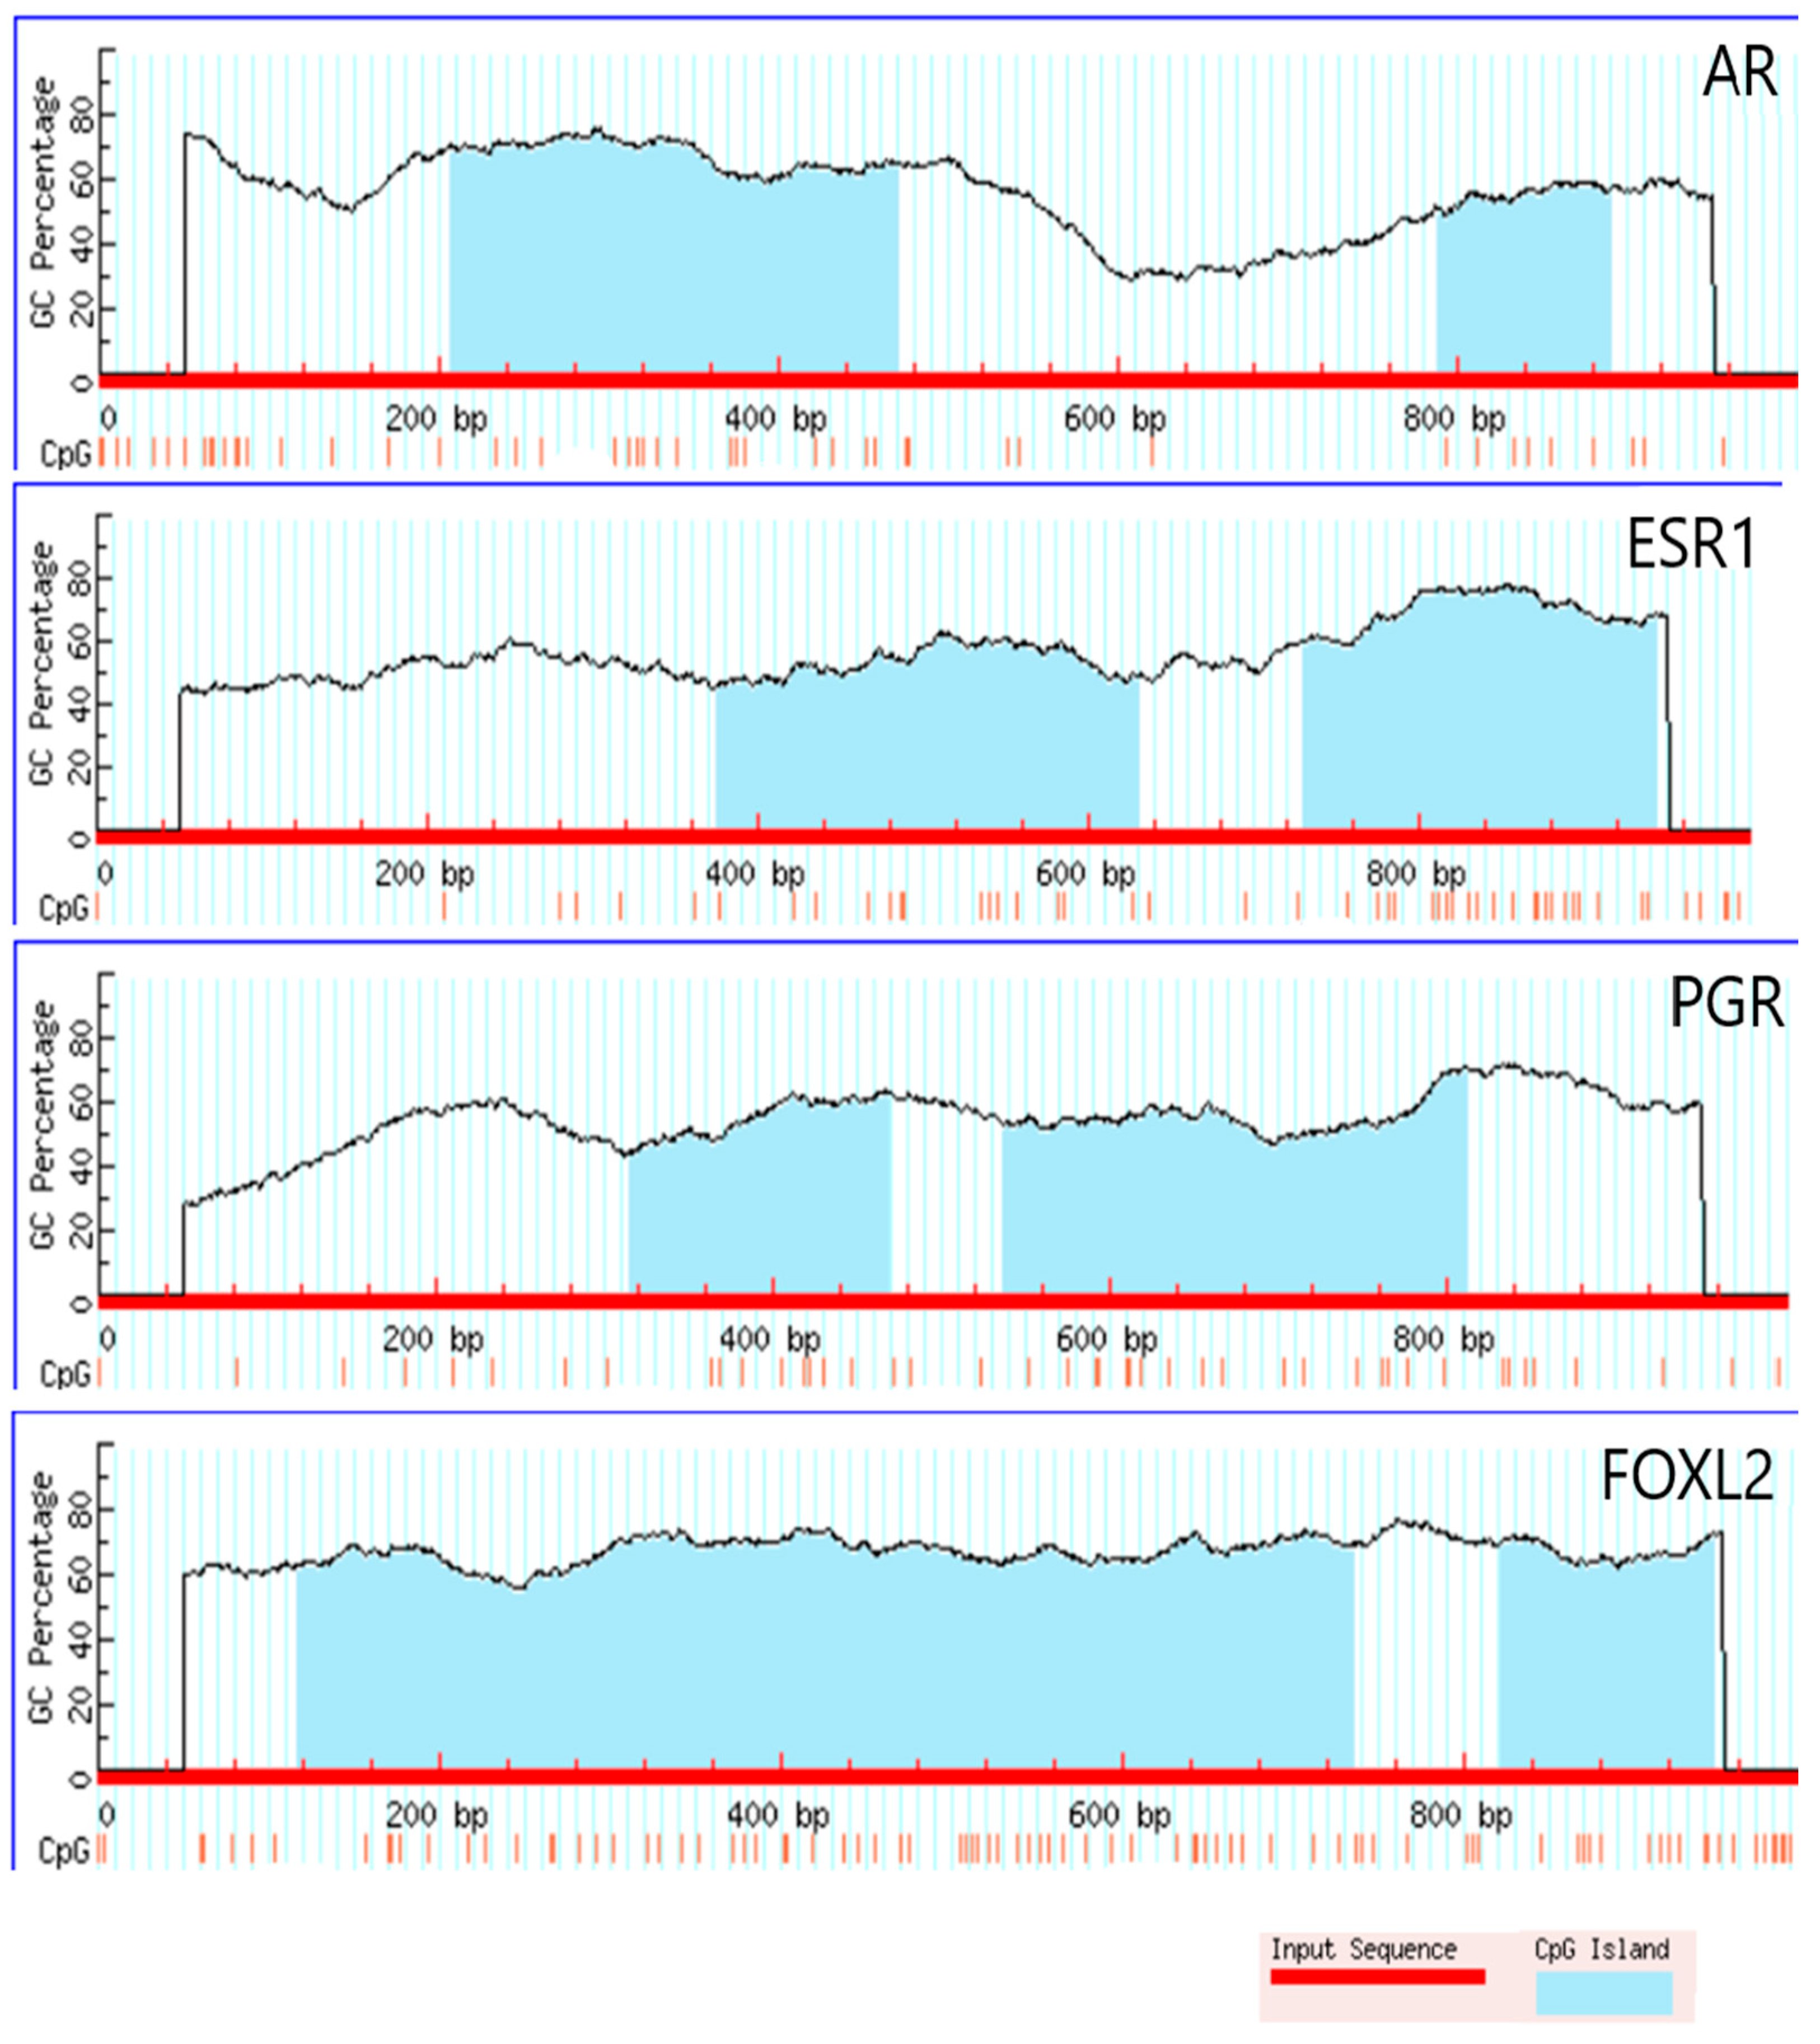
CpG island analysis was performed across the promoter regions (−1000 to −1 bp relative to the annotated TSS) of the 13 selected genes using MethPrimer (Figure 4 and Figure 5; Table 6). Figure 4 and Figure 5 visualize the CpG island predictions produced by MethPrimer across the analyzed promoter intervals, while Table 6 summarizes the number and coordinates of CpG islands per gene.
CpG islands were detected in the promoters of four genes, AR, ESR1, PGR, and FOXL2, whereas no CpG islands were detected in the remaining nine genes (FSHR, LHCGR, INHA, STAR, AMH, BMP15, GDF9, HSD3B1, and ZP3) within this 1 kb window (Figure 5; Table 6).
The number, length, and relative position of the identified CpG islands are summarized in Table 6.
For AR, two CpG islands were identified (−792 to −593 bp; 263 bp and −211 to −110 bp; 102 bp) (Figure 4; Table 6). For ESR1, two CpG islands were identified (−625 to −370 bp; 256 bp and −269 to −56 bp; 214 bp) (Figure 4; Table 6). For PGR, two CpG islands were identified (−685 to −531 bp; 155 bp and −463 to −188 bp; 276 bp) (Figure 4; Table 6). For FOXL2, two CpG islands were identified (−883 to −265 bp; 619 bp and −177 to −55 bp; 123 bp) (Figure 4; Table 6).
MethPrimer identifies CpG islands based on sequence composition only; methylation status (hypo-/hypermethylation) was not assessed in this study. Therefore, CpG islands are reported here as candidate regulatory substrates that require independent methylation profiling for functional inference.

4. Discussion

This study provides an in silico characterization of cis-regulatory motifs within −1000 to −1 bp promoter regions (relative to the annotated TSS) of 13 fertility-related genes. Motif discovery (Figure 2; Table 3), database similarity searches (Table 4), motif occurrence scanning (Table S2), functional association analysis (Figure 3; Table 5), and CpG island profiling (Table 6; Figure 4 and Figure 5) collectively define a candidate promoter-level regulatory landscape. Because the analysis is purely in silico and relies on a fixed upstream window, the reported motifs should be interpreted as candidate regulatory elements pending independent validation.

4.1. Functional Landscape of Identified Motifs

Among the six de novo motifs identified by STREME/MEME (Figure 2; Table 3), STREME-2 (CGACCAGCCY) and STREME-4 (GGAAGGCMKGM) emerged as the most recurrent motifs across the analyzed promoters and accounted for the broadest set of motif–GO associations in GOMo (Table 5). Their motif occurrences were also supported by FIMO scanning, where statistically significant hits (q ≤ 0.05) were predominantly observed for these two motifs across multiple promoter sequences (Table S2). Taken together, these observations prioritize STREME-2 and STREME-4 as candidate cis-elements for downstream validation within the investigated −1000 to −1 bp promoter window.
Tomtom projection of the discovered motifs onto known transcription factor PWMs (JASPAR 2024) did not yield statistically significant matches at q ≤ 0.05 (Table 4), indicating that similarity to curated motif models is limited under the applied criteria. Nevertheless, the closest (non-significant) matches for selected motifs (e.g., STREME-4 to an ETS-family PWM and STREME-2 to ZBT7A) provide tentative hypotheses for follow-up testing rather than definitive TF assignments (Table 4). Similarly, the GC-rich MEME-2 motif showed its best (non-significant) similarity to an E-box–binding model (Table 4), consistent with the possibility that the identified pattern reflects a variant or under-represented regulatory element in the queried database.
To validate our promoter-level motif findings, we cross-referenced the transcription factor hypotheses implied by the closest Tomtom projections (Table 4) with published cohort/case–control and experimental evidence in infertility-relevant diagnoses. For the Sp1-linked pattern (Table 4), Shen et al. reported increased Sp1 expression in ovarian endometriosis patients (case–control cohort) and demonstrated a mechanistic connection involving miR-25-3p targeting Sp1, supporting the plausibility of GC-rich/Sp1-centered regulatory programs in endometriosis-associated infertility [41]. In polycystic ovary syndrome (PCOS), Anjali et al. showed that FSH stimulates IRS-2 expression via cAMP-dependent Sp1 promoter binding in human granulosa cells and reported this FSH–Sp1 action to be inoperative in granulosa cells from PCOS patients (experimental human study), linking Sp1-dependent promoter regulation to a major infertility-associated condition [42].
For the ETS-family hypothesis (Table 4), evidence supports disease relevance of GABPA-regulated axes in endometriosis: Deng et al. reported that PHB2 is transcriptionally regulated by GABPA and performed functional mitochondrial and cellular assays in ovarian endometriosis-related models, indicating GABPA-associated regulatory control in disease-relevant tissue/cell contexts [43]. In addition, Huang et al. experimentally implicated a miR-450b-5p/GABPA/HOXD10 axis in promoting ectopic endometriotic lesion growth, further supporting a role for GABPA-centered regulation in endometriosis [44].
For the CREB/ATF-linked motif (Table 4), Kalantari et al. performed a case–control study in endometriosis and examined CREB/CREM/CRTC2 expression and ICER binding to CYP19A1 promoter II using ChIP-qPCR, providing direct promoter-level evidence consistent with CRE-like regulatory involvement in disease-associated transcriptional programs [45]. In PCOS, patient-specific iPSC-derived granulosa cell modeling revealed hyperactive CREB signaling in PCOS subjects, supporting CREB-pathway dysregulation in another major infertility-associated condition [46]. Moreover, ATF4—within the broader ATF family—was investigated using human granulosa cells from PCOS patients and controls, linking ATF-family signaling to ovulatory function via COX2/PGE2 regulation [47]. In the context of implantation, ATF3 was reported to be significantly downregulated in the endometrium of recurrent implantation failure (RIF) patients, and mechanistic analyses supported ATF3 involvement in endometrial receptivity [48,49].
For the TCF4/E-box hypothesis (Table 4), Ma et al. demonstrated β-catenin–TCF4 interaction and showed that TCF4 overexpression accelerates granulosa cell cycle progression and alters expression of key cell-cycle/steroidogenesis-related genes, supporting the biological plausibility of a TCF4/Wnt-linked regulatory axis relevant to ovarian follicular function [50].
The broad “Homeobox/ZnF” Tomtom label (Table 4) is consistent with the established role of Homeobox transcriptional programs in endometrial receptivity and implantation biology: HOXA10 expression was found decreased in the secretory endometrium of women with adenomyosis (case–control study), which was linked to impaired implantation potential [51]. In endometriosis-associated infertility, altered HOXA10 regulation has been reported, including epigenetic dysregulation (e.g., higher methylation levels in eutopic endometrium of affected patients) [52,53,54].
Endometrial cancer is also infertility-relevant because definitive management often requires hysterectomy, while fertility-sparing treatment is limited to selected early-stage disease and carries risk of recurrence/progression, underscoring the importance of endometrial regulatory programs in fertility outcomes [55,56,57,58,59]. In this context, ZBTB7A (ZBT7A/Pokemon)—suggested among the closest Tomtom projections (Table 4)—has been investigated in endometrial cancer using bioinformatics plus experimental validation, where ZBTB7A was reported to modulate malignant phenotypes (including proliferation/migration) and was associated with prognostic features [60,61]. Although this evidence does not directly validate TF binding to our motifs, it supports the broader relevance of ZBTB7A-centered transcriptional regulation in an endometrial pathology strongly linked to compromised fertility.
Collectively, these cohort and experimental findings provide independent, disease-context biological support for the TF families suggested by Table 4. Because the Tomtom matches were not statistically significant (q > 0.05), we retain these links as hypothesis-generating rather than definitive TF assignments and emphasize that direct TF-binding validation (e.g., ChIP, reporter assays, or relevant epigenomic datasets) remains a necessary next step.
GOMo returned motif-linked GO term sets that include signaling and receptor-related annotations for AT-rich motifs (Table 5). Notably, several top-ranked GOMo terms were olfactory receptor-related (Table 5), which should be interpreted cautiously given the known tendency of large receptor gene families and database composition to influence GO-based associations. In this context, prior reports describing ectopic expression of olfactory receptors and broader non-olfactory roles of OR/GPCR signaling in non-olfactory tissues provide supporting background for considering these annotations in reproductive biology, while emphasizing the need for independent validation in ovarian models [62,63,64].
Because no transcriptomic/epigenomic or case–control datasets were integrated in this study, the identified motifs should be interpreted as hypothesis-generating candidates pending targeted experimental validation. In addition, we did not systematically cross-reference predicted motif instances with curated regulatory annotations (e.g., ENCODE TF-binding/chromatin features and EPD promoter resources), which will be an important next step to prioritize promoter segments supported by independent evidence.

4.2. Gene-Specific Regulatory Insights

  • FOXL2 showed multiple motif occurrences within the −1000 to −1 bp promoter window (Table S2) and contained CpG islands within this region (Table 6; Figure 5). Together with the positional enrichment patterns reported for selected motifs (Figure 3), these features prioritize FOXL2 for targeted promoter-level validation in ovarian cell models.
  • FSHR exhibited recurrent motif occurrences in the promoter window, including significant FIMO hits for enriched motifs (Table S2), supporting follow-up testing of motif-driven promoter activity under variable transcription factor contexts.
  • AR and PGR combined motif occurrences (Table S2) with CpG islands in the analyzed promoter interval (Table 6; Figure 4 and Figure 5), consistent with the possibility that multiple regulatory layers contribute to promoter activity in these loci.
  • ESR1 displayed CpG islands and motif occurrences within the analyzed promoter window (Table 6 and Table S2; Figure 5). Given prior reports of altered methylation patterns affecting ESR1 regulation in reproductive contexts, these promoter features may be useful targets for future validation rather than diagnostic conclusions.
  • GDF9 and BMP15 showed fewer motif occurrences overall in the scanned promoter window (Table S2) but included motif instances that warrant prioritization in oocyte-related follow-up assays, particularly in the context of oocyte–cumulus signaling pathways.

4.3. Epigenetic Landscape

MethPrimer profiling detected CpG islands within the −1000 to −1 bp promoter window for AR, ESR1, PGR, and FOXL2 (Table 6; Figure 4 and Figure 5), whereas no CpG islands were detected in the remaining genes within this interval. In these four loci, CpG islands overlapped the analyzed promoter window in which motif occurrences were also observed (Table S2), supporting the possibility that promoter methylation may modulate local regulatory architecture. For genes without CpG islands in the analyzed 1 kb window, epigenetic regulation cannot be excluded, as DNA methylation and other chromatin features may occur outside this interval (e.g., intronic, intergenic, or distal regulatory regions). These observations highlight CpG-associated promoter segments as candidates for targeted validation in future studies.

4.4. Clinical and Biological Implications

The regulatory motifs identified here define candidate promoter-level features that may help prioritize targets for follow-up studies of fertility-related gene regulation. However, because the present work is purely in silico and does not include experimental validation or patient-derived cohorts, the results should not be interpreted as diagnostic biomarkers or therapeutic targets at this stage. Instead, motifs with recurrent occurrences and statistically supported FIMO hits (Table S2), together with promoter CpG islands (Table 6; Figure 4 and Figure 5), provide a rational basis for selecting loci and motif–promoter segments for targeted functional assays (e.g., promoter–reporter constructs, TF-binding assays, and methylation-sensitive analyses). In a translational context, such validation could subsequently be extended to clinically relevant settings (e.g., infertility-associated phenotypes) to evaluate whether specific promoter variants, motif disruptions, or methylation patterns correlate with altered gene expression.

5. Conclusions

This in silico study identifies candidate cis-regulatory motifs within the −1000 to −1 bp promoter regions upstream of the annotated TSS of 13 human fertility-related genes. STREME-2 and STREME-4 were the most recurrent motifs within the analyzed window, while several additional motifs lacked significant similarity to curated PWM models, consistent with divergent or under-represented regulatory patterns. CpG island profiling highlighted promoter segments in FOXL2, AR, PGR, and ESR1 as additional candidates for follow-up testing. Because the analysis is purely in silico and restricted to a fixed promoter interval, these findings should be interpreted as hypotheses that require experimental validation in appropriate ovarian cell models.

Supplementary Materials

The following supporting information can be downloaded at: https://www.mdpi.com/article/10.3390/applbiosci5010014/s1. Table S1: Genomic coordinates of promoter regions (−1000 to −1 bp from annotated TSS) for the 13 fertility-related genes on GRCh38/hg38, based on NCBI RefSeq/MANE annotations; Table S2: FIMO motif occurrences across promoter sequences (−1000 to −1 bp relative to the annotated TSS). Coordinates are provided as positions within the 1 kb promoter (1–1000) and as bp relative to the TSS (−1000 to −1); Figure S1: Bioinformatic workflow for promoter and motif analysis.

Author Contributions

Conceptualization, D.H. and D.S.; methodology, D.H. and D.S.; software, D.H.; validation, D.S.; formal analysis, D.H.; investigation, D.H.; resources, D.H.; data curation, D.H.; writing—original draft preparation, D.H.; writing—review and editing, D.H. and D.S.; visualization, D.H.; supervision, D.S.; project administration, D.S. All authors have read and agreed to the published version of the manuscript.

Funding

This research received no external funding.

Institutional Review Board Statement

Not applicable.

Informed Consent Statement

Not applicable.

Data Availability Statement

The original contributions presented in this study are included in the article/Supplementary Materials. Further inquiries can be directed to the corresponding authors.

Conflicts of Interest

The authors declare no conflicts of interest.

References

  1. Cox, C.M.; Thoma, M.E.; Tchangalova, N.; Mburu, G.; Bornstein, M.J.; Johnson, C.L.; Kiarie, J. Infertility prevalence and the methods of estimation from 1990 to 2021: A systematic review and meta-analysis. Hum. Reprod. Open 2022, 2022, hoac051. [Google Scholar] [CrossRef] [Scilit] [PubMed]
  2. The European IVF Monitoring Consortium (EIM) for the European Society of Human Reproduction and Embryology (ESHRE); Smeenk, J.; Wyns, C.; De Geyter, C.; Kupka, M.; Bergh, C.; Saiz, I.C.; De Neubourg, D.; Rezabek, K.; Tandler-Schneider, A.; et al. ART in Europe, 2019: Results generated from European registries by ESHRE. Hum. Reprod. 2023, 38, 2321–2338. [Google Scholar] [CrossRef] [Scilit]
  3. Wallace, W.H.B.; Kelsey, T.W. Human ovarian reserve from conception to the menopause. PLoS ONE 2010, 5, e8772. [Google Scholar] [CrossRef] [Scilit]
  4. Mutlu, M.F.; Erdem, M.; Erdem, A.; Yildiz, S.; Mutlu, I.; Arisoy, O.; Oktem, M. Antral follicle count determines poor ovarian response better than anti-Müllerian hormone but age is the only predictor for live birth in in vitro fertilization cycles. J. Assist. Reprod. Genet. 2013, 30, 657–665. [Google Scholar] [CrossRef] [Scilit]
  5. Baldini, G.M.; Ferri, D.; Malvasi, A.; Laganà, A.S.; Vimercati, A.; Dellino, M.; Baldini, D.; Trojano, G. Genetic Abnormalities of Oocyte Maturation: Mechanisms and Clinical Implications. Int. J. Mol. Sci. 2024, 25, 13002. [Google Scholar] [CrossRef] [Scilit]
  6. Simoni, M.; Nieschlag, E.; Gromoll, J. Isoforms and single nucleotide polymorphisms of the FSH receptor gene: Implications for human reproduction. Hum. Reprod. Update 2002, 8, 413–421. [Google Scholar] [CrossRef] [Scilit]
  7. Polyzos, N.P.; Neves, A.R.; Drakopoulos, P.; Spits, C.; Mercadal, B.A.; Garcia, S.; Ma, P.Q.M.; Le, L.H.; Ho, M.T.; Mertens, J.; et al. The effect of polymorphisms in FSHR and FSHB genes on ovarian response: A prospective multicenter multinational study in Europe and Asia. Hum. Reprod. 2021, 36, 1711–1721. [Google Scholar] [CrossRef] [Scilit]
  8. Li, N.; Guan, Y.; Ren, B.; Zhang, Y.; Du, Y.; Kong, H.; Zhang, Y.; Lou, H. Effect of blastocyst morphology and developmental rate on euploidy and live birth rates in preimplantation genetic testing for aneuploidy cycles with single-embryo transfer. Front. Endocrinol. 2022, 13, 858042. [Google Scholar] [CrossRef] [Scilit]
  9. Yan, J.; Qin, Y.; Zhao, H.; Sun, Y.; Gong, F.; Li, R.; Sun, X.; Ling, X.; Li, H.; Hao, C.; et al. Live birth with or without preimplantation genetic testing for aneuploidy. N. Engl. J. Med. 2021, 385, 2047–2058. [Google Scholar] [CrossRef] [Scilit] [PubMed]
  10. Kasaven, L.S.; Marcus, D.; Theodorou, E.; Jones, B.P.; Saso, S.; Naja, R.; Serhal, P.; Ben-Nagi, J. Systematic review and meta-analysis: Does pre-implantation genetic testing for aneuploidy at the blastocyst stage improve live birth rate? J. Assist. Reprod. Genet. 2023, 40, 2297–2316. [Google Scholar] [CrossRef] [Scilit] [PubMed]
  11. Mastenbroek, S.; Twisk, M.; van der Veen, F.; Repping, S. Preimplantation genetic screening: A systematic review and meta-analysis of RCTs. Hum. Reprod. Update 2011, 17, 454–466. [Google Scholar] [CrossRef] [Scilit]
  12. Fu, W.; Cui, Q.; Bu, Z.; Shi, H.; Yang, Q.; Hu, L. Elevated sperm DNA fragmentation is correlated with an increased chromosomal aneuploidy rate of miscarried conceptus in women of advanced age undergoing fresh embryo transfer cycle. Front. Endocrinol. 2024, 15, 1289763. [Google Scholar] [CrossRef] [Scilit]
  13. Ye, L.; Dimitriadis, E. Endometrial Receptivity–Lessons from “Omics”. Biomolecules 2025, 15, 106. [Google Scholar] [CrossRef] [Scilit]
  14. Rocha-Junior, C.V.; Da Broi, M.G.; Miranda-Furtado, C.L.; Navarro, P.A.; Ferriani, R.A.; Meola, J. Progesterone receptor B (PGR-B) is partially methylated in eutopic endometrium from infertile women with endometriosis. Reprod. Sci. 2019, 26, 1568–1574. [Google Scholar] [CrossRef] [Scilit]
  15. Kanhere, A.; Bansal, M. Structural properties of promoters: Similarities and differences between prokaryotes and eukaryotes. Nucleic Acids Res. 2005, 33, 3165–3175. [Google Scholar] [CrossRef] [Scilit] [PubMed]
  16. Bucher, P. Weight matrix descriptions of four eukaryotic RNA polymerase II promoter elements derived from 502 unrelated promoter sequences. J. Mol. Biol. 1990, 212, 563–578. [Google Scholar] [CrossRef] [Scilit]
  17. Pirtea, P.; de Ziegler, D.; Marin, D.; Sun, L.; Tao, X.; Ayoubi, J.M.; Franasiak, J.; Scott, R.T., Jr. Gonadotropin receptor polymorphisms (FSHR N680S and LHCGR N312S) are not predictive of clinical outcome and live birth in assisted reproductive technology. Fertil. Steril. 2022, 118, 494–503. [Google Scholar] [CrossRef] [Scilit] [PubMed]
  18. Schmidt, D.; Ovitt, C.E.; Anlag, K.; Fehsenfeld, S.; Gredsted, L.; Treier, A.C.; Treier, M. The murine winged-helix transcription factor Foxl2 is required for granulosa cell differentiation and ovary maintenance. Development 2004, 131, 933–942. [Google Scholar] [CrossRef] [Scilit]
  19. Quaynor, S.D.; Stradtman, E.W., Jr.; Kim, H.G.; Shen, Y.; Chorich, L.P.; Schreihofer, D.A.; Layman, L.C. Delayed puberty and estrogen resistance in a woman with estrogen receptor α variant. N. Engl. J. Med. 2013, 369, 164–171. [Google Scholar] [CrossRef] [Scilit] [PubMed]
  20. Lledó, B.; Llácer, J.; Turienzo, A.; Ortiz, J.A.; Guerrero, J.; Morales, R.; Ten, J.; Bernabeu, R. Androgen receptor CAG repeat length is associated with ovarian reserve but not with ovarian response. Reprod. Biomed. Online 2014, 29, 509–515. [Google Scholar] [CrossRef] [Scilit]
  21. Chand, A.L.; Ooi, G.T.; Harrison, C.A.; Shelling, A.N.; Robertson, D.M. Functional analysis of the human inhibin α subunit variant A257T and its potential role in premature ovarian failure. Hum. Reprod. 2007, 22, 3241–3248. [Google Scholar] [CrossRef] [Scilit]
  22. Albarel, F.; Perrin, J.; Jegaden, M.; Roucher-Boulez, F.; Reynaud, R.; Brue, T.; Courbiere, B. Successful IVF pregnancy despite inadequate ovarian steroidogenesis due to congenital lipoid adrenal hyperplasia (CLAH): A case report. Hum. Reprod. 2016, 31, 2609–2612. [Google Scholar] [CrossRef] [Scilit]
  23. Rigon, C.; Andrisani, A.; Forzan, M.; D’Antona, D.; Bruson, A.; Cosmi, E.; Ambrosini, G.; Tiboni, G.M.; Clementi, M. Association study of AMH and AMHRII polymorphisms with unexplained infertility. Fertil. Steril. 2010, 94, 1244–1248. [Google Scholar] [CrossRef] [Scilit]
  24. Rossetti, R.; Di Pasquale, E.; Marozzi, A.; Bione, S.; Toniolo, D.; Grammatico, P.; Nelson, L.M.; Beck-Peccoz, P.; Persani, L. BMP15 mutations associated with primary ovarian insufficiency cause a defective production of bioactive protein. Hum. Mutat. 2009, 30, 804–810. [Google Scholar] [CrossRef] [Scilit] [PubMed]
  25. Kovanci, E.; Rohozinski, J.; Simpson, J.L.; Heard, M.J.; Bishop, C.E.; Carson, S.A. Growth differentiating factor-9 mutations may be associated with premature ovarian failure. Fertil. Steril. 2007, 87, 143–146. [Google Scholar] [CrossRef] [Scilit] [PubMed]
  26. Tu, Y.A.; Lin, S.J.; Chen, P.L.; Chou, C.H.; Huang, C.C.; Ho, H.N.; Chen, M.J. HSD3B1 gene polymorphism and female pattern hair loss in women with polycystic ovary syndrome. J. Formos. Med. Assoc. 2019, 118, 1225–1231. [Google Scholar] [CrossRef] [Scilit]
  27. Zhou, Z.; Ni, C.; Wu, L.; Chen, B.; Xu, Y.; Zhang, Z.; Mu, J.; Li, B.; Yan, Z.; Fu, J.; et al. Novel mutations in ZP1, ZP2, and ZP3 cause female infertility due to abnormal zona pellucida formation. Hum. Genet. 2019, 138, 327–337. [Google Scholar] [CrossRef] [Scilit] [PubMed]
  28. Altmäe, S.; Haller, K.; Peters, M.; Saare, M.; Hovatta, O.; Stavreus-Evers, A.; Velthut, A.; Karro, H.; Metspalu, A.; Salumets, A. Aromatase gene (CYP19A1) variants, female infertility and ovarian stimulation outcome: A preliminary report. Reprod. Biomed. Online 2009, 18, 651–657. [Google Scholar] [CrossRef] [Scilit]
  29. Lang-Muritano, M.; Sproll, P.; Wyss, S.; Kolly, A.; Hürlimann, R.; Konrad, D.; Biason-Lauber, A. Early-onset complete ovarian failure and lack of puberty in a woman with mutated estrogen receptor β (ESR2). J. Clin. Endocrinol. Metab. 2018, 103, 3748–3756. [Google Scholar] [CrossRef] [Scilit]
  30. Lourenço, D.; Brauner, R.; Lin, L.; De Perdigo, A.; Weryha, G.; Muresan, M.; Boudjenah, R.; Guerra-Junior, G.; Maciel-Guerra, A.T.; Bashamboo, A. Mutations in NR5A1 associated with ovarian insufficiency. N. Engl. J. Med. 2009, 360, 1200–1210. [Google Scholar] [CrossRef] [Scilit]
  31. Yang, J.Y.; Zhou, Y.; Yu, Z.G.; Anh, V.; Zhou, L.Q. Human Pol II promoter recognition based on primary sequences and free energy of dinucleotides. BMC Bioinform. 2008, 9, 113. [Google Scholar] [CrossRef] [Scilit] [PubMed]
  32. Gangal, R.; Sharma, P. Human pol II promoter prediction: Time series descriptors and machine learning. Nucleic Acids Res. 2005, 33, 1332–1336. [Google Scholar] [CrossRef] [Scilit]
  33. Reese, M.G. Application of a time-delay neural network to promoter annotation in the Drosophila melanogaster genome. Comput. Chem. 2001, 26, 51–56. [Google Scholar] [CrossRef] [Scilit]
  34. Machanick, P.; Bailey, T.L. MEME-ChIP: Motif analysis of large DNA datasets. Bioinformatics 2011, 27, 1696–1697. [Google Scholar] [CrossRef] [Scilit]
  35. Bailey, T.L. STREME: Accurate and versatile sequence motif discovery. Bioinformatics 2021, 37, 2834–2840. [Google Scholar] [CrossRef] [Scilit]
  36. Gupta, S.; Stamatoyannopoulos, J.A.; Bailey, T.L.; Noble, W.S. Quantifying similarity between motifs. Genome Biol. 2007, 8, R24. [Google Scholar] [CrossRef] [Scilit]
  37. Grant, C.E.; Bailey, T.L.; Noble, W.S. FIMO: Scanning for occurrences of a given motif. Bioinformatics 2011, 27, 1017–1018. [Google Scholar] [CrossRef] [Scilit]
  38. Bailey, T.L.; Machanick, P. Inferring direct DNA binding from ChIP-seq. Nucleic Acids Res. 2012, 40, e128. [Google Scholar] [CrossRef] [Scilit]
  39. Li, L.C.; Dahiya, R. MethPrimer: Designing primers for methylation PCRs. Bioinformatics 2002, 18, 1427–1431. [Google Scholar] [CrossRef] [Scilit] [PubMed]
  40. Daei-Farshbaf, N.; Aflatoonian, R.; Amjadi, F.S.; Taleahmad, S.; Ashrafi, M.; Bakhtiyari, M. Expression pattern of olfactory receptor genes in human cumulus cells as an indicator for competent oocyte selection. Turk. J. Biol. 2020, 44, 371–380. [Google Scholar] [CrossRef] [Scilit] [PubMed]
  41. Shen, L.; Hong, X.; Liu, Y.; Zhou, W.; Zhang, Y. The miR-25-3p/Sp1 pathway is dysregulated in ovarian endometriosis. J. Int. Med. Res. 2020, 48, 0300060520918437. [Google Scholar] [CrossRef] [Scilit] [PubMed]
  42. Anjali, G.; Kaur, S.; Lakra, R.; Taneja, J.; Kalsey, G.S.; Nagendra, A.; Shrivastav, T.; Devi, M.G.; Malhotra, N.; Kriplani, A.; et al. FSH stimulates IRS-2 expression in human granulosa cells through cAMP/SP1, an inoperative FSH action in PCOS patients. Cell. Signal. 2015, 27, 2452–2466. [Google Scholar] [CrossRef] [Scilit] [PubMed]
  43. Deng, Y.; Lou, T.; Kong, L.; Liu, C. Prohibitin2/PHB2, transcriptionally regulated by GABPA, inhibits cell growth via PRKN/Parkin-dependent mitophagy in endometriosis. Reprod. Sci. 2023, 30, 3629–3640. [Google Scholar] [CrossRef] [Scilit] [PubMed]
  44. Huang, Y.; Wang, Y.; Li, R.; Liu, Y.; Yang, Y. miR-450b-5p promotes development of endometriosis by inhibiting the GABPA/HOXD10 axis. iScience 2024, 27, 111487. [Google Scholar] [CrossRef] [Scilit]
  45. Kalantari, S.; Varnosfaderani, A.S.; Ramezanali, F.; Amirchaghmaghi, E.; Shahhoseini, M. Dynamic regulation of CYP19A1 promoter region under control of CREB family members in endometrial tissues of women with endometriosis: A case-control study. Int. J. Fertil. Steril. 2025, 19, 151. [Google Scholar]
  46. Huang, C.C.; Chen, M.J.; Lan, C.W.; Wu, C.E.; Huang, M.C.; Kuo, H.C.; Ho, H.N. Hyperactive CREB signaling pathway involved in the pathogenesis of polycystic ovarian syndrome revealed by patient-specific induced pluripotent stem cell modeling. Fertil. Steril. 2019, 112, 594–607. [Google Scholar] [CrossRef] [Scilit]
  47. Di, F.; Liu, J.; Li, S.; Yao, G.; Hong, Y.; Chen, Z.J.; Li, W.; Du, Y. ATF4 contributes to ovulation via regulating COX2/PGE2 expression: A potential role of ATF4 in PCOS. Front. Endocrinol. 2018, 9, 669. [Google Scholar] [CrossRef] [Scilit]
  48. Wang, Z.; Liu, Y.; Liu, J.; Kong, N.; Jiang, Y.; Jiang, R.; Zhen, X.; Zhou, J.; Li, C.; Sun, H.; et al. ATF3 deficiency impairs the proliferative–secretory phase transition and decidualization in RIF patients. Cell Death Dis. 2021, 12, 387. [Google Scholar] [CrossRef] [Scilit]
  49. Cheng, X.; Liu, J.; Shan, H.; Sun, L.; Huang, C.; Yan, Q.; Jiang, R.; Ding, L.; Jiang, Y.; Zhou, J.; et al. Activating transcription factor 3 promotes embryo attachment via up-regulation of leukemia inhibitory factor in vitro. Reprod. Biol. Endocrinol. 2017, 15, 42. [Google Scholar] [CrossRef] [Scilit]
  50. Ma, X.; Han, X.; Wang, W.; Zhang, Q.; Tang, H. β-Catenin regulates ovarian granulosa cell cycle and proliferation in laying hens by interacting with TCF4. Poult. Sci. 2024, 103, 103377. [Google Scholar] [CrossRef] [Scilit]
  51. Fischer, C.P.; Kayisili, U.; Taylor, H.S. HOXA10 expression is decreased in endometrium of women with adenomyosis. Fertil. Steril. 2011, 95, 1133–1136. [Google Scholar] [CrossRef] [Scilit]
  52. Fambrini, M.; Sorbi, F.; Bussani, C.; Cioni, R.; Sisti, G.; Andersson, K.L. Hypermethylation of HOXA 10 gene in mid-luteal endometrium from women with ovarian endometriomas. Acta Obstet. Et Gynecol. Scand. 2013, 92, 1331–1334. [Google Scholar] [CrossRef] [Scilit]
  53. Muharam, R.; Harzif, A.K.; Catherine; Asmarinah; Wiweko, B. A preliminary communication: Ongoing study on HOXA10 methylation profile of endometriosis patients with infertility. J. Endometr. Pelvic Pain Disord. 2016, 8, 106–110. [Google Scholar] [CrossRef] [Scilit]
  54. Mirabutalebi, S.H.; Karami, N.; Montazeri, F.; Fesahat, F.; Sheikhha, M.H.; Hajimaqsoodi, E.; Zarchi, M.K.; Kalantar, S.M. The relationship between the expression levels of miR-135a and HOXA10 gene in the eutopic and ectopic endometrium. Int. J. Reprod. Biomed. 2018, 16, 501. [Google Scholar] [CrossRef] [Scilit]
  55. Obermair, A.; Baxter, E.; Brennan, D.J.; McAlpine, J.N.; Muellerer, J.J.; Amant, F.; van Gent, M.D.J.M.; Coleman, R.L.; Westin, S.N.; Yates, M.S.; et al. Fertility-sparing treatment in early endometrial cancer: Current state and future strategies. Obstet. Gynecol. Sci. 2020, 63, 417–431. [Google Scholar] [CrossRef] [Scilit]
  56. Centini, G.; Colombi, I.; Ianes, I.; Perelli, F.; Ginetti, A.; Cannoni, A.; Habib, N.; Negre, R.R.; Martire, F.G.; Raimondo, D.; et al. Fertility Sparing in Endometrial Cancer: Where Are We Now? Cancers 2025, 17, 112. [Google Scholar] [CrossRef] [Scilit] [PubMed]
  57. Hsu, Y.T.; Hsu, H.C.; Lee, C.Y.; Hung, W.T.; Chen, C.H. Long-term outcomes of fertility-sparing treatment in endometrial carcinoma and endometrial intraepithelial neoplasia: Recurrence risk factors over a 9-year follow-up. Acta Obstet. Et Gynecol. Scand. 2025, 104, 1994–2005. [Google Scholar] [CrossRef] [Scilit]
  58. Chae, S.H.; Shim, S.H.; Lee, S.J.; Lee, J.Y.; Kim, S.N.; Kang, S.B. Pregnancy and oncologic outcomes after fertility-sparing management for early stage endometrioid endometrial cancer. Int. J. Gynecol. Cancer 2019, 29, 77–85. [Google Scholar] [CrossRef] [Scilit] [PubMed]
  59. Yu, J.; Zhang, Y.; Yang, H.; Xu, Y. Reproductive advance of fertility preservation in patients with early endometrial carcinoma or endometrial atypical hyperplasia. Gynecol. Obstet. Clin. Med. 2022, 2, 186–190. [Google Scholar] [CrossRef] [Scilit]
  60. Geng, R.; Zheng, Y.; Zhou, D.; Li, Q.; Li, R.; Guo, X. ZBTB7A, a potential biomarker for prognosis and immune infiltrates, inhibits progression of endometrial cancer based on bioinformatics analysis and experiments. Cancer Cell Int. 2020, 20, 542. [Google Scholar] [CrossRef] [Scilit]
  61. Boroń, D.; Zmarzły, N.; Wierzbik-Strońska, M.; Rosińczuk, J.; Mieszczański, P.; Grabarek, B.O. Recent multiomics approaches in endometrial cancer. Int. J. Mol. Sci. 2022, 23, 1237. [Google Scholar] [CrossRef] [Scilit] [PubMed]
  62. Flegel, C.; Manteniotis, S.; Osthold, S.; Hatt, H.; Gisselmann, G. Expression profile of ectopic olfactory receptors determined by deep sequencing. PLoS ONE 2013, 8, e55368. [Google Scholar] [CrossRef] [Scilit] [PubMed]
  63. Maßberg, D.; Hatt, H. Human olfactory receptors: Novel cellular functions outside of the nose. Physiol. Rev. 2018, 98, 1739–1763. [Google Scholar] [CrossRef] [Scilit] [PubMed]
  64. Zhang, Q.; Madden, N.E.; Wong, A.S.T.; Chow, B.K.C.; Lee, L.T.O. The role of endocrine G protein-coupled receptors in ovarian cancer progression. Front. Endocrinol. 2017, 8, 66. [Google Scholar] [CrossRef] [Scilit]
Figure 1. NNPP-predicted promoter/TSS locations and confidence scores within the 1 kb upstream promoter window for the 13 analyzed genes.
Applbiosci 05 00014 g001
Figure 2. Nucleotide colors follow the standard scheme (A, C, G, T). Letter height reflects nucleotide frequency/information content at each position.
Applbiosci 05 00014 g002
Figure 3. Results of GOMO analysis of the found motifs. Sequence logos use the standard nucleotide color scheme (A, C, G, T). Letter height reflects nucleotide frequency/information content at each position; degenerate IUPAC codes (e.g., W, R, Y, S, K, M, N) indicate variability at a given position.
Applbiosci 05 00014 g003
Figure 4. Genes with identified CpG islands detected using the MethPrimer tool, where 0 represents the farthest point from the TSS (–1000 bp), and 1000 corresponds to the closest point (–1 bp relative to the TSS).
Applbiosci 05 00014 g004
Figure 5. Genes for which no CpG islands were detected by the MethPrimer tool, where 0 represents the farthest point from the TSS (–1000 bp), and 1000 corresponds to the closest point (–1 bp relative to the TSS).
Applbiosci 05 00014 g005
Table 1. Selection of genes for the study.
GeneNameFunctionCommentReferences
FSHR
ID: 2492
follicle-stimulating hormone receptorReceptor for FSH, GPCRImportant for follicle development[6,7]
PGR
ID: 5241
progesterone receptor (PR, NR3C3)Nuclear receptor for progesteroneImportant for implantation and pregnancy support; has two promoters/isoforms[14]
LHCGR
ID: 3973
luteinizing hormone/choriogonadotropin receptorReceptor for LH and hCG, GPCRActivates G-protein/adenylate cyclase, key in ovulation and testosterone production[17]
FOXL2
ID: 668
forkhead box L2Transcription factor for ovarian functionRegulator of PGR, ESR2, CYP19A1[18]
ESR1
ID: 2099
estrogen receptor 1 (ERα)Nuclear estrogen receptorRegulator of development, metabolism, and reproduction; functions as a homodimer/heterodimer with ERβ[19]
AR
ID: 367
androgen receptor (NR3C4)Nuclear receptor for testosterone/DHTRegulator of male development; localized in the nucleus, activates transcription[20]
INHA
ID: 3623
inhibin alphaInhibin α-subunit regulates FSHExpression in granulosa cells[21]
STAR
ID: 6770
steroidogenic acute regulatory proteinTransport of cholesterol into mitochondriaActivated by CREB, GATA4, SF-1[22]
AMH
ID: 268
anti-Müllerian hormoneFollicle regulatorTargeted by FOXL2 and GATA[23]
BMP15
ID: 9210
bone morphogenetic protein 15Oocyte-secreted growth factorCross-regulation with FSHR[24]
GDF9
ID: 2661
growth differentiation factor 9Similar to BMP15Helps in oocyte–granulosa communication[25]
HSD3B1
ID: 111785
3-beta-hydroxysteroid dehydrogenase 1Key enzyme in steroidogenesisRegulated by the same signaling as STAR[26]
ZP3
ID: 7784
zona pellucida glycoprotein 3Zona pellucida proteinImportant for sperm–egg interaction[27]
CYP19A1 *
ID: 1588
cytochrome P450 family 19 subfamily A member 1An enzyme that converts androgens to estrogensSubject to regulation by FSH and LH[28]
ESR2 *
ID: 2100
estrogen receptor 2 (ERβ)Nuclear estrogen receptorNuclear regulator of ovarian function, follicular maturity, and estrogen signaling; functions as a homodimer/heterodimer with ERα estrogen receptor[29]
NR5A1 * (SF-1)
ID: 2516
nuclear receptor subfamily 5 group A member 1Transcription factor for gonadal expressionRegulator of LHCGR, STAR, INHA[30]
* Initially considered genes that were excluded due to the absence of an NNPP promoter prediction with a score ≥ 0.80.
Table 2. Summary of the highest-scoring NNPP promoter prediction (Score ≥ 0.80) for each gene within the 1 kb upstream sequence window, including Start–End coordinates, score, and location relative to the analyzed promoter region.
Gene#Promoters (Score ≥ 0.80)Promoter with the Highest Prediction Score (Start–End *)ScoreLocation in Our
** 1 kb Sequence
AR1108–1581.00−892 → −842
LHCGR4641–6910.91−359 → −309
FSHR1106–1560.80−894 → −844
ESR12180–2300.83−820 → −770
PGR2 (overlap)591–6410.90−409 → −359
INHA2450–5000.86−550 → −500
STAR2826–8760.82−174 → −124
FOXL21938–9880.82−62 → −12
AMH1295–3450.92−705 → −655
BMP1522–521.00−998 → −948
GDF91202–2520.84−798 → −748
HSD3B11837–8871.00−163 → −113
ZP33948–9981.00−52 → −2
* Start–End indicate the predicted promoter/TSS interval reported by NNPP within the submitted 1 kb upstream sequence window (positions are given relative to the extracted 1 kb sequence, not genomic coordinates). **All coordinates are reported within the extracted 1 kb upstream window (−1000 to −1 bp relative to gene’s TSS).
Table 3. Results of STREME analysis.
Motif IDConsensusWidthTrain Pos CountTrain p-ValueTrain Log p-ValueE-ValueTotal Sites
STREME-1GWGGATC7105.40 × 10−5−4.268875.00 × 10010
STREME-2CGACCAGCCY1088.20 × 10−4−3.084185.00 × 1008
STREME-3TRCHAAAARTV1188.20 × 10−4−3.084185.00 × 1008
STREME-4GGAAGGCMKGM1167.50 × 10−3−2.127645.00 × 1006
STREME-5AYTAGTCAG952.00 × 10−2−1.708525.00 × 1005
Table 4. Top Tomtom matches for each motif, based on the lowest E-value observed.
Query Motif *PWM-ID (Base)SuggestedTF **Consensus of PWME-Valueq-ValueTotal MatchingSignificance ***
STREME-1
(GWGGATC)
MA0130.1Sp1GTGGAT2.081.002No significance
STREME-2 (CGACCAGCCY)MA1655.2ZBT7AGAACAGCC0.510.7111No significance
STREME-3 (TRCHAAAARTV)MA1715.1Homeobox/ZnFGTACCAGGAGTGGGG5.201.0010No significance
STREME-4 (GGAAGGCMKGM)MA0149.1GABPA (ETS)GGAAGGAAGGAAGGAAGG0.140.286No significance
STREME-5
(AYTAGTCAG)
MA0489.3CREB/ATFATGAGTCA3.181.0013No significance
MEME-2 (MRCMCCAGNNWGTK)TCF4_DBDTCF4/E-boxCGCACCTGCT2.960.879No significance
* “Query motif” refers to the de novo motif identified in this study (STREME output), which is compared against reference motif databases (JASPAR/HOCOMOCO). ** The transcription factor (TF) name is taken from the most frequently reported identifier for the corresponding PWM-ID in the JASPAR or HOCOMOCO databases. *** A match is considered statistically significant if q ≤ 0.05 (none of the identified motifs met this threshold).
Table 5. GOMO analysis of the motifs.
MotifTotal GO TermsMain p-ValueMain q-ValueMain ScoreMain Specificity (%)Most Likely Related Process
STREME-175.34 × 10−60.0130.0082767.43negative regulation of endocytosis
STREME-22292.63 × 10−40.0150.01712.57protein assembly, mitochondrial function, TGF-β signaling
STREME-391.64 × 10−70.0002180.84726.11olfactory receptor/GPCR signaling
STREME-41331.82 × 10−40.02020.018115.66growth factor signaling, ECM remodeling
STREME-5235.26 × 10−60.002860.0034719.78GPCR signaling, SERPIN inhibition
MEME-254.03 × 10−60.01650.008471.4general regulation
Table 6. Detected CpG islands in promoter regions using the MethPrimer tool.
GeneNumber of CpG Islands *Length (bp)Start/End **
ARIsland 1263−792/−593
Island 2102−211/−110
LHCGRno
FSHRno
ESR1Island 1256−625/−370
island 2214−269/−56
PGRIsland 1155−685/−531
Island 2276−463/−188
INHANo
STARNo
FOXL2Island 1619−883/−265
Island 2123−177/−55
AMHNo
BMP15No
GDF9No
HSD3B1No
ZP3No
* Within the analyzed promoter window (−1000 bp to −1 bp from TSS).** The location is presented as the distance of the CpG island from the transcription start site (TSS) of the corresponding gene, within the promoter window spanning from −1000 to −1 bp.
Disclaimer/Publisher’s Note: The statements, opinions and data contained in all publications are solely those of the individual author(s) and contributor(s) and not of MDPI and/or the editor(s). MDPI and/or the editor(s) disclaim responsibility for any injury to people or property resulting from any ideas, methods, instructions or products referred to in the content.